Abstract
Children’s development and health may be affected by toxic heavy metal exposure or suboptimal essential element intake. This study aimed to provide updated information regarding the concentrations of 41 elements in children’s hair (aged under 18) living in a rural area of the Benishangul-Gumuz region, Ethiopia. The highest average levels (as a geometric mean) for toxic heavy metals were obtained for Al (1 mg kg−1), Pb (3.1 mg kg−1), and Ni (1.2 mg kg−1), while the lowest concentrations among the essential elements were found for Co (0.32 mg kg−1), Mo (0.07 mg kg−1), Se (0.19 mg kg−1), and V (0.8 mg kg−1). Hair analysis was combined with a survey to evaluate relationships and variations among subgroups and potential metal exposure predictors. Females showed significantly higher concentrations for most hair elements, excluding Zn, than males, and the 6–11 years age group reported the highest levels for Be, Ce, Co, Fe, La, Li, Mo, and Na. The main predictors of exposure to toxic elements were fish consumption for Hg and drinking water for Ba, Be, Cs, Li, Ni, Tl, and U. The data from this study can be used to develop prevention strategies for children’s health and protection in developing countries.
1. Introduction
Elements present in the environment can come from natural (such as volcanic activity and forest fires) or anthropogenic (such as industrial, agricultural, and domestic) sources [1,2,3,4,5]. Factors that influence human exposure and, consequently, the presence of possible toxic effects are mainly dietary habits (i.e., fish, meat, cereals, vegetables, and water consumption) and outdoor and indoor air quality [6,7,8,9,10,11,12,13]. In particular, toxic heavy metals have no dietary value in humans [12,13]. More specifically, As, Hg, Pb, and Cd have been classified as the most dangerous elements affecting health [14]. As and Cd are classified as carcinogens (Group I), and Pb is ranked as a probable carcinogen (Group IIA) in humans by the International Agency for Research in Cancer (IARC) [15]. Instead, Hg, in organic [as methylmercury (MeHg)] or inorganic form, is classified by the IARC as a probable carcinogen in humans (Group IIB) or not classifiable as carcinogenic (Group III), respectively [15]. Instead, essential elements (such as Ca, Co, Cu, Fe, K, Mg, Mn, Mo, Na, P, Se, V, and Zn) are fundamental for the growth and health of children and perform several important functions in the human body, including bone formation, regulation of body fluids, and participation in the vital processes of cells [16,17]. However, these elements can also become harmful to human health if taken in excess from food or abnormal exposure [7,18,19]. Children exposed to environmental contaminants are more susceptible than adults, mainly due to their immature organs and differences in exposure [20,21]. Nutritional aspects (children eat more food and drink more water per unit of body weight than adults), rapid growth, active time spent outdoors, and specific behaviors (such as the tendency to place items in their mouths and contact with the ground) increase the risk of exposure in children [22]. In this regard, it is important to underline that exposure to low doses of trace metals can cause neurobehavioral and cognitive changes in children, even below concentrations considered safe for most people [23]. Human biomonitoring studies allow us to evaluate human exposure to elements through the measurement of chemicals in body fluids and tissues, such as blood [24,25,26,27], plasma [28,29], serum [30,31], breast milk [32,33], urine [34,35], saliva [36], lung fluids [37,38], nails [27,39], and also hair [40,41,42,43,44]. The latter has several advantages over other biological matrices. Among these, the first concerns the hair’s ability to bind various elements due to thiolic groups’ presence in their structure [45]. Elements can be accumulated in the hair at higher concentrations and for longer than other biomarker media such as urine and blood [46,47,48,49,50,51]. Hair grows at a rate of ~1 cm/month; therefore, the chronological exposure to elements can be traced from the segmental hair analysis over a defined period (at least 180 days) depending on the selected hair length [52]. The hair’s ability to sequentially accumulate chemicals in its inner structure, together with the opportunity to conduct retrospective analyses, means that hair analysis can be used for screening and confirmation purposes in various application contexts, such as forensic and clinical [53]. Another advantage when using hair compared to other biological matrices is that the sampling is painless and non-invasive and does not require experienced personnel [46,47]. Finally, the hair samples can be transported and stored at room temperature, and small specimen sizes are required for analysis [41,46,47]. Despite these advantages, hair analysis presents a few limitations, such as a lack of reference concentration ranges or difficulties in interpreting the results due to the presence of potential confounding factors like gender, age, hair color, dietary habits, living site, and lifestyle [54,55]. Hair results are a useful screening tool for exposure assessment, investigation of the development and state of nutrition, and possible pathological processes [55,56,57]. Furthermore, total Hg in hair can be used to assess exposure to MeHg because more than 80% of the total Hg analyzed in hair is present in organic form as MeHg [47,58,59].
This study aimed to assess the levels of essential and toxic heavy metals in the hair of children living in the Benishangul-Gumuz region, a Developing Regional State of North-Western Ethiopia. The influence of several factors in the variability of element concentrations in children’s hair (age, sex, body mass index, passive smoking, and eating habits) was also studied. To our knowledge, this is the first study in which essential and toxic elements are determined in the hair of Ethiopian children. We compared our results with other biomonitoring studies on children in the literature and studied the main predictors of exposure.
2. Materials and Methods
2.1. Design and Study Population
A cross-sectional study was conducted between November and December 2019 in Bameza, a rural area of the Benishangul-Gumuz region along the Blue Nile river in north-western Ethiopia (Africa) (Figure 1). Bameza is approximately 150 km from Benishangul-Gumuz’s capital, Asosa, and 500 km from Ethiopia’s capital, Addis Ababa. The study area landscape is undulating and covered by a thick savannah and forest (Supplementary Materials Figure S1). Due to a lack of communications infrastructure and transportation, the possibilities to travel within the Benishangul-Gumuz region are often scarce [60], and access to food and health services is inadequate [61]. Moreover, inadequate access to safe drinking water (mainly for microbiological quality), poor sanitation, low educational level, widespread poverty, and the highest risk of under-five mortality characterize the Benishangul-Gumuz region [62,63,64,65,66,67]. Improperly protected water collection and storage containers contribute to low drinking water quality [62].
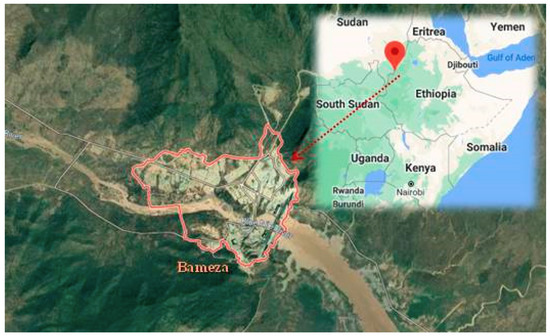
Figure 1.
Map of the studied area (Bameza in the Benishangul-Gumuz region along the Blue Nile in north-western Ethiopia, Africa).
The hair samples (n = 81) were taken from children aged under 18 (40 boys, 49.4%; 41 girls, 50.6%) whose hair had not been colored or treated. The study population’s characteristics were collected using individual anonymous questionnaires with specific information on age, gender, weight, height, passive smoking, and dietary habits (water, meat, fish, vegetables, fruit, legumes, cereals consumption). The variables studied are shown in Table 1. Food consumption frequency by food groups was converted into quantitative intakes (g month−1 or mL month−1), according to other authors [57,58,68]. Monthly intake of individual foods was estimated according to the following formula:
where FI is the food intake (g month−1 or mL month−1), W = weight (g) or V = volume (mL) of the portion size, and IFr = intake frequency (number of portions) per month.
FI = W or V × IFr

Table 1.
Characteristics of the studied population and food consumption.
This research was a non-interventional/observational study based on the definitions of the European Directive 2001/20/EC for which the approval of an Ethics Committee was not requested [69]; it was conducted according to the Helsinki Declaration (1964) and its later amendments and followed the International Code of Ethics for Occupational Health Professionals [70]. Collected information was used on aggregate health data of the children, with no possibility of individual identification. Before collecting the questionnaire information and the children’s hair samples, all parents were informed about the study’s aim and gave their consent. Children’s hair sampling was performed at least with the presence of one of the parents.
2.2. Sample Collection
To avoid external contamination, hair samples (~0.05 g; ~1 cm long) were collected from the nape using stainless steel scissors and disposable vinyl gloves, as previously described [71,72]. Then, hair samples were stored in polyethylene bags until analysis at room temperature.
We also measured elements in the following drinking water: the Blue Nile river and the Blue Nile river’s treated water. The water samples were collected at the same time as the hair samples in plastic urine collection cups, which were stored at −20 °C until analysis.
2.3. Chemical Analysis
2.3.1. Hair Samples
Forty-one elements were analyzed, including essential of Ca, Co, Cr, Cu, Fe, K, Mg, Mn, Mo, Na, P, Se, V, and Zn, and potentially toxic of Al, As, B, Ba, Be, Cd, Cs, Hg, Li, Ni, Pb, Sb, Sn, Tl, and U (see Table 1). Chemical analysis was performed in the Chemistry Laboratory of Sapienza University of Rome (Italy). Except for Hg, element concentrations in the hair were evaluated using an inductively coupled plasma mass spectrometer (ICP-MS; 820-MS Bruker, Bremen, Germany) equipped with a collision-reaction interface (CRI) and glass nebulizer (0.4 mL min−1). The data were collected according to a previously reported method [71]. Mercury was analyzed using a cold vapor generation atomic fluorescence spectrometer (CV-AFS; AFS 8220 Titan, FullTech Instruments, Rome, Italy), as described previously [72,73]. The ICP-MS analysis mode, measured isotopes, and internal standards are shown in Supplementary Materials Table S1, while the preparation of both calibration and internal standards is described in Supplementary Materials Section 1.
Hair samples were digested using an analytical procedure described previously [71,73]. Briefly, 0.02 g hair samples were transferred into polypropylene tubes, mixed with 0.5 mL 67% HNO3 (super-pure, Carlo Erba Reagents, Milan, Italy) and 0.25 mL 30% H2O2 (super-pure, Merck KGaA, Darmstadt, Germany), and heated in a water bath system (WB12, Argo Lab Modena, Italy) for 20 min at 95 °C. The digest was left to cool down, and the contents of the tubes were diluted to 10 mL with deionized water (resistivity, ≤18.3 MΩ cm), filtered (0.45 μm pore size, GVS Filter Technology, Indianapolis, IN, USA), and analyzed by ICP-MS and, after further dilution in the ratio 1:1 with 6% HCl (assay >36%; Promochem, LGC Standards GmbH, Wesel, Germany), by CV-AFS. Each sample was analyzed in duplicate. Blanks were treated as samples for the subtraction of the background signal from the reagents.
The detection limits (DLs) established for each element ranged between 0.00002 (U) and 30 (K) mg kg−1. Inter-day precision [relative standard deviation (RSD), %] calculated through different days was below 13%, trueness bias ranged between −4 and 9%, and recoveries ranged between 90 and 110% for all the elements except for Cr (65%), and Fe (79%) [71,73].
2.3.2. Water Samples
Drinking water sampling and analyses were carried out following the Italian reference analytical methods [74,75]. Briefly, a volume of 250 mL (three replicates) of both treated and untreated water of the Blue Nile river was collected using a sterile polyethylene container with a screw cap. Each sample had an indelible identification label to identify it uniquely. Sampling was carried out where households obtained their drinking water. In particular, if there were more possibilities of access to the same water source (different access points to the Blue Nile river or different taps of the same treated water), a single sampling point was considered (Supplementary Materials Figures S2 and S3). After sampling, all water samples were transported to the laboratory using thermal bags and then filtered, acidified to 2% (v/v) HNO3 (pH < 2), and stored at a temperature in the range 1–10 °C up to instrumental analysis. All water analyses were completed within one week after fieldwork. The water samples were analyzed diluted in a 1:10 and 1:100 ratio with 2% (v/v) HNO3 and without dilution. Blanks and calibration standards were also made in 2% (v/v) HNO3. Internal standards (45Sc, 89Y, 103Rh, 115In, 232Th) were added to all samples, blanks, and calibration standards for ICP-MS analysis. To verify the accuracy, certified reference material (SRM 1643e trace elements in water; National Institute of Standards and Technology, NIST; Gaithersburg) was analyzed. The percent relative standard deviation for the repeatability did not exceed the 10% limit, and trueness bias percentages in the range −5 to 10% for all the studied elements were found.
2.4. Statistical Analysis
The statistical analysis was performed using SPSS version 25.0 for Windows (SPSS Inc., Chicago, IL, USA). Levels below DL were replaced by DL/2 [76]. Elements with a concentration <DL in more than 20% of the samples were excluded from the statistical calculation.
The most important descriptors such as arithmetic (AM) and geometric mean (GM), minimum and maximum levels, and the 25th, 50th, 75th, and 95th percentile were calculated to perform the descriptive statistical analysis.
The Shapiro–Wilk test and the Levene test were used to evaluate the normality and equal variances hypotheses, respectively [77]. All element concentrations were not normally distributed, so non-parametric methods such as the Mann–Whitney test and the Kruskal–Wallis test were used to compare element levels according to variable categories [78].
The relationship between the hair elements’ concentrations and the factors considered was studied using the Spearman correlation test. For a value of p ≤ 0.05, a statistically significant relationship was considered.
A multiple linear regression model (backward method) was used to evaluate the influence of the study factors (gender, age, BMI, passive smoking, and water, meat, fish, fruit and vegetables, and cereals consumption) on the level of elements in children’s hair. In each model, the natural log-element concentration was included as a dependent variable. The p value used as a criterion for the entry and stay of the variables was 0.05 and 0.1, respectively. The 95% confidence intervals were calculated for the model coefficients to evaluate the sample’s statistical estimates [79,80]. The effect of potential outliers was checked using residual graphs.
3. Results and Discussion
3.1. Element Levels in Children’s Hair
Descriptive statistics of element levels are given in Table 2.
Table 2.
Element levels (mg kg−1) in the hair of children living in the Benishangul-Gumuz region in Ethiopia (n = 81).
Elements with concentrations lower than the DL in more than 20% of the hair samples were excluded from the statistical analysis [Al (40.7%), As (35.8%), B (79.0%), Bi (44.4%), Nb (65.4%), Si (23.5%), Te (66.7%), and W (86.4%)]. The highest concentrations were found for the essential elements with Ca, Fe, K, Mg, and Na having a GM higher than 100 mg kg−1, followed by P and Zn, which exhibited values of 98 and 86 mg kg−1, respectively. Average concentrations (as GM) above 1 mg kg−1 were found, in order of abundance, for Si > Mn > Sr > Ti > Cu > Ba > Pb > Rb > B, and Ni, while element concentrations ≤ 1 mg kg−1 were detected for all other elements with decreasing contents in the following order: Ce > V > Cr > La > Zr > Co > Sn > Li > Se > Cd > Ga > Sb > Mo > Hg > As > U > Cs > Be > Tl > Te > Bi > Nb > W.
The possible exposure sources to the toxic elements analyzed may be several, such as contaminated food, water, and soil pollution, especially by the abuse or misuse of chemicals in agriculture, indoor and outdoor air pollution from inefficient solid fuel combustion (wood, animal dung, charcoal, crop wastes, and coal) and burning of waste, residues of manufacturing industrial products, mining, and oil refining [81,82,83]. As, Cd, Hg, and Pb are known to be of health concern in Africa, including in Ethiopia [81]. Figure 2, Figure 3, Figure 4 and Figure 5 show a comparison of the mean levels found in this study for the priority and most toxic trace elements (As, Cd, Hg, and Pb, respectively) with those of other biomonitoring studies in children.
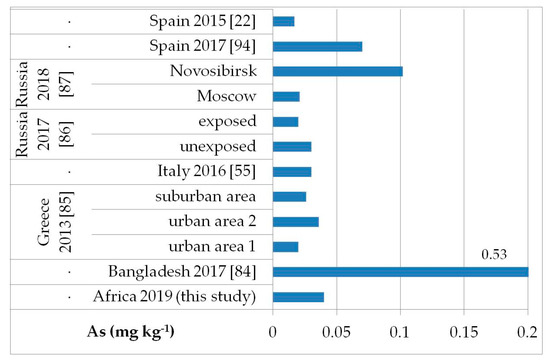
Figure 2.
Comparison of the As concentrations in children’s hair (as geometric mean; mg kg−1) found in our study and other biomonitoring studies.
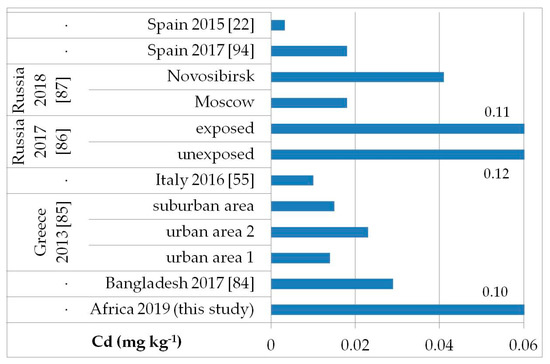
Figure 3.
Comparison of the Cd concentrations in children’s hair (as geometric mean; mg kg−1) found in our study and other biomonitoring studies.
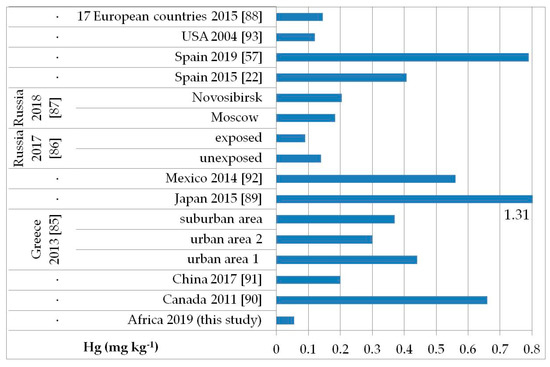
Figure 4.
Comparison of the Hg concentrations in children’s hair (as geometric mean; mg kg−1) found in our study and other biomonitoring studies.
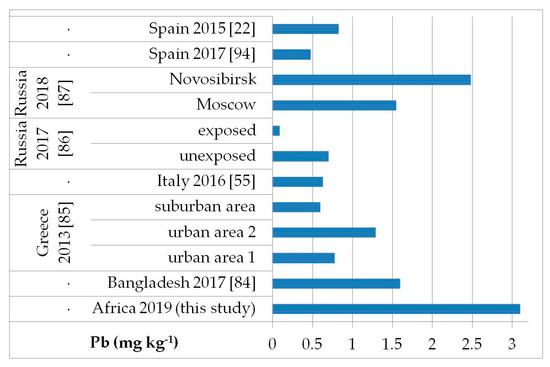
Figure 5.
Comparison of the Pb concentrations in children’s hair (as geometric mean; mg kg−1) found in our study and other biomonitoring studies.
Regarding As (Figure 2), the average level (GM: 0.04 mg kg−1) was similar or lower than those reported in other populations of Bangladesh [median (5–95th percentile): 0.53 (0.14–2.9) mg kg−1] [84], Greece (GM: 0.020–0.036 mg kg−1) [85], Russia in Moscow [median (25–75th percentile): 0.021] [86], and in both exposed and unexposed populations (median: 0.02 and 0.03 mg kg−1, respectively) [87]. Water, food, air, and soil can be possible exposure sources to As from both natural geochemical processes (erosion) or anthropogenic pollution (arsenical insecticides, improper waste and sewage disposal, combustion of fossil fuels) [81]. For Cd (Figure 3), higher levels were obtained (GM: 0.1 mg kg−1) compared with data reported in children from all the reported studies, excluding those from Russia, in both exposed and unexposed populations (median: 0.11–0.12 mg kg−1) [87]. Exposure to Hg can occur mainly by the ingestion of contaminated fish (organic Hg, such as methylmercury) and small-scale artisanal gold mining (elemental Hg) [81]. Furthermore, gold extraction is routinely carried out near water sources, contaminating the environment and drinking water. The overall Hg concentrations ranged from 0.012 to 0.483 mg kg−1 with a GM of 0.056 mg kg−1, which were the lowest compared with all data reported by other authors (Figure 4) [22,57,85,86,87,88,89,90,91,92,93]. All the Hg hair data were also below the health-based values proposed (0.58, 1.0, and 2.3 mg kg−1) [59]. However, the Pb levels (GM: 3.1 mg kg−1; Figure 5) were the highest compared with all data reported in other studies [22,55,84,85,86,87,94]. Hair can be used as a suitable biomarker of Pb exposure [95,96]. The reduction or removal of Pb from gasoline has produced a significant decline in pediatric morbidity. Llorente Ballesteros et al. [94] highlighted that the Pb content reduction in petrol was seen in environmental levels and, therefore, in human hair. However, children and adults continue to be exposed to Pb in Africa [81]. Here, most of the Pb in the environment comes from human activities such as waste combustion, mining, indiscriminate dumping, and even the use of Pb-based paints [81].
Some essential element average levels (Ca, Co, Cu, Mg, Mo, P, Se, V, and Zn) found in our study fell within the range of values usually reported for other children populations in Spain [94], Italy [55,97], and Russia [87]. However, the GM of children’s hair Fe (243 mg kg−1), Mn (27 mg kg−1), and Na (1780 mg kg−1) obtained in our study was around one order of magnitude higher than that found in other studies worldwide [55,87,94,97].
3.2. Factor and Correlation Analysis
The population characteristics are shown in Table 1. A total number of 81 children’s hair samples were collected, with a similar proportion of boys (51.1%) and girls (48.9%). Overall, 40.8% of children were aged 6–11 years and 29.6% were both <5 and 12–18-year-old. Of all children, 87.7% were underweight (BMI < 18.5).
3.2.1. Gender and Age
The data obtained (Table 3, Supplementary Materials Table S2–S4, and Figure 6) show that both gender and age affect the levels of toxic elements in children.
Table 3.
Gender influence on element levels (mg kg−1) in children’s hair.
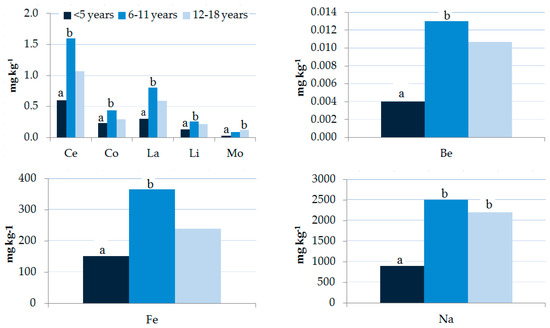
Figure 6.
Influence of age on element levels (geometric mean, mg kg−1) in children’s hair samples. A non-parametric Kruskal–Wallis test was applied. Different letters “a” and “b” for the same element show significant differences (p < 0.05).
Gender-related differences were found for all elements excluding Ba, Ca, Cr, Cu, Hg, Sb, and Se, with higher concentrations found especially in females (Table 3). Element concentrations in the hair of females and males were particularly different for Be (five times higher in females than males) and for Cd, Ce, Co, Cs, Fe, Ga, K, La, V, and Zr (three times higher in females than in males). Only Zn was higher in male children than females. The current literature also reports gender-related hair element concentration differences [22,55,94,98,99,100,101,102]. However, gender is often not adequately considered in the interpretation of hair analysis results [55]. Various factors (such as bodily growth, physiology, sexual hormones, and lifestyle) can affect boys’ and girls’ responses to exposure to chemicals in different ways [103]. Due to differences in kinetics, mode of action, or susceptibility, some toxic trace elements may affect the health of males and females differently [55]. In accordance with other authors [101,104], our results indicate that females may be exposed to toxic metals more than males. The results presented by Sanna et al. [96] suggest that hair is a reliable biomarker for determining population exposure levels to Pb pollution, and they indicate, in agreement with our study, that females tend to accumulate Pb in the hair more than males. The higher concentration of Sr and U in hair samples from females was also reported by other authors [101,105,106]. The high Sr, Pb, and U content in female hair can be considered a common gender characteristic due to the bone’s possible release during the growth period, which generally occurs earlier and faster than in boys [101,107,108].
In the puberty period, adolescents need a high amount of Zn to maintain their skeletal growth, and this demand is generally more prevalent in girls [109]. Our results are in agreement with a previous study by De Prisco et al. [110] that showed a higher Zn content in boys’ hair (244 ± 153 mg kg−1) than in that of girls (189 ± 34 mg kg−1). However, our data contrast with the results of several studies [50,55,85,96,97,111,112,113,114] that found that female hair contains more Zn than males. The lower content of Zn in female hair compared to male hair may be related to the higher presence of Cd in females. Cd can replace Zn in many metal-enzymes, and Zn deficiency may also be a symptom of Cd toxicity [81]. Human exposure to Cd in Africa is thought to be mainly due to tobacco smoking and the consumption of contaminated vegetables and crops [81]. High levels of Cd contamination were reported in lettuce grown by irrigation using water from the Akaki River in Ethiopia [115].
In accordance with other authors [55,85,102,116], also Ni, considered a carcinogen [117] and responsible for the most common type of allergy [16], was found in higher concentrations in the hair of females than males. However, our results are in contrast with the data obtained by Barbieri et al. [113] and Peña-Fernández et al. [50], who showed that the hair of males contained more Ni than females (females = 0.23 ± 4.89 mg kg−1 vs. males = 0.3 ± 6.5 mg kg−1; and females = 0.38 ± 0.34 mg kg−1 vs. males = 0.58 ± 0.34 mg kg−1, respectively).
The age distribution of the elements is shown in Supplementary Materials Table S2 and Figure 6. Concentrations of most elements (Be, Ce, Co, Fe, La, Li, Mo, and Na) in the 6–11 years age group were the highest and were significantly higher than those in the <5 years group. Element concentrations are reported according to gender and age group in Supplementary Materials Tables S3 and S4. Results showed significant differences in the hair of males with Be, Ce, Fe, La, and Ti levels in the age group of 6–11 years and Be, Mo, and U levels in the age group 12–18 years higher than those in the age group <5 years. A significant difference was observed for females with Na and Sb levels in the age group <5 years lower than those in the age group 6–11 and 12–18 years, and the age group 6–11 years, respectively.
The increase in the element concentrations in children’s hair during the first years of childhood could be due to this group’s physiological characteristics. Children drink more water, eat more food, and breathe more air per unit weight than adults and have higher absorption rates [94]. These findings are also in accordance with the study by Kordas et al. [118], who demonstrated that older age in children is associated with a lower risk of element exposure. A decrease in hair element content with age may be due to increased excretion of chemicals for organ development and maturation [86,119].
3.2.2. Passive Smoking
The hair of children with non-smoking parents contained higher Cu concentrations than that with smoking parents (cigarettes number ranging from 5 to 20), as shown in Supplementary Materials Table S5. Environmental tobacco smoke also appears to affect K and Na content, but not significantly. Other authors have observed higher levels of essential elements in the hair of non-smokers than in smokers [120,121]. This topic is very interesting and, in the future, it should be studied in-depth, perhaps considering a greater number of samples.
3.2.3. Other Characteristics and Dietary Habits of the Study Population
Table 4 shows the element levels in the analyzed drinking water. Both the Blue Nile river’s treated and untreated water show a low content of major and trace elements. However, the concentrations of many elements (Ba, Be, Ca, Ce, Co, Cr, Cs, Fe, Ga, Hg, K, La, Li, Mg, Mn, Mo, Na, Ni, P, Rb, Sr, Ti, Tl, U, V, and Zr) in the hair of children who drink water from the Blue Nile river are significantly higher. These results require more in-depth analysis and highlight the need for monitoring the water quality of the Blue Nile river with periodic sampling.
Table 4.
Element concentrations in drinking water (μg L−1) and in children’s hair (mg kg−1) according to water consumption.
The relation between independent variables (height, weight, BMI, and food consumption) and quantitative dependent variables (element concentrations) was also studied (Table 5). Considering the sociodemographic characteristics, a significant strong positive relationship (p < 0.01) with height, weight, and BMI was found in Cu [Spearman coefficient (r): 0.300, 0.327, and 0.397, respectively] and only with BMI in Sn (r: 0.315).
Table 5.
Correlations between the levels of the elements in the hair and the characteristics of children.
A strong negative correlation was found between BMI and the following elements: Ca, Fe, Ga, P, Ti, and V. We analyzed the relationship between element levels and food group consumption, and we found a significant positive correlation (p < 0.01) between Ba and Hg levels and fish consumption (r: 0.320, and 0.427, respectively), and between Na content and cereals consumption (r: 0.470). A significant strong negative relationship (p < 0.01) with fish consumption was found in Zn (r: −0.342). No significant correlation with meat consumption was shown for all elements. It is known that fish is the major source of exposure to organic Hg [122]. The correlation between exposure to Hg and fish consumption is widely reported in the literature [57,58,59] and confirmed in the present study. Consistent with the results of the Spearman correlation test previously discussed, the children who consumed fish showed significant higher levels of Hg (GM = 0.078 mg kg−1, p < 0.001) and Ba (GM = 14 mg kg−1, p < 0.01) and lower content of Zn (GM = 76 mg kg−1, p < 0.01) than the other children (GM = 0.034, 7, and 105 mg kg−1 for Hg, Ba, and Zn, respectively) (Supplementary Materials Table S6).
3.3. Predictors of Exposure
A multiple linear regression analysis was used to study the predictors of children’s exposure to both toxic and essential trace elements (Table 6 and Supplementary Materials Table S7).
Table 6.
Results of the backward multiple linear regression model analysis for some toxic elements.
Gender, age, BMI, passive smoking, drinking water, fish consumption, and fruit and vegetable consumption were significant predictors of exposure to several study population elements. The main predictor of Hg exposure in children’s hair was fish consumption (Table 6). The potential effect of age on Hg exposure is disputed, as several studies showed an increase in hair Hg with age [58,93,123,124], while many others did not observe any influence [125]. Consistent with the results of the Kruskal–Wallis test (Supplementary Materials Tables S2 and S3, and Figure 6), age is also a significant predictor of Mo and Na.
Drinking water appears to be the major exposure predictor of some toxic elements such as Ba, Be, Cs, Li, Ni, Tl, and U (Table 6) and essential and trace elements Ca, Ce, Co, Cr, Fe, Ga, La, Mg, Mn, Mo, P, Rb, Sr, Ti, V, and Zr (Supplementary Materials Table S7). Additional food and environmental monitoring are needed to determine the different exposure sources among children, causing differences in hair elements’ concentrations. The data currently available on the elements found in drinking water do not justify these differences. According to the results of the Mann–Whitney analysis discussed above, gender is a significant predictor of Be, Cd, Li, and U levels (Table 6) and Ca, Ce, Co, Fe, Ga, K, La, Mn, Mo, NA, P, Rb, Sr, Ti, V, Zn, and Zr (Supplementary Materials Table S7).
3.4. Study Limitations
This study has some limitations. First of all, the group’s size was small (81 children), and the present study is a cross-sectional study; therefore, it does not allow an evaluation over time.
4. Conclusions
Children represent a population that is particularly vulnerable to the developmental and neurotoxic effects of toxic elements and should be given special attention in biomonitoring programs.
We want to highlight the highest Pb concentrations in the hair of Ethiopian children studied compared to other literature data. A more in-depth study of this relevant finding is needed, combining different types of environmental monitoring and more extensive biomonitoring programs. The data obtained confirm gender and age as important key factors that must be taken into account in interpreting the hair analysis. The gender-based variations suggest that females are likely at greater risk for toxic element exposure than males. Dietary habits affect the elemental composition of hair in children. In particular, the hair of children who consumed fish and drank Blue Nile water contained higher Hg levels and other toxic elements (Ba, Be, Cs, Hg, Li, Ni, Tl, and U), respectively.
Supplementary Materials
The following are available online at https://www.mdpi.com/1660-4601/17/22/8652/s1, Table S1: Isotopes, analysis mode, and internal standards, Table S2. Element concentrations in children’s hair by age group, Table S3: Element levels (mg kg−1) in male hair according to age, Table S4. Element levels (mg kg−1) in male hair according to age, Table S5: Element levels (mg kg−1) in children’s hair according to passive smoking, Table S6: Influence of fish consumption on element levels (mg kg−1) in children’s hair, Table S7: Results of the backward multiple linear regression model analysis for major and trace elements, Figure S1: Landscapes of the studied area (Bameza in the Benishangul-Gumuz region along the Blue Nile in north-western Ethiopia, Africa), Figure S2: Sampling site of the Blue Nile river water (Bameza, Ethiopia), Figure S3: Sampling site of the treated water of the Blue Nile river (Bameza, Ethiopia).
Author Contributions
Conceptualization, M.L.A. and G.P.; Data curation, M.L.A.; Formal analysis, M.L.A.; Investigation, E.M.; Resources, G.P., C.M. and S.C.; Supervision, M.L.A.; Validation, M.L.A.; Visualization, M.L.A. and E.M.; Writing—original draft, M.L.A.; Writing—review and editing, M.L.A., G.P. and S.C. All authors have read and agreed to the published version of the manuscript.
Funding
This research received no external funding.
Acknowledgments
The authors would like to thank all the participating children and their parents. The authors wish also to thank Federica Astolfi and Giulia Vitiello for their kind support in collecting the questionnaire data.
Conflicts of Interest
The authors declare no conflict of interest.
References
- Massimi, L.; Ristorini, M.; Astolfi, M.L.; Perrino, C.; Canepari, S. High resolution spatial mapping of element concentrations in PM10: A powerful tool for localization of emission sources. Atmos. Res. 2020, 244, 105060. [Google Scholar] [CrossRef]
- Canepari, S.; Castellano, P.; Astolfi, M.L.; Materazzi, S.; Ferrante, R.; Fiorini, D.; Curini, R. Release of particles, organic compounds, and metals from crumb rubber used in synthetic turf under chemical and physical stress. Environ. Sci. Pollut. Res. 2018, 25, 1448–1459. [Google Scholar] [CrossRef]
- Marconi, E.; Canepari, S.; Astolfi, M.L.; Perrino, C. Determination of Sb (III), Sb (V) and identification of Sb-containing nanoparticles in airborne particulate matter. Procedia Environ. Sci. 2011, 4, 209–217. [Google Scholar] [CrossRef]
- Astolfi, M.L.; Marconi, E.; Lorini, L.; Valentino, F.; Silva, F.; Ferreira, B.S.; Canepari, S.; Majone, M. Elemental concentration and migratability in bioplastics derived from organic waste. Chemosphere 2020, 259, 127472. [Google Scholar] [CrossRef]
- Lai, A.; Astolfi, M.L.; Bertelli, V.; Agostinelli, V.G.; Zeppilli, M.; Majone, M. Chromate fate and effect in bioelectrochemical systems for remediation of chlorinated solvents. New Biotechnol. 2021, 60, 27–35. [Google Scholar] [CrossRef]
- U.S. Environmental Protection Agency. Risk Assessment Guidance for Superfund Volume I Human Health Evaluation Manual (Part A); Office of Emergency and Remedial Response, U.S. Environmental Protection Agency: Washington, DC, USA, 1989.
- World Health Organization. Trace Elements in Human Nutrition and Health; WHO: Geneva, Switzerland, 1996; Available online: https://www.who.int/nutrition/publications/micronutrients/9241561734/en (accessed on 27 August 2020).
- Islam, M.S.; Ahmed, M.K.; Al-Mamun, M.H.; Raknuzzaman, M.; Ali, M.M.; Eaton, D.W. Health risk assessment due to heavy metal exposure from commonly consumed fish and vegetables. Environ. Syst. Decis. 2016, 36, 253–265. [Google Scholar] [CrossRef]
- López-Alonso, M.; Miranda, M.; Benedito, J.L.; Pereira, V.; García-Vaquero, M. Essential and toxic trace element concentrations in different commercial veal cuts in Spain. Meat Sci. 2016, 121, 47–52. [Google Scholar] [CrossRef]
- Manigrasso, M.; Protano, C.; Astolfi, M.L.; Massimi, L.; Avino, P.; Vitali, M.; Canepari, S. Evidences of copper nanoparticle exposure in indoor environments: Long-term assessment, high-resolution field emission scanning electron microscopy evaluation, in silico respiratory dosimetry study and possible health implications. Sci. Total Environ. 2019, 653, 1192–1203. [Google Scholar] [CrossRef] [PubMed]
- Astolfi, M.L.; Canepari, S.; Catrambone, M.; Perrino, C.; Pietrodangelo, A. Improved characterisation of inorganic components in airborne particulate matter. Environ. Chem. Lett. 2006, 3, 186–191. [Google Scholar] [CrossRef]
- Sharifan, H.; Ma, X.; Moore, J.M.; Habib, M.R.; Evans, C. Zinc oxide nanoparticles alleviated the bioavailability of cadmium and lead and changed the uptake of iron in hydroponically grown lettuce (Lactuca sativa L. var. Longifolia). ACS Sustain. Chem. Eng. 2019, 7, 16401–16409. [Google Scholar] [CrossRef]
- Sharifan, H.; Moore, J.; Ma, X. Zinc oxide (ZnO) nanoparticles elevated iron and copper contents and mitigated the bioavailability of lead and cadmium in different leafy greens. Ecotoxicol. Environ. Saf. 2020, 191, 110177. [Google Scholar] [CrossRef] [PubMed]
- ATSDR. Agency for Toxic Substances and Disease Registry. The Priority List of Hazardous Substances; U.S. Department of Health and Human Services, Public Health Service: Atlanta, GA, USA, 2015; Available online: http://www.atsdr.cdc.gov/spl/ (accessed on 24 August 2020).
- IARC, International Agency for Research on Cancer. Classified by the IARC Monographs; IARC: Lyon, France, 2016. [Google Scholar]
- Lindh, U. Essentials of medical geology impacts of the natural environment on public health. In Biological Functions of the Elements; Selinus, O., Alloway, B., Centeno, R.B., Finkelman, R., Fuge, R., Lindh, U., Smedley, P., Eds.; Elsevier Academic Press: New York, NY, USA, 2005; pp. 115–160. [Google Scholar]
- Combs, G.F., Jr.; Lindh, U.; Smedley, P. Geological impacts on nutrition. In Essentials of Medical Geology Impacts of the Natural Environment on Public Health; Selinus, O., Alloway, B., Centeno, R.B., Finkelman, R., Fuge, R., Eds.; Elsevier Academic Press: New York, NY, USA, 2005; pp. 161–177. [Google Scholar]
- Aggett, P.; Nordberg, G.F.; Nordberg, M. Essential metals: Assessing risks from deficiency and toxicity. In Handbook on the Toxicology of Metals, 4th ed.; Nordberg, G.F., Fowler, B.A., Nordberg, M., Eds.; Elsevier Academic Press: New York, NY, USA, 2015; pp. 281–297. [Google Scholar] [CrossRef]
- Nordberg, M.; Nordberg, G.F. Trace element research-historical and future aspects. J. Trace Elem. Med. Biol. 2016, 38, 46–52. [Google Scholar] [CrossRef] [PubMed]
- Landrigan, P.J.; Kimmel, C.A.; Correa, A.; Eskenazi, B. Children’s health and the environment: Public health issues and challenges for risk assessment. Environ. Health Perspect. 2004, 112, 257–265. [Google Scholar] [CrossRef] [PubMed]
- Selevan, S.G.; Kimmel, C.A.; Mendola, P. Windows of susceptibility to environmental exposures in children. In Children’s Health and the Environment—A Global Perspective; Pronczuk-Garbino, J., Ed.; World Health Organization Press: Geneva, Switzerland, 2005; pp. 17–26. [Google Scholar]
- Molina-Villalba, I.; Lacasaña, M.; Rodríguez-Barranco, M.; Hernández, A.F.; Gonzalez-Alzaga, B.; Aguilar-Garduño, C.; Gil, F. Biomonitoring of arsenic, cadmium, lead, manganese and mercury in urine and hair of children living near mining and industrial areas. Chemosphere 2015, 124, 83–91. [Google Scholar] [CrossRef] [PubMed]
- Callan, A.C.; Winters, M.; Barton, C.; Boyce, M.; Hinwood, A.L. Children’s exposure to metals: A community-initiated study. Arch. Environ. Contam. Toxicol. 2012, 62, 714–722. [Google Scholar] [CrossRef] [PubMed][Green Version]
- Sanna, E.; De Micco, A.; Vallascas, E. Evaluation of association between biomarkers of lead exposure in Sardinian children (Italy). Biol. Trace Elem. Res. 2011, 143, 1383–1392. [Google Scholar] [CrossRef] [PubMed]
- Liu, J.; Yuan, E.; Zhang, Z.; Jia, L.; Yin, Z.; Meng, X.; Du, H. Age- and gender-specific reference intervals for blood copper, zinc, calcium, magnesium, iron, lead, and cadmium in infants and children. Clin. Biochem. 2012, 45, 416–419. [Google Scholar] [CrossRef]
- Richmond-Bryant, J.; Meng, Q.; Davis, J.A.; Cohen, J.; Svendsgaard, D.; Brown, J.S.; Tuttle, L.; Hubbard, H.; Rice, J.; Kirrane, E.; et al. A multi-level model of blood lead as a function of air lead. Sci. Total Environ. 2013, 461, 207–213. [Google Scholar] [CrossRef]
- Coelho, P.; Costa, S.; Costa, C.; Silva, S.; Walter, A.; Ranville, J.; Pastorinho, M.R.; Harrington, C.; Taylor, A.; Dall’Armi, V.; et al. Biomonitoring of several toxic metal(loid)s in different biological matrices from environmentally and occupationally exposed populations from Panasqueira mine area, Portugal. Environ. Geochem. Health 2014, 36, 225–269. [Google Scholar] [CrossRef]
- Knerr, I.; Blessing, H.; Seyferth, S.; Watling, R.J.; Chaudhri, M.A. Evaluation of plasma trace element and mineral status in children and adolescents with phenylketonuria using data from inductively-coupled-plasma atomic emission and mass spectrometric analysis. Ann. Nutr. Metab. 2013, 10, 168–173. [Google Scholar] [CrossRef][Green Version]
- Ettinger, A.S.; Roy, A.; Amarasiriwardena, C.J.; Smith, D.; Lupoli, N.; Mercado-García, A.; Lamadrid-Figueroa, H.; Tellez-Rojo, M.M.; Hu, H.; Hernández-Avila, M. Maternal blood, plasma, and breast milk lead: Lactational transfer and contribution to infant exposure. Environ. Health Perspect. 2014, 122, 87–92. [Google Scholar] [CrossRef] [PubMed]
- Di Dato, C.; Gianfrilli, D.; Greco, E.; Astolfi, M.L.; Canepari, S.; Lenzi, A.; Isidori, A.M.; Giannetta, E. Profiling of selenium absorption and accumulation in healthy subjects after prolonged l-selenomethionine supplementation. J. Endocrinol. Investig. 2017, 40, 1183–1190. [Google Scholar] [CrossRef] [PubMed]
- Klimenko, L.L.; Skalny, A.V.; Turna, A.A.; Tinkov, A.A.; Budanova, M.N.; Baskakov, I.S.; Savostina, M.S.; Mazilina, A.N.; Deev, A.I.; Nikonorov, A.A. Serum trace element profiles, prolactin, and cortisol in transient ischemic attack patients. Biol. Trace Elem. Res. 2016, 172, 93–100. [Google Scholar] [CrossRef] [PubMed]
- Astolfi, M.L.; Protano, C.; Schiavi, E.; Marconi, E.; Capobianco, D.; Massimi, L.; Ristorini, M.; Baldassarre, M.E.; Laforgia, N.; Vitali, M.; et al. A prophylactic multi-strain probiotic treatment to reduce the absorption of toxic elements: In-vitro study and biomonitoring of breast milk and infant stools. Environ. Int. 2019, 130, 104818. [Google Scholar] [CrossRef]
- Björklund, K.L.; Vahter, M.; Palm, B.; Grandér, M.; Lignell, S.; Berglund, M. Metals and trace element concentrations in breast milk of first time healthy mothers: A biological monitoring study. Environ. Health 2012, 11, 92. [Google Scholar] [CrossRef]
- Protano, C.; Canepari, S.; Astolfi, M.L.; De Meo, S.D.O.; Vitali, M. Urinary reference ranges and exposure profile for lithium among an Italian paediatric population. Sci. Total Environ. 2018, 619, 58–64. [Google Scholar] [CrossRef]
- Protano, C.; Astolfi, M.L.; Canepari, S.; Andreoli, R.; Mutti, A.; Valeriani, F.; Romano Spica, V.; Antonucci, A.; Mattei, V.; Martellucci, S.; et al. Exposure to individual and multiple carcinogenic metals during paediatric age: An experience from an Italian urban scenario. Ann. Ig. 2017, 29, 494–503. [Google Scholar] [CrossRef]
- Gil, F. Biomonitorization of cadmium, chromium, manganese, nickel and lead in whole blood, urine, axillary hair and saliva in an occupationally exposed population. Sci. Total Environ. 2011, 409, 1172–1180. [Google Scholar] [CrossRef]
- Censi, P.; Tamburo, E.; Speziale, S.; Zuddas, P.; Randazzo, L.A.; Punturo, R.; Cuttitta, A.; Aricò, P. Yttrium and lanthanides in human lung fluids, probing the exposure to atmospheric fallout. J. Hazard. Mater. 2011, 186, 1103–1110. [Google Scholar] [CrossRef]
- Censi, P.; Zuddas, P.; Randazzo, L.A.; Tamburo, E.; Speziale, S.; Cuttitta, A.; Punturo, R.; Aricò, P.; Santagata, R. Source and nature of inhaled atmospheric dust from trace element analyses of human bronchial fluids. Environ. Sci. Technol. 2011, 45, 6262–6267. [Google Scholar] [CrossRef]
- Carneiro, M.F.H.; Bianchini Moresco, M.; Chagas, G.R.; de Oliveira Souza, V.C.; Rhoden, C.R.; Barbosa, F., Jr. Assessment of trace elements in scalp hair of a young urban population in Brazil. Biol. Trace Elem. Res. 2011, 143, 815–824. [Google Scholar] [CrossRef] [PubMed]
- Wołowiec, P.; Michalak, I.; Chojnacka, K.; Mikulewicz, M. Hair analysis in health assessment. Clin. Chim. Acta 2013, 419, 139–171. [Google Scholar] [CrossRef] [PubMed]
- Pozebon, D.; Scheffler, G.L.; Dressler, V.L. Elemental hair analysis: A review of procedures and applications. Anal. Chim. Acta 2017, 992, 1–23. [Google Scholar] [CrossRef] [PubMed]
- Grabeklis, A.R.; Skalny, A.V.; Skalnaya, A.A.; Zhegalova, I.V.; Notova, S.V.; Mazaletskaya, A.L.; Skalnaya, M.G.; Tinkov, A.A. Hair mineral and trace element content in children with down’s syndrome. Biol. Trace Elem. Res. 2019, 188, 230–238. [Google Scholar] [CrossRef] [PubMed]
- Tinkov, A.A.; Skalnaya, M.G.; Simashkova, N.V.; Klyushnik, T.P.; Skalnaya, A.A.; Bjørklund, G.; Notova, S.V.; Kiyaeva, E.V.; Skalny, A.V. Association between catatonia and levels of hair and serum trace elements and minerals in autism spectrum disorder. Biomed. Pharmacother. 2019, 109, 174–180. [Google Scholar] [CrossRef]
- Protano, C.; Astolfi, M.L.; Marconi, E.; Antonucci, A.; Canepari, S.; Piamonti, D.; Brunori, M.; Vitali, M. Occupational Exposure Assessment of Major and Trace Elements in Human Scalp Hair Among a Group of Eritrean Workers. Biol. Trace Elem. Res. 2019, 197, 89–100. [Google Scholar] [CrossRef]
- Burger, J. Heavy metals in the hair of opossum from Palo Verde Costa Rica. Arch. Environ. Contam. Toxicol. 1994, 27, 472–476. [Google Scholar] [CrossRef]
- ATSDR. Agency for Toxic Substances and Disease Registry. Hair Analysis Panel Discussion: Exploring the State of the Science; June 12–13. Summary Report; Agency for Toxic Substances and Disease Registry, Division of Health Assessment and Consultation and Division of Health Education and Promotion: Atlanta, GA, USA, 2001. [Google Scholar]
- Esteban, M.; Castaño, A. Non-invasive matrices in human biomonitoring: A review. Environ. Int. 2009, 35, 438–449. [Google Scholar] [CrossRef]
- Olmedo, P.; Pla, A.; Hernández, A.F.; López-Guarnido, O.; Rodrigo, L.; Gil, F. Validation of a method to quantify chromium, cadmium, manganese, nickel and lead in human whole blood, urine, saliva and hair samples by electrothermal atomic absorption spectrometry. Anal. Chim. Acta 2010, 659, 60–67. [Google Scholar] [CrossRef]
- Afridi, H.I.; Kazi, T.G.; Brabazon, D.; Naher, S. Association between essential trace and toxic elements in scalp hair samples of smokers rheumatoid arthritis subjects. Sci. Total Environ. 2011, 412, 93–100. [Google Scholar] [CrossRef]
- Peña-Fernández, A.; González-Muñoz, M.J.; Lobo-Bedmar, M.C. “Reference values” of trace elements in the hair of a sample group of Spanish children (aged 6–9 years)—Are urban topsoils a source of contamination? Environ. Toxicol. Pharmacol. 2014, 38, 141–152. [Google Scholar] [CrossRef] [PubMed]
- Varrica, D.; Tamburo, E.; Dongarrà, G.; Sposito, F. Trace elements in scalp hair of children chronically exposed to volcanic activity (Mt. Etna, Italy). Sci. Total Environ. 2014, 470, 117–126. [Google Scholar] [CrossRef] [PubMed]
- D’Urso, F.; Salomone, A.; Seganti, F.; Vincenti, M. Identification of exposure to toxic metals by means of segmental hair analysis: A case report of alleged chromium intoxication. Forensic Toxicol. 2017, 35, 195–200. [Google Scholar] [CrossRef]
- Kintz, P.; Salomone, A.; Vincenti, M. Hair Analysis in Clinical and Forensic Toxicology; Academic Press/Elsevier: London, UK, 2015. [Google Scholar]
- Szynkowska, M.I.; Marcinek, M.; Pawlaczyk, A.; Albińska, J. Human hair analysis in relation to similar environmental and occupational exposure. Environ. Toxicol. Pharmacol. 2015, 40, 402–408. [Google Scholar] [CrossRef]
- Tamburo, E.; Varrica, D.; Dongarrà, G. Gender as a key factor in trace metal and metalloid content of human scalp hair. A multi-site study. Sci. Total Environ. 2016, 573, 996–1002. [Google Scholar] [CrossRef]
- Pan, Y.; Li, H. Trace elements in scalp hair from potentially exposed individuals in the vicinity of the Bayan Obo mine in Baotou, China. Environ. Toxicol. Pharmacol. 2015, 40, 678–685. [Google Scholar] [CrossRef]
- Pérez, R.; Suelves, T.; Molina, Y.; Corpas-Burgos, F.; Yusà, V. Biomonitoring of mercury in hair of children living in the Valencian Region (Spain). Exposure and risk assessment. Chemosphere 2019, 217, 558–566. [Google Scholar] [CrossRef]
- Yusà, V.; Pérez, R.; Suelves, T.; Corpas-Burgos, F.; Gormáz, M.; Dualde, P.; Coscolla, C.; Quiles, J.; Roca, M.; Vento, M. Biomonitoring of mercury in hair of breastfeeding mothers living in the Valencian Region (Spain). Levels and predictors of exposure. Chemosphere 2017, 187, 106–113. [Google Scholar] [CrossRef]
- Ruggieri, F.; Majorani, C.; Domanico, F.; Alimonti, A. Mercury in children: Current state on exposure through human biomonitoring studies. Int. J. Environ. Res. Public Health 2017, 14, 519. [Google Scholar] [CrossRef]
- Young, J. Along Ethiopia’s western frontier: Gambella and Benishangul in transition. J. Mod. Afr. Stud. 1999, 37, 321–346. Available online: http://www.jstor.org/stable/161849 (accessed on 31 October 2020). [CrossRef]
- Chaya, N. Poor access to health Services: Ways Ethiopia is overcoming it. Res. Comment. 2007, 2, 1–6. Available online: http://idp-uk.org/OurProjects/Health/Poor%20Access%20to%20Health%20Services.pdf (accessed on 31 October 2020).
- Stevenson, M.M. Monitoring Effective Use of Household Water Treatment and Safe Storage Technologies in Ethiopia and Ghana. 2008. Available online: https://dspace.mit.edu/handle/1721.1/47783 (accessed on 31 October 2020).
- MacDonald, A.; Ó Dochartaigh, B.; Welle, K. Mapping for Water Supply and Sanitation (WSS) in Ethiopia. Research-Inspired Policy and Practice Learning in Ethiopia and the Nile Region (RiPPLE). 2009. Available online: http://nora.nerc.ac.uk/id/eprint/7974/1/MappingwatersupplyEthiopia.pdf (accessed on 31 October 2020).
- WHO/UNICEF Joint Monitoring Programme for Water Supply and Sanitation. In Proceedings of the Report JMP Technical Task Force Meeting on Monitoring Drinking-water Quality, Chateau de Pizay, Villié-Morgon, France, 16–18 November 2010; pp. 1–25.
- Mulugeta, F.Z. Socioeconomic factors affecting childhood mortality in Ethiopia: An in-strumental variable approach. Ethiop. J. Econ. 2012, 20, 63–81. Available online: https://ideas.repec.org/a/ags/eeaeje/258855.html (accessed on 31 October 2020).
- Calow, R.; Ludi, E.; Tucker, J. Achieving Water Security: Lessons from Research in Water Supply, Sanitation and Hygiene in Ethiopia; Practical Action Publishing: Warwickshire, UK, 2013; Available online: https://www.odi.org/sites/odi.org.uk/files/odi-assets/publications-opinion-files/8606.pdf (accessed on 31 October 2020).
- Sinmegn Mihrete, T.; Asres Alemie, G.; Shimeka Teferra, A. Determinants of childhood diarrhea among underfive children in Benishangul Gumuz Regional State, North West Ethiopia. BMC Pediatr. 2014, 14, 102. [Google Scholar] [CrossRef] [PubMed]
- Roca, M.; Sánchez, A.; Pérez, R.; Pardo, O.; Yusa, V. Biomonitoring of 20 elements in urine of children. Levels and predictors of exposure. Chemosphere 2016, 144, 1698–1705. [Google Scholar] [CrossRef]
- European Parliament, Council of the European Union. Directive 2001/20/EC of the European Parliament and of the Council of 4 April 2001 on the Approximation of the Laws, Regulations and Administrative Provisions of the Member States Relating to the Implementation of Good Clinical Practice in the Conduct of Clinical Trials on Medicinal Products for Human Use. Available online: https://ec.europa.eu/health/sites/health/files/files/eudralex/vol-1/dir_2001_20/dir_2001_20_en.pdf (accessed on 2 October 2020).
- ICOH. International Code of Ethics for Occupational Health Professionals, 3rd ed. Available online: http://www.icohweb.org/site/multimedia/code_of_ethics/code-of-ethics-en.pdf (accessed on 2 October 2020).
- Astolfi, M.L.; Protano, C.; Marconi, E.; Massimi, L.; Brunori, M.; Piamonti, D.; Migliara, G.; Vitali, M.; Canepari, S. A new rapid treatment of human hair for elemental determination by inductively coupled mass spectrometry. Anal. Methods 2020, 12, 1906–1918. [Google Scholar] [CrossRef]
- Astolfi, M.L.; Protano, C.; Marconi, E.; Massimi, L.; Piamonti, D.; Brunori, M.; Vitali, M.; Canepari, S. Biomonitoring of Mercury in Hair among a Group of Eritreans (Africa). Int. J. Environ. Res. Public Health 2020, 17, 1911. [Google Scholar] [CrossRef]
- Astolfi, M.L.; Protano, C.; Marconi, E.; Piamonti, D.; Massimi, L.; Brunori, M.; Vitali, M.; Canepari, S. Simple and rapid method for the determination of mercury in human hair by cold vapour generation atomic fluorescence spectrometry. Microchem. J. 2019, 150, 104186. [Google Scholar] [CrossRef]
- National Institute of Health of Italy. Metodi Analitici di Riferimento per le Acque Destinate al Consumo Umano ai sensi del D.L.vo 31/2001. Metodi chimici. Rapporti ISTISAN 07/31. 2007. Available online: http://old.iss.it/binary/aqua/cont/RappIstisan%2007%2031.1204712902.pdf (accessed on 25 August 2020).
- APAT/IRSA-CNR. Metodi Analitici per le Acque. 29/2003, 1030: Metodi di Campionamento. APAT/IRSA-CNR. 2003. Available online: http://www.irsa.cnr.it/Docs/Capitoli/1000.pdf (accessed on 31 October 2020).
- Hornung, R.W.; Reed, L.D. Estimation of average concentration in the presence of non-detectable values. Appl. Occup. Environ. Hyg. 1990, 5, 46–51. [Google Scholar] [CrossRef]
- Faraway, J.J. Linear Models with R; Chapman & Hall/CRC: Boca Raton, FL, USA, 2004. [Google Scholar]
- Corder, G.W.; Foreman, D.I. Nonparametric Statistics: A Step-by-Step Approach; John Wiley & Sons: Hoboken, NJ, USA, 2014. [Google Scholar]
- Di Ciccio, T.J.; Efron, B. Bootstrap confidence intervals (with Discussion). Stat. Sci. 1996, 11, 189–228. [Google Scholar]
- Davison, A.C.; Hinkley, D.V. Bootstrap Methods and Their Application; Cambridge University Press: Cambridge, UK, 1997. [Google Scholar] [CrossRef]
- WHO. Chemicals of public health concern in the African Region and their management: Regional Assessment Report, World Health Organization. Regional Office for Africa, Republic of Congo. 2014. Available online: https://www.afro.who.int/sites/default/files/2017-06/9789290232810.pdf (accessed on 31 October 2020).
- Addis Ababa Policy Planning Directorate, Federal Ministry of Health. Health and Health Related Indicators. Version 1.2008 E.C. 2015. Available online: https://www.dktethiopia.org/sites/default/files/PublicationFiles/Health%20and%20Health%20Related%20Indicator%20 2008.pdf (accessed on 31 October 2020).
- WHO: Global Health Estimates; World Health Organization: Geneva, Switzerland, 2016; Available online: http://www. who.int/healthinfo/global_burden_disease/estimates/en (accessed on 9 August 2018).
- Skröder, H.; Kippler, M.; Nermell, B.; Tofail, F.; Levi, M.; Rahman, S.M.; Raquib, R.; Vahter, M. Major limitations in using element concentrations in hair as biomarkers of exposure to toxic and essential trace elements in children. Environ. Health Perspect. 2017, 125, 067021-1–067021-9. [Google Scholar] [CrossRef]
- Evrenoglou, L.; Partsinevelou, S.A.; Stamatis, P.; Lazaris, A.; Patsouris, E.; Kotampasi, C.; Nicolopoulou-Stamati, P. Children exposure to trace levels of heavy metals at the north zone of Kifissos River. Sci. Total Environ. 2013, 443, 650–661. [Google Scholar] [CrossRef] [PubMed]
- Skalny, A.V.; Skalnaya, M.G.; Grabeklis, A.R.; Zhegalova, I.V.; Serebryansky, E.P.; Demidov, V.A.; Salnikova, E.V.; Uzhentseva, M.S.; Lobanova, Y.N.; Skalny, A.A. Interactive effects of age and gender on levels of toxic and potentially toxic metals in children hair in different urban environments. Int. J. Environ. Anal. Chem. 2018, 98, 520–535. [Google Scholar] [CrossRef]
- Drobyshev, E.J.; Solovyev, N.D.; Ivanenko, N.B.; Kombarova, M.Y.; Ganeev, A.A. Trace element biomonitoring in hair of school children from a polluted area by sector field inductively coupled plasma mass spectrometry. J. Trace Elem. Med. Biol. 2017, 39, 14–20. [Google Scholar] [CrossRef] [PubMed]
- Den Hond, E.; Govarts, E.; Willems, H.; Smolders, R.; Casteleyn, L.; Kolossa-Gehring, M.; Schwedler, G.; Seiwert, M.; Fiddicke, U.; Castaño, A.; et al. First Steps toward Harmonized Human Biomonitoring in Europe: Demonstration Project to Perform Human Biomonitoring on a European Scale. Environ. Health Perspect. 2015, 123, 255–263. [Google Scholar] [CrossRef] [PubMed]
- Ilmiawati, C.; Yoshida, T.; Itoh, T.; Nakagi, Y.; Saijo, Y.; Sugioka, Y.; Sakamoto, M.; Ikegami, A.; Ogawa, M.; Kayama, F. Biomonitoring of mercury, cadmium, and lead exposure in Japanese children: A cross-sectional study. Environ. Health Prev. Med. 2015, 20, 18–27. [Google Scholar] [CrossRef] [PubMed]
- Tian, W.; Egeland, G.M.; Sobol, I.; Chan, H.M. Mercury hair concentrations and dietary exposure among Inuit preschool children in Nunavut, Canada. Environ. Int. 2011, 37, 42–48. [Google Scholar] [CrossRef]
- Yan, J.; Gao, Z.Y.; Wang, J.; Yan, C.H. Mercury levels and their relationship with seafood consumption among preschool children in Shanghai. Biomed. Environ. Sci. 2017, 30, 220–223. [Google Scholar] [CrossRef]
- Basu, N.; Tutino, R.; Zhang, Z.; Cantonwine, D.E.; Goodrich, J.M.; Somers, E.C.; Rodriguez, L.; Schnaas, L.; Solano, M.; Mercado, A.; et al. Mercury levels in pregnant women, children and seafood from Mexico City. Environ. Res. 2014, 135, 63–69. [Google Scholar] [CrossRef]
- McDowell, M.A.; Dillon, C.F.; Osterloh, J.; Bolger, P.M.; Pellizzari, E.; Fernando, R.; Montes de Oca, R.; Schober, S.E.; Sinks, T.; Jones, R.L.; et al. Hair mercury levels in U.S. Children and women of childbearing age: Reference range data from NHANES 1999–2000. Environ. Health Perspect. 2004, 112, 1165–1171. [Google Scholar] [CrossRef]
- Llorente Ballesteros, M.T.; Navarro Serrano, I.; Izquierdo Alvarez, S. Reference levels of trace elements in hair samples from children and adolescents in Madrid, Spain. J. Trace Elem. Med. Biol. 2017, 43, 113–120. [Google Scholar] [CrossRef]
- Sanna, E.; Vargiu, L.; Rossetti, I.; Vallascas, E.; Floris, G. Correlation between blood and hair lead levels in boys and girls of Sardinia (Italy). J. Anthropol. Sci. 2007, 85, 173–181. [Google Scholar]
- Sanna, E.; Floris, G.; Vallascas, E. Town and gender effects on hair lead levels in children from three Sardinian towns (Italy) with different environmental backgrounds. Biol. Trace Elem. Res. 2008, 124, 52–59. [Google Scholar] [CrossRef]
- Senofonte, O.; Violante, N.; Caroli, S. Assessment of reference values for in human hair of urban schoolboys. J. Trace Elem. Med. Biol. 2000, 14, 6–13. [Google Scholar] [CrossRef]
- Chojnacka, K.; Michalak, I.; Zielińska, A.; Górecka, H.; Górecki, H. Inter-relationship between elements in human hair: The effect of gender. Ecotoxicol. Environ. Saf. 2010, 73, 2022–2028. [Google Scholar] [CrossRef]
- Chojnacka, K.; Zielińska, A.; Górecka, H.; Dobrzański, Z.; Górecki, H. Reference values for hair minerals of Polish students. Environ. Toxicol. Pharmacol. 2010, 29, 314–319. [Google Scholar] [CrossRef]
- Zaichick, S.; Zaichick, V. The effect of age and gender on 37 chemical element contents in scalp hair of healthy humans. Biol. Trace Elem. Res. 2010, 134, 41–54. [Google Scholar] [CrossRef] [PubMed]
- Varrica, D.; Tamburo, E.; Milia, N.; Vallascas, E.; Cortimiglia, V.; de Giudici, G.; Dongarrà, G.; Sanna, E.; Monna, F.; Losno, R. Metals and metalloids in hair samples of children living near the abandoned mine sites of Sulcis-Inglesiente (Sardinia, Italy). Environ. Res. 2014, 134, 366–374. [Google Scholar] [CrossRef] [PubMed]
- Skalny, A.V.; Skalnaya, M.G.; Tinkova, A.A.; Serebryansky, E.P.; Demidov, V.A.; Lobanova, Y.N.; Grabeklis, A.R.; Berezkina, E.S.; Gryazeva, I.V.; Skalny, A.A.; et al. Reference values of hair toxic trace elements content in occupationally non-exposed Russian population. Environ. Toxicol. Pharmacol. 2015, 40, 18–21. [Google Scholar] [CrossRef] [PubMed]
- Vahter, M.; Åkesson, A.; Lidén, C.; Ceccatellia, S.; Berglund, M. Gender differences in the disposition and toxicity of metals. Environ. Res. 2007, 104, 85–95. [Google Scholar] [CrossRef] [PubMed]
- Berglund, M.; Lindberg, A.; Rahman, M.; Yunus, M.; Grandér, M.; Lönnerdal, B.; Vahter, M. Gender and age differences in mixed metal exposure and urinary excretion. Environ. Res. 2011, 111, 1271–1279. [Google Scholar] [CrossRef]
- Dongarrà, G.; Lombardo, M.; Tamburo, E.; Varrica, D.; Cibella, F.; Cuttitta, G. Concentration and reference interval of trace elements in human hair from students living in Palermo, Sicily (Italy). Environ. Toxicol. Pharmacol. 2011, 32, 27–34. [Google Scholar] [CrossRef] [PubMed]
- Dongarrà, G.; Varrica, D.; Tamburo, E.; D’Andrea, D. Trace elements in scalp hair of children living in differing environmental contexts in Sicily (Italy). Environ. Toxicol. Pharmacol. 2012, 34, 160–169. [Google Scholar] [CrossRef]
- Pounds, J.G.; Long, G.J.; Rosen, J.F. Cellular and molecular toxicity of lead in bone. Environ. Health Perspect. 1991, 91, 17–32. [Google Scholar] [CrossRef] [PubMed]
- Leggett, R.W. Basis for the ICRP’s age-specific biokinetic model for uranium. Health Phys. 1994, 67, 589–610. [Google Scholar] [CrossRef] [PubMed]
- Deshpande, J.D.; Joshi, M.M.; Giri, P.A. Zinc: The trace element of major importance in human nutrition and health. Int. J. Med. Sci. Public Health 2013, 2, 1–6. [Google Scholar] [CrossRef]
- De Prisco, P.P.; Volpe, M.G.; Petitto, F.; Palladino, C.; Saturnino, C.; Capasso, A.; Di Stasio, M.; De Prisco, R. Level of essential and toxic metals in urban adolescents hair: Preliminary study. Biomed. Res. 2010, 21, 131–140. [Google Scholar]
- Benes, B.; Sladka, J.; Spevackova, V.; Smid, J. Determination of normal concentration levels of Cd, Cr, Cu, Hg, Pb, Se and Zn in hair of child population in the Czech Republic. Cent. Eur. J. Public Health 2003, 11, 184–186. [Google Scholar]
- Pereira, R.; Ribeiro, R.; Gonçalves, F. Scalp hair analysis as a tool in assessing human exposure to heavy metals (S. Domingos mine, Portugal). Sci. Total Environ. 2004, 327, 81–92. [Google Scholar] [CrossRef]
- Barbieri, F.L.; Cournil, A.; Souza Sarkis, J.E.; Bénéfice, E.; Gardon, J. Hair trace elements concentration to describe polymetallic mining waste exposure in Bolivian altiplano. Biol. Trace Elem. Res. 2011, 139, 10–23. [Google Scholar] [CrossRef]
- Carneiro, M.F.H.; Grotto, D.; Batista, B.L.; Rhoden, C.R.; Barbosa, F. Background values for essential and toxic elements in children’s nail and correlation with hair levels. Biol. Trace Elem. Res. 2011, 144, 339–350. [Google Scholar] [CrossRef]
- Prabu, P.C. Impact of heavy metal contamination of Akaki River of Ethiopia on soil and metal toxicity on cultivated vegetable crops. Electron. J. Environ. Agric. Food Chem. 2009, 8, 818–827. [Google Scholar]
- Michalak, I.; Chojnacka, K.; Saeid, A. Relation between mineral composition of human hair and common illnesses. Chin. Sci. Bull. 2012, 57, 3460–3465. [Google Scholar] [CrossRef][Green Version]
- Nohynek, G.J.; Fautz, R.; Benech-Kieffer, F.; Toutaina, H. Toxicity and human health risk of hair dyes. Food Chem. Toxicol. 2004, 42, 517–543. [Google Scholar] [CrossRef] [PubMed]
- Kordas, K.; Queirolo, E.I.; Ettinger, A.S.; Wright, R.O.; Stoltzfus, R.J. Prevalence and predictors of exposure to multiple metals in preschool children from Montevideo, Uruguay. Sci. Total Environ. 2010, 408, 4488–4494. [Google Scholar] [CrossRef] [PubMed]
- Scudiero, R.; Cigliano, L.; Verderame, M. Age-related changes of metallothionein 1/2 and metallothionein 3 expression in rat brain. C. R. Biol. 2017, 340, 13–17. [Google Scholar] [CrossRef] [PubMed]
- Kumakli, H.; Duncan, A.V.; McDaniel, K.; Mehari, T.F.; Stephenson, J.; Maple, L.; Crawford, Z.; Macemore, C.L.; Babyak, C.M.; Fakayode, S.O. Environmental biomonitoring of essential and toxic elements in human scalp hair using accelerated microwave-assisted sample digestion and inductively coupled plasma optical emission spectroscopy. Chemosphere 2017, 174, 708–715. [Google Scholar] [CrossRef] [PubMed]
- Chojnacka, K.; Górecka, H.; Górecki, H. The effect of age, sex, smoking habit and hair color on the composition of hair. Environ. Toxicol. Pharmacol. 2006, 22, 52–57. [Google Scholar] [CrossRef] [PubMed]
- EFSA, European Food Safety Authority. Scientific Opinion on the risk for public health related to the presence of mercury and methylmercury in food. EFSA J. 2012, 10, 2985. [Google Scholar]
- Chien, L.C.; Gao, C.S.; Lin, H.H. Hair mercury concentration and fish consumption: Risk and perceptions of risk among women of childbearing age. Environ. Res. 2010, 110, 123–129. [Google Scholar] [CrossRef]
- Gibb, H.; O’Leary, K.G.; Sarkar, S.K.; Wang, J.; Liguori, L.; Rainis, H.; Smith, K.A.; Chatterjee, M. Hair mercury concentrations in residents of Sundarban and Calcutta, India. Environ. Res. 2016, 150, 616–621. [Google Scholar] [CrossRef]
- Pirard, C.; Koppen, G.; De Cremer, K.; Van Overmeire, I.; Govarts, E.; Dewolf, M.C.; Van De Mieroop, E.; Aerts, D.; Biot, P.; Casteleyn, L.; et al. Hair mercury and urinary cadmium levels in Belgian children and their mothers within the framework of the COPHES/DEMOCOPHES projects. Sci. Total Environ. 2014, 472, 730–740. [Google Scholar] [CrossRef] [PubMed]
Publisher’s Note: MDPI stays neutral with regard to jurisdictional claims in published maps and institutional affiliations. |
© 2020 by the authors. Licensee MDPI, Basel, Switzerland. This article is an open access article distributed under the terms and conditions of the Creative Commons Attribution (CC BY) license (http://creativecommons.org/licenses/by/4.0/).