Article

Prevalence of Type 2 Diabetes and Its Association with Added Sugar Intake in Citizens and Refugees Aged 40 or Older in the Gaza Strip, Palestine

1
Global Health Institute, School of Public Health, Xi’an Jiaotong University Health Science Center, 76 West Yanta Road, Xi’an 710061, China
2
Human Nutrition Department, College of Health Sciences, QU Health, Qatar University, Doha 2713, Qatar
3
Department of Twin Research and Genetic Epidemiology, King’s College London, St Thomas’ Hospital, Strand, London SE1 7EH, UK
4
Department of Medical Sciences, University College of Science & Technology, Khan Younis 950, Palestine
*
Authors to whom correspondence should be addressed.
Int. J. Environ. Res. Public Health 2020, 17(22), 8594; https://doi.org/10.3390/ijerph17228594
Submission received: 14 October 2020 / Revised: 11 November 2020 / Accepted: 13 November 2020 / Published: 19 November 2020

Abstract

:
Background: Little is known about the prevalence and risk factors of diabetes among Gaza Palestinians, 64% of whom are refugees with exceeded sugar intake. We aimed to estimate the prevalence of type 2 diabetes (T2D) and its association with added sugar intake among residents, with regular visits to primary healthcare centers (PHCs) across Gaza. Methods: From October to December of 2019, a cross-sectional survey was conducted among 1000 citizens and refugees in nine PHCs selected from the five governorates of the Gaza Strip. Information on dietary intake, medical history, and other risk factors was collected by trained health workers, using structured questionnaires. Anthropometry and biochemical data were extracted from the PHC medical record system. Results: Overall, the prevalence of diagnosed T2D and undiagnosed T2D were 45.2% and 16.8%, respectively, in adults aged 42 to 74 years, with the differences among citizens and refugees (diagnosed: 46.2% vs. 43.8%; undiagnosed: 15.7% vs. 18.2%). The uncontrolled glycaemic rate was 41.9% and 36.8% for diagnosed patients in citizens and refugees, respectively. Among those without a clinical diagnosis of T2D, after multivariable adjustment, daily added sugar intake was positively associated with fasting glucose and the risk of undiagnosed T2D (odds ratio, 95% CI, highest vs. lowest intake, was 2.71 (1.12–6.54) (p for trend < 0.001). In stratified analysis, the associations between added sugar intake and the risk of undiagnosed T2D tend to be stronger among refugees or those with higher body mass index. Conclusions: Among Palestinian adults, both citizens and refugees are affected by T2D. Added sugar intake is associated with the risk of undiagnosed T2D.

1. Introduction

Type 2 diabetes (T2D) and its complications have contributed to the global burden of mortality [1], posing a major global health threat in both developed and developing countries [2,3]. In the Middle East, approximately 46 million individuals were suffering from T2D from 2000 to 2018 [4]. There is a lack of information about the prevalence of T2D in Palestine [5], possibly due to the large population of scattered refugees across neighbouring countries, the presence of conflicts, wars, ongoing crises, and the fragile nature of the healthcare system [6].
According to the 2018 annual health report of the United Nations Relief and Works Agency (UNRWA), 15.7% of refugees aged over 40 years were diagnosed with T2D in the Gaza Strip, Palestine [7]. Moreover, T2D and its complications account for approximately 5.7% of all Palestine deaths [8]. In the past 20 years, people in the Gaza Strip have been facing poor surroundings and critical situations due to sieges and border-closure conditions [9,10]. Refugees account for 64% of all Palestinian residents in the Gaza Strip [11] and suffer from deteriorating living conditions, high poverty, low wages, and unhealthy camp housing [12], with raised problems in malnutrition, food insecurity, and lack medical care [13,14]. However, direct population evidence linking such exposures with the prevalence of T2D was rarely reported [15].
Suboptimal diet is one of the leading causes of poor health, including T2D [16,17]. In Gaza, most Palestinian refugees receive monthly food supplies (sugar, rice, legumes, flour, and cooking oil) and aids from humanitarian agencies, such as UNRWA and World Food Programme [18]. Moreover, Palestinians consume large amounts of homemade desserts, cakes, sweetened tea, and coffee [19]. A community-based cross-sectional survey undertaken among Palestinians aged 30–65 years in the West Bank showed that the mean annual intake of added sugar per household member was 37.8 kg (≈105 g/day), contributing to 13–14% daily total energy intake [20]. It is approximately three times what the American Heart Association recommends for the maximum amount of daily added sugar intake (37.5 g for men and 25 g for women) [21].
Moreover, World Health Organization (WHO) suggests reducing free sugar consumption to below 10% of total energy intake, at all stages of life, to minimize the risk of excessive weight gain [22], and further reduction to 5% could have additional health benefits [23]. On the other hand, diabetic patients with high added sugar intake can develop diabetic foot ulcers in the long-term, especially for elderly adults [24]. It may have a negative impact on the quality of life and diabetes self-management [25]. Thus, the diabetic patient should have special management of his/her nutrition, including added sugar, which has a critical role in the wound-healing process [26].
To the best of our knowledge, the link between sugar intake and the prevalence of T2D among Palestinians has not been explored. We aimed to evaluate the prevalence of T2D in Palestinian citizens and refugees living in Gaza who attended the clinics and further explored the association of added sugar intake with the risk of T2D.

2. Materials and Methods

2.1. Study Design and Participants

This is a cross-sectional study among residents who were regularly visiting the primary healthcare centers (PHCs), the Ministry of Health (MOH), Gaza Strip, Palestine. The project was designed to examine the prevalence of non-communicable diseases and conventional population-specific (e.g., living conditions under long-lasting border conflicts) risk factors among Palestinian adults in the Gaza Strip and served by the governmental PHCs.
The inclusion criteria included the following: (1) Palestinian residents (refugees or citizens), (2) date of birth between 1 January 1944 and 31 December 2001, (3) living in the Gaza Strip for 14 years; and (4) registered at PHCs, Gaza. Exclusion criteria were as follows: (1) pregnant women and (2) lacking data of existing biochemical variables from 2013 to 2019. Setting a precision of 0.05, assuming a prevalence of T2D of 15.7% [7,27], we concluded that 956 participants would be sufficient to provide 85% power to estimate the prevalence of T2D. Out of the total, 1000 participants were finally included in the analysis, after excluding pregnant participants (n = 37) and participants whose biochemical and anthropometric data were missing (n = 83). The participants of the research were chosen from various clinics within the PHCs. We invited all the visitors during the working hours of those clinics, from the early morning until afternoon.
All subjects gave their informed consent for inclusion before they participated in the study. The study was approved by the Ethical Committee of Xi’an Jiaotong University Health Science Center, and it was conducted by following the Declaration of Helsinki. The protocol was approved by the Ethics Committee of the Research Department at the Directorate General of Human Resources Development, Ministry of Health, Gaza (PHRC/HC/576/19).

2.2. Sampling Approach

The Gaza Strip is divided into five governorates: North of Gaza, Gaza City, Midzone, Khan-Younis, and Rafah [28]. A total of 51 PHCs are distributed across the Gaza Strip, which provides residents (both citizens and refugees) specialized healthcare services, including tailored maternal and family-planning programs, as well as permanent monitoring of non-communicable diseases (NCDs) such as T2D [27]. We selected 9 out of 51 PHCs, the largest ones located in different governorates across the Gaza Strip, as our study sites, to maximize our participants’ representativeness. One to three PHCs were consequently selected from each governorate, matching the population’s size of each governorate (Supplementary Materials Figure S1).

2.3. Data Collection

The initial version of the questionnaire was designed and then validated in two steps. First, the research instrument was sent to medical experts, to express its simplicity, relativity, and importance. Secondly, a pilot study was conducted among a small group of PHCs’ visitors (n = 30), to verify the validity and reliability of the data-collection process before the formal data collection. Minor changes were made to the data-collection approach for some items, by considering the results of the pilot analysis. Furthermore, medical experts validated and reviewed the updated questionnaire, to reconfirm the acceptability of the methods used to achieve the research goals. In the formal data-collection process, the final version of the questionnaire was used, and the data from the pilot study were not used in the final analysis.
The data were collected in two stages: (1) Face-to-face questionnaire interviews were conducted for all participants, by trained health workers. (2) Anthropometric and biochemical parameters for the same respondents were extracted by medical secretary staff, using their Electronic Health Record System (E-Health), by matching their registration ID.
The questionnaire consisted of four parts: (1) sociodemographic data, including age, sex, marital status, education level, working status, and household income; (2) medical history, including diagnosis, duration, treatment status, and family history of non-communicable disease, including T2D; (3) lifestyle information, including physical activity (International Physical Activity Questionnaire [29]), dietary habits (adapted from questions used in the China Kadoorie Biobank [30]), tea and coffee consumption, and smoking; (4) unique issues for the poor conditions of the Palestinian refugees and citizens, such as living, housing conditions, injuries, loss of family members, and depression.
The Anthropometric variables, including weight, height, waist circumference, and blood pressure, were extracted from the E-Health record system. Body mass index (BMI) was calculated based on the BMI formula (BMI (kg/m2) = Weight (kg)/Height squared (m2)) [31]. In the daily routine work of PHCs, the nursing staff measured height and weight for all clinic visitors, using stadiometers (Seca), according to the WHO standardized protocols [31]. Waist circumference was routinely measured to the nearest 1.0 cm, after breath out, using non-elastic tape around the middle waist, just above the hipbones, according to the protocol of the National Institutes of Health [32]. Blood-pressure data were extracted from the E-Health system. Their blood pressure was measured by the PHCs nursing staff, in the right arm, after 5 min of rest, in a sitting position, by a single mercury sphygmomanometer.
Biochemical data were extracted from the E-health system: fasting blood glucose (FBG), Haemoglobin A1c (HbA1c), total cholesterol, triglycerides, high-density lipoprotein (HDL), and low-density lipoprotein (LDL). All of these biochemical tests were assayed by medical laboratory technicians, using colorimetric and kinetic assays, using an automated biochemical analyzer (ChemWell 2910, Awareness Technology, CA, USA and Erba XL 200, Erba Diagnostics Mannheim, Germany).

2.4. Outcome Definitions

T2D was defined as having a documented diagnosis by general practitioners in the PHCs, and those cases were named diagnosed T2D in the present study. Among those without a clinical T2D diagnosis, undiagnosed T2D was defined as having a fasting blood glucose (FBG) level ≥7.0 mmol/L (≥126 mg/dL). Moreover, in a sensitivity analysis, for those without a clinical diagnosis of T2D, FBG was ≥7.0 mmol/L (≥126 mg/dL) plus HbA1c ≥48 mmol/mol (≥6.5%). Uncontrolled diabetes was defined as having HbA1c ≥53 mmol/mol (≥7.0%), according to the American Diabetes Association [33].

2.5. Statistical Analysis

All analyses were conducted by using STATA 14.0 (StataCorp, College Station, TX, USA). Continuous variables were reported as mean values and standard deviations, while categorical variables were presented as frequency and percentage. Chi-square and t-tests were used for comparison of categorical data and continuous variables, respectively. To compare demographic characteristics between groups, one-way variance analysis (ANOVA) was used if there were three or more groups. The odds ratio (OR) and 95% confidence interval (CI) of T2D were calculated by using multivariable logistic regression by average daily added sugar intake, after adjusting for sex, age, population (refugees, citizens), region (North, Gaza City, Midzone, Khan Younis, and Rafah), household income (<500 NIS, 500–1000 NIS, 1000–1500 NIS, >1500 NIS, and no constant income), education (low, moderate, or high), smoking (yes or no), BMI (continuous), physical activity (low, moderate, or high), fruits and vegetable intake (continuous), hypertension (having or not), and lipid profile (total cholesterol, triglycerides, HDL, and LDL). Stratified analysis was conducted by sex, age (according to the median ≥ or < 59 years), BMI (according to the median ≥ or < 26.7 kg/m2), and population type (refugees or citizens); the statistical significance level was set as a two-sided p < 0.05.

3. Results

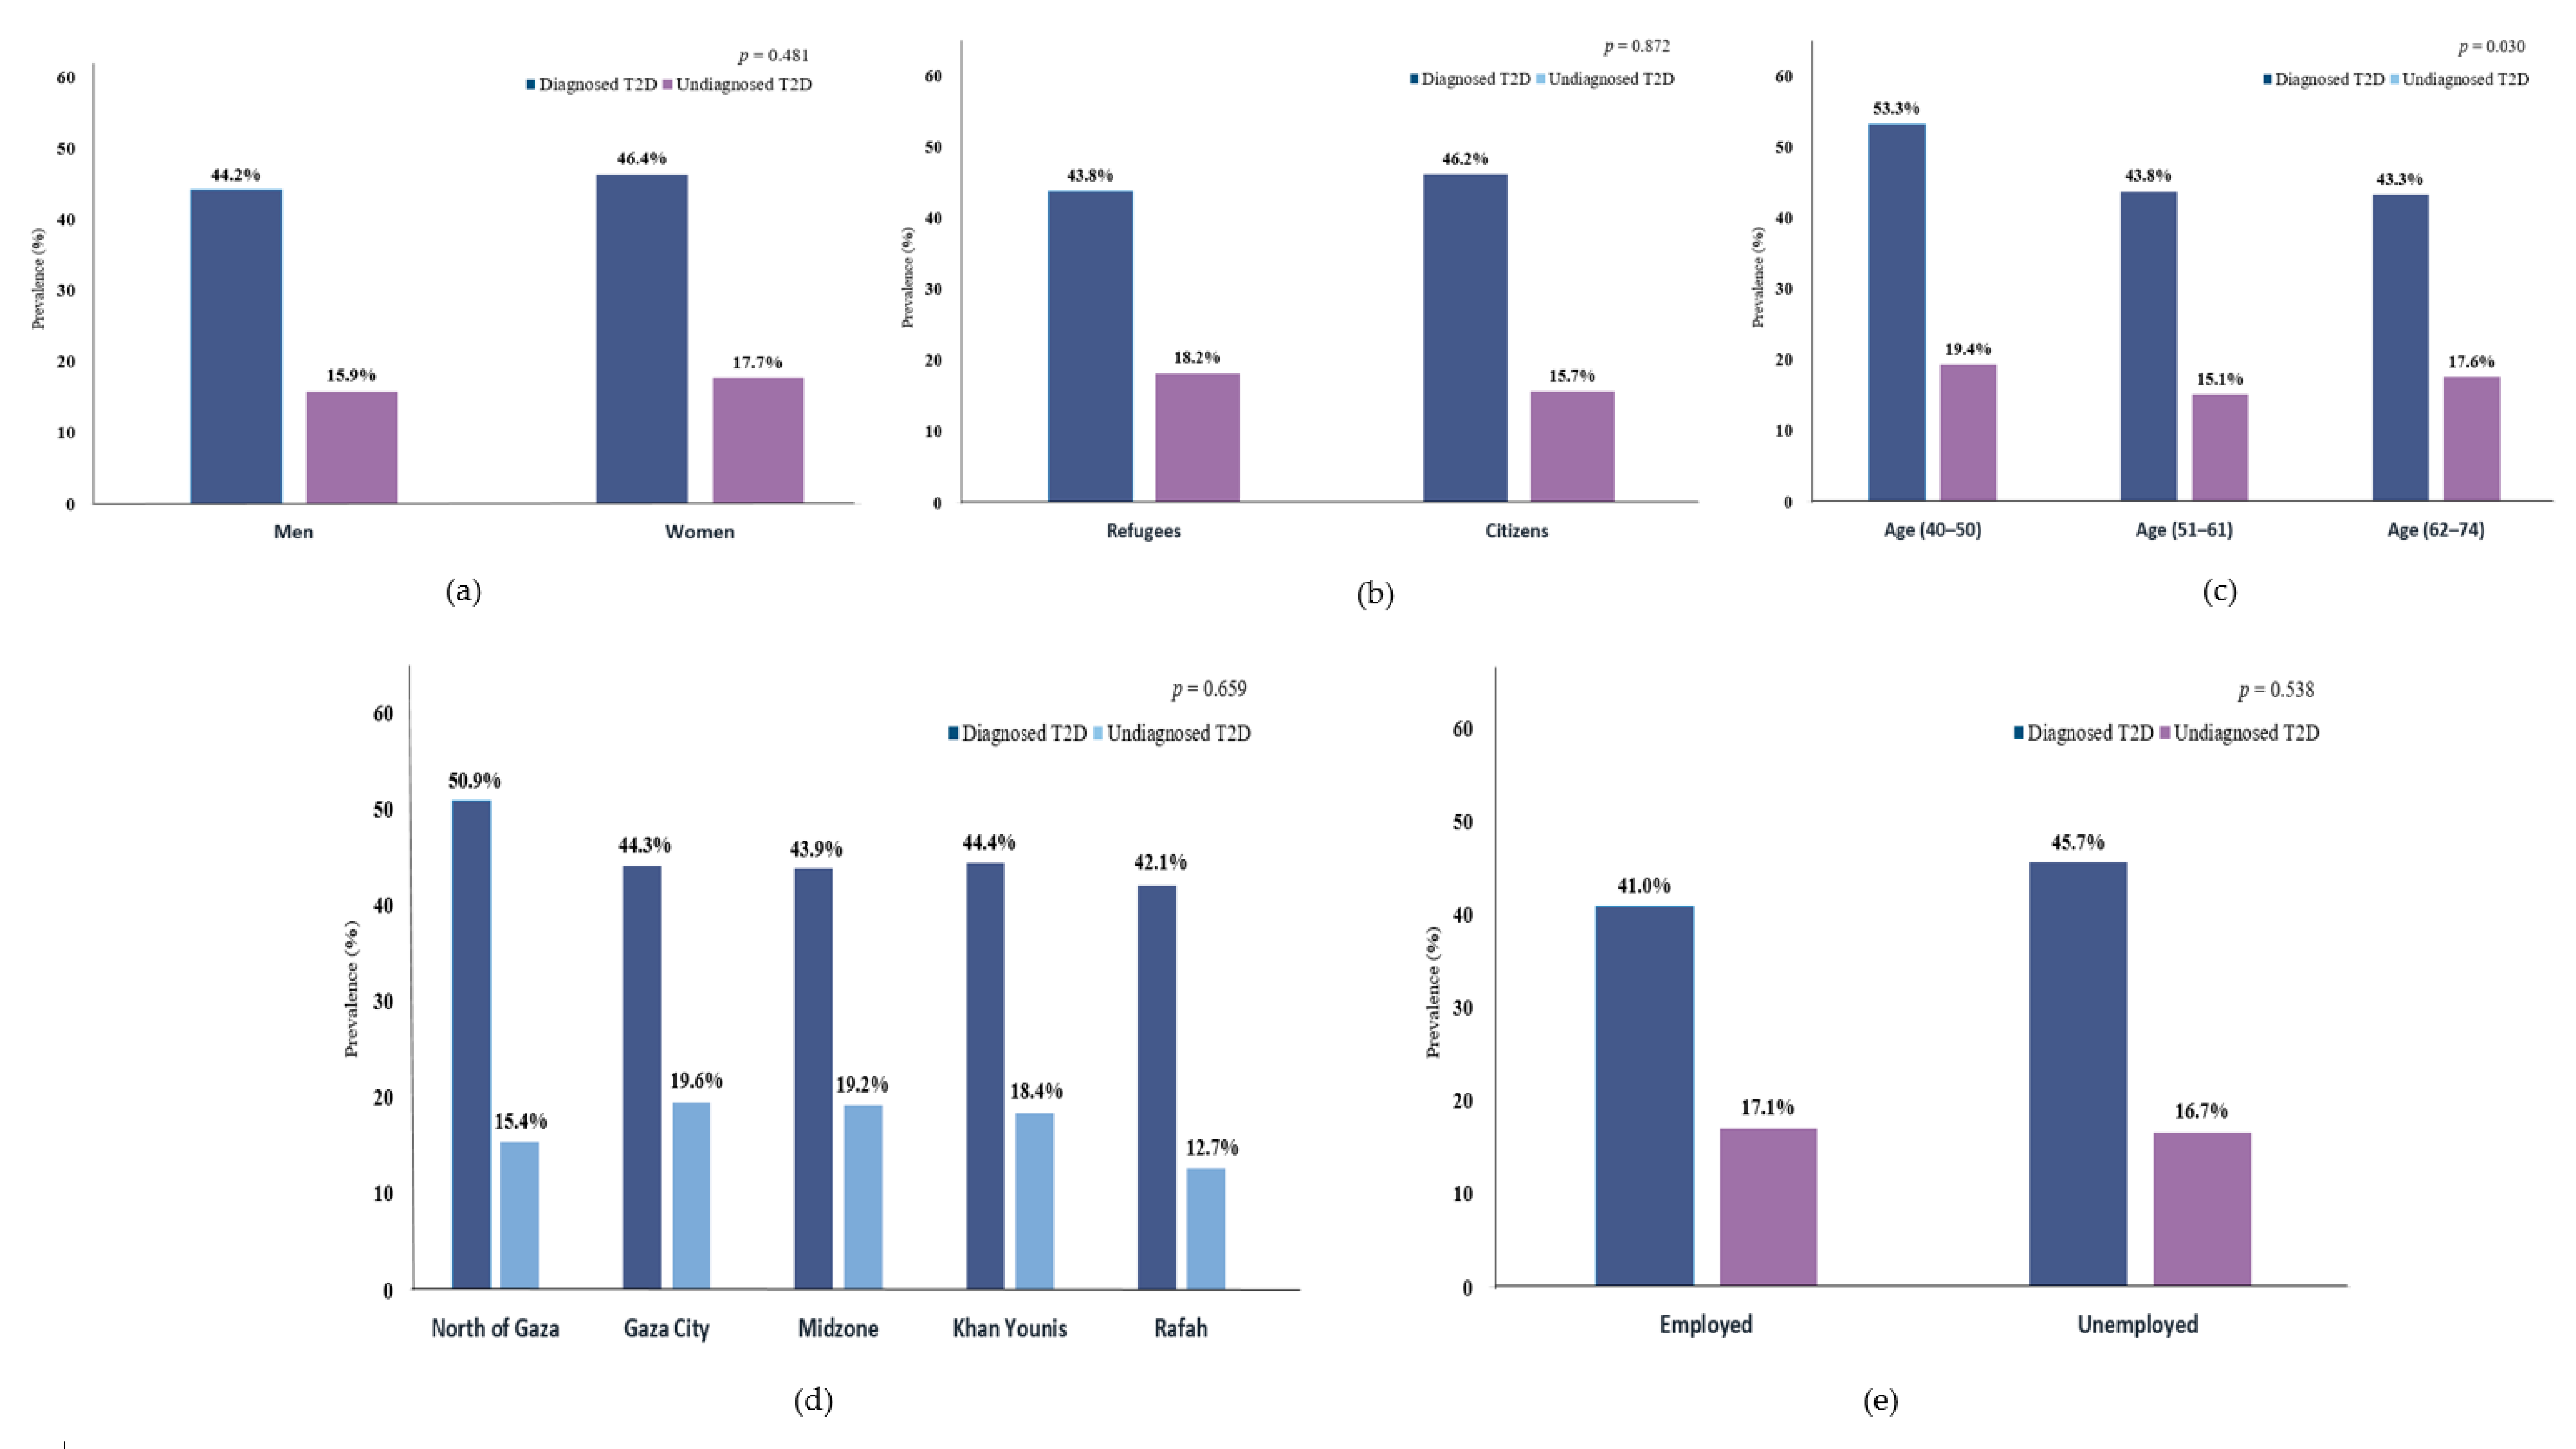
3.1. Prevalence of T2D and Characteristics of the Participants

The mean age of the participants was 59.2 ± 7.5 years, and 46.8% were females. In total, 42.2% of the participants were refugees, and 45.1% had a low education level. Furthermore, 85.4% of them lacked constant income, and only 11.7% were employed (Table 1).
Overall, 45.2% of the participants were clinically diagnosed with T2D, and another 16.8% were undiagnosed T2D. (Table 1) Moreover, clinically diagnosed T2D tended to be more prevalent in women, age (40–50 years), citizens, unemployed, or from the north of Gaza, relative to their counterparties, while undiagnosed T2D cases were more prevalent in women, age (40–50 years), refugees, Gaza City, or employed. (Figure 1) Furthermore, 39.8% (95% CI 35.4–44.4) of the diagnosed T2D cases were uncontrolled; 40.8% (95% CI 34.7–47.3) and 38.7% (95% CI 32.4–45.4) in men and women (Figure 2); the highest uncontrolled glycaemic rate was 50.0% (95% CI 36.5–63.4) in Gaza City, while the lowest was 32.3% (95% CI 23.7–42.3) in Khan Younis. Specifically, 11.3% (95% CI 9.5–13.4) had HbA1c value of 53 mmol/mol (7.0%) to 63 mmol/mol (7.9%), while the highest percentage was 17.3% (95% CI 15.1–19.7) for those who had HbA1c value of 64 mmol/mol (8.0%) to 75 mmol/mol (9.0%), and 11.1% (95% CI 9.3–13.2) had HbA1c value higher than 75 mmol/mol (>9.0%). (Figure 2).
Compared with non-cases, participants diagnosed or undiagnosed with T2D had higher levels in adiposity index, FBG, and HbA1c, and worse lipid profiles, where the mean (SD) BMI of the diagnosed and undiagnosed T2D was 28.2 (3.7) kg/m2 and 28.5 (3.5) kg/m2, respectively, while it was 27.9 (3.7) kg/m2 among the non-cases group (p = 0.189, Table 1), also the mean (SD) FBG of the diagnosed and undiagnosed T2D was 12.5 (4.6) mmol/L, and 10.0 (3.1) mmol/L, respectively, while it was 5.6 (1.0) mmol/L among the non-cases group (p < 0.001, Table 1).
No statistical differences were detected for population, region, education, income, working status, smoking, and blood pressure values among groups, except for sex (p = 0.034, Table 1) and physical activity (p = 0.044, Table 1). Moreover, no significant differences were observed among refugee and citizen groups (Supplementary Materials Table S1).

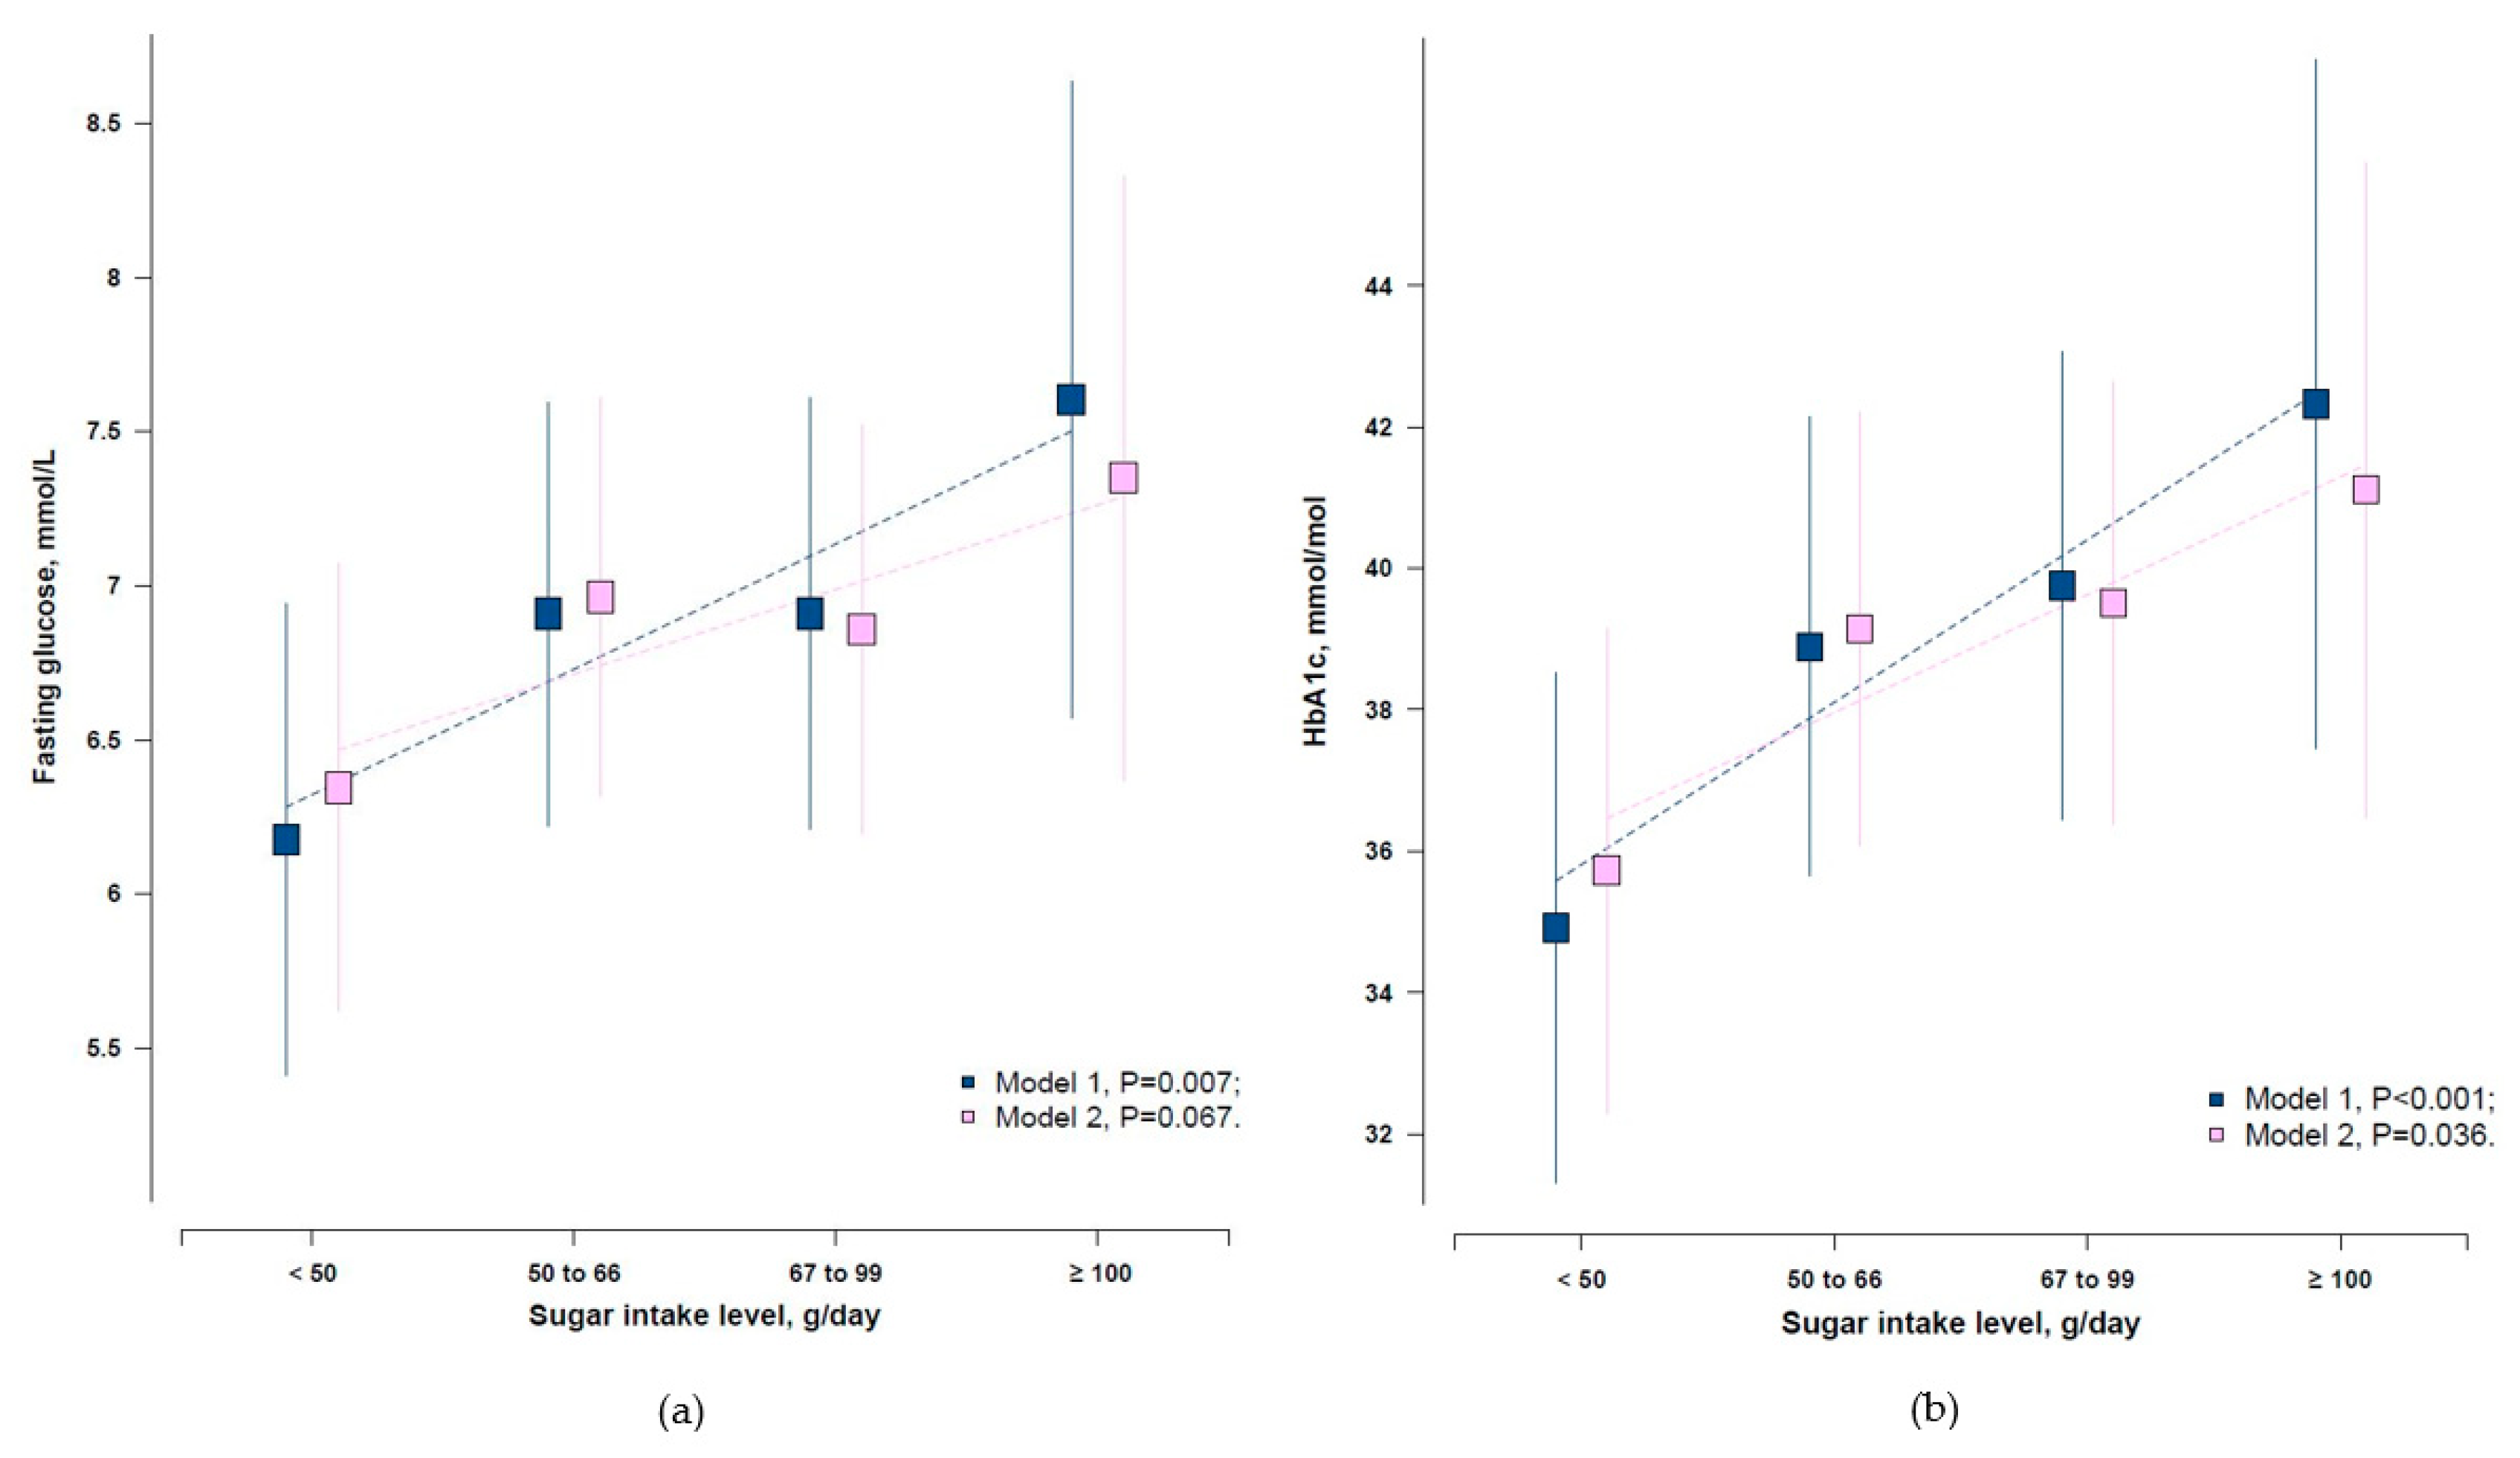
3.2. Associations between Added Sugar Intake Level and Glycaemic Parameters

The mean (SD) of added sugar intake was 60.6 (22.4) g/day, and 44.1% had added sugar intake above 50 g/day. In all participants, no association was observed between added sugar intake and diagnosed T2D (p = 0.338, Supplementary Materials Table S2). We evaluated the associations of added sugar intake and glycaemic indices (FBG and HbA1c) only among those without a clinical diagnosis of T2D. After adjustment of age, sex, population, region, income, education, smoking, and physical activity, higher daily added sugar intake was significantly associated with higher levels of FBG and HbA1c (p = 0.007 for FBG, and p < 0.001 for HbA1c, Figure 3). The same pattern was observed after including physical activity and BMI in the model, only for HbA1c (p = 0.036) but not FBG (p = 0.067, Figure 3).

3.3. Associations between Added Sugar Intake and the Risk of Undiagnosed T2D

With multiple adjustments, including age, sex, population, region, income, education, and smoking, compared with the lowest added sugar intake (<50.0 g/day), the ORs (95% CI) of undiagnosed T2D were 2.13 (1.22–3.72) for the 50.0–66.0 g/day group, 1.86 (1.06–3.25) for the 67.0–99.0 g/day group, and 3.52 (1.56–7.93) for the ≥100.0 g/day group (p for trend < 0.001). The association strength was not substantially changed after further adjusting for physical activity and BMI in Model 2, fruits and vegetable intake in Model 3, and hypertension plus lipid profile in Model 4 (Table 2). A sensitivity analysis was conducted among those without a clinical diagnosis of T2D. We defined undiagnosed T2D based on both FBG and HbA1c. The overall results were similar (p for trend < 0.001, Supplementary Materials Table S3).
In the stratified analysis by BMI (Table 3), the added sugar intake level was positively associated with risks of undiagnosed T2D (p for interaction = 0.001, Table 3) only in those with a BMI ≥ 26.7 kg/m2, where ORs were 6.83 (2.69–17.36) for the 50.0–66.0 g/day group, 4.72 (1.91–11.64) for the ≥67.0 g/day group (p for trend = 0.037), but not in those with BMI < 26.7 kg/m2. Interestingly, when stratified by population type (refugees or citizens), the added sugar intake level was positively associated with risks of undiagnosed T2D (p for interaction = 0.047, Table 3) only in refugees, where ORs were 5.46 (1.75–17.08) for the 50.0–66.0 g/day group, 5.09 (1.64–15.84) for the ≥67.0 g/day group (p for trend = 0.043), but not in citizens. Meanwhile, in the sensitivity analysis, we defined undiagnosed T2D based on both FBG and HbA1c, and the findings were similar (Supplementary Materials Table S4).

4. Discussion

In the present study, we estimated the prevalence of T2D among Gaza Palestinian adults, and it showed that higher added sugar consumption is strongly associated with the risk of undiagnosed T2D. This association was stronger among those with a higher BMI or refugees.
The estimated prevalence of diagnosed T2D was 45.2%, higher than a report on the prevalence of T2D by UNRWA (15.7%) [7], which serves only refugees, while our study included both refugees and citizens. Overall, T2D is a considerable burden on the Gazans, in light of the daily living crises that all Gazans live in [34]. Such crises include high poverty, low wages, and unhealthy camp housing [35] experienced by the Gaza residents, especially refugees [12,36]. Furthermore, the long durable siege in the Gaza Strip since 2006 [37], in addition to the three wars in Gaza (2008/2009, 2012, and 2014) [38], have significantly impacted the health sector and the quality healthcare services [39]. Those traumatic life events might make the Palestinians experience prolonged stress-related disorders [40], leading to neuroendocrine dysfunction and increasing the risk of disruption in pancreatic β cells, insulin sensitivity, and insulin secretion [41], or chronic low-grade inflammation [42], contributing to the development of T2D [43,44,45]. On the other hand, it is already mentioned in the literature that aging influences the health-related quality of life for diabetic patients [46]. A survey also suggested that T2D patients aged 65 to 84 years had a poorer health-related quality of life (HRQOL) than the general population, especially regarding different aspects of physical functioning and emotional disturbances [47]. Additionally, older adults with diabetes have unique issues that may lead to deterioration in their self-care behaviors [48].
Our study showed that glycaemic control was suboptimal for patients diagnosed with T2D, and the highest uncontrolled glycaemic rate was 50.0% (95% CI 37–63) in Gaza City. The lowest was 32.3% (95% CI 24–42) in Khan Younis. It is reasonable that Gaza City is considered an urbanized City compared to the rest of the Gaza Strip regions, while Khan Younis is a Palestinian refugee camp [49]. Most of the residents in Gaza City are citizens, not refugees [50]. Overall, it has appeared that citizens are relatively less successful in controlling glycaemia than refugees (Figure 2). One of the most important reasons might be that Palestinian citizens are less likely to have health insurance. In contrast, Palestinian refugees receive more health services over Palestinian citizens [51,52]. Similarly, in a study among 1308 diagnosed T2D seeking care at four main PHCs in the Southern West Bank of Palestine, only 16.1% had HbA1c < 53 mmol/mol (<7.0%) [5], showing a very poor glycaemic control in line with our results. In another cross-sectional study in the Gaza Strip (n = 369 T2D patients), only one-fifth of the patients had good glycaemic control (HbA1c < 53 mmol/mol (<7.0%)) [53]. The poor glycaemic control in our study might also be related to the presence of suboptimal diets, extremely low physical activity, and the lack of income [53,54,55].
Furthermore, even at the health system in Gaza, there is a shortage of essential drugs, due to the blockade’s impact on Gaza [56]. The stock of medications in Gaza mainly depends on foreign support for securing treatment, which is not permanent [57].
We found that Palestinian adults in Gaza consumed approximately 61.0 g/day of added sugar per household member, which is above the recommendations of the American Heart Association [21]. In a community-based cross-sectional study conducted among Palestinians (aged 30–65 years) in the West Bank, the annual intake of added sugar per household member was 37.8 kg (≈105.0 g/day), and added sugar intake contributed to 13–14% daily total energy intake among Palestinians (aged 30–65 years) in the West Bank, according to the results of a community-based cross-sectional study [20]. Additionally, an ecological epidemiology study reported a strong positive correlation between per capita added sugar consumption and the prevalence of T2D, whereas Asian countries had the highest correlation coefficients [58]. Therefore, as far as we know, our study is the first study reporting a direct association between pure sugar intake and diabetes risk.
There are growing concerns about the possible health threat posed by high added sugar intake, as evidenced by the latest American Dietary Guidelines [59]. The excess of sugar intake is an emerging factor in the current epidemic of obesity and metabolic-associated diseases [60,61]. Interestingly, we observed a stronger association between added sugar intake with undiagnosed T2D among refugees. Refugees in Gaza consume relatively more sugar than the citizens (Table 3 and Supplementary Materials Table S4), despite their poor living and nutritional conditions [62]. About 72% of the Palestinian refugees in the Gaza Strip receive food supply aids monthly or every three months from humanitarian agencies, mainly from the UNRWA, World Food Programme, and charity organizations to secure their food or part of their essential food [18,63]. Such food aids from just UNRWA to each member in one household include commodities of sugar, flour, cooking oil, powdered milk, and others [64], and all of these quantities are doubled by UNRWA, for the benefit of the most miserable refugee families [51]. High consumption of added sugar exceeds the energy requirement of refugees who have limited physical activity levels, which may result in increased de novo lipogenesis [64], increased free fatty acids [65,66,67], central obesity, and insulin resistance [68,69]. More studies are needed to elucidate the mechanisms.
In our stratified analysis by BMI, added sugar intake level was strongly associated with undiagnosed T2D among those without a clinical diagnosis of T2D, with higher BMI (≥26.7 kg/m2) rather than those with a lower BMI (<26.7 kg/m2). The concern here is developing to T2D among those without a clinical diagnosis of T2D, with a higher BMI and consuming more sugar than those with a normal BMI. Patients with a higher BMI have the chance of elevation of free fatty acids (FFAs), mainly due to the release of increased fat mass [70]. Further studies are needed to elucidate whether and how obesity may amplify the effects of excess added sugar intake on insulin action.
Our study has some limitations: First, cross-sectional data do not explore the causal pathways that underlie the reported association. Second, selection bias is possible, as we recruited only those visitors who regularly visited the PHCs. Third, recall bias is also possible by using food-frequency questionnaires. Despite the above limitations, this is the first study that focused on a unique population (exposed to exceptional circumstances of war, instability, and ongoing violence) to determine the prevalence of T2D among refugees and citizens.

5. Conclusions

This study involved both citizen and refugee adults aged 40 or older in Gaza Palestinians who had regularly visited the PHCs, with an estimated prevalence of 45.2% and 16.8%, respectively, for diagnosed and undiagnosed T2D. Our study indicated that 44.1% of the population had added sugar intake above 50 g/day, with an average consumption of 60.6 g/day per household member. Furthermore, our findings also showed that higher consumption of added sugar is associated with a higher risk of undiagnosed T2D, particularly in refugees or those with higher BMI. Therefore, mass-level educational awareness campaigns are needed to provide education to Palestinians about diabetes, balanced diet, and diet-related diseases. Moreover, effective strategies should also be undertaken to reduce the diabetes burden among Gaza residents, focusing on sugar intake.

Supplementary Materials

The following are available online at https://www.mdpi.com/1660-4601/17/22/8594/s1. Table S1: Characteristics of study participants, according to population (refugees and citizens). Table S2: Adjusted odds ratio (95% CI) of the T2D for the sample population participants by average daily added sugar intake (n = 1000). Table S3: Adjusted OR (95% CI) of undiagnosed T2D by added sugar intake level after including HbA1c in the definition of outcome (n = 548). Table S4: Adjusted OR (95% CI) of undiagnosed T2D by added sugar intake level, after including HbA1c in the definition of outcome (n = 548). Figure S1: The selected primary healthcare centers (PHCs) across the Gaza Strip governorates.

Author Contributions

Conceptualization, M.J. and X.L.; methodology, M.J. and A.A.; software, M.J. and X.L.; formal analysis, M.J.; writing—original draft preparation, M.J.; writing—review and editing, M.J., X.L., and Z.S., M.M. and Y.W.; visualization, X.L.; supervision, Y.W.; project administration, Y.W.; funding acquisition, Y.W. All authors have read and agreed to the published version of the manuscript.

Funding

This research was funded by the China Medical Board, grant number 16-262; National Natural Science Foundation of China, grant numbers 81903386 and 82011530197; and the Chinese National Key Research and Development Program, grant numbers 2017YFC0907200 and 2017YFC0907201.

Acknowledgments

We would like to thank the study participants who participated in the data collection and thank our teamwork collaborators in Gaza. Special thanks to the members of the Ministry of Health, Gaza, for their cooperation.

Conflicts of Interest

The authors declare no conflict of interest.

References

  1. Van der Berg, J.D.; Stehouwer, C.D.; Bosma, H.; van der Velde, J.H.; Willems, P.J.; Savelberg, H.H.; Schram, M.T.; Sep, S.J.; van der Kallen, C.J.; Henry, R.M. Associations of total amount and patterns of sedentary behaviour with type 2 diabetes and the metabolic syndrome: The maastricht study. Diabetologia 2016, 59, 709–718. [Google Scholar] [CrossRef] [PubMed] [Green Version]
  2. Zheng, Y.; Ley, S.H.; Hu, F.B. Global aetiology and epidemiology of type 2 diabetes mellitus and its complications. Nat. Rev. Endo. 2018, 14, 88. [Google Scholar] [CrossRef] [PubMed]
  3. Zimmet, P.Z.; Magliano, D.J.; Herman, W.H.; Shaw, J.E. Diabetes: A 21st century challenge. Lancet Diab. Endo. 2014, 2, 56–64. [Google Scholar] [CrossRef]
  4. Farmanfarma, K.K.; Ansari-Moghaddam, A.; Zareban, I.; Adineh, H. Prevalence of type 2 diabetes in middle–east: Systematic review& meta-analysis. Primary Care Diabetes 2020, 14. [Google Scholar] [CrossRef]
  5. Al-Halaweh, A.A.; Davidovitch, N.; Almdal, T.P.; Cowan, A.; Khatib, S.; Nasser-Eddin, L.; Baradia, Z. Prevalence of type 2 diabetes mellitus complications among palestinians with t2dm. Diabetes Metab. Syndr. 2017, 11, 783–787. [Google Scholar] [CrossRef]
  6. Mataria, A.; Khatib, R.; Donaldson, C.; Bossert, T.; Hunter, D.J.; Alsayed, F.; Moatti, J.P. The health-care system: An assessment and reform agenda. Lancet 2009, 373, 1207–1217. [Google Scholar] [CrossRef]
  7. UNRWA. Annual Report of United Nations Relief and Works Agency; United Nations Relief and Works Agency for Palestine Refugees in the Near East: Amman, Jordan, 2018; p. 77. [Google Scholar]
  8. El Sharif, N.; Samara, I.; Titi, I.; Awartani, A. Compliance with and knowledge about diabetes guidelines among physicians and nurses in palestine. East Mediterr. Health J. 2011, 21, 791–802. [Google Scholar] [CrossRef]
  9. Feldman, I. Difficult distinctions: Refugee law, humanitarian practice, and political identification in gaza. Cult. Anthropol. 2007, 22, 129–169. [Google Scholar] [CrossRef]
  10. De Jong, A. The gaza freedom flotilla: Human rights, activism and academic neutrality. Soc. Mov. Stud. 2012, 11, 193–209. [Google Scholar] [CrossRef]
  11. PCBS. The international day of refugees 2019. Available online: http://www.badil.org/phocadownloadpap/Statistics/(PCBS)The-International-Day-of-Refugees-2019-eng.pdf (accessed on 28 May 2019).
  12. Feldman, I. The humanitarian condition: Palestinian refugees and the politics of living. Int. Human. Rights. J. 2012, 3, 155–172. [Google Scholar] [CrossRef]
  13. Bank, W. Gaza strip. In Middle East Contemporary Survey; UK Border Security: London, UK, 2010. [Google Scholar]
  14. Ziadni, M.; Hammoudeh, W.; Rmeileh, N.M.A.; Hogan, D.; Shannon, H.; Giacaman, R. Sources of human insecurity in post-war situations: The case of gaza. J. Hum. Secur. 2011, 7. [Google Scholar] [CrossRef]
  15. Giacaman, R.; Khatib, R.; Shabaneh, L.; Ramlawi, A.; Sabri, B.; Sabatinelli, G.; Khawaja, M.; Laurance, T. Health status and health services in the occupied palestinian territory. Lancet 2009, 373, 837–849. [Google Scholar] [CrossRef]
  16. Murray, C.J.; Abraham, J.; Ali, M.K.; Alvarado, M.; Atkinson, C.; Baddour, L.M.; Bartels, D.H.; Benjamin, E.J.; Bhalla, K.; Birbeck, G. The state of us health, 1990–2010: Burden of diseases, injuries, and risk factors. JAMA 2013, 310, 591–606. [Google Scholar] [CrossRef] [PubMed] [Green Version]
  17. Danaei, G.; Ding, E.L.; Mozaffarian, D.; Taylor, B.; Rehm, J.; Murray, C.J.; Ezzati, M. The preventable causes of death in the united states: Comparative risk assessment of dietary, lifestyle, and metabolic risk factors. PLoS Med 2009. [Google Scholar] [CrossRef]
  18. Abdeen, Z.; Greenough, G.; Shahin, M.; Tayback, M. Nutritional Assessment of the West Bank and Gaza Strip; Ministry of Health, Al Quds University, US Agency for International Development and Care International: Jerusalem, Israel, 2002.
  19. Sweileh, W.M.; Sawalha, A.F.; Al-Jabi, S.W.; Zyoud, S.H.; Abutaha, A.S. Global research trends of literature in sugar-sweetened beverages: 2000–2016. Indian J. Health. Sci. Biomed. Res. 2018, 11, 191–221. [Google Scholar]
  20. Stene, L.; Giacaman, R.; Abdul-Rahim, H.; Husseini, A.; Norum, K.; Holmboe-Ottesen, G. Food consumption patterns in a palestinian west bank population. Eur. J. Clin. Nutr. 1999, 53, 953–958. [Google Scholar] [CrossRef] [Green Version]
  21. Johnson, R.K.; Appel, L.J.; Brands, M.; Howard, B.V.; Lefevre, M.; Lustig, R.H.; Sacks, F.; Steffen, L.M.; Wylie-Rosett, J. Dietary sugars intake and cardiovascular health: A scientific statement from the american heart association. Circulation 2009, 120, 1011–1020. [Google Scholar] [CrossRef]
  22. WHO. Healthy Diet; World Health Organization, Regional Office for the Eastern Mediterranean: Geneva, Switzerland, 2019. [Google Scholar]
  23. Guideline, W. Sugars Intake for Adults and Children; World Health Organization: Geneva, Switzerland, 2015. [Google Scholar]
  24. Winkley, K.; Stahl, D.; Chalder, T.; Edmonds, M.E.; Ismail, K. Risk factors associated with adverse outcomes in a population-based prospective cohort study of people with their first diabetic foot ulcer. J. Diabetes Complicat. 2007, 21, 341–349. [Google Scholar] [CrossRef]
  25. Navarro-Flores, E.; Morales-Asencio, J.M.; Cervera-Marín, J.A.; Labajos-Manzanares, M.T.; Gijon-Nogueron, G. Development, validation and psychometric analysis of the diabetic foot self-care questionnaire of the university of malaga, spain (dfsq-uma). J. Tissue Viability 2015, 24, 24–34. [Google Scholar] [CrossRef]
  26. Basiri, R.; Spicer, M.T.; Levenson, C.W.; Ormsbee, M.J.; Ledermann, T.; Arjmandi, B.H. Nutritional supplementation concurrent with nutrition education accelerates the wound healing process in patients with diabetic foot ulcers. Biomedicines 2020, 8, 263. [Google Scholar] [CrossRef]
  27. Ministry of Health, PHIC. The Annual Report of the Primary Healthcare Centers in Gaza Strip 2018; Ministry of Health: Gaza, Palestine, 2019.
  28. PCBS. Palestine in Figures; Palestinian Central Bureau of Statistics: Ramallah, Palestine, 2015. [Google Scholar]
  29. International Physical Activity Questionnaire: Long Last 7 Days Self-Administered Format. 2012. Available online: http://www.sdp.univ.fvg.it/sites/default/files/IPAQ_English_self-admin_long.pdf (accessed on 15 June 2019).
  30. C.K.B. Resurvey Data: 2nd Resurvey Questionnaire. Available online: https://www.ckbiobank.org/site/Data+Access (accessed on 11 June 2019).
  31. WHO. Diet, Nutrition and the Prevention of Chronic Diseases; World Health Organization: Geneva, Switzerland, 2003. [Google Scholar]
  32. Ross, R.; Berentzen, T.; Bradshaw, A.J.; Janssen, I.; Kahn, H.S.; Katzmarzyk, P.T.; Kuk, J.; Seidell, J.; Snijder, M.; Sørensen, T. Does the relationship between waist circumference, morbidity and mortality depend on measurement protocol for waist circumference? Obesity Rev. 2008, 9, 312–325. [Google Scholar] [CrossRef] [PubMed]
  33. Association, A.D. Diagnosis and classification of diabetes mellitus. Diabet. Care 2014, 37, 81–90. [Google Scholar] [CrossRef] [PubMed] [Green Version]
  34. Hazboun, N.N. The Resettlement of the Palestinian Refugees of the Gaza Strip. Ph.D. Thesis, University of Leeds, Leeds, UK, 1994. [Google Scholar]
  35. Kurz, A.; Dekel, U.; Berti, B. The Crisis of the Gaza Strip: A Way Out; Kurz, A., Dekel, U., Eds.; Institute for National Security Studies: Tel Aviv, Israel, 2018. [Google Scholar]
  36. Devi, S. Gaza crisis continues to worsen as all eyes turn to lebanon. Lancet 2006, 368, 353–354. [Google Scholar] [CrossRef]
  37. Thabet, A.; Abu Tawahina, A.; El Sarraj, E.; Vostanis, P. Siege and quality of life of palestinians in the gaza strip. Arab. J. 2008, 20, 157–164. [Google Scholar]
  38. Filiu, J.P. The twelve wars on gaza. J. Palest. Stud. 2014, 44, 52–60. [Google Scholar] [CrossRef] [Green Version]
  39. El Sharif, N.; Imam, A. Current Status of Diabetes in Palestine: Epidemiology, Management, and Healthcare System. In Handbook of Healthcare in the Arab World; Laher, I., Ed.; Springer: Cham, Switzzerland, 2019. [Google Scholar]
  40. Oyola, M.G.; Handa, R.J. Hypothalamic–pituitary–adrenal and hypothalamic–pituitary–gonadal axes: Sex differences in regulation of stress responsivity. Stress 2017, 20, 476–494. [Google Scholar] [CrossRef]
  41. di Dalmazi, G.; Pagotto, U.; Pasquali, R.; Vicennati, V. Glucocorticoids and type 2 diabetes: From physiology to pathology. J. Nutr. Metab. 2012, 12. [Google Scholar] [CrossRef] [PubMed] [Green Version]
  42. Pitsavos, C.; Tampourlou, M.; Panagiotakos, D.B.; Skoumas, Y.; Chrysohoou, C.; Nomikos, T.; Stefanadis, C. Association between low-grade systemic inflammation and type 2 diabetes mellitus among men and women from the attica study. Rev. Diabet. Stud. 2007, 4, 98–104. [Google Scholar] [CrossRef] [PubMed] [Green Version]
  43. Hackett, R.A.; Steptoe, A. Type 2 diabetes mellitus and psychological stress—a modifiable risk factor. Nat. Rev. Endocrinol. 2017, 13, 547–560. [Google Scholar] [CrossRef] [PubMed]
  44. Kelly, S.J.; Ismail, M. Stress and type 2 diabetes: A review of how stress contributes to the development of type 2 diabetes. Annu. Rev. Public Health 2015, 36, 441–462. [Google Scholar] [CrossRef] [Green Version]
  45. Ellulu, M.S. Obesity, hypertension, and type-2 diabetes mellitus: The interrelationships and the determinants among adults in Gaza city, Palestine. Osong. Pub. Health Res. Perspect. 2018, 9, 289–298. [Google Scholar] [CrossRef] [PubMed]
  46. Baptista, L.C.; Dias, G.; Souza, N.R.; Veríssimo, M.T.; Martins, R.A. Effects of long-term multicomponent exercise on health-related quality of life in older adults with type 2 diabetes: Evidence from a cohort study. Qual. Life. Res. 2017, 26, 2117–2127. [Google Scholar] [CrossRef] [PubMed]
  47. Wändell, P.E.; Tovi, J. The quality of life of elderly diabetic patients. J. Diab. Complicat. 2000, 14, 25–30. [Google Scholar] [CrossRef]
  48. Weinger, K.; Beverly, E.A.; Smaldone, A. Diabetes self-care and the older adult. West. J. Nurs. Res. 2014, 36, 1272–1298. [Google Scholar] [CrossRef] [PubMed] [Green Version]
  49. WTO. Making Tourism more Sustainable: A Guide for Policy Makers; World Tourism Organization Publications: Madrid, Spain, 2005. [Google Scholar]
  50. Abukashif, Y.J.; Riza, M. Urban development of conflict zones: The case of Gaza city. Open House Int. 2019, 2, 45–51. [Google Scholar]
  51. UNRWA. UNRWA Annual Operational Report 2019 for the Reporting Period 01 January–31 December 2019; United Nations Relief and Works Agency for Palestine refugees in the Near East (UNRWA): Amman, Jordan, 2019. [Google Scholar]
  52. Shahin, Y.; Kapur, A.; Seita, A. Diabetes care in refugee camps: The experience of unrwa. Diab. Res. Clin. Pract. 2015, 108, 1–6. [Google Scholar] [CrossRef]
  53. Radwan, M.; Elsous, A.; Al-Sharif, H.; Abu Mustafa, A. Glycemic control among primary care patients with type 2 diabetes mellitus in the gaza strip, palestine. Ther. Adv. Endocrinol. Metab. 2018, 9, 3–14. [Google Scholar] [CrossRef]
  54. Edelman, S.V.; Polonsky, W.H. Type 2 diabetes in the real world: The elusive nature of glycemic control. Diab. Care 2017, 40, 1425–1432. [Google Scholar] [CrossRef] [Green Version]
  55. Almadhoun, M.; Alagha, H. Assessment of medication adherence and its association with glycemic control among type-2 diabetes mellitus patients in gaza–palestine. Clin. Exp. Pharmacol. 2018, 3, 1–10. [Google Scholar]
  56. Horton, R. Offline: The health of palestinians is a global responsibility. Lancet 2018, 392, 1612. [Google Scholar] [CrossRef]
  57. Shabab, Q.S. The gaza health system. AMSA J. Glob. Health 2018, 12, 6–9. [Google Scholar]
  58. Weeratunga, P.; Jayasinghe, S.; Perera, Y.; Jayasena, G.; Jayasinghe, S. Per capita sugar consumption and prevalence of diabetes mellitus–global and regional associations. BMC Public Health 2014, 14. [Google Scholar] [CrossRef] [PubMed] [Green Version]
  59. Millen, B.E.; Abrams, S.; Adams-Campbell, L.; Anderson, C.A.; Brenna, J.T.; Campbell, W.W.; Clinton, S.; Hu, F.; Nelson, M.; Neuhouser, M.L. The 2015 dietary guidelines advisory committee scientific report: Development and major conclusions. Adv. Nutr. 2016, 7, 438–444. [Google Scholar] [CrossRef] [PubMed]
  60. Malik, V.S.; Schulze, M.B.; Hu, F.B. Intake of sugar-sweetened beverages and weight gain: A systematic review. Am. J. Clin. Nutr. 2006, 84, 274–288. [Google Scholar] [CrossRef]
  61. Bray, G.A.; Popkin, B.M. Dietary sugar and body weight: Have we reached a crisis in the epidemic of obesity and diabetes?: Health be damned! Pour on the sugar. Diab. Care 2014, 37, 950–956. [Google Scholar] [CrossRef] [Green Version]
  62. Lapeyre, F.; Al Husseini, J.J.; Bocco, R.; Brunner, M.; Zureik, E. The living conditions of the palestine refugees registered with unrwa in jordan, lebanon, the syrian arab republic, the gaza strip and the west bank. Lebanon, the Syrian Arab Republic, the Gaza Strip and the West Bank. SSRN Electron. J. 2011, 16, 116. [Google Scholar]
  63. Williams, A. Unrwa and the occupied territories. J. Refug. Stud. 1989, 2, 156–162. [Google Scholar] [CrossRef]
  64. Riccardi, G.; Giacco, R.; Rivellese, A. Dietary fat, insulin sensitivity and the metabolic syndrome. Clin. Nutr. 2004, 23, 447–456. [Google Scholar] [CrossRef]
  65. Belfort, R.; Mandarino, L.; Kashyap, S.; Wirfel, K.; Pratipanawatr, T.; Berria, R.; DeFronzo, R.A.; Cusi, K. Dose-response effect of elevated plasma free fatty acid on insulin signaling. Diabetes 2005, 54, 1640–1648. [Google Scholar] [CrossRef] [Green Version]
  66. Boden, G.; Shulman, G. Free fatty acids in obesity and type 2 diabetes: Defining their role in the development of insulin resistance and β-cell dysfunction. Eur. J. Clin. Investig. 2002, 32, 14–23. [Google Scholar] [CrossRef]
  67. Paolisso, G.; Tataranni, P.; Foley, J.; Bogardus, C.; Howard, B.; Ravussin, E. A high concentration of fasting plasma non-esterified fatty acids is a risk factor for the development of niddm. Diabetologia 1995, 38, 1213–1217. [Google Scholar] [CrossRef] [PubMed]
  68. Item, F.; Konrad, D. Visceral fat and metabolic inflammation: The portal theory revisited. Obes. Rev. 2012, 13, 30–39. [Google Scholar] [CrossRef] [PubMed] [Green Version]
  69. Bergman, R.N.; Kim, S.P.; Catalano, K.J.; Hsu, I.R.; Chiu, J.D.; Kabir, M.; Hucking, K.; Ader, M. Why visceral fat is bad: Mechanisms of the metabolic syndrome. Obesity 2006, 14, 16–19. [Google Scholar] [CrossRef] [PubMed]
  70. Cusi, K. The role of adipose tissue and lipotoxicity in the pathogenesis of type 2 diabetes. Curr. Diab. Rep. 2010, 10, 306–315. [Google Scholar] [CrossRef]
Figure 1. Prevalence of diagnosed and undiagnosed T2D by (a) sex, (b) population, (c) age groups, (d) region, and (e) working status.
Ijerph 17 08594 g001
Figure 2. Uncontrolled glycaemic rate of T2D among diagnosed T2D by (a) sex, (b) region, (c) population, and (d) HbA1c values category.
Ijerph 17 08594 g002
Figure 3. Adjusted means of (a) FBG and (b) HbA1c by added sugar intake level among those without a clinical diagnosis of T2D. Model 1, Adjusted for age, sex, population, region, income, education, and smoking; Model 2, Model 1 plus physical activity and body mass index.
Ijerph 17 08594 g003
Table 1. Characteristics of study participants.a.
VariableAll
n = 1000
Diagnosed T2D
n = 452
Undiagnosed T2D
n = 168
Non-Cases
n = 80
p-Value
Age, years59.2 (7.5)59.1 (7.7)58.5 (7.3)59.4 (7.5)0.455
Women468 (46.8%)217 (46.4%)83 (17.7%)168 (35.9%)0.034
Study regions
North
220 (22.0%)101 (22.3%)32 (19.1%)87 (22.9%)0.286
Gaza122 (12.2%)60 (13.3%)26 (15.5%)36 (9.5%)
Midzone214 (21.4%)103 (22.8%)25 (14.8%)86 (22.6%)
Khan Younis223 (22.3%)99 (21.9%)41 (24.4%)83 (21.8%)
Rafah221 (22.1%)89 (19.7%)44 (26.2%)88 (23.2%)
Refugees422 (42.2%)185 (40.9%)76 (45.2%)161 (42.4%)0.625
Family size6.9 (1.5)6.9 (1.6)6.7 (1.5)6.9 (1.5)0.099
Married844 (84.4%)373 (82.5%)147 (87.5%)324 (85.3%)0.386
Education
Low
451 (45.1%)208 (46.0%)73 (43.4%)170 (44.7%)0.873
Moderate295 (29.5%)134 (29.7%)47 (28.0%)114 (30.0%)
High254 (25.4%)110 (24.3%)48 (28.6%)96 (25.3%)
Employed117 (11.7%)48 (10.6%)20 (11.9%)49 (12.8%)0.594
Household income (NIS) 0.287
<50051 (5.1%)26 (5.7%)11 (6.5%)14 (3.7%)
500–100041 (4.1%)23 (5.1%)9 (5.4%)9 (2.4%)
1000–150048 (4.8%)24 (5.3%)8 (4.8%)16 (4.2%)
>15006 (0.6%)3 (0.7%)2 (1.2%)1 (0.3%)
No constant income854 (85.4%)376 (83.2%)138 (82.1%)340 (89.4%)
Having family history of NCDs b468 (46.8%)211 (46.7%)83 (49.4%)174 (45.8%)0.735
Physical activity 0.044
Low654 (65.4%)306 (67.7%)102 (60.7%)246 (64.7%)
Moderate247 (24.7%)99 (21.9%)42 (25.0%)106 (27.9%)
High99 (9.9%)47 (10.4%)24 (14.3%)28 (7.4%)
T2D Medications
Oral hypoglycaemic drugs225 (49.7%)225 (49.7%)--
Insulin171 (37.8%)171 (37.8%)--
Both56 (12.4%)56 (12.4%)--
Current cigarette’s smoking446 (44.6%)210 (46.5%)66 (39.3%)170 (44.7%)0.279
BMI, kg/m228.1 (3.7)28.2 (3.7)28.5 (3.5)27.9 (3.7)0.189
Waist circumference, cm105.0 (14.7)105.5 (14.8)105.2 (14.7)104.4 (14.6)0.547
Fasting glucose, mmol/L9.4 (4.7)12.5 (4.6)10.0 (3.1)5.6 (1.0)<0.001
HbA1c, mmol/mol48.4 (18.8)60.5 (17.3)50.5 (14.4)32.9 (8.1)<0.001
HbA1c, %6.6 (1.7)7.7 (1.6)6.7 (1.3)5.2 (0.7)<0.001
Total cholesterol, mmol/L5.7 (1.6)6.2 (1.7)5.6 (1.3)5.1 (1.4)<0.001
Triglycerides, mmol/L2.1 (0.8)2.3 (0.8)2.0 (0.6)1.8 (0.7)<0.001
HDL, mmol/L1.1 (0.2)1.0 (0.2)1.1 (0.3)1.1 (0.2)<0.001
LDL, mmol/L4.4 (1.3)4.6 (1.3)4.2 (1.2)4.2 (1.2)<0.001
Systolic blood pressure, mmHg137.4 (21.4)137.7 (21.1)137.2 (20.9)137.1 (21.9)0.916
Diastolic blood pressure, mmHg85.6 (7.2)85.7 (7.1)85.5 (7.4)85.8 (7.3)0.935
Added sugar intake, g/day60.6 (22.4)60.1 (22.0)59.3 (23.4)61.8 (22.5)0.421
Fruits consumption, g/day163.2 (49.3)161.4 (49.4)164.8 (48.2)164.5 (49.8)0.591
Vegetable consumption, g/day282.3 (59.6)278.8 (59.9)285.1 (61.8)285.0 (58.4)0.267
a Data are presented as mean (SD) for continuous measures and n (%) for categorical measures. b NCDs, non-communicable diseases, such as stroke, cardiovascular disease, cancer, diabetes mellitus, and hypertension, for father and mother together. NIS, New Israeli Shekel; BMI, body mass index; HbA1c, haemoglobin A1c; HDL, high-density lipoprotein; LDL, low-density lipoprotein; T2D, type 2 diabetes.
Table 2. Adjusted odds ratio (95% CI) of undiagnosed T2D by average daily added sugar intake (n = 548).
Added Sugar Intake Level
g/day
No. of Participants
n (%)
Model 1Model 2Model 3Model 4
<50.0 g/day121 (22.1%)1.001.001.001.00
50.0–66.0 g/day183 (33.4%)2.13 (1.22–3.72)2.01 (1.13–3.59)2.01 (1.12–3.59)1.98 (1.09–3.60)
67.0–99.0 g/day199 (36.3%)1.86 (1.06–3.25)1.59 (0.88–2.87)1.60 (0.89–2.88)1.54 (0.84–2.81)
≥100.0 g/day45 (8.2%)3.52 (1.56–7.93)2.72 (1.15–6.39)2.72 (1.15–6.39)2.71 (1.12–6.54)
p for trend <0.001<0.001<0.001<0.001
Model 1, adjusted for age, sex, population, region, income, education, and smoking; Model 2, Model 1 plus physical activity and body mass index; Model 3, Model 2 plus fruits and vegetable intake; Model 4, Model 3 plus hypertension and lipid profile (total cholesterol, triglycerides, HDL, and LDL).
Table 3. Odds ratio (OR) (95% CI) of undiagnosed T2D by added sugar intake level and other risk factors (n = 548).
Variable
N (%)
<50.0 g/day
OR (95% CI) n (%)
50.0–66.0 g/day
OR (95% CI)
n (%)
≥67.0 g/day
OR (95% CI)
n (%)
p-Value trendp-Value interaction
Sex 0.143
Men1.001.54 (0.67–3.55)2.04 (0.93–4.47)0.058
310 (56.6%)60 (19.4%)104 (33.5%)146 (47.1%)
Women1.002.67 (1.19–6.02)1.42 (0.63–3.18)0.989
238 (43.4%)61 (25.6%)79 (33.2%)98 (41.2%)
Age (Median) 0.318
<59 years1.001.69 (0.71–4.03)1.64 (0.73–3.69)0.044
259 (47.3 %)59 (22.8%)79 (30.5%)121 (46.7%)
≥59 years1.001.41 (0.62–3.19)1.06 (0.46–2.40)0.679
289 (52.7%)62 (21.4%)104 (36.0%)123 (42.6%)
BMI (Median) 0.001
<26.7 kg/m21.001.94 (0.75–5.00)2.17 (0.84–5.34)0.808
216 (39.4%)52 (24.1%)70 (32.4%)94 (43.5%)
≥26.7 kg/m21.006.83 (2.69–17.36)4.72 (1.91–11.64)0.037
332 (60.6%)69 (20.7%)113 (34.1%)150 (45.2%)
Population 0.047
Refugees1.005.46 (1.75–17.08)5.09 (1.64–15.84)0.043
237 (43.2%)52 (21.9%)77 (32.5%)108 (45.6%)
Citizens1.004.93 (1.61–12.26)3.98 (1.33–11.95)0.666
311 (56.8%)69 (22.2%)106 (34.1%)136 (43.7%)
Variables adjusted for age, sex, population, region, income, education, smoking, physical activity, body mass index, fruits and vegetable intake, hypertension, and lipid profile (total cholesterol, triglycerides, HDL, and LDL).
Publisher’s Note: MDPI stays neutral with regard to jurisdictional claims in published maps and institutional affiliations.

