Abstract
Prevalence of fluorosis is a worldwide public health issue, especially in the West Azerbaijan province of Iran. The aim of this study was to investigate fluoride concentration in drinking water resources within Maku city, in both the warm and cold seasons, to perform a health risk assessment. Fluoride were measured using UV-visible spectrophotometry. The spatial distribution was calculated by the software ArcGIS and Hazard Quotients (HQs) were calculated according to the US EPA method. The fluoride concentrations ranged between 0.29 to 6.68 and 0.1 to 11.4 mg/L in the cold and warm seasons, respectively. Based on this report, 30.64 and 48.15% of the samples revealed a fluoride level higher than the permissible level in the cold and warm seasons, respectively. Moreover, results showed that the HQ value in the warm season for different age groups was higher than the HQ value in the cold season. In both seasons, the non-carcinogenic risks of fluoride for the four exposed populations varied according to the order: children > teenagers > adults > infants. The HQ values for three age groups (children, teenager and adults) for both seasons were higher than 1 with a high risk of fluorosis. The results of this study, support the requests that government authorities better manage water supplies to improve health quality.
1. Introduction
Population growth, industrialization of societies, and increased droughts have led both a reduction of groundwater levels and increased pollution in drinking water sources. Among the pollutants of drinking water sources heavy metals, pesticides, nitrates, radon and fluoride can be mentioned [1,2,3,4,5]. Fluoride is an essential micronutrient for humans to grow bone and teeth at an early age. The human intake of fluoride occurs through water, soil and air but, among these, the main source of fluoride is drinking water [6,7,8]. Since fluoride is 100% water-soluble, the daily intake of fluoride depends on both concentration of fluoride in the drinking water and the daily intake of the same drinking water [7]. Fluoride intake is beneficial for human health only in a standard concentration range defined by the World Health Organization (1.5 mg/L). However, the WHO qualified this statement by recommending the limit be adapted to local conditions such as climate, water consumption and diet [9,10]. When fluoride is lower than the safe standards, it causes corrosion and tooth decay; on the other hand, higher concentrations of fluoride (>4 mg/L) in drinking water have been linked to physiological and pathological changes, such as dental and skeletal fluorosis [11]. Many studies has been done about the effects of fluoride on human health, including blood pressure, fertility, abortion, height and weight of babies, intelligence quotient and skeletal disorders [11,12,13,14,15,16,17]. Several water resources polluted by fluoride have been reported in China, South Africa, Mexico, Argentina and Iran (Khaf, Poldasht, Shout, etc.) [5,18,19,20,21]. Studies carried out in West Azerbaijan province [15], in northwest of Iran, show that the water contamination by fluoride is endemic due to the existence of basaltic lavas, at considerable depth, affecting the Sari Sou river with releases of fluoride in its waters [15]. Mohammadi et al. reported the prevalence of endemic fluorosis evidenced by the fact skeletal fluorosis of the people who live in areas with high fluoride concentration is 18.1% higher than in individuals who live in areas with low fluoride concentration in West Azerbaijan [11]. Karimzade et al. also carried out a study on the effect of the fluoride on the intelligence quotient (IQ) of children in two similar rural communities of Azerbaijan Province in Iran with drinking water with high and low fluoride levels and the results proved there is a significant linear trend for children in the high-drinking water F region to have a lower IQ [16]. It seems that the northern areas of Azerbaijan province can be considered as an endemic area for fluoride pollution. The high level of fluoride concentrations can be attributed to different minerals in the aquifer bed, and also the physicochemical properties of water. On the other hand, in many parts of the West Azerbaijan, high concentrations of fluoride have been observed frequently. This can be linked to the weathering and leaching of fluoride-containing minerals [11].
The most common risk management strategy for local authorities is to monitor the fluoride concentrations in the drinking water, as this is commonly assumed to be the predominant way of exposure. Health risk assessments (HRAs) have become a hot issue topic since the 1990s. HRAs consider a risk value as a numerical index for quantifying the magnitude and possibility of health hazards caused by harmful elements [6,22,23]. The simplest method is the calculation of a target Hazard Quotient (HQ), where the point estimate of the measured or predicted exposure concentration is divided by the threshold or safe level determined from a dose-response relationship [24]. A HQ less than or equal to 1 indicates that adverse effects are not likely to occur, and thus can be considered to have negligible hazard. HQs greater than 1 are not statistical probabilities of harm occurring. Due to specific geographical location of Maku city in West Azerbaijan province and, due to geological characteristics of its soils, the fluoride contamination and evaluation of fluoride exposure hazard for the non-carcinogenic diseases in the area need to be studied, so the aims of this research were:
- Identify the areas where high-fluoride waters developed through a geographic information system (GIS) and,
- Calculate according to the US EPA approach for the non-carcinogenic diseases risk assessment of residents exposed to fluoride through the ground water supplies.
2. Materials and Methods
2.1. Study Area and Sampling
The Maku area lies in the north of West Azerbaijan province, in the extreme northwest of Iran. The total study area is about 2302 km2, but only 650 km2 is covered by basaltic lava flows (Figure 1). The prevailing climate of the Maku area has semi-arid characteristics. Average annual precipitation at Maku station was 289 mm. Figure 1 shows all 65 sources of drinking water, including wells, springs and rivers that supply drinking water to 95 villages in the area. The study was carried out in both warm and cold season by March to May and by June to August (2014) of one year. The location of all sampling drinking water sources was recorded using a GPS device (GPSMAP 78s, Garmin, Olathe, KS, USA) and data were collected as latitude, longitude and angular distance.
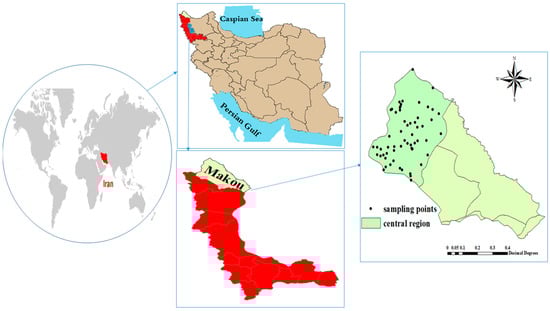
Figure 1.
Study area and sampling location.
The collected samples were taken from drinking water resources including wells and springs from 95 villages of the Maku city. A total of 130 samples were collected for two seasons in 2016. The water samples were collected in the sterile plastic containers 250 cc, which were washed twice before being sampled with the same water sampled and then transported to the laboratory. The samples were kept in refrigerator maintained at 4 °C. The sampling locations and their sources are given in Figure 1.
2.2. Determination of Fluoride in Samples of Drinking Water
Fluoride concentration of water samples was determined using the 8029 SPADNS method according to the instructions of the US EPA Standard Methods for the Examination of Water and Wastewater. The fluoride concentration was assessed using a spectrophotometer (DR-5000, Hach Company, Loveland, CO, USA) using an alternate wavelength in the 550–580 nm range.
The SPADNS method for fluoride determination involves the reaction of fluoride with a red zirconium-dye solution. The fluoride combines with part of the zirconium to form a colorless complex, thus bleaching the red color in an amount proportional to the fluoride concentration [23,24]. The method measures fluoride in the range between 0.0625–1.75 mg L−1 (r = 0.9993) and levels higher of this concentration were diluted and then measured. The obtained limits of determination (LOD) and quantification (LOQ) were 0.12 ppm and 0.37 ppm, respectively.
2.3. Calculation of Health Risk Assessment
A human health risk assessment is a method to calculate the nature and probability of adverse health effects in humans who may be exposed to chemicals in contaminated environmental media [3,25]. T quantitative health risk assessment of fluoride through consumption of drinking water was evaluated in the population of Maku city of West Azerbaijan province. Fluoride is classified, according to the IRCC classification, as a non-carcinogenic (D) group. The US Environmental Protection Agency (US EPA) provides a “Regional Screening Levels (RSLs) for Chemical Contaminants” online calculator [24,25]. For fluoride, we calculated the chronic risk for the resident population, expressed as Hazard Quotient (HQ—unitless), by consuming water. In particular, four age groups: infants (less than 2 years), children (2 to <6 years), teenagers (6 to <16 years) and adults (≥16 years) on the basis on physiological and behavioral differences according to the previous study of Yousefi et al. [24]. A HQ higher than 1 indicates the existence of a risk of developing non-carcinogenic effects during the lifetime, and it means that HQ is higher than the reference dose (RfD) defined as the maximum acceptable oral dose of a toxic substance.
Exposure to fluoride was calculated in these groups using Equation (1):
where fluoride Estimated Daily Intake (EDI) is calculated based on the daily average consumption of drinking water (Cd), concentration of F in drinking water (Cf) and body weight (Bw).
EDI is expressed in units of mg/kg BW/day. The water consumption data and body weight were estimated based on a validated questionnaire administered to the target groups (infants, children, teenager and adults). The average water consumption rates in infants (less than 2 years), children (2–6 years), teenagers (6–16 years) and adults (≥16 years) were 0.08, 0.85, 2 and 2.5 L day−1, respectively. Body weight of target groups were considered 10, 15, 50 and 78 kg, respectively (Table 1).

Table 1.
Parameters used in the present study for Hazard Quotient (HQ) calculations.
The non-carcinogenic risk of fluoride to human health can be expressed as hazard quotient (HQ) using Equation (2) [25]:
where RfD indicates the reference dose. According to IRIS, the amount of RfD for fluorine (mg/kg/day) is 0.06 (USEPA, IRIS U), HQ indicates a risk level indicator for non-cancerous substances (HQ > 1 indicates adverse health effects are possible or dangerous conditions and HQ <1 indicating safe conditions for sensitive populations).
2.4. GIS
One of the most common methodologies for assessing variations in water geochemistry is geographic information system (GIS) which is a computer system for managing spatial data [26]. In this work the ArcGIS software (ESRI, Redlands, CA, USA) was used.
2.5. Statistical Analysis
All descriptive statistics such as average, standard deviation, minimum and maximum for the present study were calculated by using the Excel 2016 software (Microsoft, Redmond, WA, USA). Statistical analysis such as one-way ANOVA test analysis was done using IBM SPSS Statistics for Windows (Version 24.0, Release 2016, IBM Corp., Armonk, NY, USA). p-Values less than 0.05 considered statistically significant.
3. Results
3.1. Data Summary
The data concerning the population and type of source of drinking water of villages in the study area is presented in Table 2.
Table 2.
Summary of the population and type of source drinking water of villages in the study area (Maku).
3.2. Fluoride in Drinking Water Samples in Cold and Warm Seasons
In this study, 130 drinking water samples collected in two cold and warm seasons were analyzed for fluoride concentrations. The fluoride concentrations varied from 0.29 to 6.68 and 0.1 to 11.4 mg/L in the cold and warm seasons, respectively. Spatial distribution of fluoride in groundwater in the studied areas both in cold and warm seasons is reported in Figure 2. A comparison of our results expressed as mean fluoride concentrations in the studied area with the WHO guideline for fluoride in drinking water in the cold season is shown in Table 3. Based on this research, 30.64% of the samples had a fluoride level higher than the permissible level, 6.45% had less than the permissible limit and, 62.91% of the samples had a level within the optimum range of 0.5 to 1.5 ppm. In the warm season 48.15% of the samples had a fluoride level higher than the permissible level, 6.45% had less than the permissible limit, and 45.4% of the samples had a level within the optimum range of 0.5 to 1.5 ppm.
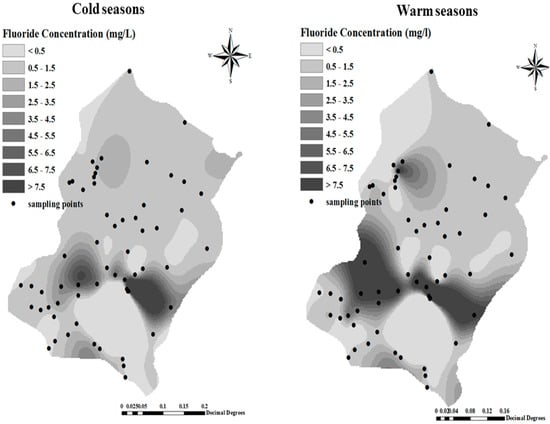
Figure 2.
Spatial distribution of fluoride in groundwater in the studied areas in cold and warm seasons.
Table 3.
The fluoride concentration (mg/L) in drinking water sources of the studied area, expressed as means ± standard deviation, min and max.
One factor analysis of sample paired t-test of data proved that concentration of fluoride in warm and cold seasons have a positive correlation during the periods in different village water samples (p < 0.05).
3.3. Exposure and Risk Assessment in Cold and Warm Seasons
The hazard quotient (HQ) and Estimated Daily intake (EDI) were calculated for four age groups in the different seasons, as shown in Table 4. The mean fluoride exposure of the villages’ residents showed high EDI levels during the warm season as compared to the cold season for the different age groups (infants, children, teenager and adults). Also, the HQ values in the warm season for the different age groups (infants, children, teenager and adults) were higher than the HQ values in the cold season.
Table 4.
HQ and Estimated Daily intake (EDI) values in cold and warm seasons for different for different age groups (infants, children, teenager and adults).
For each group in this studied area in both seasons, the non-carcinogenic risks (HQ level) of fluoride for the four exposed populations varied in order: children > teenagers > adults > infants. Consequently, these groups of young people can be considered as a hypersensitive population.
The spatial distribution of HQ in the cold and warm seasons for the infant and children groups presented in Figure 3 shows that the HQ of fluoride in some regions, such as Takhteh Doz, Rand, and Alighandoo was higher than other regions such as Hajihasan and Hajo villages. Also we find from Table 3, that the fluoride non-carcinogenic-risk associated with the consumption of water in the two seasons for the infants groups were negligible because HQ was <1. The spatial distribution of HQ both in cold and warm seasons for teenagers and adult groups respectively is reported in Figure 4.
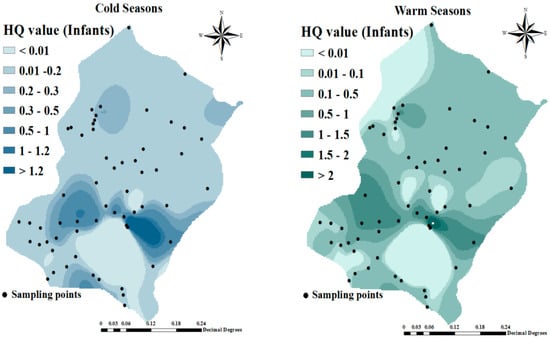
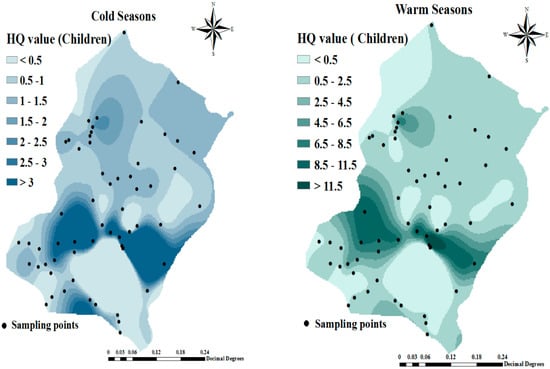
Figure 3.
Spatial distribution of hazard quotient (HQ) in cold and warm seasons for infant and children groups.
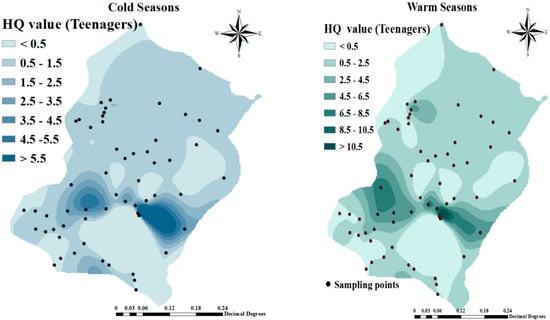
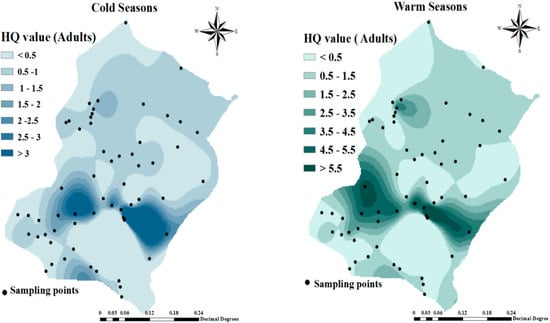
Figure 4.
Spatial distribution of HQ in cold and warm seasons for teenagers and adult groups.
4. Discussion
In this study, 130 drinking water samples were analyzed for fluoride concentrations in two cold and warm seasons of 2016. The fluoride concentrations varied from 0.29 to 6.68 and 0.1 to 11.4 mg/L in the cold and warm seasons, respectively. A comparison of mean fluoride concentration in the studied area with respect to the WHO guideline for fluoride in drinking water in the cold season was shown in Table 2. Based on our research, 30.64% of the waters samples had a fluoride level higher than the permissible level, 6.45% had less than the permissible limit, and 62.91% of the samples had a level within the optimum limit of 0.5 to 1.5 ppm in the cold season, while in the warm season 48.15% of the samples had a fluoride level higher than the permissible level, only 6.45% had less than the permissible limit, and 45.4% of the samples had a level within the optimum limit of 0.5 to 1.5 ppm. (Table 2, Figure 2). In a similar investigation carried out by Keshsvarz [27], the measured fluoride concentrations varied from 1.29 to 3.1 and by 1.39 to 3.2 mg/L in spring and summer, respectively. This was confirmed also by our research. Ashghari et al., reported the average concentration of fluoride in warm and cold seasons in the ranges 0.01–3 and 0.01–4 mg/L, respectively [28].
In our study, the values of HQ and EDI for the studied groups including infants (0–2 years old), children (2–6 years old), teenagers (6–16 years old) and adults (≥16 years old) were calculated separately for each season in the study area (Table 3). Mean values of HQ for the studied groups, (infants, children, teenagers and adults) were 0.22, 1.56, 1.1, 0.88 (in the cold season) and 0.37, 2.6, 1.83 and 1.47, respectively, for the warm season (Table 3). In the cold season, the infant group had all HQ < 1 and in the children group, 58.06% had HQ values > 1. In the adolescents age group 25.8% of the samples had a HQ > 1. In the adults group 22.88% of the samples had HQ > 1. None of the samples of the four groups in the cold season had HQ > 1. In the warm season, HQ levels in the infant, children, teenagers and adult groups with HQ > 1 were 17.77%, 29/61%, 25.8% and 19.24%, respectively. In this season, in 11 samples, 17.74% of the samples all four age groups had HQ > 1. Therefore, the vulnerable residents were potentially exposed to non-carcinogenic risks. Considering that fluoride concentrations in drinking water are usually the main source of daily intake, so in this studied area fluoride exposure should be counted among the health problem concerns and special measures must be taken to decrease the fluoride concentration to minimize the adverse health effects on the residents. Results of the study of Keshavrz et al. about fluoride exposure and its health risk assessment in drinking water and primary food in the population of Dayyer (Iran) showed that HQ values of fluoride for the two age groups were 1.7 and 2 times greater than 1 in spring, and 1.9, and 2.4 in summer for adults and children, respectively [27]. Similar research was also reported by Chen et al. which showed infants as the most vulnerable group and reported that majority of samples of infants (72%) and children (60%) were exposed to the adverse impact of fluoride [21]. Fallahzadeh et al.’s study showed that 68.77% of the samples taken in Iran were within the standard range set by the WHO guidelines (0.5–1.5 mg/L). The mean (standard deviation) of fluoride in Ardakan, Azezar, Mehriz, Meybod, Taft and Yazd were 0.83 (0.31), 0.73 (0.41), 0.56 (0.20), 0.91 (0.32), 0.60 (0.32) and 0.64 (0.25), respectively. Among the studied counties, Ashkezar has the highest dispersion in terms of high concentration of fluoride. The hazard quotient (HQ) value for all age groups except children was less than 1, indicating a potential non-cancer risk of exposure to fluoride for this group [8]. The study conducted by Martinez showed that children from Zacatecas (Mexico) have a higher risk of non-carcinogenic health effects through consumption of drinking water with a high fluoride concentration [20]. Zhang et al. study showed that highest non-carcinogenic risk of fluoride exposure was again in the children group. All reported results were also confirmed by our study [29]. The results of Guissouma et al.’s study reported that young consumers in Tunisia, including infants and children, were more exposed to health risks caused by fluoride ingestion through the drinking water [22]. The HQ values of our study indicated that health risks assessment in relation to fluoride concentration, both for children and adults, are significant only from drinking water consumption and a potential risk of dental and skeletal fluorosis could be expected.
5. Conclusions
Contamination of drinking water by fluoride and its potential health implications remain a major public health issue worldwide, especially in the West Azerbaijan province of Iran. The results from a health risk assessment have demontrated quick decision-making tools to decrease environmental health problems. In this research, the fluoride concentration, EDI and HQ values have been calculated and the human risk have been estimated for fluoride in 95 drinking water resources in the rural area of Maku city in the cold and warm seasons. The fluoride concentrations varied from 0.29 to 6.68 and 0.1 to 11.4 mg/L in the cold and warm seasons, respectively. Based on this report, 30.64 and 48.15% of the samples had a fluoride level higher than the permissible level in the cold and warm seasons, respectively. Our results also showed the HQ value in the warm season for different age groups (infants, children, teenager and adults) was higher than the HQ value in the cold season. For each studied area in both seasons, the non-carcinogenic risks (HQ level) of fluoride for the four exposed populations varied in the order: children > teenagers > adults > infants. The hazard quotient (HQ) value for three age groups (children, teenagers and adults) for both seasons were higher than >1, a value that indicates a high risk of fluorosis due to excessive fluoride ingestion. The results of this study also support the request that government authorities better manage water supplies with the aim to provide water with low fluoride concentration.
Author Contributions
M.Y.: conceptualization; F.B.A., P.Z., G.O.C.: editing and reviewing; A.E., A.A.M. and M.F. data analysis.
Funding
This research received no external funding.
Acknowledgments
The authors want to thank authorities of rural water and wastewater company of West Azerbaijan province for their comprehensives support for this study.
Conflicts of Interest
The authors of this article declare that they have no conflict of interests.
References
- Ghaderpoori, M.; Jafari, A.; Ghaderpoury, A. Heavy metals analysis and quality assessment in drinking water–Khorramabad city, Iran. Data Brief 2018, 16, 685–692. [Google Scholar] [CrossRef] [PubMed]
- Keramati, H.; Ghorbani, R.; Fakhri, Y.; Khaneghah, A.M.; Conti, G.O.; Ferrante, M.; Golaki, M. Radon 222 in drinking water resources of Iran: A systematic review, meta-analysis and probabilistic risk assessment (Monte Carlo simulation). Food Chem. Toxicol. 2018, 115, 460–469. [Google Scholar] [CrossRef] [PubMed]
- Saleh, H.N.; Panahande, M.; Yousefi, M.; Asghari, F.B.; Conti, G.O.; Talaee, E.; Mohammadi, A.A. Carcinogenic and Non-carcinogenic Risk Assessment of Heavy Metals in Groundwater Wells in Neyshabur Plain, Iran. Biol. Trace Elem. Res. 2018, 1–11. [Google Scholar] [CrossRef] [PubMed]
- Mirzabeygi, M.; Yousefi, M.; Soleimani, H.; Mohammadi, A.A.; Mahvi, A.H.; Abbasnia, A. The concentration data of fluoride and health risk assessment in drinking water in Ardakan city of Yazd province, Iran. Data Brief. 2018, 18, 40–46. [Google Scholar] [CrossRef] [PubMed]
- Amouei, A.; Mahvi, A.; Mohammadi, A.; Asgharnia, H.; Fallah, S.; Khafajeh, A. Fluoride concentration in potable groundwater in rural areas of Khaf city, Razavi Khorasan province, Northeastern Iran. Int. J. Occup. Environ. Med. 2012, 3, 201–203. [Google Scholar] [PubMed]
- Augustsson, A.; Berger, T. Assessing the risk of an excess fluoride intake among Swedish children in households with private wells—Expanding static single-source methods to a probabilistic multi-exposure-pathway approach. Environ. Int. 2014, 68, 192–199. [Google Scholar] [CrossRef]
- Dehbandi, R.; Moore, F.; Keshavarzi, B. Geochemical sources, hydrogeochemical behavior, and health risk assessment of fluoride in an endemic fluorosis area, central Iran. Chemosphere 2018, 193, 763–776. [Google Scholar] [CrossRef]
- Fallahzadeh, R.A.; Miri, M.; Taghavi, M.; Gholizadeh, A.; Anbarani, R.; Hosseini-Bandegharaei, A.; Conti, G.O. Spatial variation and probabilistic risk assessment of exposure to fluoride in drinking water. Food Chem. Toxicol. 2018, 113, 314–321. [Google Scholar] [CrossRef]
- Amaral, S.L.; Azevedo, L.B.; Buzalaf, M.A.; Fabrico, M.F.; Fernandes, M.S.; Valentine, R.A.; MAguire, A.; Zohoori, F.V. Effect of chronic exercise on fluoride metabolism in fluorosis-susceptible mice exposed to high fluoride. Sci. Rep. 2018, 8, 3211. [Google Scholar] [CrossRef]
- Shams, M.; Dobaradaran, S.; Mazloomi, S.; Afsharnia, M.; Ghasemi, M.; Bahreinie, M. Drinking water in Gonabad, Iran: Fluoride levels in bottled, distribution network, point of use desalinator, and decentralized municipal desalination plant water. Fluoride 2012, 45, 138. [Google Scholar]
- Mohammadi, A.A.; Yousefi, M.; Yaseri, M.; Jalilzadeh, M.; Mhvi, A.H. Skeletal fluorosis in relation to drinking water in rural areas of West Azerbaijan, Iran. Sci. Rep. 2017, 7, 17300. [Google Scholar] [CrossRef] [PubMed]
- Yousefi, M.; Mohammadi, A.A.; Yaseri, M.; Mahvi, A.H. Epidemiology of drinking water fluoride and its contribution to fertility, infertility, and abortion: An ecological study in West Azerbaijan Province, Poldasht County, Iran. Fluoride 2017, 50, 343–353. [Google Scholar]
- Yousefi, M.; Yaseri, M.; Nabizadeh, R.; Hooshmand, E.; Jalilzadeh, M.; Mahvi, A.H.; Mohammadi, A.A. Association of hypertension, body mass index and waist circumference with fluoride intake; water drinking in residents of fluoride endemic areas, Iran. Biol. Trace Elem. Res. 2018, 185, 282–288. [Google Scholar] [CrossRef] [PubMed]
- Kazemi Moghadam, V.; Yousefi, M.; Khosravi, A.; Yaseri, M.; Mahvi, A.H.; Hadei, M.; Mohammadi, A.A.; Robati, Z.; Mokamel, A. High concentration of fluoride can be increased risk of abortion. Biol. Trace Elem. Res. 2018, 185, 262–265. [Google Scholar] [CrossRef] [PubMed]
- Mahvi, A.H.; Ghanbarian, M.; Ghanbarian, M.; Khosravi, A.; Ghanbarian, M. Determination of fluoride concentrationin powdered milk in Iran 2010. Br. J. Nutr. 2012, 107, 1077–1079. [Google Scholar] [CrossRef] [PubMed]
- Karimzade, S.; Aghaei, M.; Mahvi, A. Investigation of intelligence quotient in 9–12-year-old children exposed to high-and low-drinking water fluoride in West Azerbaijan Province, Iran. Fluoride 2014, 47, 9–14. [Google Scholar]
- Sun, L.; Gao, Y.; Liu, H.; Zhang, W.; Ding, Y.; Li, B.; LI, M.; Sun, D. An assessment of the relationship between excess fluoride intake from drinking water and essential hypertension in adults residing in fluoride endemic areas. Sci. Total Environ. 2013, 443, 864–869. [Google Scholar] [CrossRef] [PubMed]
- Mohammadi, A.A.; Yousefi, M.; Mahvi, A.H. Fluoride concentration level in rural area in Poldasht city and daily fluoride intake based on drinking water consumption with temperature. Data Brief 2017, 13, 312–315. [Google Scholar] [CrossRef]
- Asghari, F.B.; Mohammadi, A.A.; Aboosaedi, Z.; Yaseri, M.; Yousefi, M. Data on fluoride concentration levels in cold and warm season in rural area of Shout (West Azerbaijan, Iran). Data Brief 2017, 15, 528–531. [Google Scholar] [CrossRef]
- Martínez-Acuña, M.I.; Mercado-Reyes, M.; Alegría-Torres, J.A.; Mejía-Saavedra, J.J. Preliminary human health risk assessment of arsenic and fluoride in tap water from Zacatecas, México. Environ. Monit. Assess. 2016, 188, 476. [Google Scholar] [CrossRef]
- Chen, J.; Wu, H.; Qian, H.; Gao, Y. Assessing nitrate and fluoride contaminants in drinking water and their health risk of rural residents living in a semiarid region of northwest china. Expo. Health 2017, 9, 183–195. [Google Scholar] [CrossRef]
- Guissouma, W.; Hakami, O.; AL-Rajab, A.J.; Tarhouni, J. Risk assessment of fluoride exposure in drinking water of Tunisia. Chemosphere 2017, 177, 102–108. [Google Scholar] [CrossRef] [PubMed]
- Faraji, H.; Mohammadi, A.A.; Akbari-Adergani, B.; Saatloo, N.V.; Lashkarboloki, G.; Mahvi, A.H. Correlation between fluoride in drinking Water and its levels in breast milk in Golestan Province, Northern Iran. Iran. J. Public Health 2014, 43, 1664–1668. [Google Scholar] [PubMed]
- Yousefi, M.; Ghoochani, M.; Mahvi, A.H. Health risk assessment to fluoride in drinking water of rural residents living in the Poldasht city, Northwest of Iran. Ecotoxicol. Environ. Saf. 2018, 148, 426–430. [Google Scholar] [CrossRef] [PubMed]
- Jafari, A.; Kamarehie, B.; Ghaderpoori, M.; Khoshnamvand, N.; Birjandi, M. The concentration data of heavy metals in Iranian grown and imported rice and human health hazard assessment. Data Brief 2018, 16, 453–459. [Google Scholar] [CrossRef] [PubMed]
- Edmunds, W.M.; Shand, P.; Hart, P.; Ward, R.S. The natural (baseline) quality of groundwater: A UK pilot study. Sci. Total Environ. 2003, 310, 25–35. [Google Scholar] [CrossRef]
- Keshavarz, S.; Ebrahimi, A.; Nikaeen, M. Fluoride exposure and its health risk assessment in drinking water and staple food in the population of Dayyer, Iran, in 2013. J. Educ. Health Promot. 2015, 4, 72. [Google Scholar]
- Asghari, F.B.; Jaafari, J.; Yousefi, M.; Mohammadi, A.A.; Dehghanzadeh, R. Evaluation of water corrosion, scaling extent and heterotrophic plate count bacteria in asbestos and polyethylene pipes in drinking water distribution system. Hum. Ecol. Risk Assess. Int. J. 2018, 24, 1138–1149. [Google Scholar] [CrossRef]
- Huang, D.; Yang, J.; Wei, X.; Qin, J.; Ou, S.; Zhang, Z.; Zou, Y. Probabilistic risk assessment of Chinese residents’ exposure to fluoride in improved drinking water in endemic fluorosis areas. Environ. Pollut. 2017, 222, 118–125. [Google Scholar]
© 2019 by the authors. Licensee MDPI, Basel, Switzerland. This article is an open access article distributed under the terms and conditions of the Creative Commons Attribution (CC BY) license (http://creativecommons.org/licenses/by/4.0/).