Tourists’ Thermal Experience and Health in a Commercial Pedestrianized Block: A Case Study in a Hot and Humid Region of Southern China


Abstract
1. Introduction
2. Methods
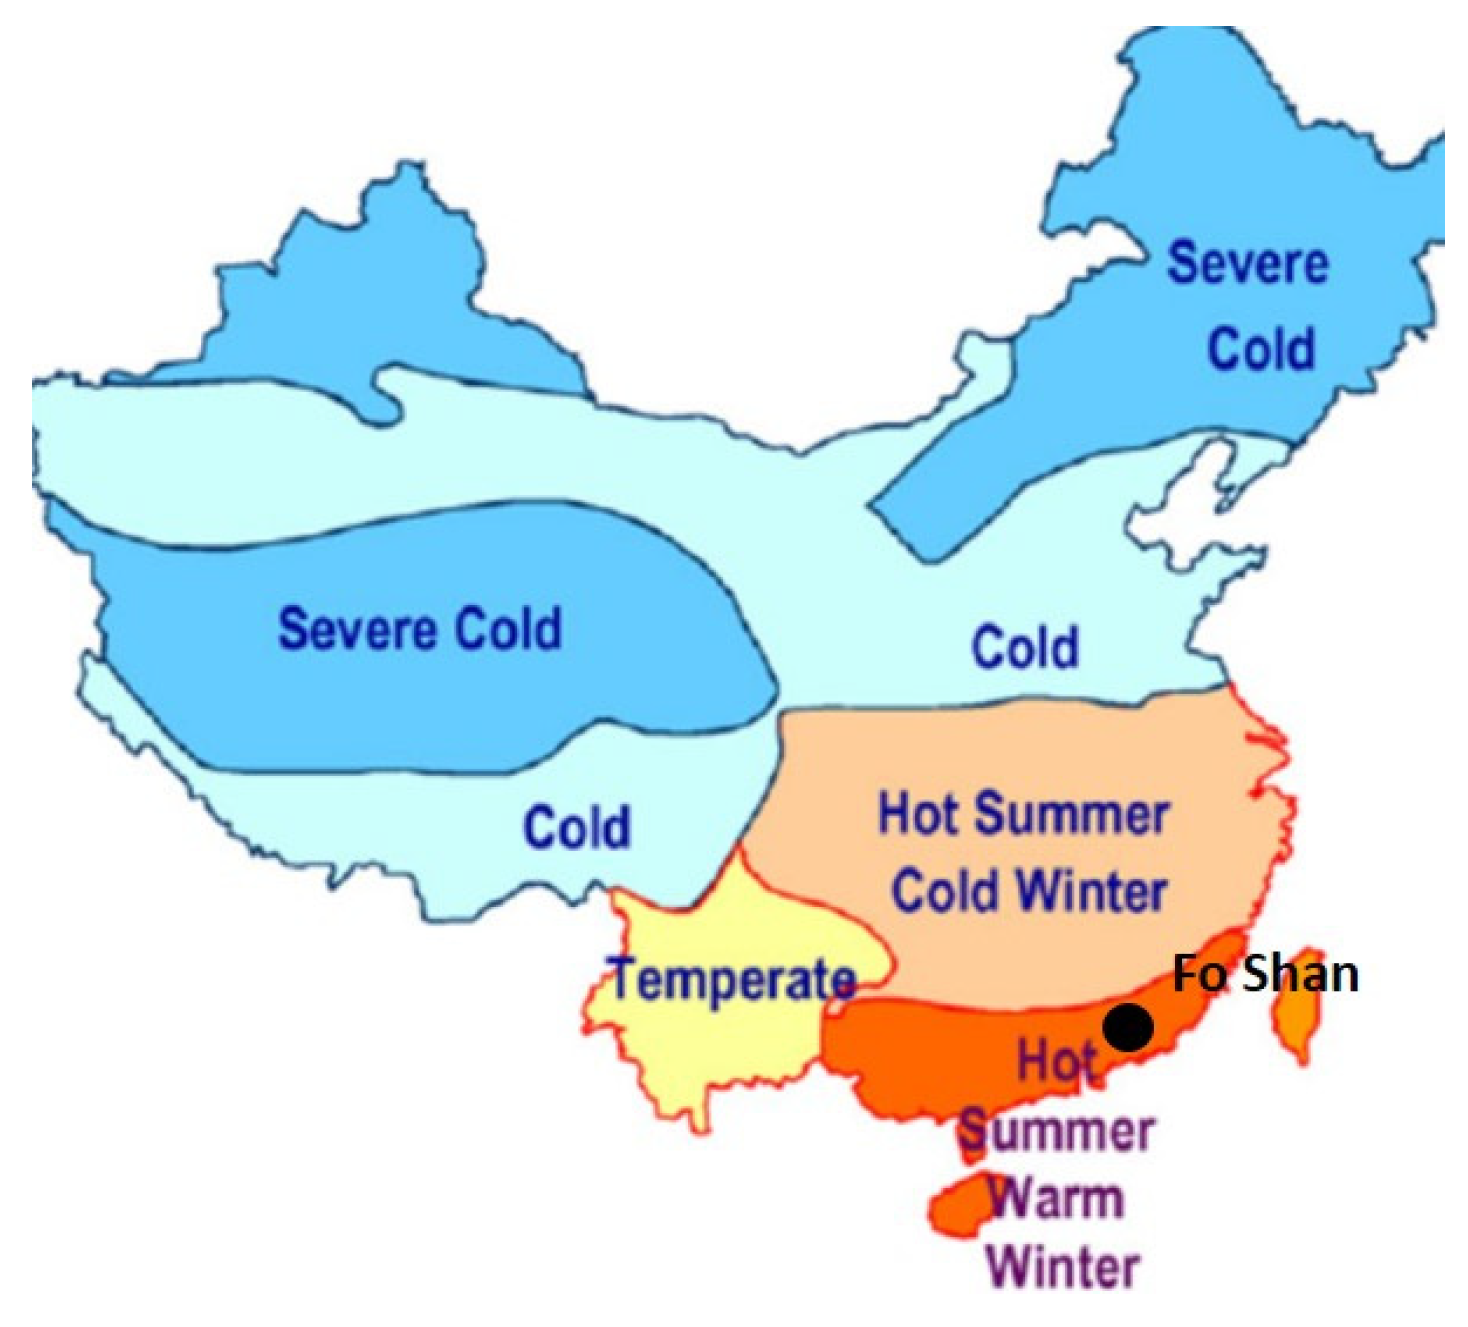
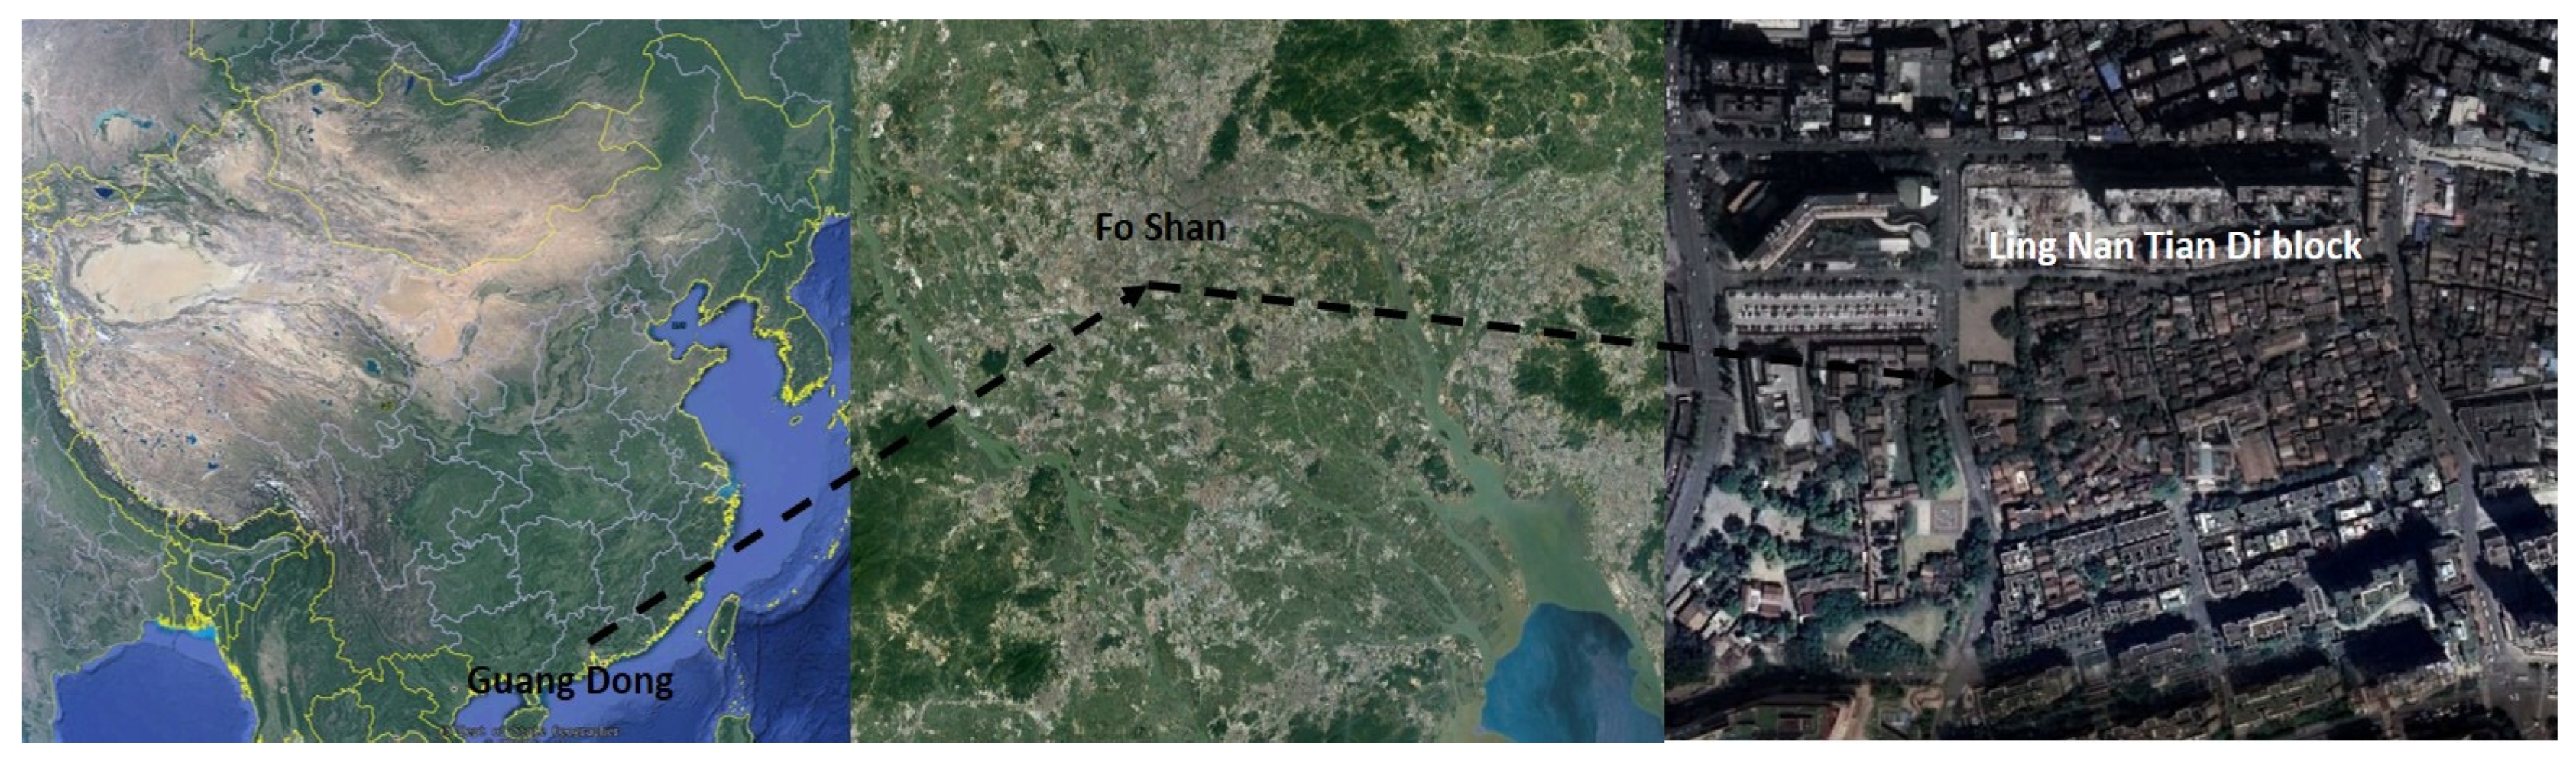
2.1. Research Site
2.2. Research Period
2.3. On-Site Measurement
- Each instrument is fixed at a 1.5 m height (average pedestrian level) from the surface.
- Each instrument is covered by a shelter to prevent the influence on air temperature by solar radiation at daytime.
2.4. Numerical Simulation
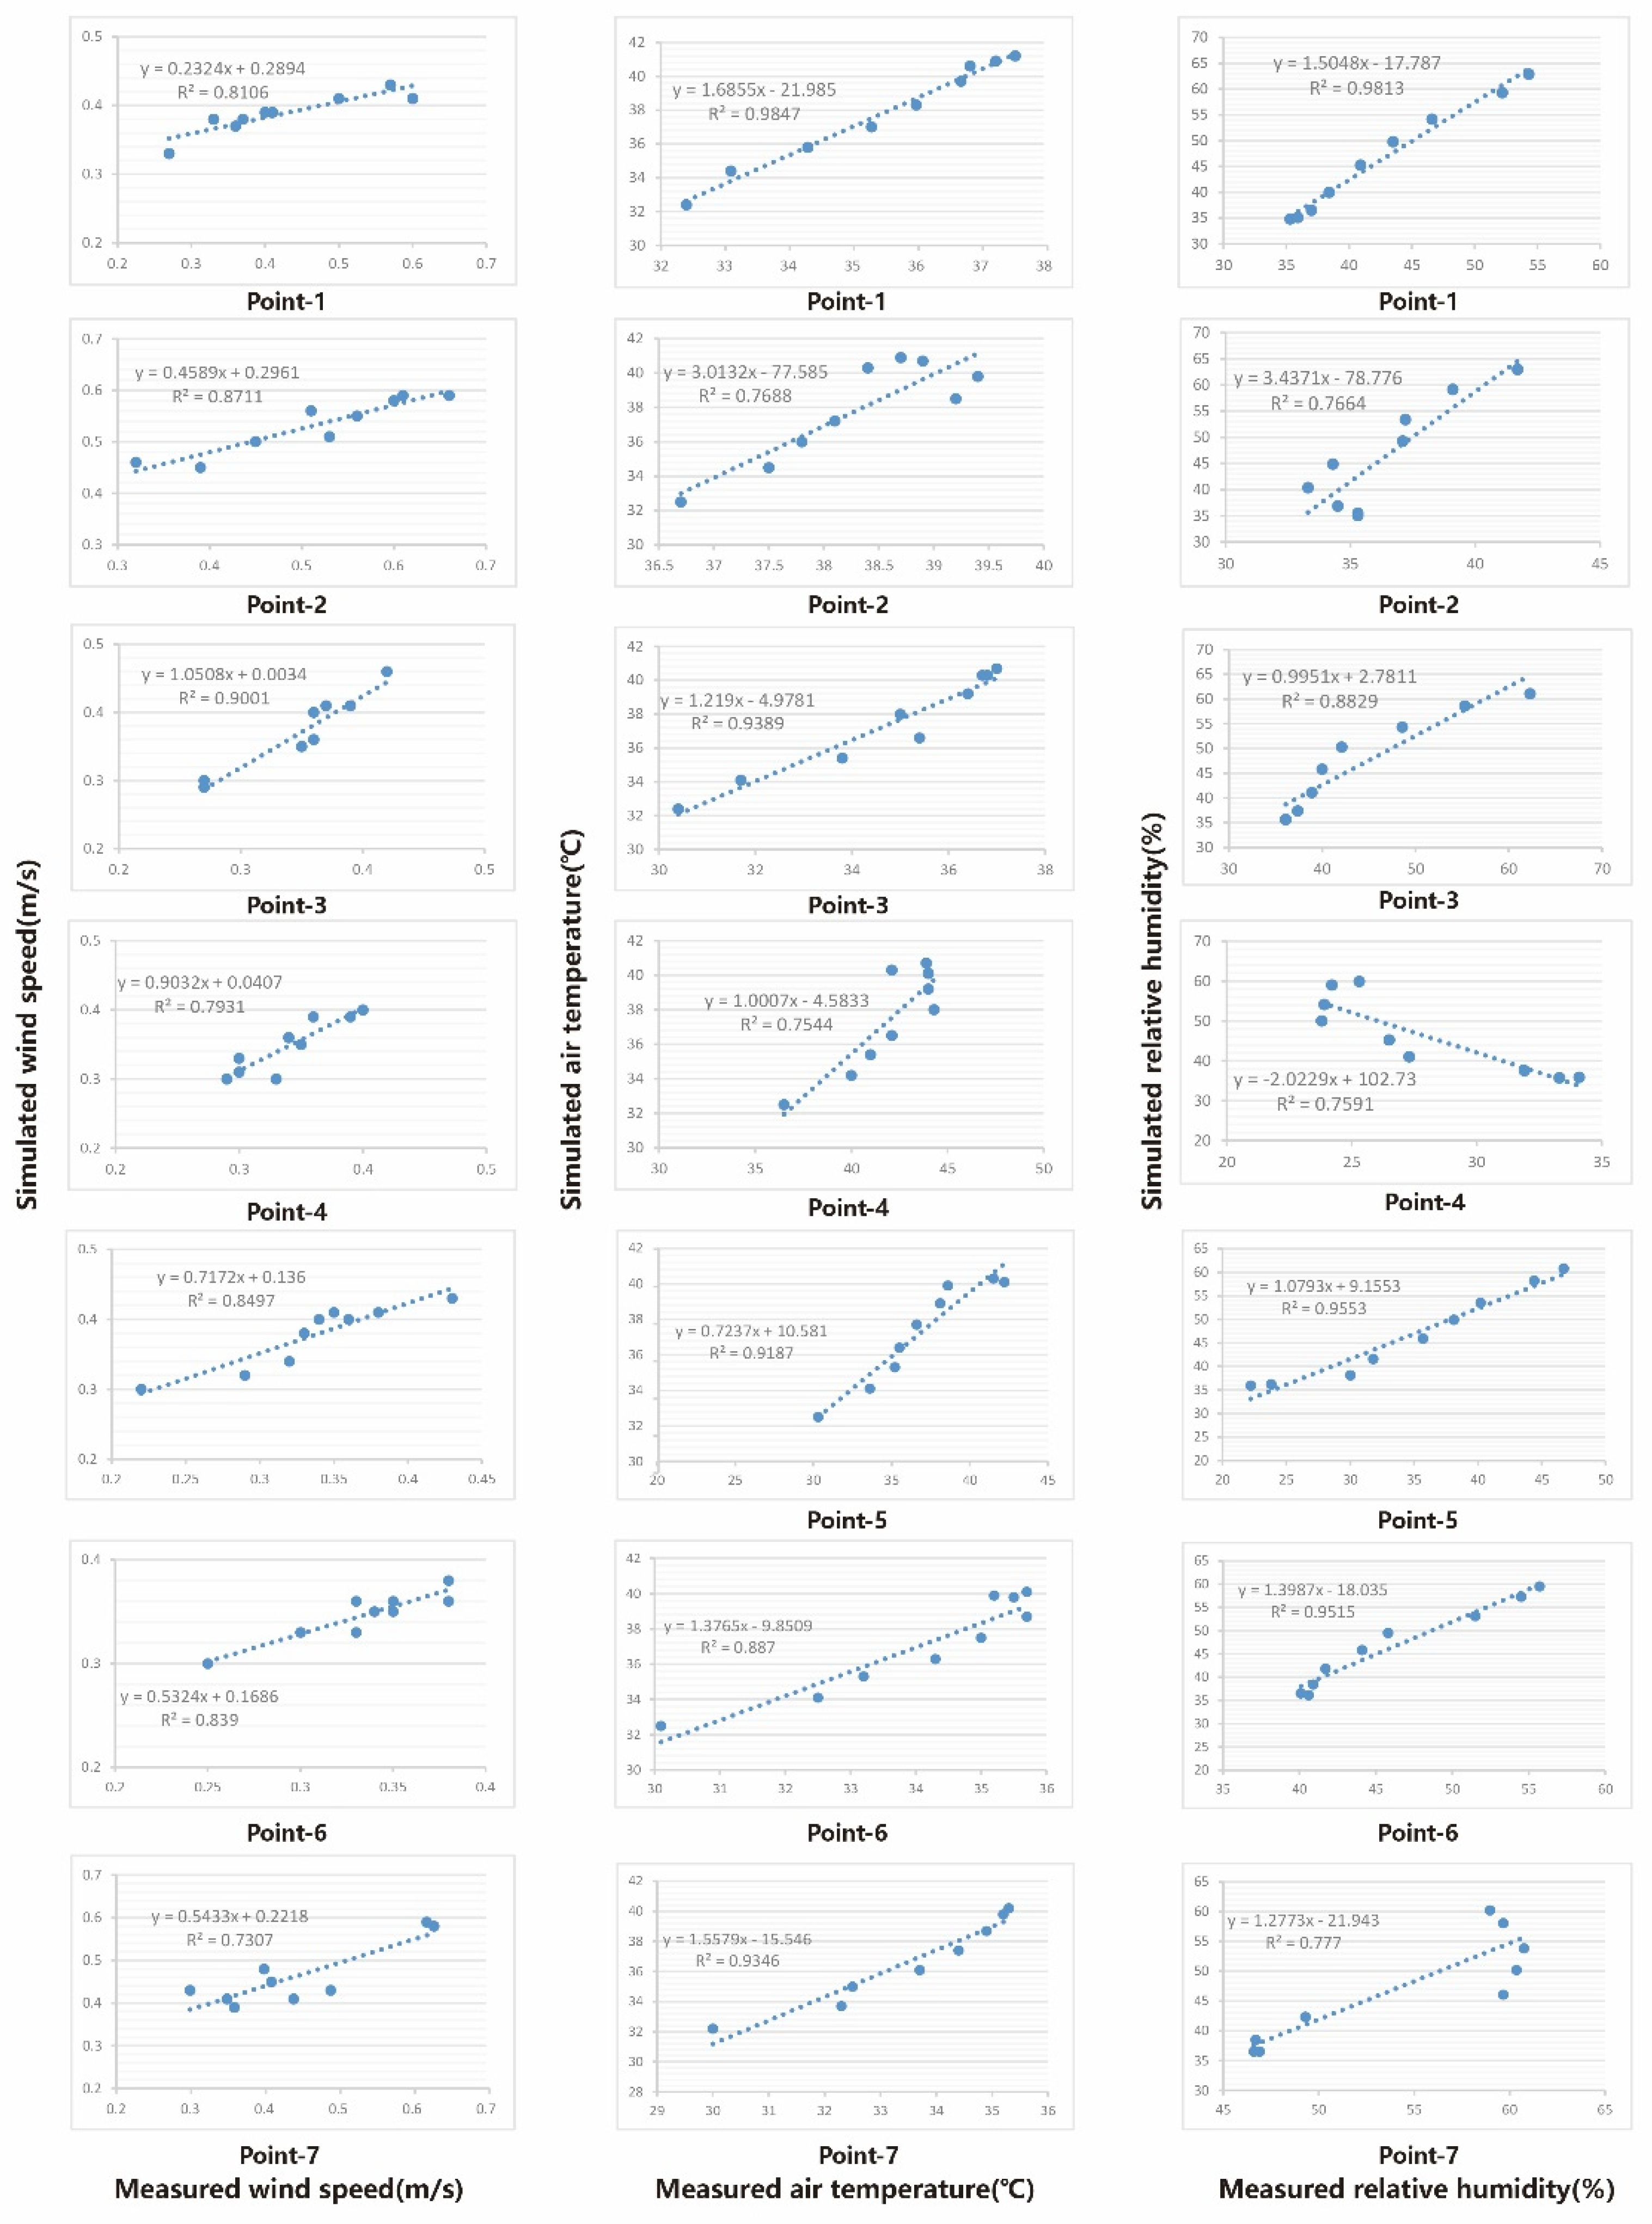
2.5. Validation
3. Results
3.1. Tourists’ Thermal Experience under the Existing Scenario
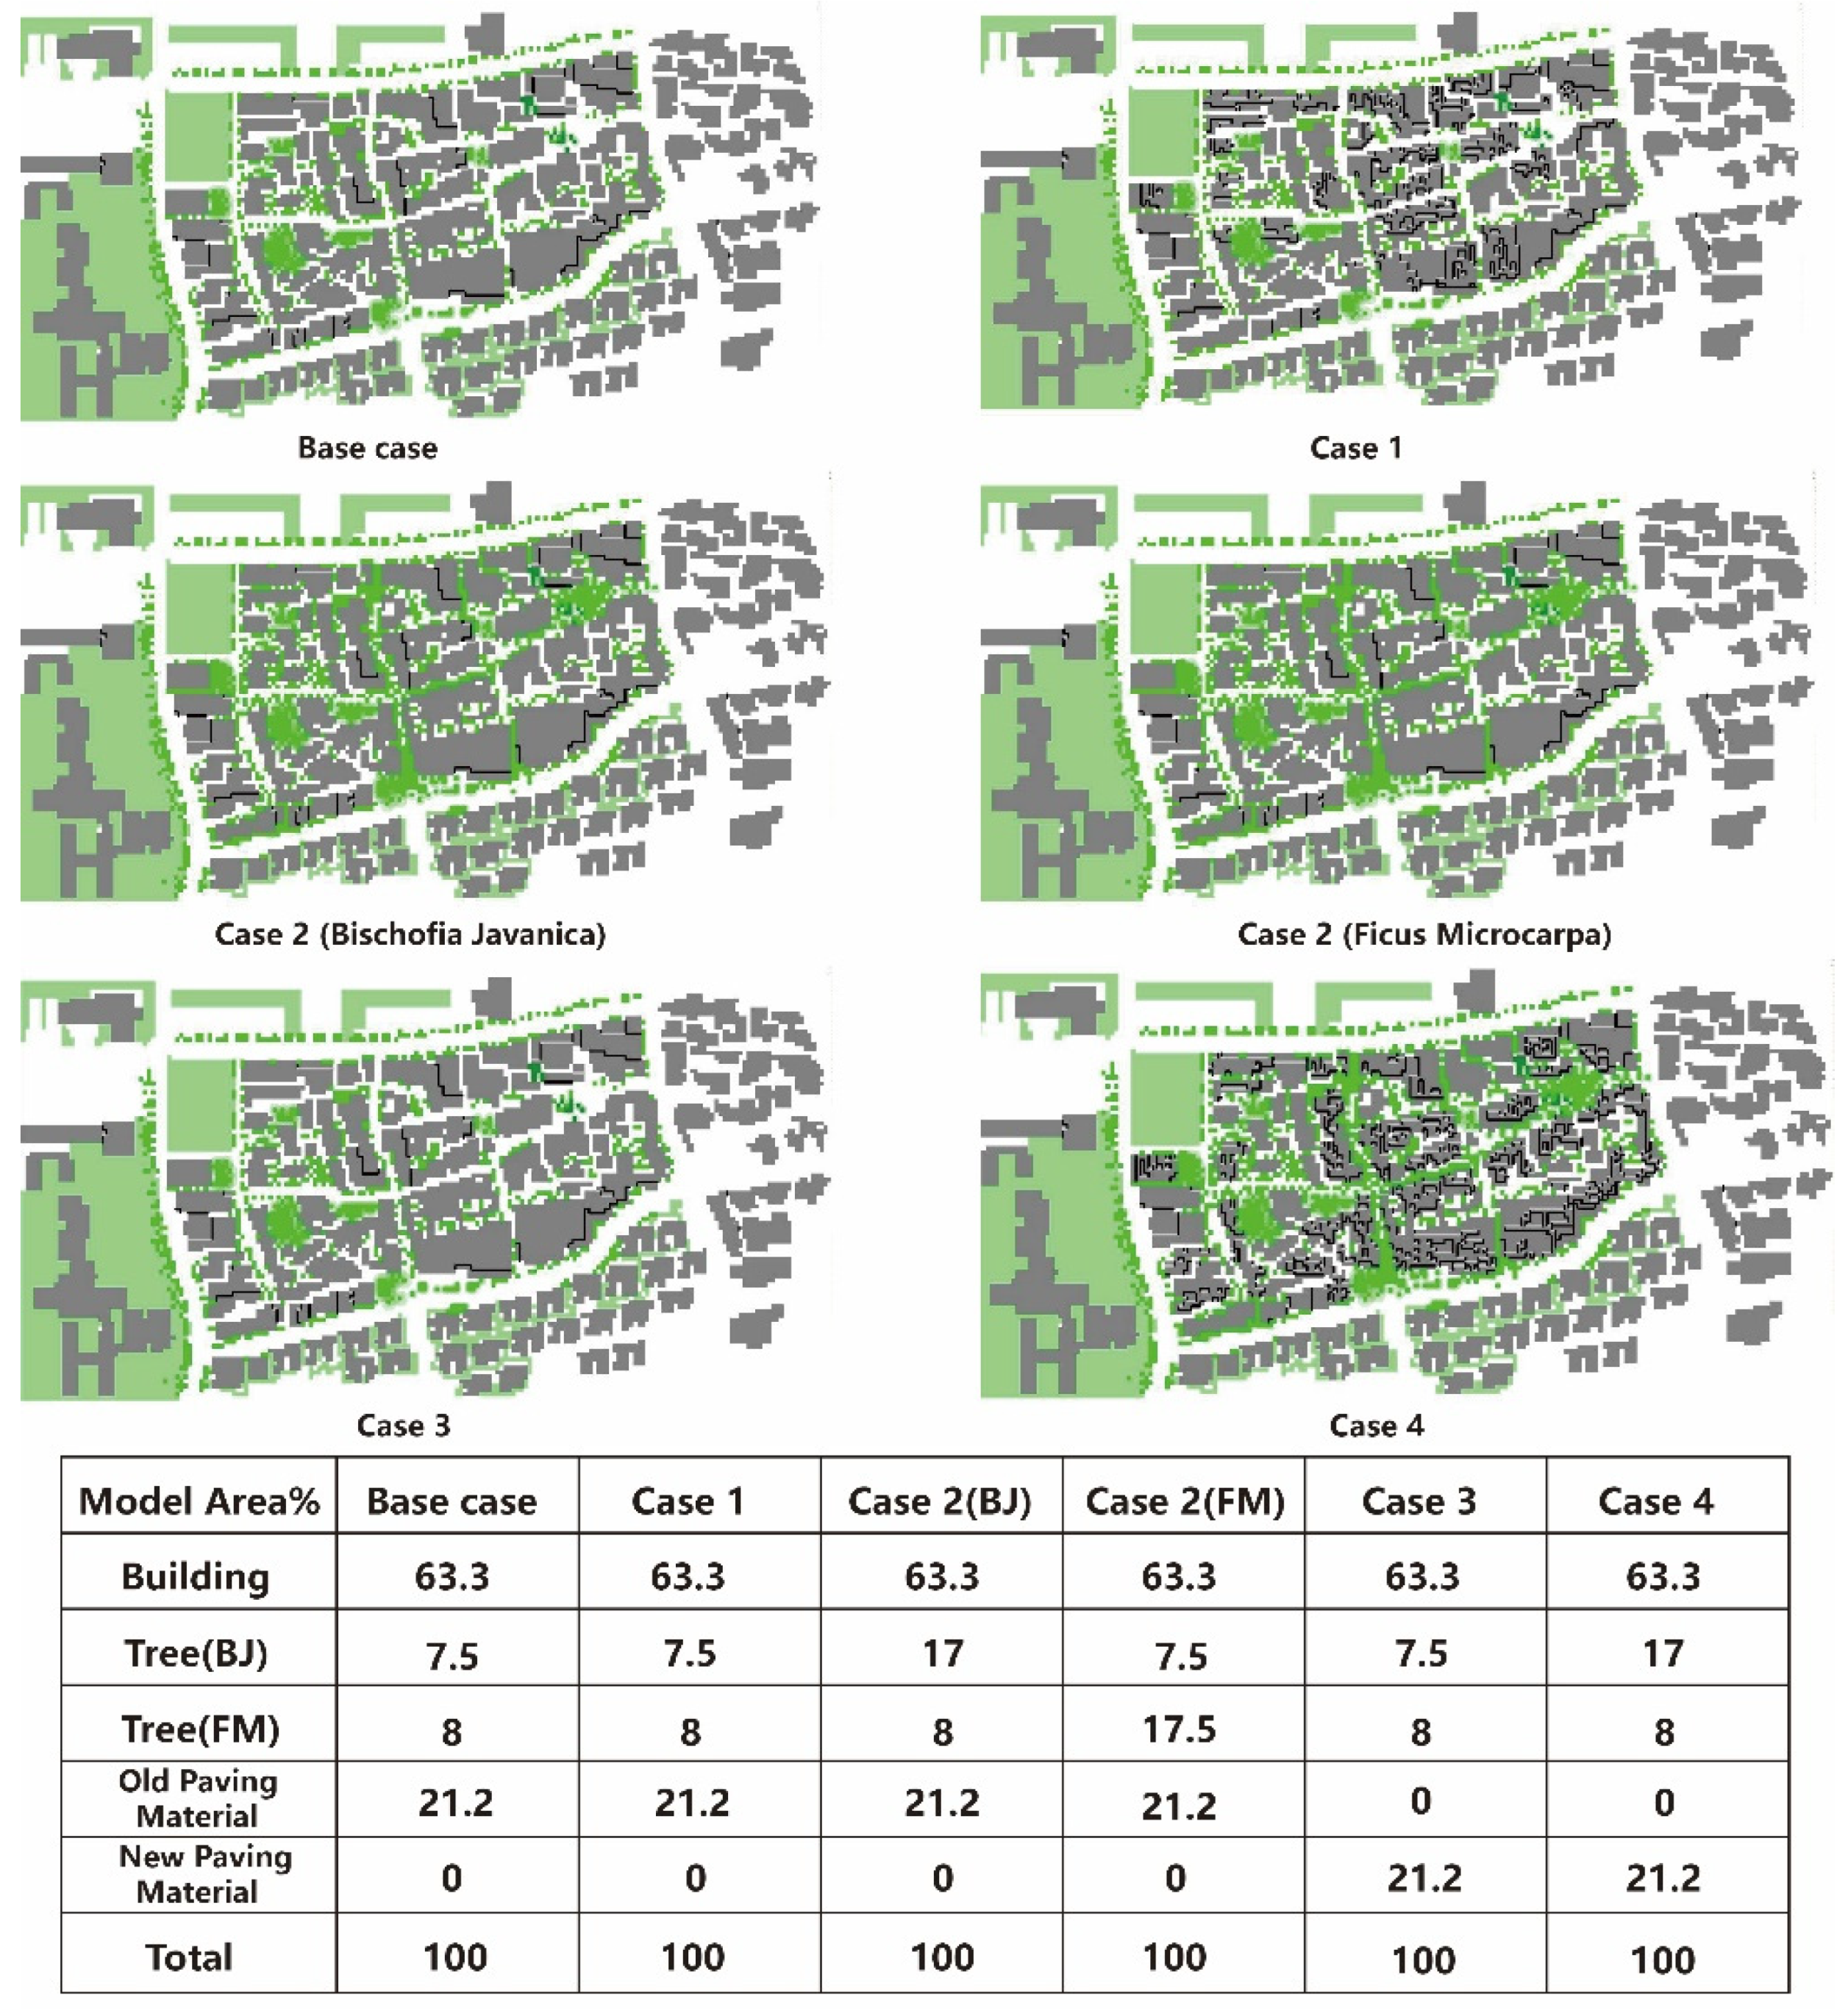
3.2. New Thermal Calendars under New Cases
4. Conclusions
Author Contributions
Funding
Conflicts of Interest
References
- Lin, T.P.; Matzarakis, A. Tourism climate information based on human thermal perception in Taiwan and Eastern China. Tour. Manag. 2011, 32, 492–500. [Google Scholar] [CrossRef]
- Linares, C.; Diaz, J. Impact of high temperature on hospital admissions: Comparative analysis with previous studies about mortality. Eur. J. Public Health 2008, 18, 317–322. [Google Scholar] [CrossRef] [PubMed]
- Hamilton, J.M.; Tol, R.S. The impact of climate change on tourism in Germany, the UK and Ireland: A simulation study. Reg. Environ. Chang. 2007, 7, 161–172. [Google Scholar] [CrossRef]
- Wang, S.; He, Y.; Song, X. Impacts of climate warming on alpine glacier tourism and adaptive measures: A case study of Baishui Glacier No. 1 in Yulong Snow Mountain, Southwestern China. J. Earth Sci. 2010, 21, 166–178. [Google Scholar] [CrossRef]
- Steadman, R.G. Indices of windchill of clothed persons. J. Appl. Meteorol. 1971, 10, 674–683. [Google Scholar] [CrossRef]
- Steadman, R.G. The assessment of sultriness. Part I. A temperature humidity index based on human physiology and clothing science. J. Appl. Meteorol. 1979, 18, 861–873. [Google Scholar] [CrossRef]
- Mieczkowski, Z. The tourism climate index: A method for evaluating world climates for tourism. Can. Geogr. 1985, 29, 220–233. [Google Scholar] [CrossRef]
- Lin, T.P.; Matzarakis, A.; Hwang, R.L. Shading effect on long-term outdoor thermal comfort. Build. Environ. 2010, 45, 213–221. [Google Scholar] [CrossRef]
- Gagge, A.P.; Fobelets, A.P.; Berglund, L.G. A standard predictive index of human respond to the thermal environment. ASHARE Trans. 1986, 92, 709–731. [Google Scholar]
- De Dear, R.; Pickup, J. An outdoor thermal environment index (OUT_SET*)-Applications. In Biometeorology and Urban Climatology at the Turn of the Millenium. Selected Papers from the ICB-ICUC’99 Conference, Sydney, WCASP-50, WMO/TD No. 1026; de Dear, R.J., Kalma, J.D., Oke, T.R., Auliciems, A., Eds.; World Meteorological Organization: Geneva, Switzerland, 2000. [Google Scholar]
- Ayman, H.A.M. Analysis of the microclimatic and human comfort conditions in an urban park in hot and arid regions. Build. Environ. 2011, 46, 2641–2656. [Google Scholar]
- Spagnolo, J.; de Dear, R.J. A field study of thermal comfort in outdoor and semi-outdoor environments in subtropical Sydney Australia. Build. Environ. 2003, 38, 721–738. [Google Scholar] [CrossRef]
- Höppe, P. The physiological equivalent temperature–A universal index for the bio-meteorological assessment of the thermal environment. Int. J. Biometeorol. 1999, 43, 71. [Google Scholar] [PubMed]
- Höppe, P. Heat balance modelling. Experientia 1993, 49, 741–746. [Google Scholar] [CrossRef] [PubMed]
- Pearlmutter, D.; Berliner, P.; Shaviv, E. Integrated modeling of pedestrian energy exchange and thermal comfort in urban street canyons. Build. Environ. 2007, 42, 2396–2409. [Google Scholar] [CrossRef]
- Krüger, E.; Pearlmutter, D.; Rasia, F. Evaluating the impact of canyon geometry and orientation on cooling loads in a high-mass building in a hot dry environment. Appl. Energy 2010, 87, 2068–2078. [Google Scholar] [CrossRef]
- Cao, A.; Li, Q.; Meng, Q. Effects of orientation of urban roads on the local thermal environment in guang zhou city. Procedia Eng. 2015, 121, 2075–2082. [Google Scholar] [CrossRef]
- Zhang, Y.; Du, X.; Shi, Y. Effects of street canyon design on pedestrian thermal comfort in the hot-humid area of China. Int. J. Biometeorol. 2017, 61, 1421–1432. [Google Scholar] [CrossRef]
- Morakinyo, T.E.; Lam, Y.F. Simulation study on the impact on tree-configuration, planting pattern and wind condition on street-canyon’s micro-climate and thermal comfort. Build. Environ. 2016, 103, 262–275. [Google Scholar] [CrossRef]
- Morakinyo, T.E.; Kong, L.; Lau, K.K.-L.; Yuan, C.; Ng, E. A study on the impact of shadow-cast and tree species on in-canyon and neighborhood’s thermal comfort. Build. Environ. 2017, 115, 1–17. [Google Scholar] [CrossRef]
- Shafique, M.; Reeho, K.; Muhammad, R. Green roof benefits, opportunities and challenges—A review. Renew. Sustain. Energy Rev. 2018, 80, 757–773. [Google Scholar] [CrossRef]
- Jim, C.Y.; Lilliana, L.P. Weather effect on thermal and energy performance of an extensive tropical green roof. Urban For. Urban Green. 2012, 11, 73–85. [Google Scholar] [CrossRef]
- Wilkinson, S.; Feitosa, R.C. Thermal performance of green roof retrofit. In Green Roof Retrofit: Building Urban Resilience; Wiley-Blackwell: Hoboken, NJ, USA, 2016; pp. 62–84. [Google Scholar]
- Muhammad, S.; Xue, X.; Luo, X. An overview of carbon sequestration of green roofs in urban areas. Urban For. Urban Green. 2019, 126515. [Google Scholar]
- Oberndorfer, E.; Lundholm, J.; Bass, B.; Coffman, R.R.; Doshi, H.; Dunnett, N.; Rowe, B. Green roofs as urban ecosystems: Ecological structures, functions, and services. BioScience 2007, 57, 823–833. [Google Scholar] [CrossRef]
- Xing, Q.; Hao, X.; Lin, Y.; Tan, H.; Yang, K. Experimental investigation on the thermal performance of a vertical greening system with green roof in wet and cold climates during winter. Energy Build. 2019, 183, 105–117. [Google Scholar] [CrossRef]
- Williams, N.S.; Lundholm, J.; Scott MacIvor, J. Do green roofs help urban biodiversity conservation. J. Appl. Ecol. 2014, 51, 1643–1649. [Google Scholar] [CrossRef]
- Shafique, M.; Reeho, K. Application of green-blue roof to mitigate heat island phenomena and resilient to climate change in urban areas: A case study from Seoul, Korea. J. Water Land Dev. 2017, 33, 165–170. [Google Scholar] [CrossRef]
- Zhang, G.; He, B.-J.; Zhu, Z.; Dewancker, B.J. Impact of morphological characteristics of green roofs on pedestrian cooling in subtropical climates. Int. J. Environ. Res. Public Health 2019, 16, 179. [Google Scholar] [CrossRef]
- Wu, Z.; Kong, F.; Wang, Y.; Sun, R.; Chen, L. The impact of greenspace on thermal comfort in a residential quarter of Beijing, China. Int. J. Environ. Res. Public Health 2016, 13, 1217. [Google Scholar] [CrossRef]
- Wu, W.; Ren, H.; Yu, M.; Wang, Z. Distinct Influences of Urban Villages on Urban Heat Islands: A Case Study in the Pearl River Delta, China. Int. J. Environ. Res. Public Health 2018, 15, 1666. [Google Scholar] [CrossRef]
- Erell, E.; Pearlmutter, D.; Boneh, D.; Kutiel, P.B. Effect of high-albedo materials on pedestrian heat stress in urban street canyons. Urban Clim. 2014, 10, 367–386. [Google Scholar] [CrossRef]
- Bowler, D.E.; Buyung-Ali, L.; Knight, T.M.; Pullin, A.S. Urban greening to cool towns and cities: A systematic review of the empirical evidence. Landsc. Urban Plan. 2010, 97, 147–155. [Google Scholar] [CrossRef]
- Ballantyne, E.R.; Hill, R.K.; Spencer, J.W. Probit analysis of thermal sensation assessments. Int. J. Biometeorol. 1977, 21, 29–43. [Google Scholar] [CrossRef] [PubMed]
- Bigano, A.; Hamilton, J.M.; Tol, R.S.J. The Impact of Climate on Holiday Destination Choice; Working Papers 04; Fundazione Eni Enrico Mattei: Hamburg, Germany, 2005. [Google Scholar]
- De Freitas, C.R. The climate-tourism relationship and its relevance to climate change impact assessment. In Tourism, Recreation and Climate Change; Hall, C.M., Higham, J., Eds.; Channel View Publications: Clevedon, UK, 2005; pp. 29–43. [Google Scholar]
- Hwang, R.L.; Lin, T.P. Thermal comfort requirements for occupants of semi-outdoor and outdoor environments in hot-humid regions. Archit. Sci. Rev. 2007, 50, 60–67. [Google Scholar] [CrossRef]
- Lindberg, F.; Holmer, B.; Thorsson, S. SOLWEIG 1.0 e modelling spatial variations of 3D radiant fluxes and mean radiant temperature in complex urban settings. Int. J. Biometeorol. 2008, 52, 697–713. [Google Scholar] [CrossRef]
- Taleghani, M.; Tenpierik, M.; van den Dobbelsteen, A.; Sailor, D.J. Heat mitigation strategies in winter and summer: Field measurements in temperate climates. Build. Environ. 2014, 81, 309–319. [Google Scholar] [CrossRef]
- Thermal Design Code for Civil Buildings, GB 50176–51993; Ministry of Housing and Urban-rural, Development of the People’s Republic of China: Beijing, China, 1993.
- Cultural Heritage and Tourism Organization of Fo Shan. Available online: http://www.foshantravel.cn/ (accessed on 10 December 2019).
- Meteorological Organization Country. Available online: http://www.irimo.ir (accessed on 10 December 2019).
- Jamei, E.; Rajagopalan, P. Urban development and pedestrian thermal comfort in Melbourne. Sol. Energy 2017, 144, 681–698. [Google Scholar] [CrossRef]
- Morakinyo, T.E.; Lau, K.K.-L.; Ren, C.; Ng, E. Performance of Hong Kong’s common trees species for outdoor temperature regulation, thermal comfort and energy saving. Build. Environ. 2018, 137, 157–170. [Google Scholar] [CrossRef]
- Ma, X.; Fukuda, H.; Zhou, D.; Wang, M. A Study of the Pedestrianized Zone for Tourists: Urban Design Effects on Humans’ Thermal Comfort in Fo Shan City. S. China Sustain. 2019, 11, 2774. [Google Scholar] [CrossRef]
- Ma, X.; Fukuda, H.; Zhou, D.; Wang, M. The evaluation of outdoor thermal sensation and outdoor energy efficiency of a commercial pedestrianized zone. Energies 2019, 12, 1324. [Google Scholar] [CrossRef]
- CSADI. The Commercial Building Design Specification. Available online: https://wenku.baidu.com/view/4c4a9df76529647d272852bb.html (accessed on 10 December 2019).


| July | 1 | 2 | 3 | 4 | 5 | 6 | 7 | 8 | 9 | 10 |
|---|---|---|---|---|---|---|---|---|---|---|
| Weather | Rain | Rain | Rain | Rain | Rain | Rain | Rain | Rain | Rain | Rain |
| Min air temperature (°C) | 26 | 27 | 27 | 26 | 26 | 26 | 26 | 28 | 29 | 28 |
| Max air temperature (°C) | 31 | 31 | 31 | 31 | 31 | 32 | 34 | 36 | 36 | 34 |
| July | 11 | 12 | 13 | 14 | 15 | 16 | 17 | 18 | 19 | 20 |
| Weather | Rain | Rain | Rain | Rain | Rain | Rain | Rain | Rain | Rain | Rain |
| Min air temperature (°C) | 27 | 26 | 27 | 27 | 27 | 28 | 28 | 28 | 27 | 27 |
| Max air temperature (°C) | 32 | 30 | 34 | 33 | 34 | 35 | 34 | 34 | 33 | 33 |
| July | 21 | 22 | 23 | 24 | 25 | 26 | 27 | 28 | 29 | 30 |
| Weather | Rain | Cloudy | Sunny | Sunny | Sunny | Sunny | Rain | Cloudy | Cloudy | Rain |
| Min air temperature (°C) | 26 | 26 | 26 | 27 | 27 | 27 | 27 | 26 | 27 | 28 |
| Max air temperature (°C) | 34 | 36 | 36 | 37 | 37 | 36 | 34 | 35 | 37 | 38 |
| July | 31 | |||||||||
| Weather | Rain | |||||||||
| Min air temperature (°C) | 27 | |||||||||
| Max air temperature (°C) | 35 |
| Instrument | Mode | Accuracy | Range | Interval | Sensor |
|---|---|---|---|---|---|
| Wind speed | Automatic | ±0.3m/s | 0–70m/s | 60s | DS-2 |
| Relative Humidity | Automatic | ±5%RH | 10–95%RH | 60s | TR-70wf |
| Air Temperature | Automatic | ±0.5 °C | 0-+55 °C | 60s | TR-70wf |
| Initial Data | Content |
|---|---|
| Beginning time | 0:00, 24 July 2016 |
| Total time | 24 h |
| Roughness length | 0.1 |
| Air temperature | 38 °C |
| Relative humidity | 45% |
| Wind velocity in 10 m | 1.8 m/s |
| Wind direction | 145° |
| Albedo of wall | 0.3 |
| Albedo of roof | 0.2 |
| Albedo of ground | 0.4 |
| Dimension of the grid in dx | 3 m |
| Dimension of the grid in dy | 3 m |
| Dimension of the grid in dz | 2 m |
| No. of x grid | 200 |
| No. of y grid | 100 |
| No. of z grid | 30 |
| PET (°C) | Thermal Perception |
|---|---|
| <13 | Very cold |
| 13–17 | Cold |
| 17–21 | Cool |
| 21–25 | Slightly cool |
| 25–29 | Neutral |
| 29–33 | Slightly warm |
| 33–37 | Warm |
| 37–41 | Hot |
| >41 | Very hot |
| Case | Introductions |
|---|---|
| 1 | Increasing average building height |
| 2 | Increasing tree coverage |
| 3 | Replacing the paving material with higher albedo (ground albedo = 0.6) |
| 4 | Case 1 + Case 2 (Bischofia Javanica) + Case 3 |
© 2019 by the authors. Licensee MDPI, Basel, Switzerland. This article is an open access article distributed under the terms and conditions of the Creative Commons Attribution (CC BY) license (http://creativecommons.org/licenses/by/4.0/).
Share and Cite
Zhang, L.; Ma, X.; Zhao, J.; Wang, M. Tourists’ Thermal Experience and Health in a Commercial Pedestrianized Block: A Case Study in a Hot and Humid Region of Southern China. Int. J. Environ. Res. Public Health 2019, 16, 5072. https://doi.org/10.3390/ijerph16245072
Zhang L, Ma X, Zhao J, Wang M. Tourists’ Thermal Experience and Health in a Commercial Pedestrianized Block: A Case Study in a Hot and Humid Region of Southern China. International Journal of Environmental Research and Public Health. 2019; 16(24):5072. https://doi.org/10.3390/ijerph16245072
Chicago/Turabian StyleZhang, Lei, Xuan Ma, Jingyuan Zhao, and Mengying Wang. 2019. "Tourists’ Thermal Experience and Health in a Commercial Pedestrianized Block: A Case Study in a Hot and Humid Region of Southern China" International Journal of Environmental Research and Public Health 16, no. 24: 5072. https://doi.org/10.3390/ijerph16245072
APA StyleZhang, L., Ma, X., Zhao, J., & Wang, M. (2019). Tourists’ Thermal Experience and Health in a Commercial Pedestrianized Block: A Case Study in a Hot and Humid Region of Southern China. International Journal of Environmental Research and Public Health, 16(24), 5072. https://doi.org/10.3390/ijerph16245072