Abstract
The purpose of this study is to explore the association between proximity to open space and adult renal function. This was a cross-sectional study. Adult residents of Taipei metropolis were recruited in the analysis. The proximity of each subject to open space was measured using the Geographic Information System. Residents were divided into two groups: with and without chronic kidney disease (CKD). We made univariable comparisons between the two groups. The logistic regression models were used to estimate the odds ratio of CKD. Forest plot was used to examine the effect of interaction between distance to open space and subgroup variable on CKD. A total number of 21,656 subjects with mean age 53.6 years were enrolled in the study. Of the subjects, 2226 (10.28%) had CKD. The mean and standard deviation of distance to open space were 117.23 m and 80.19 m, respectively. Every 100 m distance to open space was associated with an odds ratio of 1.071 for CKD. Subgroup analysis revealed that residents of female, without hypertension, or without impaired fasting glucose (IFG) living more than 200 m from open spaces have greater odds of CKD than those living less than 200 m. Conclusions: Proximity to open space was associated with a lower prevalence of CKD among adults in Taiwan. Such association was enhanced among females and healthy adults without hypertension or impaired fasting glucose (IFG).
1. Introduction
It is well known that the ecosystem affects the well-being of humankind. However, urbanization is a global trend, especially in Asia. More than half of the world’s population currently live in cities []. Urban citizens living in artificial environments may lack the services providing by the ecosystem. Fortunately, open spaces can compensate for it. The effects of open space on health include both physiological and psychological benefits. Open space independently augments the physical activity of nearby residents []. The urban environmental design may also influence behavior, mental health [] and well-being [] of residents. Other health benefits include an increase in birth weight (grams) among the lowest education level group [], decrease in number of small for gestational age births [], lower prevalence of early childhood asthma [], lower morbidity (especially for anxiety disorder and depression) [], lower mortality (especially for respiratory disease) [], lower heat-related mortality [], increase in longevity of urban senior citizens [], and lower risk of stroke mortality [].
Studies on the health effects of open space in Asia are relatively fewer. Moreover, to our best knowledge, the association between open space and renal diseases has not been explored. In Taiwan, the prevalence of chronic kidney disease (CKD) among adults ranged from 6.9% [] to 11.9% [], exerting a huge burden on the health care system. This study aims to explore the relationship between proximity to open space and renal diseases among adults.
2. Materials and Methods
Study Population: Residents aged 30 and above who lived in metropolitan areas (six districts with population densities higher than 20,000/km2) in 2009 were the target of the study (Figure 1). One of the districts, Yonghe City, has the highest population density in Taiwan, with population density 41,446/km2 in 2009. Subjects were recruited from the New Taipei City Health Screening Program from 2007 to 2009. This annual program was supervised by the Department of Health of the New Taipei City Government. All citizens aged 30 and above were invited to participate in the program every three years. Subjects with incomplete information were excluded from the study. Finally, 2630 subjects were excluded due to missing data and a total of 21,656 subjects from six districts were included in this study. Permission to use these decoded data from the Department of Health of the New Taipei City Government was granted. This study was approved by the Joint Institutional Review Boards of National Health Research Institutes (Approval number: EO-104-PP-09).
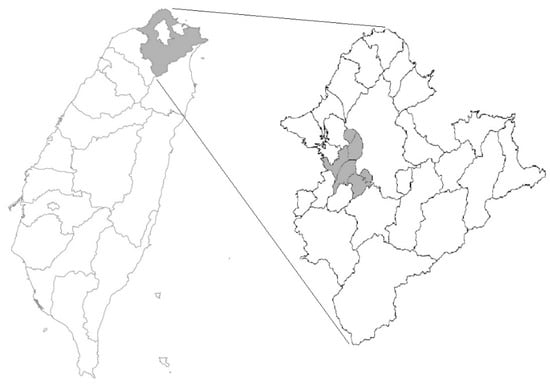
Figure 1.
The map of Taiwan with New Taipei City in gray area (left). Residents lived in the metropolitan area of the city were included in the study (right).
Health Data: The annual health screening program was implemented by the Department of Health of the New Taipei City Government. The program involved a self-reporting questionnaire, interview by a physician, and blood sampling for biochemistry study. Demographic data including age, gender, location of residence, alcohol consumption, smoking, and betel-nut-chewing habit were collected. During the health examination, weight, height, and blood pressure of each subject were measured. Serum creatinine was analyzed using isotope dilution mass spectrometry (IDMS)-traceable method. Hypertension was defined as a systolic blood pressure ≥140 mmHg or a diastolic blood pressure ≥90 mmHg. Overweight was defined as body mass index (BMI) ≥24 (kg/m2). Impaired fasting glucose (IFG) was defined as fasting sugar ≥126 mg/dL. Hypercholesteremia was defined as serum cholesterol level ≥200 mg/dL.
Urinanalysis: Each subject’s first morning mid-void urine was collected during the day of the survey. Urinanalysis was performed using Multistix test strips (Bayer Diarnostics, Victoria, Australia) which grade proteinuria as negative, trace, 1+ (0.3 g/L), 2+ (1 g/L), 3+ (3 g/L) or 4+ (≥20 g/L) by a reaction with tetrabromphenol blue.
Renal Function: To estimate the glomerular filtration rate (GFR), the CKD-EPI-Taiwan equation was used. This equation has been proved to have a lower bias than that derived from the modification of diet in renal disease (MDRD) study []. The CKD-EPI-Taiwan equation is as follows: eGFR = 1.262 x [1.41xmin(Scr/κ, 1)α x max(Scr/κ,1)1.209 x 0.993Age x 1.018(if female) x 1.159(if black)] 0.914, where Scr denotes serum creatinine, κ is 0.7 for female and 0.9 for male, α is -0.329 for female and -0.411 for male, min indicates the minimum of Scr/κ or 1, and max indicates the maximum of Scr/κ or 1. In this study, CKD was defined as eGFR ≤60 mL/min/1.73 m2, which stands for 50% loss in renal function.
Distance to Open Space: Locations of subjects’ residence were geocoded using the ArcGIS 10.1 software, and their minimum distance to open space was calculated. Open space is defined by the US EPA as any open piece of land that is undeveloped (has no buildings or built structures) and is accessible to the public []. Examples of open space are green space, schoolyards, playgrounds, public plazas and vacant lots. The land use database was established by the National Land Surveying and Mapping Center, Taiwan in 2007. According to the standard land use coding manual of the database, open spaces include public utilities (schools, code 00202-0260204) and recreation areas (park, code 070201; playground, code 070202; and sports facility, code 070203) (Figure 2).
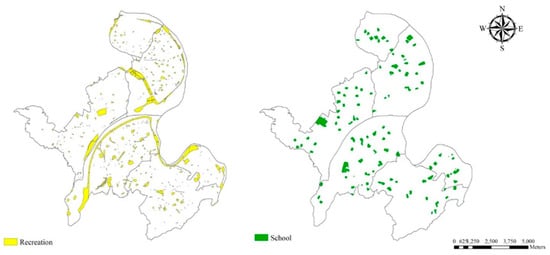
Figure 2.
Locations of open spaces in the metropolitan area (six districts) of New Taipei City.
Particulate Matter Exposures: We used land use regression (LUR) model to estimate annual average concentrations of PM2.5, PM2.5Absorbance, PM10, and PMCoarse at each resident’s address. The LUR model was developed for the European Study of Cohorts for Air Pollution Effects (ESCAPE) project []. To develop the model, we measured the pollutants in 20 different sites during three 14-day periods from October 2009 to August 2010. The detailed protocol of the model was described in the previous paper [].
Statistical analysis: Patients were divided into two groups according to the level of eGFR: with and without CKD. The demographic data and other clinically relevant data of continuous variables are presented as mean and standard deviation, whereas categorical variables were presented as numbers and percentages. We made univariable statistical comparisons between groups by Student’s t-tests for continuous data, and chi-square tests for categorical data. The logistic regression model was used to estimate the odds ratio of CKD. Variables that achieved statistical significance in univariate analysis were subsequently entered into multivariate analysis. According to the distance from the open space, it is divided into two groups of ≥200 meters and <200 meters. Forest plot showing the effect of interaction between distance to open space and subgroup variable (age, gender, overweight, hypertension, impaired fasting glucose (IFG), age, smoking, and drinking) on CKD. The final model retains only statistically significant factors after multiple regression. All data were analyzed using the IBM SPSS Statistics for Windows, Version 22.0 (IBM Corp., Armonk, NY). p-values < 0.05 were considered statistically significant.
3. Results
New Taipei City had the most population among Taiwan’s administrative regions. The metropolitan area of the city includes six districts, which had population densities range from 20,308/km2 to 41,446/km2. The six districts had a total area of 924,855 km2 and total population of 2,190,426 citizens at the end of 2009. The distribution location of open spaces is shown in Figure 2. The recreational spaces (include parks, playgrounds and sport venues) had a total area of 6.46 km2 (6.99%). The school spaces (include elementary schools, high schools, and colleges) had a total area of 3.9km2 (4.22%). Per capita open space availability is 4.7m2.
Table 1 lists the demographic data of our study subjects. In brief, there were 21,656 subjects in total, with a mean age 53.6 years and male to female ratio of 1:2. About half (50.4%) of the subjects were overweight, and 33.2% of subjects were hypertensive. Moreover, 18.3% of subjects had smoked, 36.7% had consumed alcohol, and 3.5% had chewed betel nut. The mean eGFR was 77.05 mL/min/m2. The prevalence of CKD (eGFR < 60 mL/min/m2) was 10.3%. The mean ± SD distance to open space was 117.23 ± 80.19 m. The longest distance to open space was 570.7 m.

Table 1.
Characteristics of the 21,656 subjects.
Study subjects were divided into two groups according to the level of eGFR: with and without CKD. We made univariable statistical comparisons between groups by Student’s t-tests for continuous data, and chi-square tests for categorical data (Table 2). We found that variables significantly associated with CKD include, age ≥65 years old, male gender, education level, smoking, alcohol consumption, hypertension, overweight, impaired fasting glucose (IFG), and proteinuria.
Table 2.
Comparison between subjects with and without CKD.
The logistic regression model was used to estimate the odds ratio (OR) of CKD. Variables with significant OR of CKD after univariate analysis were subsequently analyzed by multivariate method (Table 3). We found that distance to open space (every 100 m) has significant odds (1.071) for CKD. Other parameters also have significant odds for CKD include: PMcoarse (OR 1.017), age ≥65 (OR 6.812), male (OR 2.741), uneducated (OR 1.714), elementary or junior high school (OR 1.339), overweight (OR 1.308), hypertension (OR 1.184), cholesterol level (OR 1.002), lower red blood count(OR 1.876), higher leukocyte count (OR 1.097), proteinuria +/- (OR 2.156), proteinuria + (OR 5.645), proteinuria ++ (OR 3.701), and proteinuria +++ (OR 15.028).
Table 3.
Odds ratio for CKD.
Forest plot (Table 4) showing subgroup analysis of the risk of CKD in different distance to the open space. The result shows that if residents of the female gender, without hypertension, or without impaired fasting glucose (IFG) living more than 200 m from open spaces, they would have greater odds of CKD than those living less than 200 m from open spaces.
Table 4.
Subgroup analyses of the effect of distance to open space on CKD.
Table 5 reveals the results of multiple linear regression on eGFR. Variables with significant odds of CKD were selected for this analysis. We found that predictor with the largest negative partial regression coefficient (β) was proteinuria (−4.770). The β value of distance to open space (100 m) and PMCoarse were −0.185 and −0.122, respectively.
Table 5.
Multiple linear regression of predictors on eGFR.
4. Discussion
The evidence of the beneficial effects of urban open space on human health is substantial. Prior research revealed that urban open space has many benefits on health. Maas et al. investigated the relationship between physician-assessed morbidity and green space in the living environment of residents []. They found lower morbidities caused by anxiety (OR: 0.95), depression (OR: 0.96), coronary heart disease (OR: 0.97), infectious disease of the intestinal canal (OR: 0.97), urinary tract infection (OR: 0.97), musculoskeletal disease (OR: 0.98), and diabetes mellitus (OR: 0.98) among people in residences having green space within 1-km radius. Other benefits of open space on the health of residents in the vicinity include lower blood pressure [], less obesity [], decreased mortality of respiratory disease [], less heat-associated diseases, especially among elderly people with chronic diseases (congestive heart failure, myocardial infarction, chronic obstructive pulmonary disease, and diabetes mellitus) [] , lower stroke mortality [], increased longevity of senior citizens [], less newborns with low birth weight [,], and less children with asthma [].
The mechanisms behind beneficial effects of open space on physical and mental health include enhancing physical activity [,] and recovery from stress and attention fatigue [], respectively. As of social health, open space facilitates of social contact [], reduces socioeconomic health inequalities [], while ecologically, is has cooling effects [], can reduce noise reduction [] and filter air [].
Taiwan is a country with a very high population density (649 persons/km2) and high urbanization. In such a crowded country, open space is very precious, especially in metropolis areas. Besides, the disease burden of CKD in Taiwan is an important public health concern [,]. However, to our best knowledge, the relationship between urban open space and human kidney function has not yet been studied. Hence, this study was conducted to explore the association between proximity to urban open space and renal function of residents.
We used logistic regression method to evaluate variables’ odds ratio for CKD. Multiple analysis results revealed that 100 m distance to open space had an odds ratio of 1.072 for CKD (Table 3). Results obtained from multiple linear regression on eGFR showed that distance to open space 100 m is associated with lower eGFR (Table 5). These findings are biologically plausible because urban open space facilitates the physical activity of residents [,], which in turn is beneficial to renal function [,]. Both proximity to green spaces [] and built environments [] are revealed to be associated with increased physical activity in the two review studies. Furthermore, previous studies found that better renal function is associated with physical activity. Joseph et al. [] reviewed the data of the Third National Health and Nutrition Examination Survey (NHANES III) and found a clear association between physical activity and GFR, particularly in adults without metabolic syndrome. Another US study using the NHANES database and estimates subjects’ objective physical activity by both accelerometer and questionnaire []. They found a positive association of total and light physical activities with renal function. The mechanisms behind the association of physical activity with better renal function include physical activity that leads to better glycemic control in type 2 diabetes mellitus [] and better BP control. DM and hypertension are the leading causes of CKD. Hyperlipidemia is also a risk factor of CKD and physical activity may also result in better lipid control [].
The second reason accounting for a better renal function is that urban open space may provide a function of air filtration []. McPherson et al. estimated that approximately 9.8 tons of PM10 had been removed by trees in the Chicago area per day []. On the other hand, air pollution is associated with poorer renal function. A recent longitudinal study explored the association between PM2.5 and renal function in older men [] and found that 1-year PM2.5 exposure was associated with a decrease in eGFR of 1.87 mL/min/1.73 m2. The possible mechanism involved includes inflammation, oxidative stress, blood pressure, and vascular/endothelial function as a result of exposure to air pollutants. With the effect of air filtration of trees, residents living near green spaces may benefit from having better air quality. However, it needs more study to confirm this relationship.
Besides distance to open space, other demographic characteristics and comorbidities of subjects were also examined for their association with renal function. Consistent with previous studies, factors significantly associated with CKD included aged, male gender, uneducated, smoking, hypertension, overweight, impaired fasting glucose (IFG), and proteinuria (Table 2). After multiple analysis of logistic regression of CKD, factors with an odds ratio for CKD included distance to open space, PMcoarse, aged, male gender, uneducated, overweight, proteinuria, hypercholesteremia, anemia and leukocytosis (Table 3).
To further explore the effect of distance on CKD, we performed subgroups analysis to compare certain groups of residents who live within 200 m to open space and who live more than 200 m to open space. There are several reasons that we chose 200 m as distance thresholds to access open space. Natural England’s Accessible Natural Greenspace Guidance recommends that in order to allow everyone access to natural green space, they should live no more than 300 meters (5 minutes’ walk) from home []. A Danish survey found that 2000 adults Danes age 18-80 had good access to and use frequently of green space if they lived less than 100 m from it []. Pedestrian walking speed is another concern. The walking speed is faster among younger healthy male persons. The 15th percentile walking speed for older pedestrians is 0.67 m per second []. Taken together, most aged residents can be access to nearby open space within five minutes if they live no more than 200 m from it.
Subgroups analysis of the risk of CKD found that subjects who were female, without hypertension, and without impaired fasting glucose (IFG) have a significantly higher odds ratio of CKD if they live more than 200 m from open space than those who live less than 200 m (Table 4). In other words, the negative effects of distance to open space on renal function are more prominent among female or relatively healthier residents. One possible reason is that for subjects with comorbidities that were risk factors for CKD, the effects of distance to open space on renal function are relatively much smaller than those who without the comorbidities. Other risk factors of CKD are greater drivers of kidney function loss than the distance to open space. Another possible reason is that the medication for treating the comorbidities may interfere with the association between distance to open space and renal function. Further research is necessary to elucidate the current findings and hypotheses. Anyway, our finding reassures the important role of disease prevention of urban open spaces.
In the current study, gender differences in the relationship between open space and health were also noted in other studies. A study from Dutch explored the relationship between the self-reported health of over 10,000 people and the amount of green space in their living environment. The study found the relationship was stronger for housewives and the elderly []. Stafford et al. explored whether associations between neighborhood characteristics and self-rated health are different for men and women in the UK. They found that the influence of the residential environment on women’s health was greater than that on men []. However, Richardson et al. performed a UK-wide study to explore the gender difference of the association between urban green space and health outcome. They found that cardiovascular disease mortality was associated with urban green space in men, but not in women. The postulated reason is that women have a greater concern of safety issue about green space. Besides, their leisure time exercise was more severely attenuated by having young children than men []. In the current study, the gender difference in the relationship between open space and health was noted. The personal safety issue is small in New Taipei City, where the open spaces are relatively small and the population density is high. A possible explanation for the greater influence of residential environments on women’s renal function is that housewives spend more time in their neighborhood environment than their husbands do. Taiwan’s female employment rate (between 15–65 years old) was only 49.62% in 2009. On the other hand, men may have higher mobility and thus spend more time far away from home. Another possible reason is that gender difference in vulnerability to negative health impacts on renal function.
Information of the general population of New Taipei City >30 years of age in 2009 obtained through the National Health Interview Survey and accessible at the government’s web site [] was analyzed. Compared with the general population of New Taipei City, our subjects were more likely to be overweight (50% vs. 47%) and hypertensive (33% vs. 22%), but less likely to be smokers (11% vs. 20%), consume alcohol (37% vs. 55%), and chew betel nuts (3.5% vs. 8.3%). In terms of education level, our subjects are more likely to be uneducated (7.09% vs. 1.59%), have attended elementary or junior high school (42.71% vs. 35.24%), but less likely to have received college or graduate school education (20.34% vs. 30.49%).
This study we used education level to stand for socioeconomic status and found higher odds of CKD among uneducated subjects (Table 3). This finding is comparable to the result obtained by Mitchell et al. [] that open space can reduce the negative effect of lower socioeconomic status on health. The incidence rate ratios (IRR) for all-cause mortality in the least and the most greenery area were 1.93 and 1.43, respectively. The effect was also noted in circulatory diseases, with IRR 2.19 in the least green area and 1.54 in the most greenery area. Similar results were also noted by Maas et al. who found a stronger relationship between urban green space and health among lower socioeconomic groups []. The physical activity level is lower among people with low socioeconomic status []. The reason behind our finding is that if these people live near open space, they have greater access to places for doing exercise. Equity is at the heart of the Sustainable Development Goal (SDG) advocated by the United Nations. Urban open space may promote healthy lives and well-being for all ages (SDG 3), reduce inequalities (SDG 10), and establish sustainable cities and communities (SDG 11).
This study explored the health effects of “open space” rather than “green space”, which is more commonly in research conducted in western countries. The reason is that there are very few green spaces in New Taipei City. Most residents are unable to easily access to green space. However, open spaces such as schoolyards are much more available. In order to enhance residents doing exercise, Taiwan enforced “National Sports Act” in 2000. The Article 7 of the Act states: “Sports facilities of all levels of educational institutions should open to the public and provide access to community citizens for sporting activities, under the pretext that it does not affect the teaching and life management of schools [].” A national survey conducted later by the Sports Administration, Ministry of Education, Taiwan enrolled 15,361 residents revealed that the most common places of exercise are nearby the home (17%) and schools (17%) [,]. Many residents of the city do exercise every day in their nearby schools after the classes are over.
One of the strengths of our study is that this may be the first study to explore the relationship between open space and renal function. Second, we used a general survey to explore the health effects of local residents rather than self-rated health perception. Third, this is a large cross-sectional study in an area with high population density performed by the local government. The weakness of our study is that we had not measured subjectively or objectively the real physical activity and types of physical activity of our subjects. However, the relationship between distance to open space and physical activity had been proved by several other studies. Besides, the types of physical activity in our study subjects may be different from that of the western countries. Under the influence of traditional culture, there are many citizens of all ages play Taijiquan in their nearby open spaces such as schoolyards or parks. Some others may also play Chinese boxing, martial arts, or folk dance. The second weakness is that we had not checked the medication taken by our study subjects. Medication may modify the effect of distance to open space on renal health. Third, the serum creatinine level was measured only once. The possibility of laboratory error is a concern. Besides, we had no data about the trend of renal function over time. Further studies are necessary to explore the causal relationship and long-term health effect of urban open spaces on the disease progression of CKD.
5. Conclusions
In conclusion, living more distant from urban open space in New Taipei Metropolis is associated with lower eGFR and higher odds of CKD. The association is stronger in female gender or relatively healthier adults without hypertension or impaired fasting glucose (IFG). Proper urban design is thus essential in Taiwan where prevalence and incidence of CKD are very high. Further researches were necessary to explore whether proximity to open space will also be associated with the renal function of residents in suburban or rural areas.
Author Contributions
conceptualization, C.-C.C.; methodology, C.-C.C.; software, C.-C.C.; validation, C.-C.C.; formal analysis, Y.-R.Y. and S.-Y.C.; investigation, Y.-R.Y. and S.-Y.C.; resources, Y.-R.Y. and S.-Y.C.; data curation, Y.-J.C.; writing—original draft preparation, J.-W.C. and Y.-R.Y.; writing—review and editing, J.-W.C.; visualization, C.-C.C.; supervision, C.-C.C.; project administration, C.-C.C.
Funding
This research received no external funding.
Conflicts of Interest
The authors declare no conflict of interest.
References
- Siemens, A.G. The Green City Index. A Summary of the Green City Index Research Series. 2015. Available online: http://wikiprogress.org/data/organization/green-city-index (accessed on 15 January 2019).
- Kaczynski, A.T.; Henderson, K.A. Environmental correlates of physical activity: A review of evidence about parks and recreation. Leis. Sci. 2007, 29, 315–354. [Google Scholar] [CrossRef]
- Pretty, J.; Peacock, J.; Sellens, M.; Griffin, M. The mental and physical health outcomes of green exercise. Int. J. Environ. Health Res. 2005, 15, 319–337. [Google Scholar] [CrossRef] [PubMed]
- Maas, J.; Verheij, R.A.; Groenewegen, P.P.; De Vries, S.; Spreeuwenberg, P. Green space, urbanity, and health: How strong is the relation? J. Epidemiol. Community Health 2006, 60, 587–592. [Google Scholar] [CrossRef] [PubMed]
- Dadvand, P.; de Nazelle, A.; Figueras, F.; Basagaña, X.; Su, J.; Amoly, E.; Jerrett, M.; Vrijheid, M.; Sunyer, J.; Nieuwenhuijsen, M.J. Green space, health inequality and pregnancy. Environ. Int. 2012, 40, 110–115. [Google Scholar] [CrossRef] [PubMed]
- Donovan, G.H.; Michael, Y.L.; Butry, D.T.; Sullivan, A.D.; Chase, J.M. Urban trees and the risk of poor birth outcomes. Health Place 2011, 17, 390–393. [Google Scholar] [CrossRef] [PubMed]
- Lovasi, G.S.; Quinn, J.W.; Neckerman, K.M.; Perzanowski, M.S.; Rundle, A. Children living in areas with more street trees have lower prevalence of asthma. J. Epidemiol. Community Health 2008, 62, 647–649. [Google Scholar] [CrossRef] [PubMed]
- Maas, J.; Verheij, R.A.; de Vries, S.; Spreeuwenberg, P.; Schellevis, F.G.; Groenewegen, P.P. Morbidity is related to a green living environment. J. Epidemiol. Community Health 2009, 63, 967–973. [Google Scholar] [CrossRef] [PubMed]
- Villeneuve, P.J.; Jerrett, M.; Su, J.G.; Burnett, R.T.; Chen, H.; Wheeler, A.J.; Goldberg, M.S. A cohort study relating urban green space with mortality in Ontario, Canada. Environ. Res. 2012, 115, 51–58. [Google Scholar] [CrossRef]
- Zanobetti, A.; O’Neill, M.S.; Gronlund, C.J.; Schwartz, J.D. Summer temperature variability and long-term survival among elderly people with chronic disease. Proc. Natl. Acad. Sci. USA 2012, 109, 6608–6613. [Google Scholar] [CrossRef]
- Takano, T.; Nakamura, K.; Watanabe, M. Urban residential environments and senior citizens’ longevity in megacity areas: The importance of walkable green spaces. J. Epidemiol. Community Health. 2002, 56, 913–918. [Google Scholar] [CrossRef]
- Hu, Z.; Liebens, J.; Rao, K.R. Linking stroke mortality with air pollution, income, and greenness in northwest Florida: An ecological geographical study. Int. J. Health Geogr. 2008, 7, 20–41. [Google Scholar] [CrossRef] [PubMed]
- Hsu, C.C.; Hwang, S.J.; Wen, C.P.; Chang, H.Y.; Chen, T.; Shiu, R.S.; Horng, S.S.; Chang, Y.K.; Yang, W.C. High prevalence and low awareness of CKD in Taiwan: A study on the relationship between serum creatinine and awareness from a nationally representative survey. Am. J. Kidney Dis. 2006, 48, 727–738. [Google Scholar] [CrossRef] [PubMed]
- Wen, C.P.; Cheng, T.Y.D.; Tsai, M.K.; Chang, Y.C.; Chan, H.T.; Tsai, S.P.; Chiang, P.H.; Hsu, C.C.; Sung, P.K.; Hsu, Y.H.; et al. All-cause mortality attributable to chronic kidney disease: A prospective cohort study based on 462293 adults in Taiwan. Lancet 2008, 371, 2173–2182. [Google Scholar] [CrossRef]
- Chen, L.I.; Guh, J.Y.; Wu, K.D.; Chen, Y.M.; Kuo, M.C.; Hwang, S.J.; Chien, T.H.; Chen, H.C. Modification of diet in renal disease (MDRD) study and CKD epidemiology collaboration (CKD-EPI) equations for Taiwanese adults. PLoS ONE 2014, 9, e99645. [Google Scholar] [CrossRef] [PubMed]
- United States Environmental Protection Agency. What Is Open Space/Green Space? Available online: https://www3.epa.gov/region1/eco/uep/openspace.html (accessed on 15 January 2019).
- Eeftens, M.; Beelen, R.; de Hoogh, K.; Bellander, T.; Cesaroni, G.; Cirach, M.; Dimakopoulou, K.; Declercq, C.; Dėdelė, A.; Dons, E.; et al. Development of land use regression models for PM2.5, PM2.5 absorbance, PM10 and PMcoarse in 20 European study areas; results of the ESCAPE project. Environ. Sci. Technol. 2012, 46, 11195–11205. [Google Scholar] [CrossRef]
- Lee, J.H.; Wu, C.F.; Hoek, G.; de Hoogh, K.; Beelen, R.; Brunekreef, B.; Chan, C.C. LUR models for particulate matters in the Taipei metropolis with high densities of roads and strong activities of industry, commerce and construction. Sci. Total Environ. 2015, 514, 178–184. [Google Scholar] [CrossRef] [PubMed]
- Hartig, T.; Evans, G.W.; Jamner, L.D.; Davis, D.S.; Gärling, T. Tracking restoration in natural and urban field settings. J. Environ. Psychol. 2003, 23, 109–123. [Google Scholar] [CrossRef]
- Ellaway, A.; Macintyre, S.; Bonnefoy, X. Graffiti, greenery, and obesity in adults: Secondary analysis of European cross sectional survey. BMJ 2005, 331, 611–612. [Google Scholar] [CrossRef]
- Humpel, N.; Owen, N.; Leslie, E. Environmental factors associated with adults’ participation in physical activity: A review. Am. J. Prev. Med. 2002, 22, 188–199. [Google Scholar] [CrossRef]
- Sugiyama, T.; Leslie, E.; Giles-Corti, B.; Owen, N. Associations of neighbourhood greenness with physical and mental health: Do walking, social coherence and local social interaction explain the relationships? J. Epidemiol. Community Health 2008, 62, e9. [Google Scholar] [CrossRef]
- Maas, J.; Van Dillen, S.M.; Verheij, R.A.; Groenewegen, P.P. Social contacts as a possible mechanism behind the relation between green space and health. Health Place 2009, 15, 586–595. [Google Scholar] [CrossRef] [PubMed]
- Mitchell, R.; Popham, F. Effect of exposure to natural environment on health inequalities: An observational population study. Lancet 2008, 372, 1655–1660. [Google Scholar] [CrossRef]
- Solecki, W.D.; Rosenzweig, C.; Parshall, L.; Pope, G.; Clark, M.; Cox, J.; Wiencke, M. Mitigation of the heat island effect in urban New Jersey. Glob. Environ. Chang. B Environ. Hazards 2005, 6, 39–49. [Google Scholar] [CrossRef]
- Bolund, P.; Hunhammar, S. Ecosystem services in urban areas. Ecol. Econ. 1999, 29, 293–301. [Google Scholar] [CrossRef]
- Escobedo, F.J.; Nowak, D.J. Spatial heterogeneity and air pollution removal by an urban forest. Landsc. Urban Plan. 2009, 90, 102–110. [Google Scholar] [CrossRef]
- Hwang, S.J.; Lin, M.Y.; Chen, H.C.; Hwang, S.C.; Yang, W.C.; Hsu, C.C.; Chiu, H.H.; Mau, L.W. Increased risk of mortality in the elderly population with late-stage chronic kidney disease: A cohort study in Taiwan. Nephrol. Dial. Transplant. 2008, 23, 3192–3198. [Google Scholar] [CrossRef] [PubMed]
- Sallis, J.F.; Floyd, M.F.; Rodriguez, D.A.; Saelens, B.E. Role of Built Environments in Physical Activity, Obesity, and Cardiovascular Disease. Circulation 2012, 125, 729–737. [Google Scholar] [CrossRef] [PubMed]
- Finkelstein, J.; Joshi, A.; Hise, M.K. Association of physical activity and renal function in subjects with and without metabolic syndrome: A review of the Third National Health and Nutrition Examination Survey (NHANES III). Am. J. Kidney Dis. 2006, 48, 372–382. [Google Scholar] [CrossRef] [PubMed]
- Hawkins, M.S.; Sevick, M.A.; Richardson, C.R.; Fried, L.F.; Arena, V.C.; Kriska, A.M. Association between physical activity and kidney function: National Health and Nutrition Examination Survey. Med. Sci. Sports Exerc. 2011, 43, 1457–1464. [Google Scholar] [CrossRef]
- Boulé, N.G.; Haddad, E.; Kenny, G.P.; Wells, G.A.; Sigal, R.J. Effects of exercise on glycemic control and body mass in type 2 impaired fasting glucose (IFG) mellitus: A meta-analysis of controlled clinical trials. JAMA 2001, 286, 1218–1227. [Google Scholar] [CrossRef]
- Fletcher, B.; Berra, K.; Ades, P.; Braun, L.T.; Burke, L.E.; Durstine, J.L.; Fair, J.M.; Fletcher, G.F.; Goff, D.; Hayman, L.L.; et al. Managing Abnormal Blood Lipids: A Collaborative Approach: Cosponsored by the Councils on Cardiovascular Nursing; Arteriosclerosis, Thrombosis, and Vascular Biology; Basic Cardiovascular Sciences; Cardiovascular Disease in the Young; Clinical Cardiology; Epidemiology and Prevention; Nutrition, Physical Activity, and Metabolism; and Stroke; and the Preventive Cardiovascular Nurses Association. Circulation 2005, 112, 3184–3209. [Google Scholar] [CrossRef] [PubMed]
- Jim, C.; Chen, W.Y. Assessing the ecosystem service of air pollutant removal by urban trees in Guangzhou (China). J. Environ. Manag. 2008, 88, 665–676. [Google Scholar] [CrossRef] [PubMed]
- McPherson, G.E.; Nowak, D.J.; Rowntree, R.A. Chicago’s Urban Forest Ecosystem: Results of the Chicago Urban Forest Climate Project. 1994. Available online: https://www.fs.usda.gov/treesearch/pubs/4285 (accessed on 15 January 2019).
- Mehta, A.J.; Zanobetti, A.; Bind, M.A.C.; Kloog, I.; Koutrakis, P.; Sparrow, D.; Vokonas, P.S.; Schwartz, J.D. Long-Term Exposure to Ambient Fine Particulate Matter and Renal Function in Older Men: The VA Normative Aging Study. Environ. Health Perspect. 2016, 124, 1353–1360. [Google Scholar] [CrossRef] [PubMed]
- England, N. Nature Nearby: Accessible Natural Greenspace Guidance. Natural England: Peterborough 2010. Available online: https://webarchive.nationalarchives.gov.uk/20140605145320/http://publications.naturalengland.org.uk/publication/40004?category=47004 (accessed on 15 January 2019).
- Nielsen, T.S.; Hansen, K.B. Do green areas affect health? Results from a Danish survey on the use of green areas and health indicators. Health Place 2007, 13, 839–850. [Google Scholar] [CrossRef] [PubMed]
- Chang, C.Y.; Woo, T.H.; Wang, S.F. Analysis of pedestrian walking speeds at crosswalks in Taiwan. J. East. Asia Soc. Transp. Stud. 2011, 9, 1186–1200. [Google Scholar] [CrossRef]
- De Vries, S.; Verheij, R.A.; Groenewegen, P.P.; Spreeuwenberg, P. Natural environments—Healthy environments? An exploratory analysis of the relationship between greenspace and health. Environ. Plan. A 2003, 35, 1717–1731. [Google Scholar] [CrossRef]
- Stafford, M.; Cummins, S.; Macintyre, S.; Ellaway, A.; Marmot, M. Gender differences in the associations between health and neighbourhood environment. Soc. Sci. Med. 2005, 60, 1681–1692. [Google Scholar] [CrossRef] [PubMed]
- Richardson, E.A.; Mitchell, R. Gender differences in relationships between urban green space and health in the United Kingdom. Soc. Sci. Med. 2010, 71, 568–575. [Google Scholar] [CrossRef]
- Health Promotion Administration, Ministry of Health and Welfare. Available online: http://olap.hpa.gov.tw (accessed on 15 January 2019).
- Popham, F.; Mitchell, R. Relation of employment status to socioeconomic position and physical activity types. Prev. Med. 2007, 45, 182–188. [Google Scholar] [CrossRef]
- Laws & Regulations Database of the Republic of China. National Sports Act. Available online: http://law.moj.gov.tw/Eng/LawClass/LawAll.aspx?PCode=H0120001 (accessed on 15 January 2019).
- Sports Administration, Ministry of Education, Taiwan. Available online: https://www.sa.gov.tw/wSite/ct?xItem=5457&ctNode=698&mp=11 (accessed on 15 January 2019).
- Sports Administration, Ministry of Education, Taiwan. Available online: http://www.sa.gov.tw/wSite/public/Data/f1387422688352.pdf (accessed on 15 January 2019).

© 2019 by the authors. Licensee MDPI, Basel, Switzerland. This article is an open access article distributed under the terms and conditions of the Creative Commons Attribution (CC BY) license (http://creativecommons.org/licenses/by/4.0/).