Experimental Study on the Effects of Vegetation on the Dissipation of Supersaturated Total Dissolved Gas in Flowing Water


Abstract
1. Introduction
2. Experiment
2.1. Experimental System
2.2. Measuring Methods and Instruments
2.3. Experimental Conditions
3. Results and Discussions
3.1. Velocity
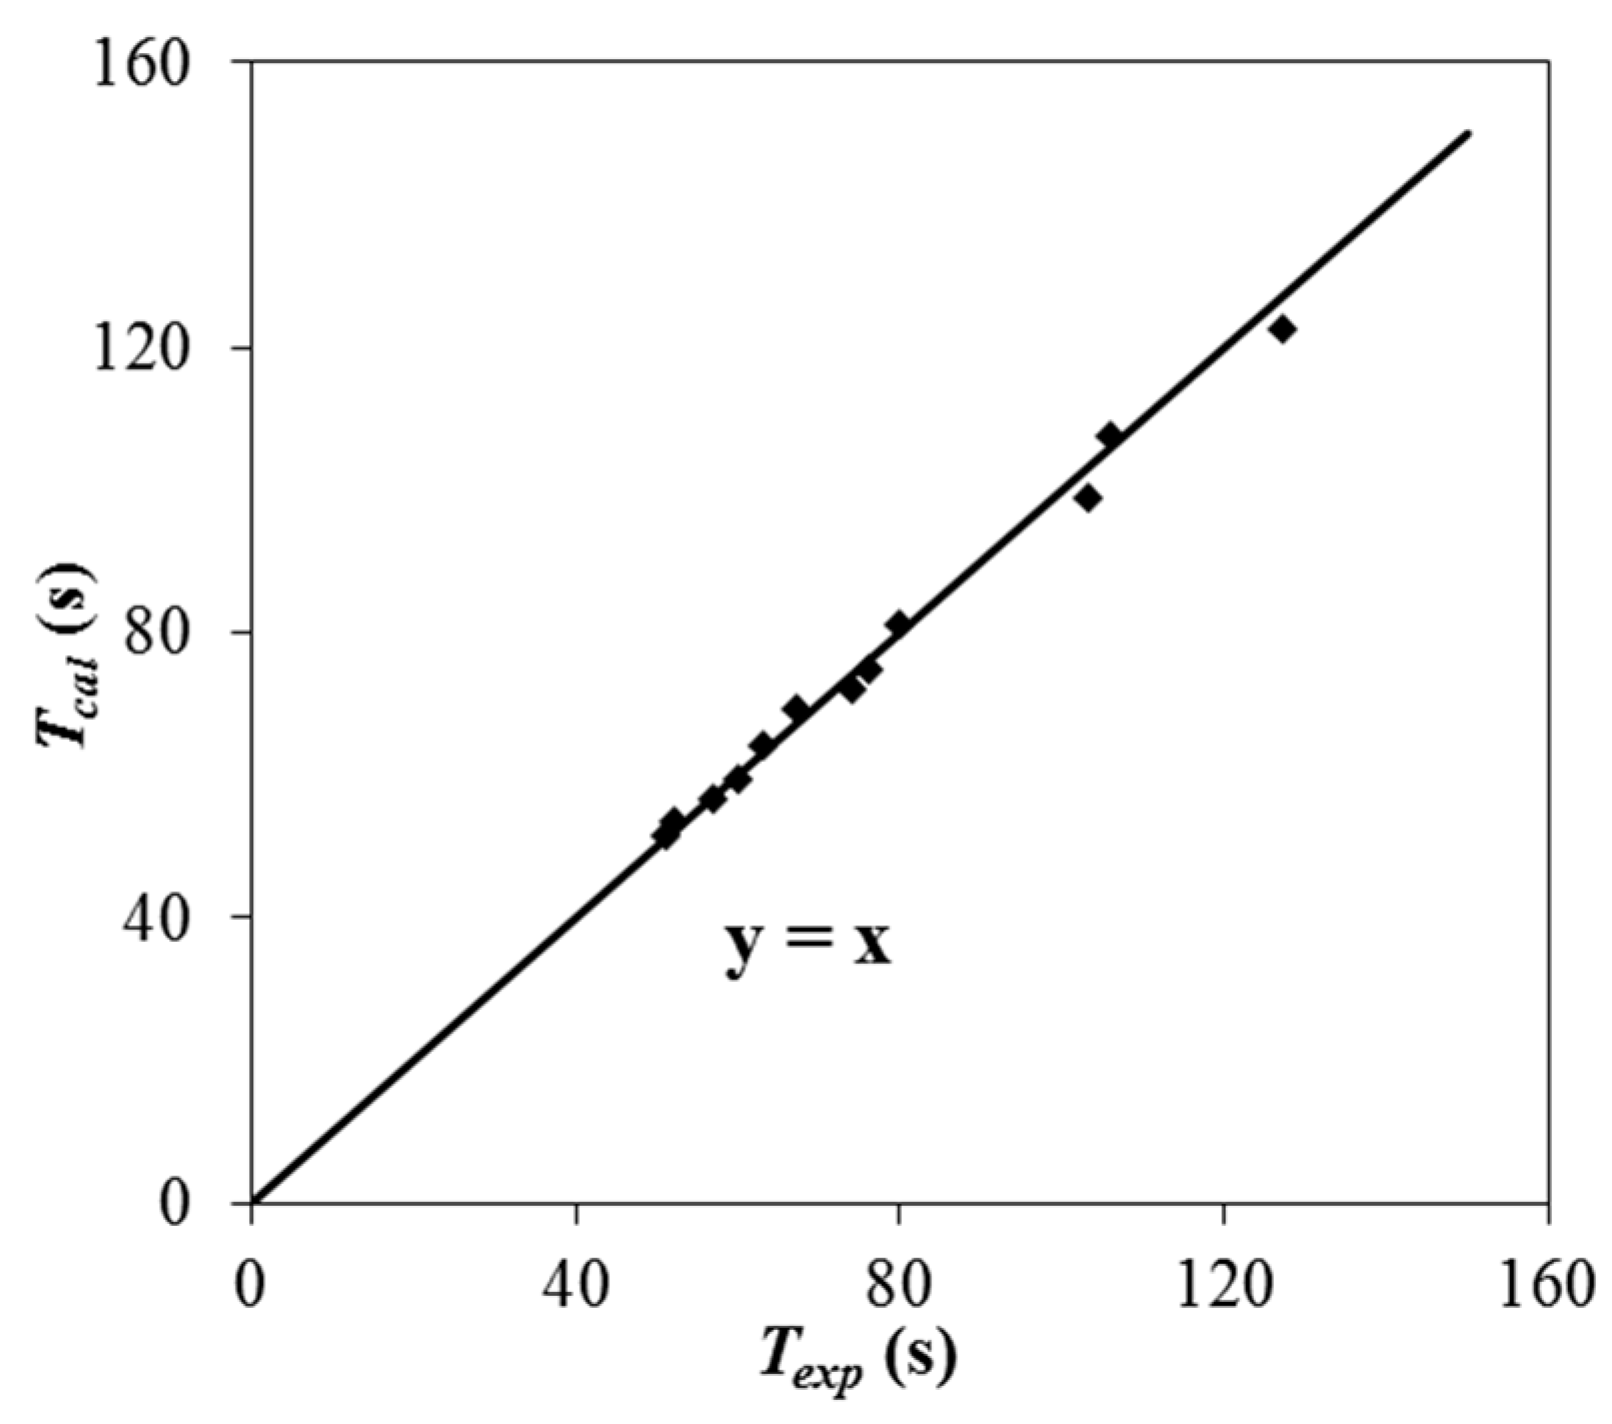
3.2. Retention Time
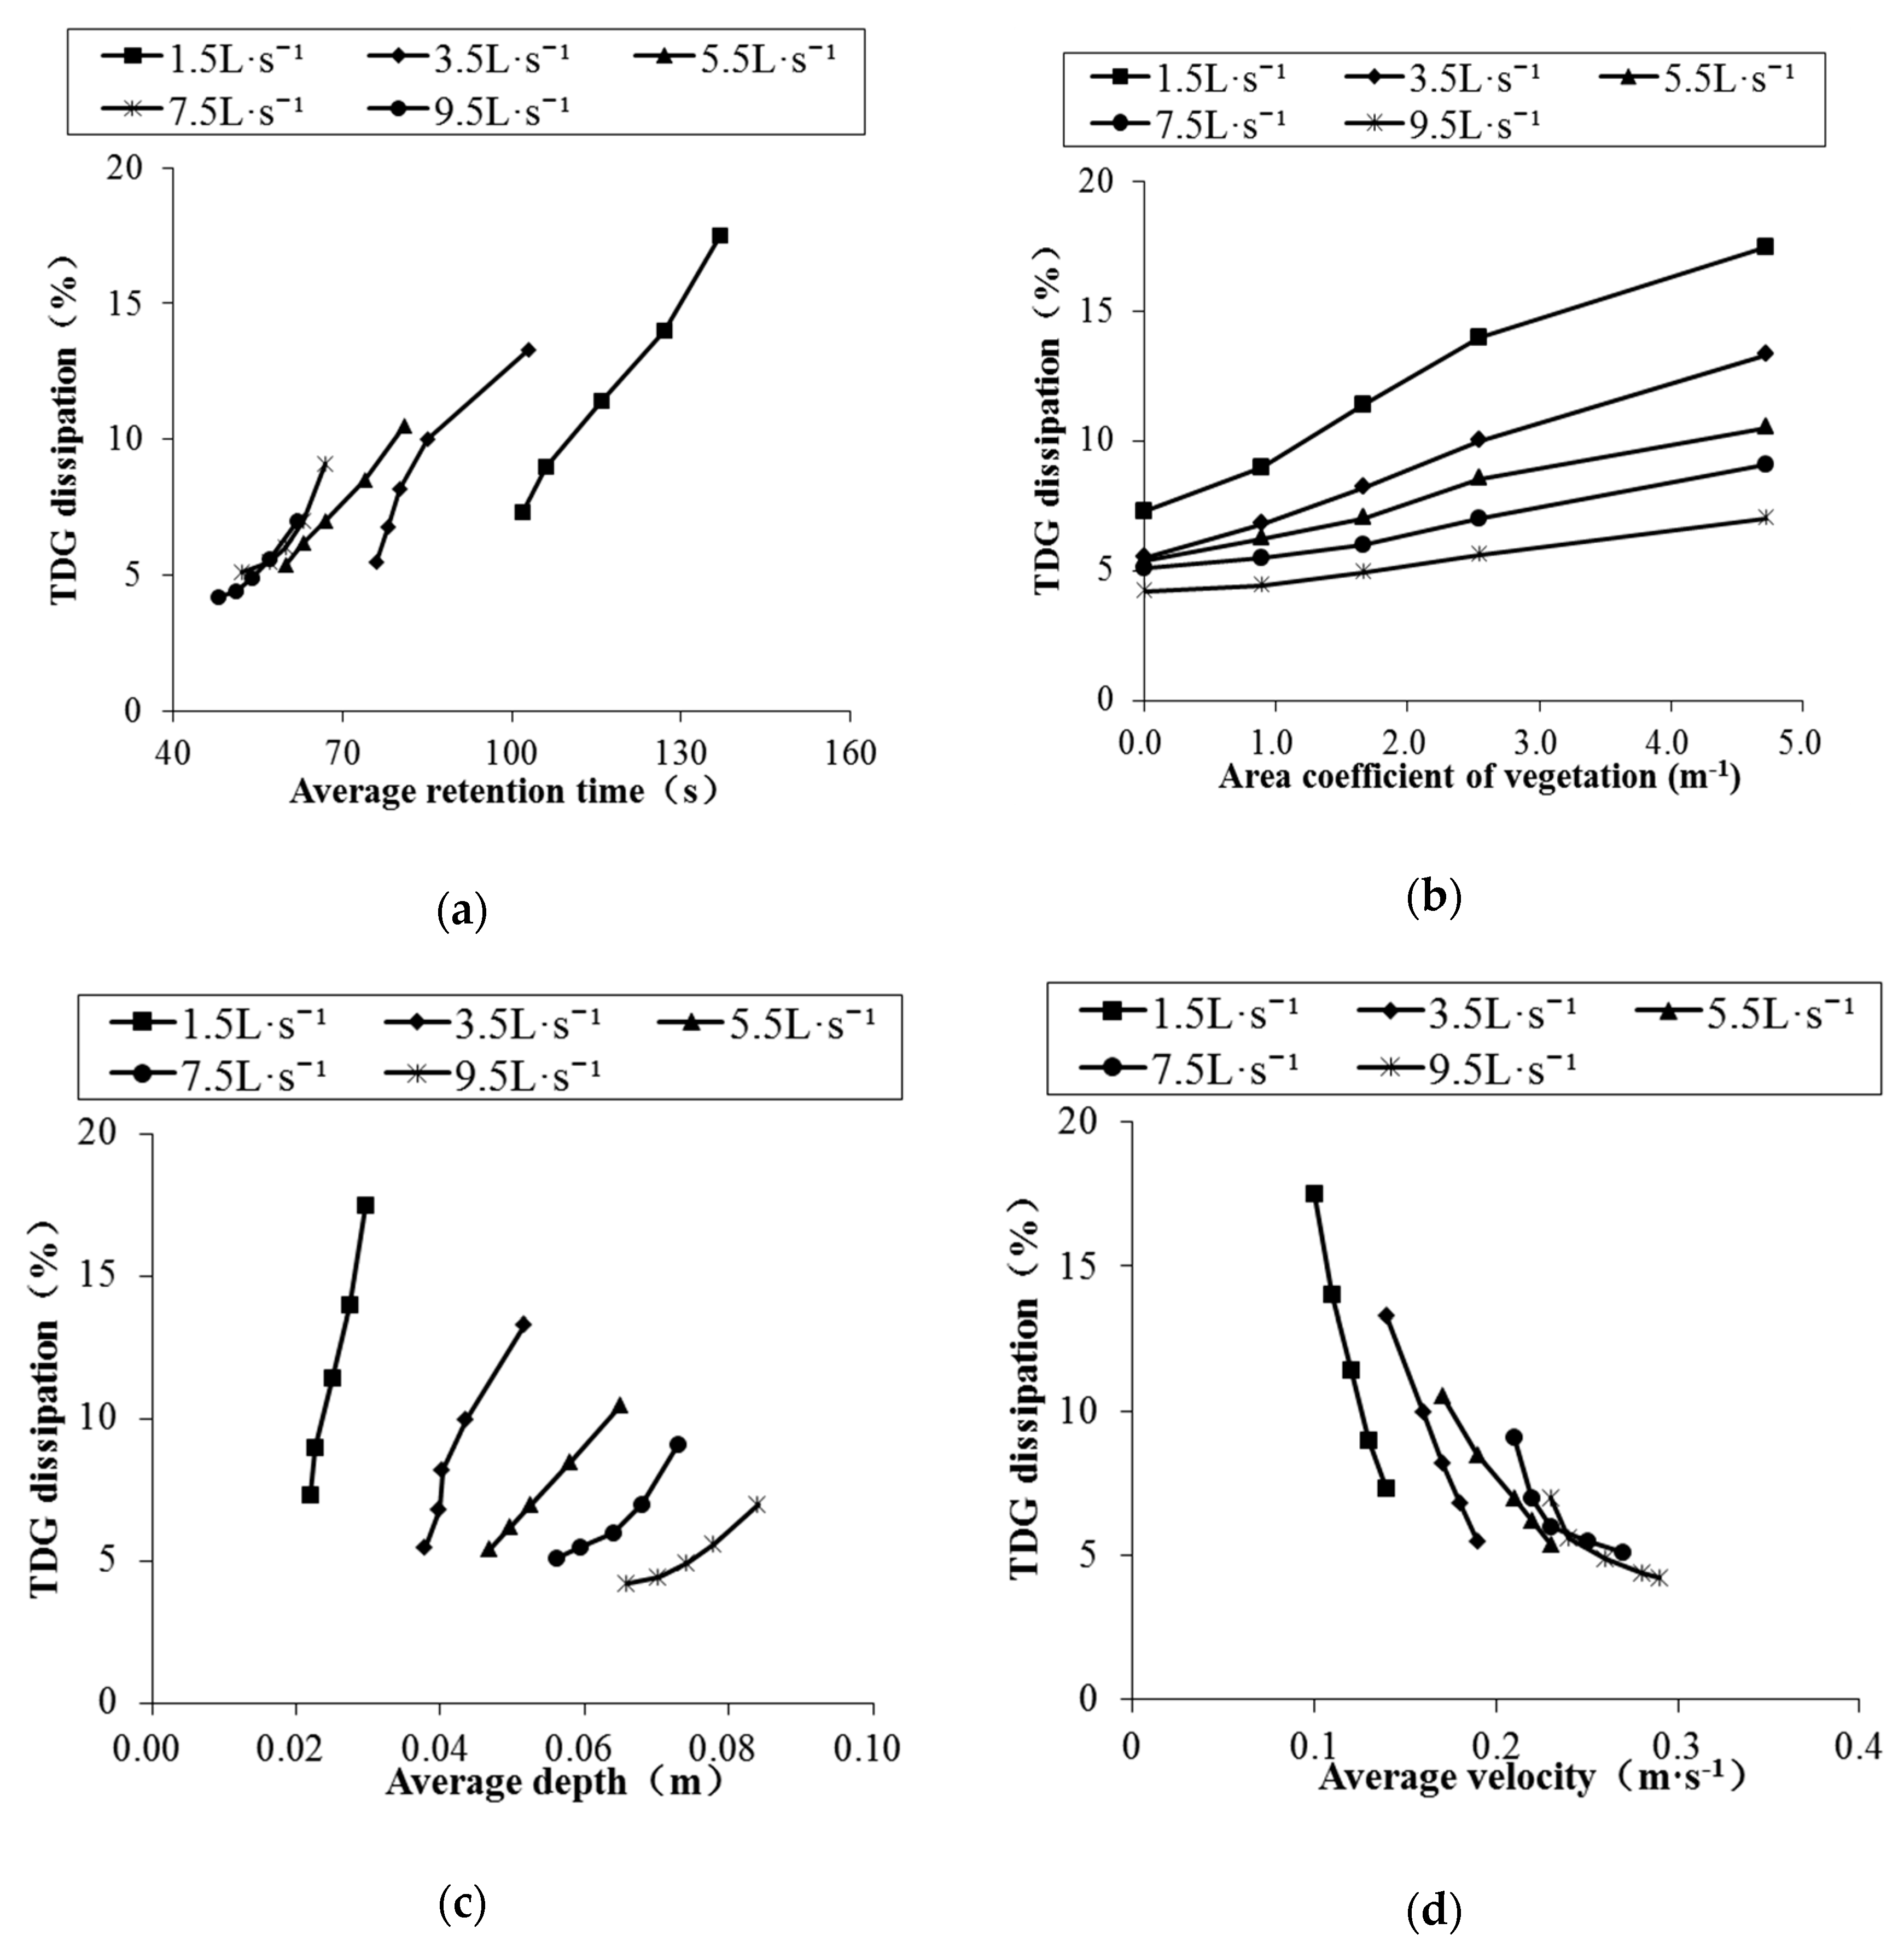
3.3. TDG Dissipation Process
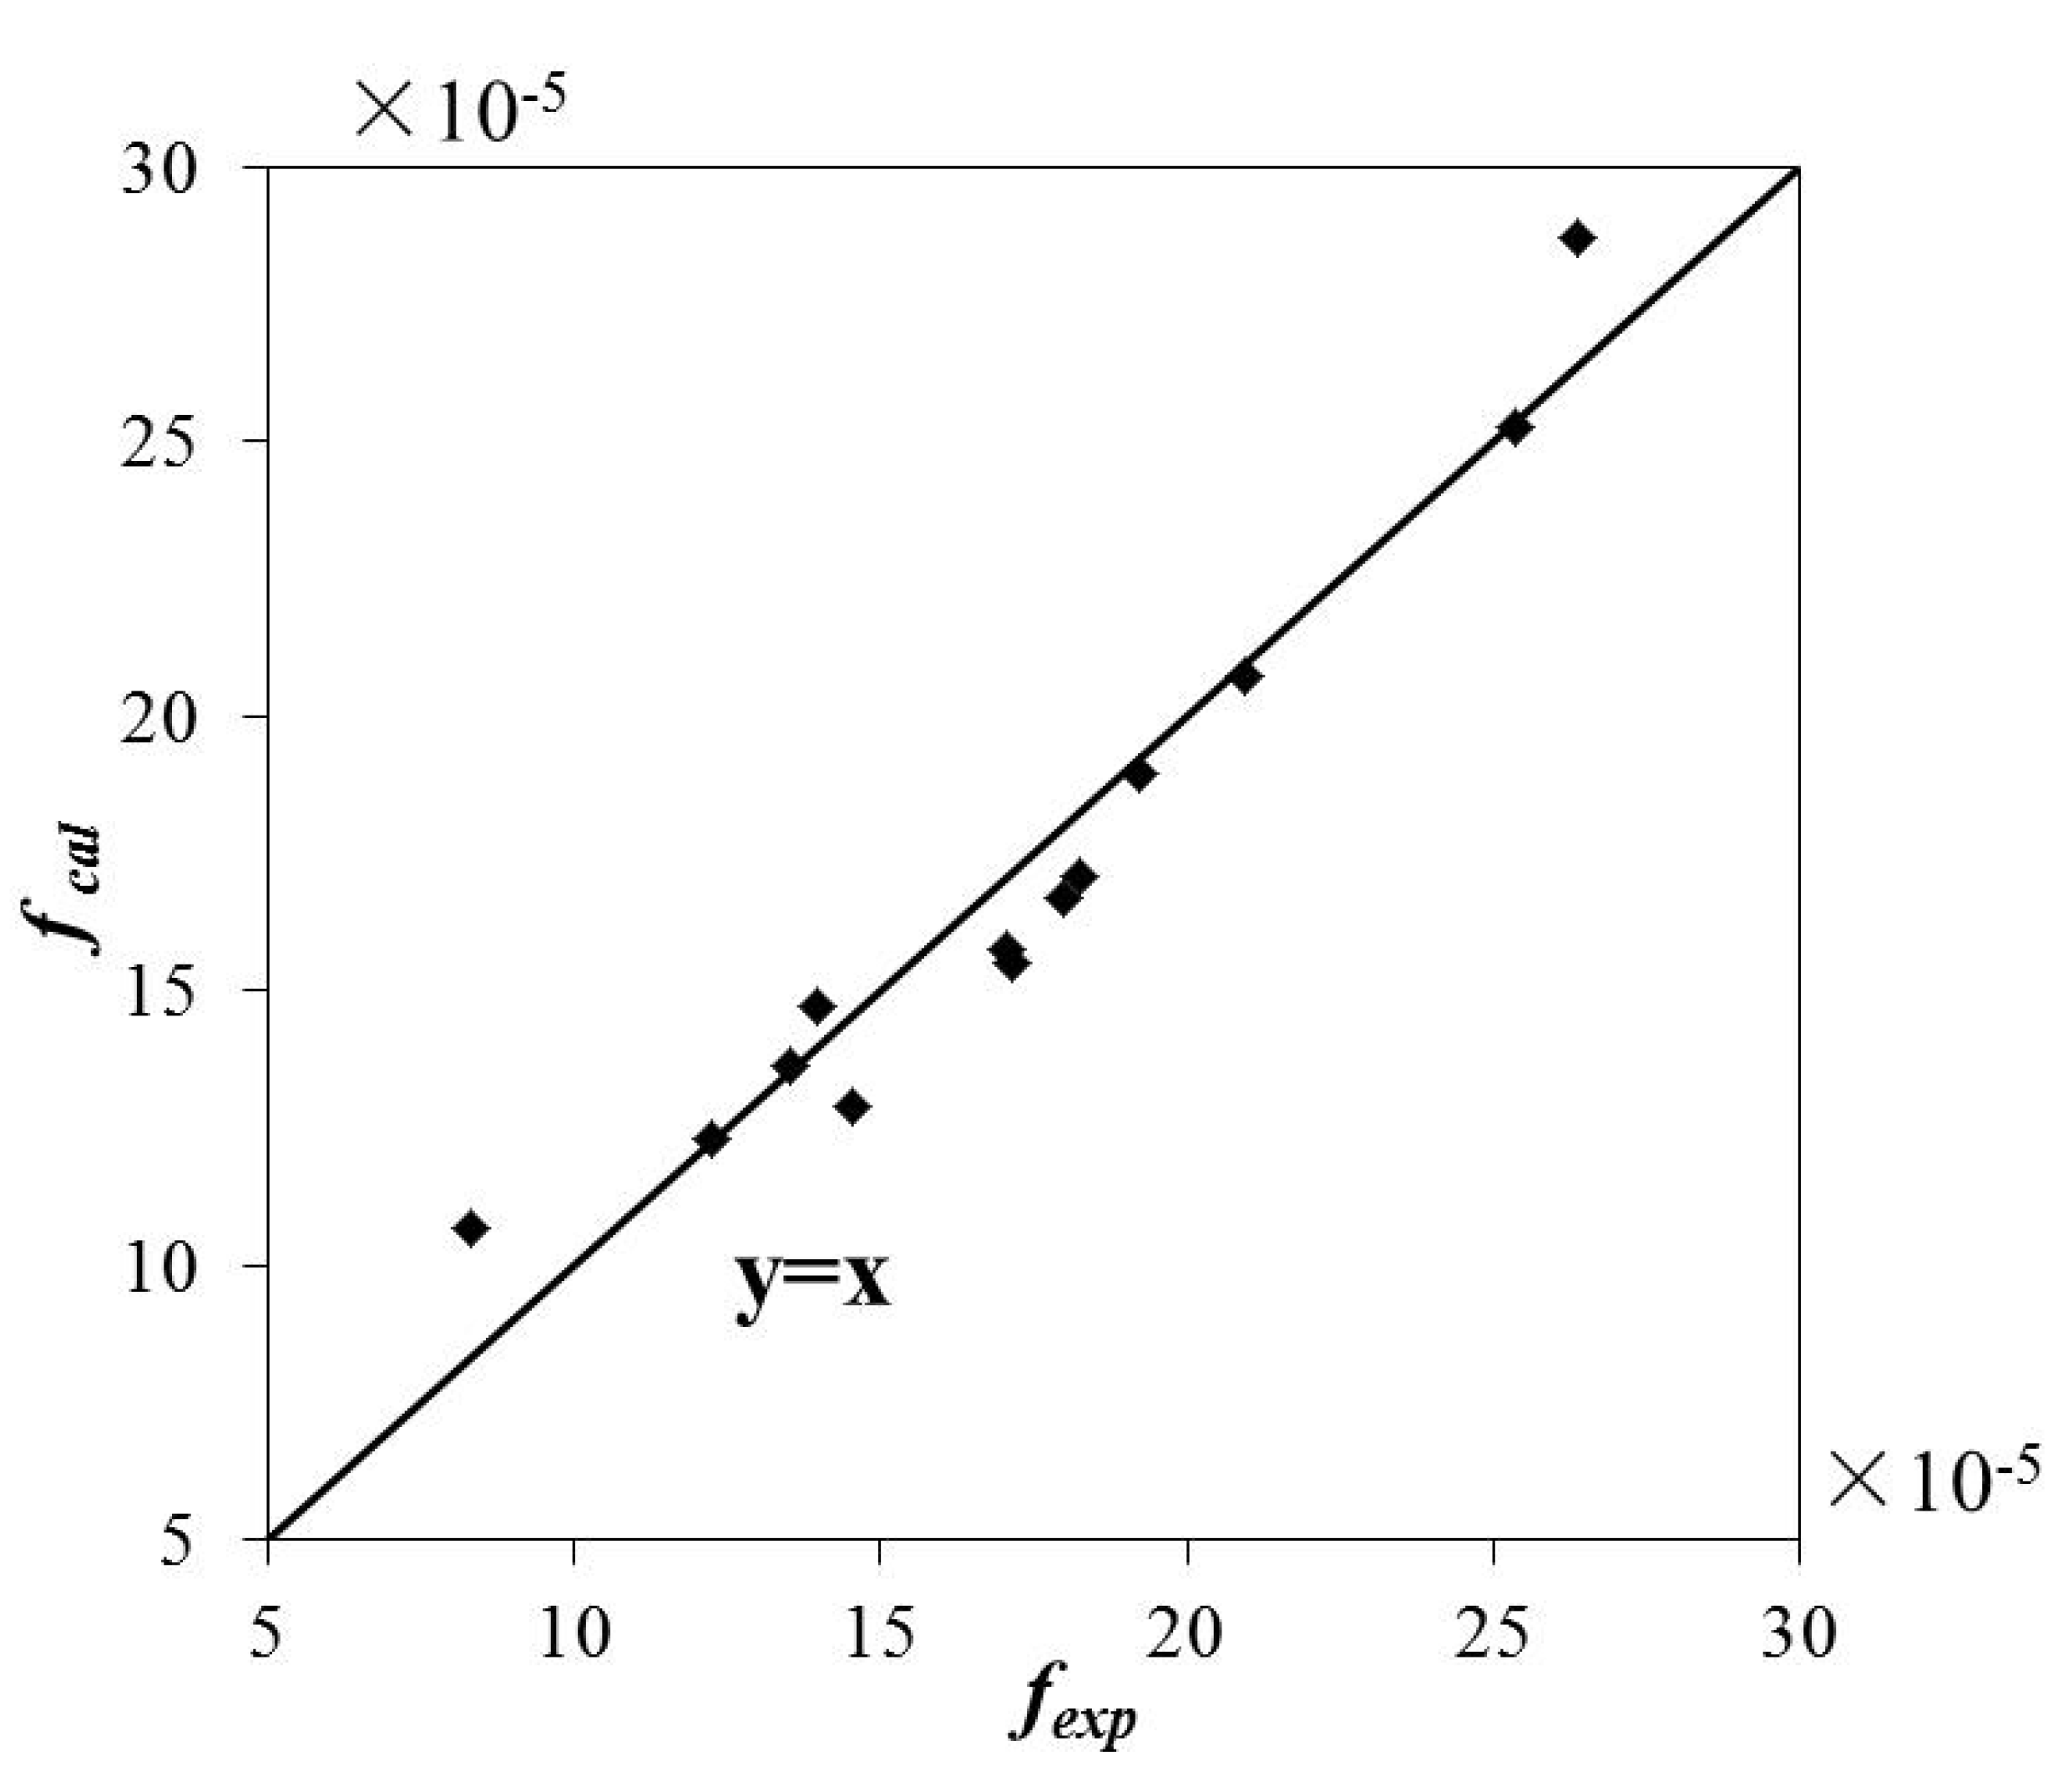
3.4. The Dissipation Coefficient of Supersaturated TDG
4. Conclusions
- (1)
- The relationship between each parameter and the vegetation area coefficient in water was obtained. When the average flow velocity changes in response to changes in the vegetation area coefficient, the velocity distribution characteristics also change. Specifically, the horizontal distribution is characterized by low flow velocities in the center of the flume and high flow velocities along the edges, and the distribution characteristics of the columns show a sawtooth distribution. The average retention time is affected by the vegetation area coefficient, flow rate, hydraulic radius and other factors, and an empirical formula was proposed based on those factors.
- (2)
- The presence of vegetation in the water significantly promotes the dissipation of supersaturated TDG. The presence of vegetation prolongs the average retention time of water and increases the contact surface for absorption, thereby accelerating the dissipation of supersaturated TDG.
- (3)
- The dissipation coefficient kT is the most important parameter representing the supersaturated TDG dissipation rate. Using the Buckingham π theorem, a portion of the experimental data was used to determine the dissipation coefficient. The quantitative relationships of the vegetation area coefficient, average flow velocity, average water depth, and average hydraulic radius with kT are shown. Other experimental data are well verified, indicating that the calculation method for the dissipation coefficient proposed in this paper can be used to calculate the dissipation coefficient of supersaturated TDG under the influence of vegetation and to predict the dissipation process.
Author Contributions
Funding
Conflicts of Interest
References
- Jia, J. A Technical Review of Hydro-Project Development in China. Engineering 2016, 2, 302–312. [Google Scholar] [CrossRef]
- Chaleeraktrakoon, C.; Chinsomboon, Y. Dynamic rule curves for flood control of a multipurpose dam. J. Hydro-Environ. Res. 2015, 9, 133–144. [Google Scholar] [CrossRef]
- Talukdar, S.; Pal, S. Impact of dam on inundation regime of flood plain wetland of punarbhaba river basin of barind tract of Indo-Bangladesh. Int. Soil Water Conserv. Res. 2017, 5, 109–121. [Google Scholar] [CrossRef]
- Tao, J.; Yang, Z.; Cai, Y.; Wang, X.; Chang, J. Spatiotemporal response of pelagic fish aggregations in their spawning grounds of middle Yangtze to the flood process optimized by the Three Gorges Reservoir operation. Ecol. Eng. 2017, 103, 86–94. [Google Scholar] [CrossRef]
- Rypel, A.L. Spatial and Temporal Trade-Offs by Bluegills in Floodplain River Ecosystems. Ecosystems 2012, 15, 555–563. [Google Scholar] [CrossRef]
- Bolland, J.D.; Nunn, A.D.; Lucas, M.C.; Cowx, I.G. The habitat use of young-of-the-year fishes during and after floods of varying timing and magnitude in a constrained lowland river. Ecol. Eng. 2015, 75, 434–440. [Google Scholar] [CrossRef]
- Robinson, C.T.; Uehlinger, U.; Monaghan, M.T. Stream ecosystem response to multiple experimental floods from a reservoir. River Res. Appl. 2004, 20, 359–377. [Google Scholar] [CrossRef]
- Barbosa, T.A.P.; Rosa, D.C.O.; Soares, B.E.; Costa, C.H.A.; Espodito, M.C.; Montag, L.F.A. Effect of flood pulses on the trophic ecology of four piscivorous fishes from the eastern Amazon. J. Fish Biol. 2018, 93, 30–39. [Google Scholar] [CrossRef] [PubMed]
- Li, R.; Li, J.; Li, K.; Deng, Y.; Feng, J. Prediction for supersaturated total dissolved gas in high-dam hydropower projects. Sci. China Ser. E: Technol. Sci. 2009, 52, 3661–3667. [Google Scholar] [CrossRef]
- Lu, J.; Li, R.; Ma, Q.; Feng, J.; Xu, W.; Zhang, F.; Tian, Z. Model for Total Dissolved Gas Supersaturation from Plunging Jets in High Dams. J. Hydraul. Eng. 2019, 145, 04018082. [Google Scholar] [CrossRef]
- Feng, J.; Li, R.; Liang, R.; Shen, X. Eco-environmentally friendly operational regulation: An effective strategy to diminish the TDG supersaturation of reservoirs. Hydrol. Earth Syst. Sci. Discuss. 2013, 10, 14355–14390. [Google Scholar] [CrossRef]
- Kamal, R.; Zhu, D.Z.; McArthur, M.; Leake, A. Field Study on the Dissipation of Supersaturated Total Dissolved Gases in a Cascade Reservoir System. In Proceedings of the World Environmental and Water Resources Congress 2016, West Palm Beach, FL, USA, 22–26 May 2016; pp. 452–460. [Google Scholar]
- Wang, Y.; Zhang, L.; Zeng, C.; Li, K. Tolerance and avoidance responses of Schizothorax pernanti to total dissolved gas supersaturation. Shuili Xuebao/J. Hydraul. Eng. 2015, 46, 480–488. [Google Scholar]
- Wang, Y.; An, R.; Li, Y.; Li, K. Swimming Performance of Rock Carp Procypris rabaudi and Prenant’s Schizothoracin Schizothorax prenanti Acclimated to Total Dissolved Gas Supersaturated Water. N. Am. J. Fish. Manag. 2017, 37, 1183–1190. [Google Scholar] [CrossRef]
- Geldert, D.A.; Gulliver, J.S.; Wilhelms, S.C. Modeling Dissolved Gas Supersaturation Below Spillway Plunge Pools. J. Hydraul. Eng. 1998, 124, 513–521. [Google Scholar] [CrossRef]
- Tan, D.C. Study on the Lethal Effect of Gas Supersaturation on Fish Caused by Three Gorges Project. Master’s Thesis, Xinan University, Chongqing, China, 2017. (In Chinese). [Google Scholar]
- Fishery Eco-Environmental Monitoring Center of the Middle and Upper Reaches of the Yangtze River (Ministry of Agriculture and Rural Affairs of the People’s Republic of China). Investigation Report on Dead Fish Incident under Xiluodu Dam in July 2014; Fishery Eco-Environmental Monitoring Center of the Middle and Upper Reaches of the Yangtze River: Wuhan, China, 2014. (In Chinese)
- De Serio, F.; Meftah, M.B.; Mossa, M.; Termini, D. Experimental investigation on dispersion mechanisms in rigid and flexible vegetated beds. Adv. Water Resources 2018, 120, 98–113. [Google Scholar] [CrossRef]
- Nepf, H.M. Flow and Transport in Regions with Aquatic Vegetation. Annu. Rev. Fluid Mech. 2011, 44, 123–142. [Google Scholar] [CrossRef]
- Huai, W.; Hu, Y.; Zeng, Y.; Han, J. Velocity distribution for open channel flows with suspended vegetation. Adv. Water Resources 2012, 49, 56–61. [Google Scholar] [CrossRef]
- Yang, Z.; Bai, F.; Huai, W.; An, R.; Wang, H. Modelling open-channel flow with rigid vegetation based on two-dimensional shallow water equations using the lattice Boltzmann method. Ecol. Eng. 2017, 106, 75–81. [Google Scholar] [CrossRef]
- Liu, C.; Nepf, H. Sediment deposition within and around a finite patch of model vegetation over a range of channel velocity. Water Resources Res. 2016, 52, 600–612. [Google Scholar] [CrossRef]
- Ree, W.O. Retardation Coefficients for Row Crops in Diversion Terraces. Trans. ASAE 1958, 1, 78–80. [Google Scholar] [CrossRef]
- Shih, S.F.; Rahi, G.S. Seasonal Variations of Manning’s Roughness Coefficient in a Subtropical Marsh. Trans. ASAE [Am. Soc. Agric. Eng.] 1982, 25, 116–119. [Google Scholar] [CrossRef]
- Fathi-Maghadam, M. Nonrigid, Nonsubmerged, Vegetative Roughness on Floodplains. J. Hydraul. Eng. 1997, 123, 51–57. [Google Scholar] [CrossRef]
- Yang, K.; Liu, X.; Cao, S.; Zhang, Z. The flow turbulent characteristics of a complex flume under the action of vegetation. Shuili Xuebao/J. Hydraul. Eng. 2005, 36, 1263–1268. (In Chinese) [Google Scholar]
- Bai, F.; Yang, Z.; Huai, W.; Zheng, C. A Depth-averaged Two Dimensional Shallow Water Model to Simulate Flow-rigid Vegetation Interactions. Procedia Eng. 2016, 154, 482–489. [Google Scholar] [CrossRef]
- Jiang, B.; Yang, K.; Cao, S. An Analytical Model for the Distributions of Velocity and Discharge in Compound Channels with Submerged Vegetation. PLoS ONE 2015, 10, e0130841. [Google Scholar] [CrossRef] [PubMed]
- Huai, W.; Wang, W.; Hu, Y.; Zeng, Y.; Yang, Z. Analytical model of the mean velocity distribution in an open channel with double-layered rigid vegetation. Adv. Water Resour. 2014, 69, 106–113. [Google Scholar] [CrossRef]
- Han, L.; Zeng, Y.; Chen, L.; Huai, W. Lateral velocity distribution in open channels with partially flexible submerged vegetation. Environ. Fluid Mech. 2016, 16, 1267–1282. [Google Scholar] [CrossRef]
- Liu, C.; Shan, Y.; Liu, X.; Yang, K.; Liao, H. The effect of floodplain grass on the flow characteristics of meandering compound channels. J. Hydrol. 2016, 542, 1–17. [Google Scholar] [CrossRef]
- Huai, W.; Shi, H.; Song, S.; Ni, S. A simplified method for estimating the longitudinal dispersion coefficient in ecological channels with vegetation. Ecol. Indic. 2018, 92, 91–98. [Google Scholar] [CrossRef]
- Okamoto, T.A.; Nezu, I.; Ikeda, H. Vertical mass and momentum transport in open-channel flows with submerged vegetations. J. Hydro-Environ. Res. 2012, 6, 287–297. [Google Scholar] [CrossRef]
- Wu, W.M.; Wang, S.S.Y. A depth-averaged two-dimensional numerical model of flow and sediment transport in open chanxznels with vegetation. Riparian Veg. Fluvial Geomorphl. 2004, 8, 253–256. [Google Scholar]
- Yuan, Y.; Feng, J.; Li, R.; Huang, Y.; Huang, J.; Wang, Z. Modelling the promotion effect of vegetation on the dissipation of supersaturated total dissolved gas. Ecol. Model. 2018, 386, 89–97. [Google Scholar] [CrossRef]
- Yuan, Y.; Huang, Y.; Feng, J.; Li, R.; An, R.; Huang, J. Numerical Model of Supersaturated Total Dissolved Gas Dissipation in a Channel with Vegetation. Water 2018, 10, 1769. [Google Scholar] [CrossRef]
- Li, R.; Huang, X.; Li, K.F.; Yi, W.M.; Li, J. Device for Generation of Total Dissolved Gas Supersaturation in Water Body and Research on Influence of Total Dissolved Gas Supersaturation on Fish. CN 201479739 U, 26 May 2010. (In Chinese). [Google Scholar]
- Witt, A.; Stewart, K.; Hadjerioua, B. Predicting Total Dissolved Gas Travel Time in Hydropower Reservoirs. J. Environ. Eng. 2017, 143, 6017011. [Google Scholar] [CrossRef]
- Columbia Basin Research School of Aquatic and Fishery Sciences. Columbia River Salmon Passage Model CRi SP.1.6 Theory and Calibration; University of Washington: Seattle, WA, USA, 2000. [Google Scholar]
- Li, R.; Hodges, B.R.; Feng, J.; Yong, X. Comparison of Supersaturated Total Dissolved Gas Dissipation with Dissolved Oxygen Dissipation and Reaeration. J. Environ. Eng. 2013, 139, 385–390. [Google Scholar] [CrossRef]
- USACE. Dissolved Gas Abatement Study-Phase 2 Draft Final; U.S. Army Corps of Engineers, Portland Distract and Walla District: Seattle, WA, USA, 2001.


| Case No. | Flow Rate (m3·s−1) | Vegetation Area Coefficient (m−1) | Mean Depth (m) | Mean Hydraulic Radius (10−2 m) | Mean Retention Time (s) | TDG Dissipation (%) |
|---|---|---|---|---|---|---|
| 1 | 0.0015 | 0 | 0.022 | 2.0 | 102 | 7.3 |
| 2 | 0.0035 | 0 | 0.038 | 3.3 | 76 | 5.5 |
| 3 | 0.0055 | 0 | 0.047 | 4.0 | 60 | 5.4 |
| 4 | 0.0075 | 0 | 0.056 | 4.6 | 52 | 5.1 |
| 5 | 0.0095 | 0 | 0.066 | 5.2 | 48 | 4.2 |
| 6 | 0.0015 | 0.90 | 0.023 | 2.1 | 106 | 14.0 |
| 7 | 0.0035 | 0.90 | 0.040 | 3.4 | 78 | 10.0 |
| 8 | 0.0055 | 0.90 | 0.050 | 4.1 | 63 | 8.5 |
| 9 | 0.0075 | 0.90 | 0.059 | 4.8 | 57 | 7.0 |
| 10 | 0.0095 | 0.90 | 0.070 | 5.5 | 51 | 5.6 |
| 11 | 0.0015 | 1.66 | 0.025 | 2.3 | 116 | 11.4 |
| 12 | 0.0035 | 1.66 | 0.040 | 3.5 | 80 | 8.2 |
| 13 | 0.0055 | 1.66 | 0.053 | 4.4 | 67 | 7.0 |
| 14 | 0.0075 | 1.66 | 0.064 | 5.1 | 60 | 6.0 |
| 15 | 0.0095 | 1.66 | 0.074 | 5.7 | 54 | 4.9 |
| 16 | 0.0015 | 2.54 | 0.027 | 2.5 | 127 | 14.0 |
| 14 | 0.0035 | 2.54 | 0.044 | 3.7 | 85 | 10.0 |
| 18 | 0.0055 | 2.54 | 0.058 | 4.7 | 74 | 8.5 |
| 19 | 0.0075 | 2.54 | 0.068 | 5.3 | 63 | 7.0 |
| 20 | 0.0095 | 2.54 | 0.078 | 5.9 | 57 | 5.6 |
| 21 | 0.0015 | 4.71 | 0.030 | 2.7 | 137 | 17.5 |
| 22 | 0.0035 | 4.71 | 0.052 | 4.3 | 103 | 13.3 |
| 23 | 0.0055 | 4.71 | 0.065 | 5.2 | 81 | 10.5 |
| 24 | 0.0075 | 4.71 | 0.073 | 5.7 | 67 | 9.1 |
| 25 | 0.0095 | 4.71 | 0.084 | 6.3 | 62 | 7.0 |
| Case No. | Flow Rate (L·s−1) | Vegetation Area Coefficient (m−1) | Mean Depth (m) | Mean Hydraulic Radius (10−2 m) | TDG Dissipation Coefficient (10−3 s−1) |
|---|---|---|---|---|---|
| 1 | 1.5 | 0 | 2.2 | 2.0 | 1.76 |
| 2 | 3.5 | 0 | 3.8 | 3.3 | 2.15 |
| 3 | 5.5 | 0 | 4.7 | 4.0 | 2.52 |
| 4 | 7.5 | 0 | 5.6 | 4.6 | 2.91 |
| 5 | 9.5 | 0 | 6.6 | 5.2 | 3.52 |
| 6 | 1.5 | 0.90 | 2.3 | 2.1 | 1.74 |
| 7 | 3.5 | 0.90 | 4.0 | 3.4 | 2.12 |
| 8 | 5.5 | 0.90 | 5.0 | 4.1 | 2.37 |
| 9 | 7.5 | 0.90 | 5.9 | 4.8 | 2.89 |
| 10 | 9.5 | 0.90 | 7.0 | 5.5 | 3.19 |
| 11 | 1.5 | 1.66 | 2.5 | 2.3 | 2.10 |
| 12 | 3.5 | 1.66 | 4.0 | 3.5 | 2.38 |
| 13 | 5.5 | 1.66 | 5.3 | 4.4 | 2.33 |
| 14 | 7.5 | 1.66 | 6.4 | 5.1 | 2.66 |
| 15 | 9.5 | 1.66 | 7.4 | 5.7 | 3.01 |
| 16 | 1.5 | 2.54 | 2.7 | 2.5 | 2.20 |
| 14 | 3.5 | 2.54 | 4.4 | 3.7 | 2.21 |
| 18 | 5.5 | 2.54 | 5.8 | 4.7 | 2.19 |
| 19 | 7.5 | 2.54 | 6.8 | 5.3 | 2.51 |
| 20 | 9.5 | 2.54 | 7.8 | 5.9 | 3.04 |
| 21 | 1.5 | 4.71 | 3.0 | 2.7 | 1.90 |
| 22 | 3.5 | 4.71 | 5.2 | 4.3 | 1.89 |
| 23 | 5.5 | 4.71 | 6.5 | 5.2 | 1.95 |
| 24 | 7.5 | 4.71 | 7.3 | 5.7 | 2.15 |
| 25 | 9.5 | 4.71 | 8.4 | 6.3 | 2.45 |
| Case no. | Flow Rate (L·s−1) | Vegetation Area Coefficient (m−1) | R/H | Fr | dAH |
|---|---|---|---|---|---|
| 1 | 1.5 | 0 | 1.088 | 0.314 | 0.000 |
| 2 | 3.5 | 0 | 1.152 | 0.334 | 0.000 |
| 3 | 5.5 | 0 | 1.188 | 0.369 | 0.000 |
| 4 | 7.5 | 0 | 1.224 | 0.403 | 0.000 |
| 5 | 9.5 | 0 | 1.264 | 0.405 | 0.000 |
| 6 | 1.5 | 0.90 | 1.097 | 0.289 | 0.019 |
| 7 | 3.5 | 0.90 | 1.171 | 0.311 | 0.031 |
| 8 | 5.5 | 0.90 | 1.212 | 0.347 | 0.037 |
| 9 | 7.5 | 0.90 | 1.253 | 0.367 | 0.042 |
| 10 | 9.5 | 0.90 | 1.299 | 0.384 | 0.049 |
| 11 | 1.5 | 1.66 | 1.096 | 0.254 | 0.038 |
| 12 | 3.5 | 1.66 | 1.169 | 0.292 | 0.057 |
| 13 | 5.5 | 1.66 | 1.225 | 0.323 | 0.072 |
| 14 | 7.5 | 1.66 | 1.274 | 0.328 | 0.084 |
| 15 | 9.5 | 1.66 | 1.318 | 0.350 | 0.094 |
| 16 | 1.5 | 2.54 | 1.132 | 0.226 | 0.061 |
| 14 | 3.5 | 2.54 | 1.209 | 0.269 | 0.092 |
| 18 | 5.5 | 2.54 | 1.275 | 0.285 | 0.115 |
| 19 | 7.5 | 2.54 | 1.321 | 0.310 | 0.131 |
| 20 | 9.5 | 2.54 | 1.366 | 0.321 | 0.145 |
| 21 | 1.5 | 4.71 | 1.157 | 0.199 | 0.121 |
| 22 | 3.5 | 4.71 | 1.264 | 0.221 | 0.193 |
| 23 | 5.5 | 4.71 | 1.327 | 0.245 | 0.231 |
| 24 | 7.5 | 4.71 | 1.364 | 0.290 | 0.252 |
| 25 | 9.5 | 4.71 | 1.414 | 0.301 | 0.280 |
© 2019 by the authors. Licensee MDPI, Basel, Switzerland. This article is an open access article distributed under the terms and conditions of the Creative Commons Attribution (CC BY) license (http://creativecommons.org/licenses/by/4.0/).
Share and Cite
Wang, Z.; Lu, J.; Yuan, Y.; Huang, Y.; Feng, J.; Li, R. Experimental Study on the Effects of Vegetation on the Dissipation of Supersaturated Total Dissolved Gas in Flowing Water. Int. J. Environ. Res. Public Health 2019, 16, 2256. https://doi.org/10.3390/ijerph16132256
Wang Z, Lu J, Yuan Y, Huang Y, Feng J, Li R. Experimental Study on the Effects of Vegetation on the Dissipation of Supersaturated Total Dissolved Gas in Flowing Water. International Journal of Environmental Research and Public Health. 2019; 16(13):2256. https://doi.org/10.3390/ijerph16132256
Chicago/Turabian StyleWang, Zhenhua, Jingying Lu, Youquan Yuan, Yinghan Huang, Jingjie Feng, and Ran Li. 2019. "Experimental Study on the Effects of Vegetation on the Dissipation of Supersaturated Total Dissolved Gas in Flowing Water" International Journal of Environmental Research and Public Health 16, no. 13: 2256. https://doi.org/10.3390/ijerph16132256
APA StyleWang, Z., Lu, J., Yuan, Y., Huang, Y., Feng, J., & Li, R. (2019). Experimental Study on the Effects of Vegetation on the Dissipation of Supersaturated Total Dissolved Gas in Flowing Water. International Journal of Environmental Research and Public Health, 16(13), 2256. https://doi.org/10.3390/ijerph16132256