A Systematic Review of Access to General Healthcare Services for People with Disabilities in Low and Middle Income Countries


Abstract
1. Introduction
2. Materials and Methods
2.1. Eligibility Criteria
2.1.1. Types of Access Measures
2.1.2. Types of Disability Measures
2.2. Information Sources
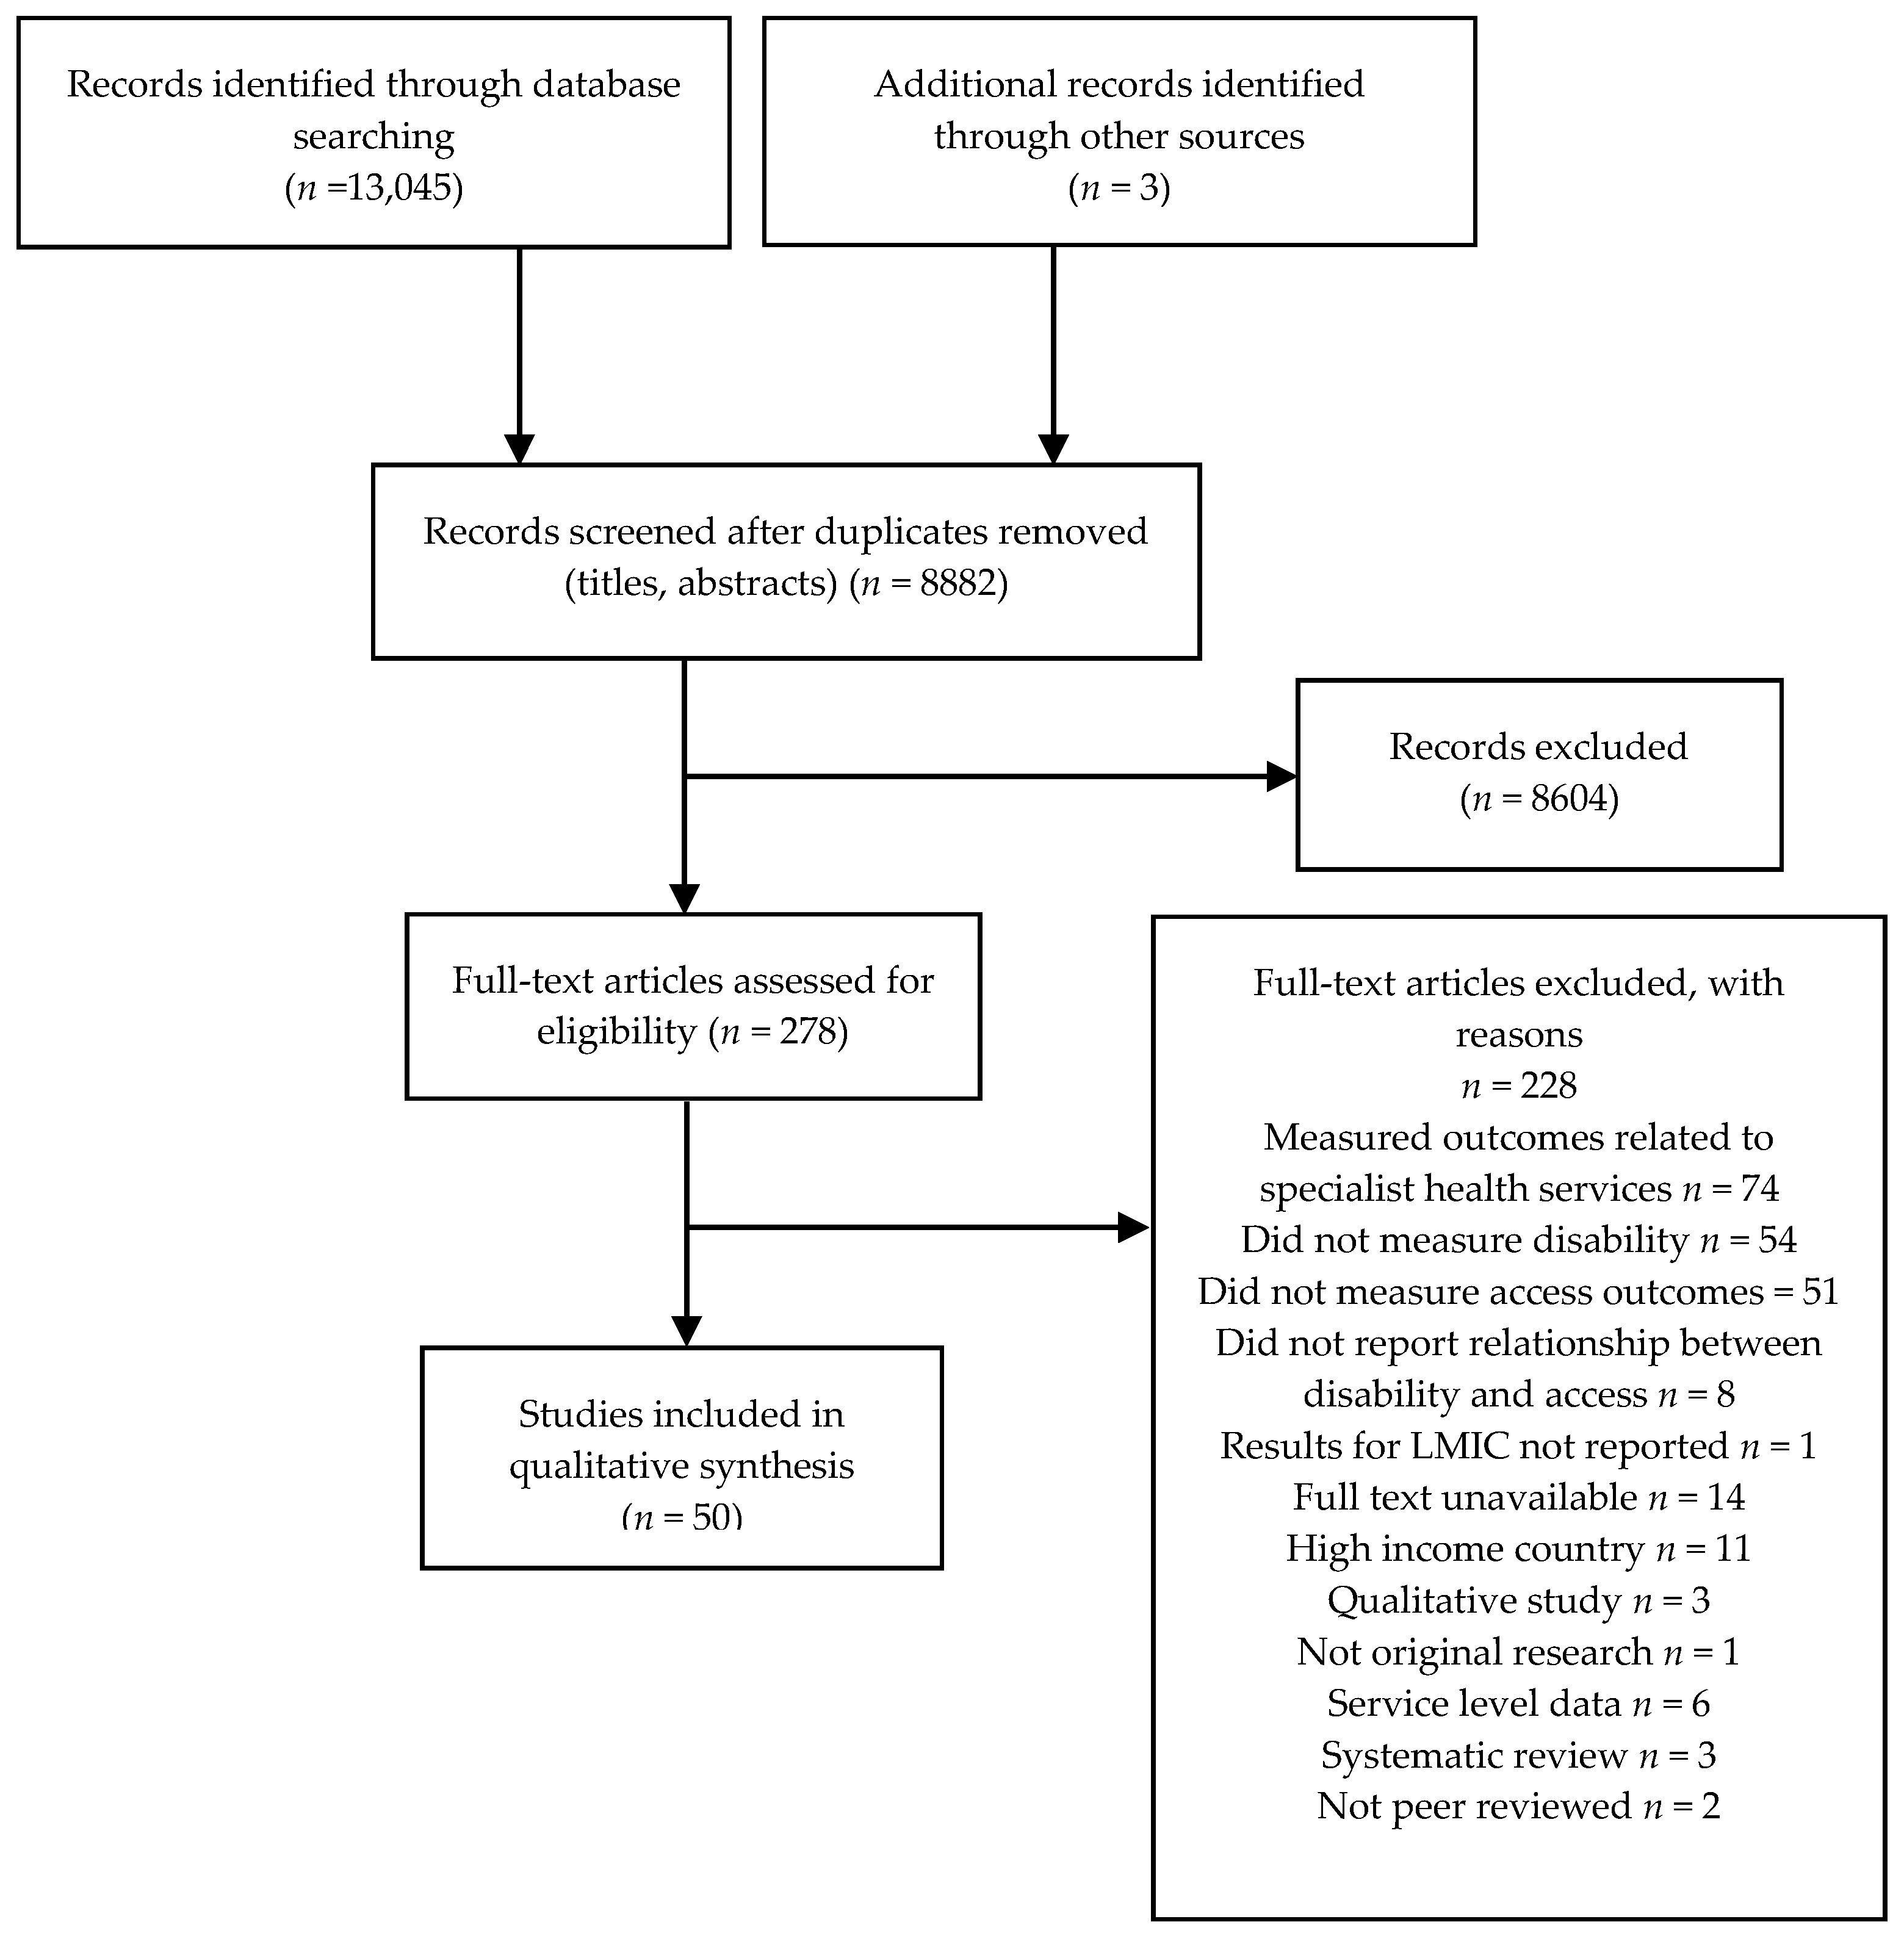
2.3. Study Selection
2.4. Data Extraction and Analysis
- General study information, including author, year of publication
- Study design, sampling, and recruitment methods
- Study setting and dates conducted
- Population characteristics including age, sex, sample size, proportion of participants with a disability
- Study measures: Means of assessing disability, means of assessing access
- Research outcomes (main findings related to access to health): where possible odds or prevalence ratios were extracted as a measure of association. In the absence of these effect estimates, p-values comparing the measures in people with and without disabilities were extracted
2.5. Risk of Bias in Individual Studies
3. Results
3.1. Study Characteristics
3.2. Participants
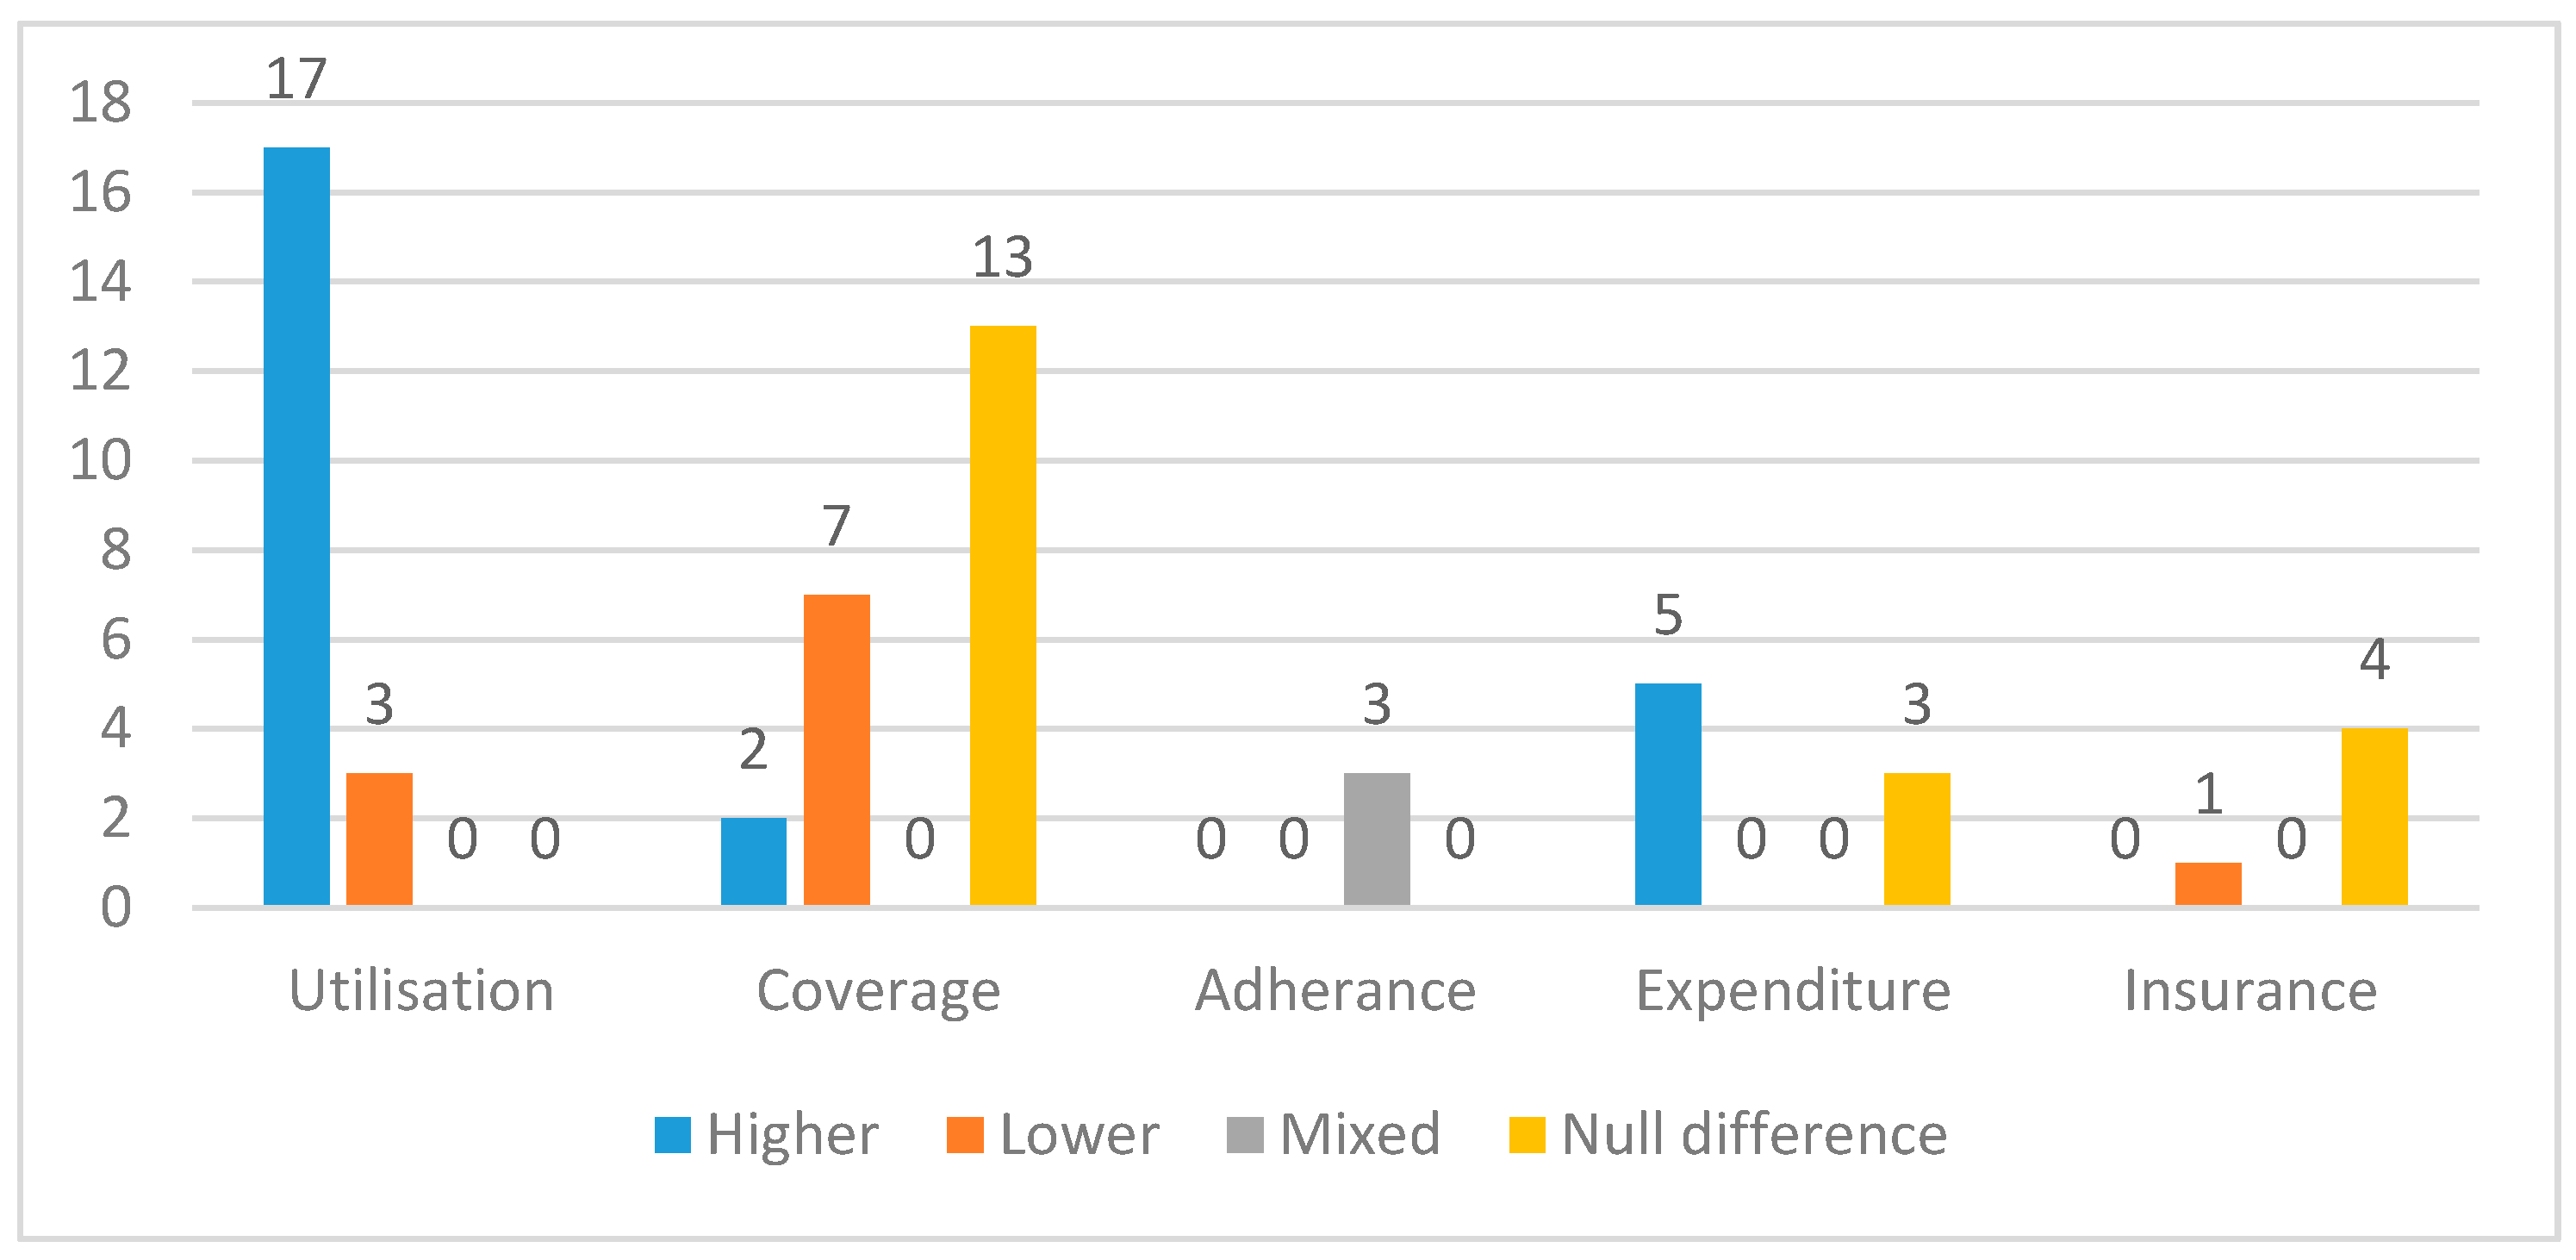
3.3. Outcome Types
3.4. Risk of Bias within Studies
3.5. Description of Findings Related to Healthcare Access
3.5.1. Utilisation
- Primary or secondary health services (13 studies)
- ○
- Number of visits to health centre or public health facility in past 12 months (4 studies); 6 months (1 study); and 1–3 months (4 studies)
- ○
- Access to services in past 6 months (1 study)
- ○
- Home visits by a doctor in past 12 months (1 study)
- ○
- Length of time since last consultation (1 study)
- ○
- Clinic attendance (unspecified time frame; 1 study)
- Tertiary services (hospital) (12 studies)
- ○
- Hospitalisations (inpatient admission) in the past 5 years (1 study); 12 months (7 studies), 6 months (1 study); 3 months (1 study); or over an unspecified time frame (1 study)
- ○
- Hospital outpatient visit in the previous 12 months (1 study), 6 months (1 study) or one month (2 studies)
Utilisation: Primary or Secondary Service Use
Utilisation: Hospitalisation
3.5.2. Coverage
- Care seeking when ill (over varying time periods) (9 studies)
- Coverage of specific services: HIV related (four studies); vaccination coverage (9 studies); dental visits (4 studies); maternal health outcomes (4 studies); receipt of vitamin A (1 study); and others (1 study).
Care Seeking When Ill
Coverage of Specific Services
3.5.3. Adherence
3.5.4. Health Expenditure
3.5.5. Health Insurance Coverage
3.5.6. Barriers to Access
3.5.7. Quality of Services
4. Discussion
4.1. Overview of Results
4.2. Consistency with Previous Literature
4.3. Strengths and Limitations of the Review
5. Conclusions
Supplementary Materials
Author Contributions
Funding
Acknowledgments
Conflicts of Interest
References
- World Bank; World Health Organization. The World Report on Disability. 2011. Available online: http://www.who.int/disabilities/world_report/2011/en/ (accessed on 13 April 2018).
- Banks, L.M.; Kuper, H.; Polack, S. Poverty and disability in low- and middle-income countries: A systematic review. PLoS ONE 2017, 12, e0189996. [Google Scholar] [CrossRef] [PubMed]
- United Nations. Convention on the Rights of Persons with Disabilities—Articles. 2006. Available online: https://www.un.org/development/desa/disabilities/convention-on-the-rights-of-persons-with-disabilities/convention-on-the-rights-of-persons-with-disabilities-2.html (accessed on 30 August 2018).
- Kuper, H.; Monteath-van Dok, A.; Wing, K.; Danquah, L.; Evans, J.; Zuurmond, M.; Gallinetti, J. The Impact of Disability on the Lives of Children; Cross-Sectional Data Including 8900 Children with Disabilities and 898,834 Children without Disabilities across 30 Countries. PLoS ONE 2014, 9, e107300. [Google Scholar] [CrossRef] [PubMed]
- Boerma, T.; AbouZahr, C.; Evans, D.; Evans, T. Monitoring Intervention Coverage in the Context of Universal Health Coverage. PLoS Med. 2014, 11, e1001728. [Google Scholar] [CrossRef] [PubMed]
- Ng, M.; Fullman, N.; Dieleman, J.L.; Flaxman, A.D.; Murray, C.J.L.; Lim, S.S. Effective Coverage: A Metric for Monitoring Universal Health Coverage. PLoS Med. 2014, 11, e1001730. [Google Scholar] [CrossRef] [PubMed]
- World Health Organization. Universal Health Coverage and Health Financing. 2018. Available online: http://www.who.int/health_financing/universal_coverage_definition/en/ (accessed on 13 April 2018).
- PRISMA. Prisma Statement. 2015. Available online: http://www.prisma-statement.org/PRISMAStatement/Default.aspx (accessed on 16 June 2016).
- World Bank. World Bank Country and Lending Groups. 2018. Available online: https://datahelpdesk.worldbank.org/knowledgebase/articles/906519-world-bank-country-and-lending-groups (accessed on 13 April 2018).
- Mactaggart, I.; Kuper, H.; Murthy, G.V.S.; Oye, J.; Polack, S. Measuring Disability in Population Based Surveys: The Interrelationship between Clinical Impairments and Reported Functional Limitations in Cameroon and India. PLoS ONE 2016, 11, e0164470. [Google Scholar] [CrossRef] [PubMed]
- ÜStÜN, T.B.; Chatterji, S.; Bickenbach, J.; Kostanjsek, N.; Schneider, M. The International Classification of Functioning, Disability and Health: A new tool for understanding disability and health. Disabil. Rehabil. 2003, 25, 565–571. [Google Scholar] [CrossRef] [PubMed]
- Scottish Intercollegiate Guidelines Network. SIGN 50: A Guideline Development Handbook. 2011. Available online: http://www.sign.ac.uk/assets/sign50_2011.pdf (accessed on 13 April 2018).
- Trani, J.F.; Bakhshi, P.; Noor, A.A.; Lopez, D.; Mashkoor, A. Poverty, vulnerability, and provision of healthcare in Afghanistan. Soc. Sci. Med. 2010, 70, 1745–1755. [Google Scholar] [CrossRef] [PubMed]
- Trani, J.F.; Barbou-des-Courieres, C. Measuring equity in disability and healthcare utilization in Afghanistan. Med. Conflict Surv. 2012, 28, 219–246. [Google Scholar] [CrossRef] [PubMed]
- Fialho, C.B.; Lima-Costa, M.F.; Giacomin, K.C.; de Loyola, A.I. Disability and use of health services by the elderly in Greater Metropolitan Belo Horizonte, Minas Gerais State, Brazil: A population-based study. Cad. Saude Publica 2014, 30, 599–610. [Google Scholar] [CrossRef] [PubMed]
- Danquah, L.; Polack, S.; Brus, A.; Mactaggart, I.; Houdon, C.P.; Senia, P.; Gallien, P.; Kuper, H. Disability in post-earthquake Haiti: Prevalence and inequality in access to services. Disabil. Rehabil. 2015, 37, 1082–1089. [Google Scholar] [CrossRef] [PubMed]
- Albanese, E.; Liu, Z.; Acosta, D.; Guerra, M.; Huang, Y.; Jacob, K.S.; Jimenez-Velazquez, I.Z.; Llibre Rodriguez, J.J.; Salas, A.; Sosa, A.L.; et al. Equity in the delivery of community healthcare to older people: Findings from 10/66 Dementia Research Group cross-sectional surveys in Latin America, China, India and Nigeria. BMC Health Service Res. 2011, 11, 153. [Google Scholar] [CrossRef] [PubMed]
- Marella, M.; Busija, L.; Islam, F.M.A.; Devine, A.; Fotis, K.; Baker, S.M.; Sprunt, B.; Edmonds, T.J.; Huq, N.L.; Cama, A.; et al. Field-testing of the rapid assessment of disability questionnaire. BMC Public Health 2014, 14, 900. [Google Scholar] [CrossRef] [PubMed]
- Rodrigues, M.A.P.; Facchini, L.A.; Piccini, R.X.; Tomasi, E.; Thume, E.; Silveira, D.S.; Siqueira, F.V.; Paniz, V.M.V. Use of primary care services by elderly people with chronic conditions, Brazil. Revista De Saude Publica 2009, 43, 604–612. [Google Scholar] [CrossRef] [PubMed]
- Fujii, R.K.; Goren, A.; Annunziata, K.; Mould-Quevedo, J. Prevalence, Awareness, Treatment, and Burden of Major Depressive Disorder: Estimates from the National Health and Wellness Survey in Brazil. Value Health Region. Issues 2012, 1, 235–243. [Google Scholar] [CrossRef] [PubMed]
- Freire, D.B.; Gigante, L.P.; Beria, J.U.; Palazzo, L.D.S.; Figueiredo, A.C.L.; Raymann, B.C.W. Access by hearing-disabled individuals to health services in a southern Brazilian city. Cadernos de Saude Publica 2009, 25, 889–897. [Google Scholar] [CrossRef] [PubMed]
- Liu, Z.; Albanese, E.; Li, S.; Huang, Y.; Ferri, C.P.; Yan, F.; Sousa, R.; Dang, W.; Prince, M. Chronic disease prevalence and care among the elderly in urban and rural Beijing, China—A 10/66 Dementia Research Group cross-sectional survey. BMC Public Health 2009, 9, 394. [Google Scholar] [CrossRef] [PubMed]
- Twomey, C.D.; Prince, M.; Cieza, A.; Baldwin, D.S.; Matthew Prina, A. Cross-sectional associations of depressive symptom severity and functioning with health service use by older people in low-and-middle income countries. Int. J. Environ. Res. Public Health 2015, 12, 3774–3792. [Google Scholar] [CrossRef] [PubMed]
- Andrade, L.; Walters, E.W.; Gentil, V.; Laurenti, R. Prevalence of ICD-10 mental disorders in a catchment area in the city of São Paulo, Brazil. Soc. Psychiatry Psychiatr. Epidemiol. 2002, 37, 316–325. [Google Scholar] [CrossRef] [PubMed]
- Groce, N.; Yousafzai, A.; Dlamini, P.; Zalud, S.; Wirz, S. HIV/AIDS and disability: A pilot survey of HIV/AIDS knowledge among a deaf population in Swaziland. Int. J. Rehabil. Res. 2006, 29, 319–324. [Google Scholar] [CrossRef] [PubMed]
- Moodley, J.; Ross, E. Inequities in health outcomes and access to health care in South Africa: A comparison between persons with and without disabilities. Disabil. Soc. 2015, 30, 630–644. [Google Scholar] [CrossRef]
- Blay, S.L.; Fillenbaum, G.G.; Andreoli, S.B.; Gastal, F.L. Equity of access to outpatient care and hospitalization among older community residents in Brazil. Med. Care 2008, 46, 930–937. [Google Scholar] [CrossRef] [PubMed]
- Castro, S.S.; Carandina, L.; Barros, M.B.; Goldbaum, M.; Cesar, C.L. Physical disability and hospitalization in Sao Paulo, Brazil. Cadernos de Saude Publica 2013, 29, 992–998. [Google Scholar] [CrossRef] [PubMed]
- Trani, J.F.; Browne, J.; Kett, M.; Bah, O.; Morlai, T.; Bailey, N.; Groce, N. Access to health care, reproductive health and disability: A large scale survey in Sierra Leone. Soc. Sci. Med. 2011, 73, 1477–1489. [Google Scholar] [CrossRef] [PubMed]
- Palmer, M.; Thuy, N.; Neeman, T.; Berry, H.; Hull, T.; Harley, D. Health care utilization, cost burden and coping strategies by disability status: An analysis of the Viet Nam National Health Survey. Int. J. Health Plan. Manag. 2011, 26, e151–e168. [Google Scholar] [CrossRef] [PubMed]
- Palmer, M.G.; Nguyen, T.M.T. Mainstreaming health insurance for people with disabilities. J. Asian Econ. 2012, 23, 600–613. [Google Scholar] [CrossRef]
- Palmer, M.G. Inequalities in Universal Health Coverage: Evidence from Vietnam. World Dev. 2014, 64, 384–394. [Google Scholar] [CrossRef]
- Gudlavalleti, M.V.S.; John, N.; Allagh, K.; Sagar, J.; Kamalakannan, S.; Ramachandra, S.S. Access to health care and employment status of people with disabilities in South India, the SIDE (South India Disability Evidence) study. BMC Public Health 2014, 14, 1125. [Google Scholar] [CrossRef] [PubMed]
- Devendra, A.; Makawa, A.; Kazembe, P.N.; Calles, N.R.; Kuper, H. HIV and Childhood Disability: A Case-Controlled Study at a Paediatric Antiretroviral Therapy Centre in Lilongwe, Malawi. PLoS ONE 2013, 8, e84024. [Google Scholar]
- Wandera, S.O.; Kwagala, B.; Ntozi, J. Determinants of access to healthcare by older persons in Uganda: A cross-sectional study. Int. J. Equity Health 2015, 14, 26. [Google Scholar] [CrossRef] [PubMed]
- Emerson, E.; Savage, A. Acute respiratory infection, diarrhoea and fever in young children at-risk of intellectual disability in 24 low- and middle-income countries. Public Health 2017, 142, 85–93. [Google Scholar] [CrossRef] [PubMed]
- Al Habashneh, R.; Al-Jundi, S.; Khader, Y.; Nofel, N. Oral health status and reasons for not attending dental care among 12- to 16-year-old children with Down syndrome in special needs centres in Jordan. Int. J. Dent. Hygiene 2012, 10, 259–264. [Google Scholar] [CrossRef] [PubMed]
- El Khatib, A.A.; El Tekeya, M.M.; El Tantawi, M.A.; Omar, T. Oral health status and behaviours of children with Autism Spectrum Disorder: A case-control study. Int. J. Paediatr. Dent. 2014, 24, 314–323. [Google Scholar] [CrossRef] [PubMed]
- Oredugba, F.A. Use of oral health care services and oral findings in children with special needs in Lagos, Nigeria. Spec. Care Dent. 2006, 26, 59–65. [Google Scholar] [CrossRef]
- Rahim, F.S.A.; Mohamed, A.M.; Nor, M.M.; Saub, R. Dental care access among individuals with Down syndrome: A Malaysian scenario. Acta Odonto. Scand. 2014, 72, 999–1004. [Google Scholar] [CrossRef] [PubMed]
- Sato, A.P.S.; Antunes, J.L.F.; Moura, R.F.; De Andrade, F.B.; Duarte, Y.A.O.; Lebraocia, M.L. Factors associated to vaccination against influenza among elderly in a large Brazilian metropolis. PLoS ONE 2015. [Google Scholar] [CrossRef] [PubMed]
- Abimanyi-Ochom, J.; Mannan, H.; Groce, N.E.; McVeigh, J. HIV/AIDS knowledge, attitudes and behaviour of persons with and without disabilities from the Uganda Demographic and Health Survey 2011: Differential access to HIV/AIDS information and services. PLoS ONE 2017, 12, e0174877. [Google Scholar] [CrossRef] [PubMed]
- Bisol, C.A.; Sperb, T.M.; Brewer, T.H.; Kato, S.K.; Shor-Posner, G. HIV/AIDS knowledge and health-related attitudes and behaviors among deaf and hearing adolescents in southern Brazil. Am. Ann. Deaf 2008, 153, 349–356. [Google Scholar] [CrossRef] [PubMed]
- Gottlieb, C.A.; Maenner, M.J.; Cappa, C.; Durkin, M.S. Child disability screening, nutrition, and early learning in 18 countries with low and middle incomes: Data from the third round of UNICEF’s Multiple Indicator Cluster Survey (2005–06). Lancet 2009, 374, 1831–1839. [Google Scholar] [CrossRef]
- Hanass-Hancock, J.; Myezwa, H.; Carpenter, B. Disability and Living with HIV: Baseline from a Cohort of People on Long Term ART in South Africa. PLoS ONE 2015, 10, e0143936. [Google Scholar] [CrossRef] [PubMed]
- Tavares, N.U.L.; Bertoldi, A.D.; Thume, E.; Facchini, L.A.; de Franca, G.V.A.; Mengue, S.S. Factors associated with low adherence to medication in older adults. Revista de Saude Publica 2013, 47, 1092–1101. [Google Scholar] [CrossRef] [PubMed]
- Kuper, H.; Nyapera, V.; Evans, J.; Munyendo, D.; Zuurmond, M.; Frison, S.; Mwenda, V.; Otieno, D.; Kisia, J. Malnutrition and Childhood Disability in Turkana, Kenya: Results from a Case-Control Study. PLoS ONE 2015, 10, e0144926. [Google Scholar] [CrossRef] [PubMed]
- Kuper, H.; Walsham, M.; Myamba, F.; Mesaki, S.; Mactaggart, I.; Banks, M.; Blanchet, K. Social protection for people with disabilities in Tanzania: a mixed methods study. Oxf. Dev. Stud. 2016, 44, 441–457. [Google Scholar] [CrossRef]
- Mactaggart, I.; Kuper, H.; Murthy, G.V.S.; Sagar, J.; Oye, J.; Polack, S. Assessing health and rehabilitation needs of people with disabilities in Cameroon and India. Disabil. Rehabil. 2016, 38, 1757–1764. [Google Scholar] [CrossRef] [PubMed]
- Trani, J.F.; Bakhshi, P.; Kuhlberg, J.; Narayanan, S.S.; Venkataraman, H.; Mishra, N.N.; Groce, N.E.; Jadhav, S.; Deshpande, S. Mental illness, poverty and stigma in India: a case-control study. BMJ Open 2015. [Google Scholar] [CrossRef] [PubMed]
- Eide, A.H.; Mannan, H.; Khogali, M.; van Rooy, G.; Swartz, L.; Munthali, A.; Hem, K.G.; MacLachlan, M.; Dyrstad, K. Perceived barriers for accessing health services among individuals with disability in four African countries. PLoS ONE 2015, 10, e0125915. [Google Scholar] [CrossRef] [PubMed]
- Marella, M.; Devine, A.; Armecin, G.F.; Zayas, J.; Marco, M.J.; Vaughan, C. Rapid assessment of disability in the Philippines: Understanding prevalence, well-being, and access to the community for people with disabilities to inform the W-DARE project. Popul. Health Metrics 2016, 14, 26. [Google Scholar] [CrossRef] [PubMed]
- Bernabe-Ortiz, A.; Diez-Canseco, F.; Vasquez, A.; Kuper, H.; Walsham, M.; Blanchet, K. Inclusion of persons with disabilities in systems of social protection: A population-based survey and case-control study in Peru. BMJ Open 2016. [Google Scholar] [CrossRef] [PubMed]
- Murthy, G.V.S.; John, N.; Sagar, J.; Shamanna, B.R.; Noe, C.; Soji, F.; Mani, S.; Pant, H.B.; Allagh, K.; Kamalakannan, S. Reproductive health of women with and without disabilities in South India, the SIDE study (South India Disability Evidence) study: A case control study. BMC Women’s Health 2014, 14, 146. [Google Scholar] [CrossRef] [PubMed]
- De Beaudrap, P.; Beninguisse, G.; Pasquier, E.; Tchoumkeu, A.; Touko, A.; Essomba, F.; Brus, A.; Aderemi, T.J.; Hanass-Hancock, J.; Eide, A.H.; et al. Prevalence of HIV infection among people with disabilities: a population-based observational study in Yaoundé, Cameroon (HandiVIH). Lancet HIV 2017, 4, e161–e168. [Google Scholar] [CrossRef]
- Mollaoglu, M.; Kayatas, M. Disability is associated with nonadherence to diet and fluid restrictions in end-stage renal disease patients undergoing maintenance hemodialysis. Int. Urol. Nephrol. 2015, 47, 1863–1870. [Google Scholar] [CrossRef] [PubMed]
- Brinda, E.M.; Rajkumar, A.P.; Enemark, U.; Prince, M.; Jacob, K.S. Nature and determinants of out-of-pocket health expenditure among older people in a rural Indian community. Int. Psychogeriatr. 2012, 24, 1664–1673. [Google Scholar] [CrossRef] [PubMed]
- Brinda, E.M.; Andres, R.A.; Enemark, U. Correlates of out-of-pocket and catastrophic health expenditures in Tanzania: Results from a national household survey. BMC Int. Health Hum. Rights 2014, 14, 5. [Google Scholar]
- Brinda, E.M.; Kowal, P.; Attermann, J.; Enemark, U. Health service use, out-of-pocket payments and catastrophic health expenditure among older people in India: The WHO Study on global AGEing and adult health (SAGE). J. Epidemiol. Community Health 2015, 69, 489–494. [Google Scholar] [CrossRef] [PubMed]
- Alhajj, T.; Wang, L.M.; Wheeler, K.; Zhao, W.Y.; Sun, Y.W.; Stallones, L.; Xiang, H.Y. Prevalence of disability among adolescents and adults in rural China. Disabil. Health J. 2010, 3, 282–288. [Google Scholar] [CrossRef] [PubMed]
- Badu, E.; Opoku, M.P.; Appiah, S.C.Y. Attitudes of health service providers: The perspective of people with disabilities in the Kumasi Metropolis of Ghana. Afr. J. Disabil. 2016, 5, 1. [Google Scholar] [CrossRef] [PubMed]
- Wongkongdech, A.; Laohasiriwong, W. Movement disability: Situations and factors influencing access to health services in the northeast of Thailand. Kathmandu Univ. Med. J. 2014, 12, 168–174. [Google Scholar] [CrossRef]
- World Health Organization. Disability and Health. 2018. Available online: http://www.who.int/mediacentre/factsheets/fs352/en/ (accessed on 13 April 2018).
- Jeremy, G.; Rory, O.C. Access to health care for disabled people: A systematic review. Soc. Care Neurodisabil. 2010, 1, 21–31. [Google Scholar]
- Alborz, A.; McNally, R.; Glendinning, C. Access to healthcare for people with learning disabilities: Mapping the issues and reviewing the evidence. J. Health Serv. Res. Policy 2005, 10, 173–182. [Google Scholar] [CrossRef] [PubMed]
- Rotarou, E.S.; Sakellariou, D. Inequalities in access to health care for people with disabilities in Chile: The limits of universal health coverage. Crit. Public Health 2017, 27, 604–616. [Google Scholar] [CrossRef]
- Sakellariou, D.; Rotarou, E.S. Access to healthcare for men and women with disabilities in the UK: Secondary analysis of cross-sectional data. BMJ Open 2017, 7, e016614. [Google Scholar] [CrossRef] [PubMed]
- Banks, L.M.; Walsham, M.; Hoang, M.V.; Vu, K.D.; Vu, M.Q.; Tran, N.T.; Bui, P.B.; Dang, H.S.; Nguyen, B.N.; Doan, D.T.T.; et al. Disability-Inclusive Social Protection in Vietnam: A National Overview with a Case Study from Cam Le District; London School of Hygiene & Tropical Medicine: London, UK, 2018. [Google Scholar]
- Banks, L.M.; Walsham, M.; Neupane, S.; Pradhananga, Y.; Maharjan, M.; Blanchet, K.; Kuper, H. Disability-Inclusive Social Protection in Nepal: A National Overview with a Case Study from Tanahun District; International Centre for Evidence in Disability: London, UK, 2018. [Google Scholar]
- Park, J.H.; Park, J.H.; Lee, S.Y.; Kim, S.Y.; Shin, Y.; Kim, S.Y. Disparities in antihypertensive medication adherence in persons with disabilities and without disabilities: Results of a Korean population-based study. Arch. Phys. Med. Rehabil. 2008, 89, 1460–1467. [Google Scholar] [CrossRef] [PubMed]
- Zhang, Y.; Baik, S.H.; Chang, C.-C.H.; Kaplan, C.M.; Lave, J.R. Disability, Race/ethnicity, and Medication Adherence Among Medicare Myocardial Infarction Survivors. Am. Heart J. 2012, 164, 425–433.e424. [Google Scholar] [CrossRef] [PubMed]
- Bright, T.; Felix, L.; Kuper, H.; Polack, S. A systematic review of strategies to increase access to health services among children in low and middle income countries. BMC Health Services Res. 2017, 17, 252. [Google Scholar] [CrossRef] [PubMed]
- Bright, T.; Felix, L.; Kuper, H.; Polack, S. Systematic review of strategies to increase access to health services among children over five in low- and middle-income countries. Trop. Med. Int. Health 2018. [Google Scholar] [CrossRef] [PubMed]
- CBM. Disability Inclusion: HIV. 2012. Available online: https://www.cbm.org/article/downloads/78851/CBM_Disability_Inclusion_-_HIVAIDS.pdf (accessed on 13 April 2018).
- Peters, D.H.; Garg, A.; Bloom, G.; Walker, D.G.; Brieger, W.R.; Rahman, M.H. Poverty and access to health care in developing countries. Ann. N. Y. Acad. Sci. 2008, 1136, 161–171. [Google Scholar] [CrossRef] [PubMed]


| Assessment Criteria by Study Design | |
| All study designs | |
| |
| Case control (additional criteria) | |
| |
| Cohort (additional criteria) | |
| |
| Overall Ratings | |
| ++ | Low risk of bias: All or almost all of the above criteria were fulfilled, and those that were not fulfilled were thought unlikely to alter the conclusions of the study |
| + | Medium risk of bias: Some of the above criteria were fulfilled, and those not fulfilled were thought unlikely to alter the conclusions of the study |
| − | High risk of bias: Few or no criteria were fulfilled, and the conclusions of the study were thought likely or very likely to alter with their inclusion. |
| Variable | Category | No. | % |
|---|---|---|---|
| Region | Latin America/Caribbean | 12 | 24 |
| East Asia/Pacific | 6 | 12 | |
| Sub-Saharan Africa | 15 | 30 | |
| Middle east | 2 | 4 | |
| South Asia | 6 | 12 | |
| Europe/Central Asia | 1 | 2 | |
| Various | 8 | 16 | |
| Income level | Low | 8 | 16 |
| Lower middle | 17 | 34 | |
| Upper middle | 17 | 34 | |
| Mixed | 8 | 16 | |
| Location | Urban | 15 | 30 |
| Rural | 4 | 8 | |
| Both | 24 | 48 | |
| Unclear | 7 | 14 | |
| Decade of publication | 1990 | 1 | 2 |
| 2000 | 8 | 16 | |
| 2010 | 41 | 82 | |
| Study design | Cross-sectional | 37 | 74 |
| Case-control study | 13 | 26 | |
| Outcome measured | Utilisation | 20 | 40 |
| Coverage | 22 | 44 | |
| Expenditure | 8 | 16 | |
| Insurance | 5 | 10 | |
| Adherence | 3 | 6 | |
| Barriers | 8 | 16 | |
| Quality | 3 | 6 | |
| Age group | All ages (includes >5 years; >4 years) | 9 | 18 |
| Adults only (>18 years) | 17 | 34 | |
| Older adults (>40 years; >50 years; >60 years) | 11 | 22 | |
| Children only (0–18 years) | 10 | 20 | |
| Unclear age/not presented | 3 | 6 | |
| Disability domain | Visual impairment | 11 | 22 |
| Hearing impairment | 15 | 30 | |
| Physical impairment | 15 | 30 | |
| Mental impairment | 24 | 48 | |
| Functional difficulties * | 24 | 48 | |
| Assistance with activities of daily living | 3 | 6 | |
| Other (communication, sensory, albinism) | 3 | 6 | |
| Multiple domains | 19 | 38 |
| Study | Country | Age Group of Participants | Disability Domain | Time Period (Months) | Outcome | Result | Summary | ||||
|---|---|---|---|---|---|---|---|---|---|---|---|
| 12 | 6 | 1–3 | NS | ||||||||
| Trani et al. (2010), Trani et al. (2012) [13,14] | Afghanistan | >4 years | Multiple: Physical impairment, sensory, mental impairment (mental illness/intellectual impairment) | ✓ | ▪ | ▪ | ▪ | Health centre utilisation | People with disabilities 82%; No disability 84% (p > 0.05) | NS | |
| Fialho et al. (2014) [15] | Brazil | ≥60 years | Activities of Daily Living | ✓ | ▪ | ▪ | ▪ | Number of appointments in past 12 months (0–1; 2–4; 5 or more); Home visits by doctor in past 12 months | ADL Number of appointments: PR (5 or more vs. 0–1) = 1.1 (1.0, 1.3) PR (2–4 vs. 0–1) = 1.1 (0.9, 1.1) Home visits: ADL PR = 8.5 (4.2, 17.3) | + | |
| Danquah et al. (2015) [16] | Haiti | ≥5 years | Functional difficulties | ✓ | ▪ | ▪ | ▪ | Number of visits to health centre (No visits (base); versus ≥3 visits) | Adults: OR = 2.1 (1.0, 4.3) Children: OR = 1.3 (0.5, 2.9) | + | |
| Albanese et al. (2011) [17] | Mexico, Peru, Cuba, Dominican Republic, Puerto Rico, Venezuela, China, India, Nigeria | >65 years | Multiple: Mental impairment (Dementia, depression), physical impairments, mobility restriction | ✓ | ▪ | ▪ | ▪ | Community health service use | Pooled prevalence ratio (all countries): Depression 1.2 (1.1, 1.4); Dementia 0.9 (0.9, 0.9); Physical impairment 1.4 (1.3, 1.5); Mobility restriction 1.0 (0.9, 1.1) | + | |
| Marella et al. (2014) [18] | Bangladesh, Fiji | ≥18 years | Functional difficulties | ▪ | ✓ | ▪ | ▪ | Access to health services | Bangladesh: People with disabilities 69%; No disability 66% (p < 0.001); Fiji: People with disabilities 82%; No disability 82% (p < 0.001) | − | |
| Rodrigues et al. (2009) [19] | Brazil | >65 years | Functional difficulties | ▪ | ✓ | ▪ | ▪ | Medical visit at the primary health care unit | PR = 1.3 (1.2; 1.5) | + | |
| Fujii et al. (2012) [20] | Brazil | >18 years | Mental impairment (depression) | ▪ | ✓ | ▪ | ▪ | Number of visits to traditional health care provider | Mean visits: People with disabilities Treated for depression 14.4 ± 20.6, People with disabilities not treated for depression 8.4 ± 10.5; No disability 3.3 ± 5.6 (p < 0.05) | + | |
| Freire et al. (2009) [21] | Brazil | >15 years | Hearing impairment | ▪ | ▪ | ✓ | ▪ | Medical consultation | PR = 1.3 (1.1, 1.5); p = 0.007 | + | |
| Liu et al. (2009) [22] | China | ≥65 years | Multiple: Mental impairment (Dementia), limiting physical illness (hearing impairment, physical impairment (limb or arthritis), and/or visual impairment (eye problem)) | ▪ | ▪ | ✓ | ▪ | Use of community services | Dementia:urban OR = 0.9 (0.7, 1.2); rural OR = 1.5 (0.8, 3.1); Number of limiting physical illness: 1–2 vs. none: urban OR = 2.3 (1.8, 2.9), rural OR = 3.8 (2.1, 6.9) 2 or more vs none: urban OR = 3.7 (2.9, 4.8); rural OR = 8.3 (4.1, 17.0) | + | |
| Twomey et al. (2015) [23] | China, Cuba, Dominican Republic, India, Mexico, Nigeria, Peru, Puerto Rico, Venezuela | ≥65 years | Multiple: Mental impairment (Dementia, depression), functioning difficulties (concentrating/remembering, self-care, physical, communication, participation) | ▪ | ▪ | ✓ | ▪ | Previous health service utilisation | Depression severity PR=1.0 (1.01, 1.03); Functioning difficulties: PR = 1.01 (1.00, 1.03) | + | |
| Andrade et al. (2002) [24] | Brazil | >18 years | Mental impairment (mental disorders) | ▪ | ▪ | ✓ | ▪ | General health service utilisation in the past month | Any psychiatric disorder 38% (SE = 2.8); No psychiatric disorder 24% (SE = 1.6) | + | |
| Groce et al. (2006) [25] | Swaziland | ≥18 years | Hearing impairment | ▪ | ▪ | ▪ | ✓ | Clinic attendance | People with disabilities 69%; No disability 87% (p < 0.05) | - | |
| Moodley et al. (2015) [26] | South Africa | Adults | Functional difficulties | ▪ | ▪ | ▪ | ✓ | Length of time since last consultation: last 30 days; 1–5 months ago; 6–12 months ago; >1 and <2 years ago; 2–4 years ago; 5–10 years ago; >10 years ago; never | People with disabilities 44%; 15%; 8%; 16%; 5%; 2%; 2%; 10%No disability 20%; 14%; 8%; 29%; 10%; 4%; 2%; 13%p < 0.001; p = 0.17; p = 1.00; p < 0.001; p < 0.001; p < 0.001; p = 1.00; p < 0.001 | + | |
| Study | Country | Age Group of Participants | Disability Domain | Time Period (Months) | Summary of Results | Hospitalisation | Outpatient Visit | ||||
|---|---|---|---|---|---|---|---|---|---|---|---|
| 12 | 6 | 3 | 1 | NS | |||||||
| Trani et al. (2010, 2012) [14,29] | Afghanistan | >4 years | Multiple: Physical impairment, sensory, mental impairment (mental illness/intellectual impairment) | ✓ | ▪ | ▪ | ▪ | ▪ | Hospital admission (12 months): People with disabilities 80%; No disability 90%; p < 0.001 | − | |
| Palmer et al. (2011, 2012) [30,31] | Vietnam | >5 years | Multiple: Physical impairment, hearing impairment, speaking, visual impairment, mental impairment (intellectual impairment, mental illness) | ✓ | ▪ | ▪ | ✓ | ▪ | Inpatient (past 12 months) OR = 1.7 (p ≤ 0.01) Outpatient (past month) OR = 1.1 (p = NS) | + | NS |
| Palmer et al. (2014) [32] | Vietnam | >5 years | Functional difficulties | ✓ | ▪ | ▪ | ✓ | ▪ | Inpatient visit in last 12 months mean 0.19 (SE = 0.12) Significantly higher than other groups studied (formal employee, person living in poverty, self-employed) Outpatient visit in the past month: mean 0.32 (SE = 0.015). Higher than other groups, but statistical test not reported. | + | NS |
| Murthy et al. (2014) [33] | India | >18 years | Multiple: Physical impairments, visual impairment, hearing impairment, mental impairment (intellectual impairment) | ✓ | ▪ | ▪ | ▪ | ▪ | Need to visit hospital (past year) OR 1.6 (0.9, 2.5), p = 0.05 | + | |
| Castro et al. (2013) [28] | Brazil | >11 years | Multiple: Visual impairment, hearing impairment, physical impairment | ✓ | ▪ | ▪ | ▪ | ▪ | PR for hospitalisation No disability PR: 1.00 (base) Visual: PR: 0.9 (0.45, 1.6); NS Hearing: PR: 1.6 (0.9, 2.9); NS Physical: PR:3.8 (2.0, 7.1) Multiple: PR:3.3 (1.6, 6.6) | + | |
| Fialho et al. (2014) [15] | Brazil | ≥60 years | Participation | ✓ | ▪ | ▪ | ▪ | ▪ | PR for hospitalization = 1.6 (1.2, 2.3) | + | |
| Freire et al. (2009) [21] | Brazil | >15 years | Hearing impairment | ✓ | ▪ | ▪ | ▪ | ▪ | PR for hospitalization = 2.1 (1.4, 3.1) | + | |
| Blay et al. (2008) [27] | Brazil | >60 years | Multiple: Physical impairment, mental impairment (mental health condition) | ✓ | ✓ | ▪ | ▪ | ▪ | Hospitalisations (12 months) Rheumatism OR = 0.9 (0.8, 1.1) Psychiatric morbidity OR = 1.4 (1.1, 1.9) Outpatient visit (6 months) Rheumatism OR = 1.1 (0.9, 1.3) Psychiatric morbidity OR = 1.1 (0.9, 1.2) | + | NS |
| Fujii et al. (2012) [20] | Brazil | >18 years | Mental impairment (mental health) | ▪ | ✓ | ▪ | ▪ | ▪ | Hospitalisations (6 months): People with disabilities treated for depression 24%; People with disabilities not treated for depression: 17%; Control 8%; p < 0.05 | + | |
| Devendra et al. (2013) [34] | Malawi | 2–9 years | Functional difficulties | ▪ | ▪ | ▪ | ▪ | ✓ | Overnight hospital admission OR = 2.7 (1.2, 6.2) | + | |
| Twomey et al. (2015) [23] | Various | >65 years | Functional difficulties | ▪ | ▪ | ✓ | ▪ | ▪ | Hospital admission (past 3 months) Depression severity PR = 1.1 (0.9, 1.3) Functioning: PR = 1.1 (1.02, 1.3) | + | |
| World report on disability (2011) [1] | Various (50 LMIC) | 18+ years | Functional difficulties | ✓ | ▪ | ▪ | ▪ | ▪ | Overall, people with disabilities sought more inpatient and outpatient care in the last 5 years compared to people without disabilities, and this difference was evidence across both genders and all age groups, except in people aged 60+ | + | + |
| Study Author, Year | Country | Age Group of Participants | Disability Group | Outcome | People with Disabilities | People without Disabilities | Comparison | Summary | ||
|---|---|---|---|---|---|---|---|---|---|---|
| Care seeking when ill | ||||||||||
| Kuper et al. (2014) [4] | 30 LMIC | Children | Physical, mental, vision, communication, hearing | Serious illness in the last 12 months and if sought treatment | >97% | >97% | Not reported | NS | ||
| Kuper et al. (2015) [47] | Kenya | Children | Physical, epilepsy, visual, hearing, intellectual, functional difficulties | Took action when sick | 83% | 84% | OR = 1.2 (0.6, 2.2) | NS | ||
| Kuper et al. (2016) [48] | Tanzania | All ages | Functioning (WG) | Proportion seeking care when ill | 94% | 96% | Not reported | NS | ||
| Mactaggart et al. (2015) [49] | India and Cameroon | All ages | Functioning (WG) | Sought care if serious health problem | India a OR = 0.9 (0.3, 3.1); Cameroon a OR = 1.8 (0.7, 4.3) | NS | ||||
| Wandera et al. (2015) [35] | Uganda | Older adults | Functioning (WG) | Access to healthcare in the last 30 days when ill | Overall: 70% Within domains: Communicating: 49% Seeing: 67% Hearing: 67% Walking: 63% Remembering or concentrating: 55% Self-care: 55% | Overall: 80% Communicating 76% Seeing 78% Hearing 77% Walking 80% Remembering or concentrating 77% Self-care 77% | p < 0.001 p = 0.01 p = 0.03 p = 0.14 p < 0.001 p < 0.001 p = 0.001 | − | ||
| Trani et al. (2015) [50] | India | Not specified | Mental health | Could you receive healthcare when sick? | 4% | 3% | p = 0.28 | NS | ||
| Emerson et al. (2017) [36] | 25 LMICs | Children | Intellectual disability | Help sought for respiratory infection Help sought for fever | 53% 48% | 65% 50% | OR = 0.69 (0.59, 0.80) OR = 0.95 (0.86, 1.05) | − | ||
| Eide et al. (2015) [51] | Sudan; Namibia; South Africa; Malawi | Not specified | Functioning (WG) | Probability of not receiving necessary health care | 0.19 | 0.07 | Statistical test not shown—trend for higher probability of not receiving care | − | ||
| Marella et al. (2016) [52] | Philippines | ≥18 years | Multiple: Visual impairment, hearing impairment, communication, physical impairment, mental impairment (cognitive, appearance, psychological distress) | Met need for general health services | OR = 0.5 (0.3, 0.7) | − | ||||
| Dental | ||||||||||
| Al Habashneh et al. (2012) [37] | Jordan | Children 12–16 years | Intellectual disability (Down’s syndrome) | Dental visits (parent report) Visit dentist: Never, irregular, regular | 32%, 58%, 10% | 16%, 51%, 34% | p < 0.01 | − | ||
| El Khatib et al. (2014) [38] | Egypt | Children | Behavioural impairment (Autism) | Dental visits in the past year; difficulty finding a dentist (parent report) | 44%; 64% | 67%; 25% | p = 0.002 | − | ||
| Rahim et al. (2014) [40] | Malaysia | Children | Intellectual disability (Down’s syndrome) | Received any dental treatment | 49% | 53% | p > 0.01 | NS | ||
| Oredugba et al. (2006) [39] | Nigeria | Children 5–19 years | Multiple: mental disabilities (e.g., Down’s syndrome, autism); physical (cerebral palsy) | Previous dental attendance | 4% | 4% | p > 0.05 | NS | ||
| Maternal | ||||||||||
| Bernabe-Ortiz et al. (2016) [53] | Peru | All ages | Functioning (WG) | Accessing prenatal care for pregnancies in the past 5 years | 100% | 100% | p > 0.05 | NS | ||
| Mactaggart et al. (2015) [49] | Cameroon | All ages | Functioning (WG) | Antenatal care/vaccines for women (yes; no) | OR = 0.6 (0.2, 2.1) | NS | ||||
| Murthy et al. (2014) [54] | India | Adults | Physical, visual, hearing, intellectual | Baby delivered at hospital in the last 2 years | 63% | 72% | p = 0.15 | NS | ||
| Trani et al. (2011) [29] | Sierra Leone | Adults | Functioning (bespoke tool) | Antenatal visit; Birth attended by professional; Delivery in hospital; Access to emergency care | 94% 94% 87% 80% | 84% 84% 76% 76% | p = 0.35 p = 0.07 p = 0.18 p = 0.82 | NS | ||
| Vaccination | ||||||||||
| Kuper et al. (2015) [47] | Kenya | Children | Physical, epilepsy, visual, hearing, intellectual, functioning | Child received vaccinations | 97% | 98% | OR = 1.3 (0.5, 3.5) | NS | ||
| Bernabe-Ortiz et al. (2016) [53] | Peru | All ages | Functioning (WG) | Vaccination of children born in the past 5 years | 100% | 100% | p > 0.05 | NS | ||
| Sato et al. (2015) [41] | Brazil | Older adults | Mental impairment (depression); physical impairment (“bedridden”) | Influenza vaccination coverage (self-report): Depression; “bedridden” | PR = 0.9 (0.9, 1.0) PR = 1.0 (0.8, 1.3) | NS | ||||
| Mactaggart et al. (2015) [49] | India | All ages | Functioning (WG) | Child vaccinated (yes; no) | OR = 1.8 (0.3, 11.9) | NS | ||||
| Trani et al. (2011) [29] | Sierra Leone | Adults | Functioning (bespoke tool) | Not immunised | 25% | 11% | p = 0.003 | − | ||
| HIV | ||||||||||
| Abimanyi-Ochom et al. (2017) [42] | Uganda | Adults | Functioning (WG) | Month since last test | p < 0.05 for all comparisons | + | ||||
| Bisol et al. (2008) [43] | Brazil | Children | Hearing impairment | Ever been tested | 21% | 8% | p = 0.08 | NS | ||
| De Beaudrap et al. (2017) [55] | Cameroon | Adults | Functioning (WG) | Ever been tested | 71% | 77% | OR = 0.8 (0.6, 1.0) | NS | ||
| Trani et al. (2011) [29] | Sierra Leone | Adults | Functioning (bespoke tool) | Ever been tested | 16% | 20% | p < 0.001 | − | ||
| Other outcomes | ||||||||||
| Freire et al. (2009) [21] | Brazil | Adults | Hearing impairment | (1) Average time elapsed since the last Pap smear (2) Time since last prostate exam | (1) 24.3 (SD = 32.9) (2) 30.6 (SD = 28.6) | (1) 7.2 (SD 13.8) (2) 30.5 (SD = 24.1) | (1) p < 0.001 (2) p = 0.98 (NS) | − | ||
| Gottlieb et al. (2009) [44] | 18 LMIC | Children | Functioning (Ten Questions) | Receipt of vitamin A supplements (ever received yes or no) (parent report) | 28% | 77% | No significance test reported | − | ||
| Study Author, Year | Country | Age Range | Disability Domain | Relevant Measures of Access | Measure Among People with Disabilities | Measure Among Controls | Measure of association | Summary |
|---|---|---|---|---|---|---|---|---|
| Hannass-Hancock et al. (2015) [45] | South Africa | 18–88 years | Functional difficulties | Non-adherence to HIV treatment | - | - | Relative risk ratios (RR) Global limitation 1.1 (1.05–1.14) Mobility 1.3 (1.2, 1.5) Life activity 0.7 (0.4, 1.2); NS Cognition 1.1 (0.8, 1.5); NS Participation 1.2 (0.9, 1.5); NS Self-care 0.7 (0.3, 1.4); NS Activity limitations OR = 1.1 (1.1, 1.2) | − |
| Mollaoglu et al. (2015) [56] | Turkey | >18 years | Functional difficulties | Diet non adherence (mean (SD)) Fluid non adherence (mean (SD)) | Severe level 3.22 (0.66) Severe level 3.88 (1.05) | 2.46 (0.75) 3.28 (0.45) | p < 0.001 (comparing scores between no, mild, moderate, severe disability) OR = 3.6 (2.1, 6.1) (comparing high to low level of disability) p < 0.001 (comparing scores between no, mild, moderate, severe disability) OR = 2.9 (1.0, 1.2) (comparing high to low level of disability) | − |
| Tavares et al. (2013) [46] | Brazil | >60 years | Multiple: Participation Mental impairment (cognitive deficit, depression) | % low adherence | IADL: 33%; Depression: 31%; Cognitive: 27% | No IADL 26%; No depression 28%; No cognitive deficit 29% | PR = 1.3 (1.1, 1.5) p = 0.009 PR = 1.1 (0.9, 1.4) p = 0.49 PR = 0.9 (0.7, 1.2) p = 0.67 | − |
| Study Author, Year | Country | Age Range | Disability Domain | Relevant Measures of Access | Measure among People with Disabilities | Measure among Controls | Measure of Association | Summary |
|---|---|---|---|---|---|---|---|---|
| Insurance | ||||||||
| Alhajj et al. (2010) [60] | China | 15–84 years | Multiple: Hearing impairment, visual impairment, physical impairment, mental impairment | Medical payment method: Out of pocket Government insurance Commercial insurance | 80% 20% 0.7% | 82% 20% 0.6% | p > 0.05 | NS |
| Bernabe-Ortiz et al. (2016) [53] | Peru | ≥5 years | Functional difficulties | Enrolled in insurance scheme | 83%; | 81% | OR = 0.9 (0.5, 1.6) | NS |
| Freire et al. (2009) [21] | Brazil | >15 years | Hearing impairment | Enrolled in health plan | PR = 1.1, 95%CI 1.0–1.3; p = 0.11 | NS | ||
| Moodley et al. (2015) [26] | South Africa | “adults” | Functional difficulties | Medical aid receipt | 10% | 18% | p < 0.001 | − |
| Palmer et al. (2011) and Palmer (2012) [30,31] | Vietnam | >5 years | Multiple: Physical impairment, hearing impairment, speaking, visual impairment, mental impairment | Insurance card holder (mean) | 0.19 (SE = 0.007) | 0.18 (SE = 0.003) | p > 0.05 | NS |
| Expenditure | ||||||||
| Brinda et al. (2012) [57] | India | >60 years | Multiple: Functional difficulties; mental impairment (Alzheimers, Dementia, Mental Health), hearing impairment, visual impairment | Total out of pocket health expenditure; catastrophic health expenditure | Correlates of out of pocket health expenditure Visual impairment p = 0.82 Hearing impairment p = 0.14 Dementia p < 0.001 Major depression p < 0.001 WHODAS II p < 0.001 Correlates of catastrophic health expenditure Visual impairment; p = 0.78 Hearing impairment; p = 0.66 Dementia; p = 0.01 | + | ||
| Brinda et al. (2014) [58] | Tanzania | ≥18 years | Multiple: Visual impairment, hearing impairment, functional difficulties, mental impairment | Total out of pocket health expenditure; catastrophic health expenditure | Out of pocket health expenditure (18–59 years) Blindness/visual defect NS Hearing defect: p = 0.02 Limb defect: NS Psychiatric morbidity NS Functional disability: p < 0.001 Out of pocket health expenditure (>60 years) Blindness/visual defect: p = 0.01 Hearing defect: NS Limb defect: NS Psychiatric morbidity: NS Functional disability: p = 0.01 Catastrophic expenses functional disability: 1.19 (0.93, 1.51); NS | + | ||
| Brinda et al. (2015) [59] | India | ≥65 years | Functional difficulties | Out of pocket health expenditure and catastrophic health expenditure | Disability was positively correlated with out-of-pocket health expenditure (p < 0.001) Catastrophic health expenditure was associated with depression: OR = 3.5 (1.5, 7.5); p = 0.004 | + | ||
| Palmer et al. (2014) [32] | Vietnam | >5 years | Functional difficulties | Inpatient expenditure (past month) Outpatient expenditure (past month) Catastrophic health expenditure: 10% threshold; 20% threshold; 40% threshold | Inpatient: 401 (57) Outpatient: 51 (8) 10%: 50% 20%: 30% 40%: 12% | Inpatient: 35–235 Outpatient: 6–39 10%: 20–40% 20%: 10–20% 40%: 3–10% | Inpatient and outpatient expenditures: NS Outpatient visit in the past month: NS Effect of insurance on catastrophic health expenditure: NS | NS |
| Palmer et al. (2011) and Palmer (2012) [30,31] | Vietnam | >5 years | Multiple: Physical, hearing, speaking, visual, mental impairment | Expenditure ratio: Inpatient; outpatient | Expenditure ratio: Inpatient 1.7 (0.15) p ≤ 0.01 Outpatient 0.9 (0.07) p = NS | + | ||
| Trani et al. (2011) [29] | Sierra Leone | ≥18 years | Multiple: Physical impairment, sensory disabilities, mental impairment | Health expenditure: % total average yearly HH income spent on health | severe 4% | 3% | Not measured | NS |
| World report on disability (2011) [1] | Various (50 LMIC) | ≥18 years | Functioning | Catastrophic health expenditure | M 31.2%; F 33%; 18–49 years: 33%; 50–59 years: 33%; 60+ years: 30% | M 20%; F 20%; 18–49 years: 20%; 50–59 years: 18%; 60+ years: 21% | For all comparisons, catastrophic health expenditure was higher among people with disabilities p < 0.05 | + |
| Trani et al. (2010) and Trani et al. (2012) [13,14] | Afghanistan | >4 years | Functioning | Medical expenses (Afghanis) amongst those with severe difficulties | None: 75% 1–499: 15% 500–1999: 7% 2000–105,000: 3% | None: 76% 1–499: 15% 500–1999: 7% 2000–105,000: 8% | p > 0.05 | NS |
| Barrier | Al Habashneh et al. (2011) [37] | Badu et al. (2016) [61] | Danquah et al. (2015) [16] | Eide et al. (2015) [51] | Marella et al. (2016) [52] | Murthy et al. (2014) [33] | Rahim et al. (2014) [40] | World report on Disability (2011) [1] |
|---|---|---|---|---|---|---|---|---|
| Geographic accessibility | ||||||||
| Transport difficulties | ✓ | ✓ | ✓ | ✓ | ✓ | |||
| Location of services | ✓ | |||||||
| Affordability | ||||||||
| Financial | ✓ | ✓ | ✓ | ✓ | ✓ | |||
| No accommodation at health facility | ✓ | |||||||
| Acceptability | ||||||||
| Lack of perceived need | ✓ | ✓ | ||||||
| Other commitments | ✓ | ✓ | ||||||
| Lack of awareness or information | ✓ | ✓ | ✓ | |||||
| Did not know where to go | ✓ | ✓ | ||||||
| Fear of service | ✓ | |||||||
| Fear of journey | ✓ | ✓ | ||||||
| Faith/belief | ✓ | |||||||
| Discrimination or lack of awareness amongst health workers | ✓ | ✓ | ✓ | ✓ | ||||
| Previous bad experience | ✓ | |||||||
| Communication with health providers | ✓ | |||||||
| Standard of facility | ✓ | |||||||
| Physical access to facility | ✓ | ✓ | ||||||
| Availability | ||||||||
| Services not available | ✓ | |||||||
| Lack of equipment | ✓ | ✓ | ✓ | |||||
| Tried but denied | ✓ | ✓ | ||||||
| Health care providers skills inadequate | ✓ | |||||||
| Difficulty finding doctor | ✓ |
© 2018 by the authors. Licensee MDPI, Basel, Switzerland. This article is an open access article distributed under the terms and conditions of the Creative Commons Attribution (CC BY) license (http://creativecommons.org/licenses/by/4.0/).
Share and Cite
Bright, T.; Kuper, H. A Systematic Review of Access to General Healthcare Services for People with Disabilities in Low and Middle Income Countries. Int. J. Environ. Res. Public Health 2018, 15, 1879. https://doi.org/10.3390/ijerph15091879
Bright T, Kuper H. A Systematic Review of Access to General Healthcare Services for People with Disabilities in Low and Middle Income Countries. International Journal of Environmental Research and Public Health. 2018; 15(9):1879. https://doi.org/10.3390/ijerph15091879
Chicago/Turabian StyleBright, Tess, and Hannah Kuper. 2018. "A Systematic Review of Access to General Healthcare Services for People with Disabilities in Low and Middle Income Countries" International Journal of Environmental Research and Public Health 15, no. 9: 1879. https://doi.org/10.3390/ijerph15091879
APA StyleBright, T., & Kuper, H. (2018). A Systematic Review of Access to General Healthcare Services for People with Disabilities in Low and Middle Income Countries. International Journal of Environmental Research and Public Health, 15(9), 1879. https://doi.org/10.3390/ijerph15091879