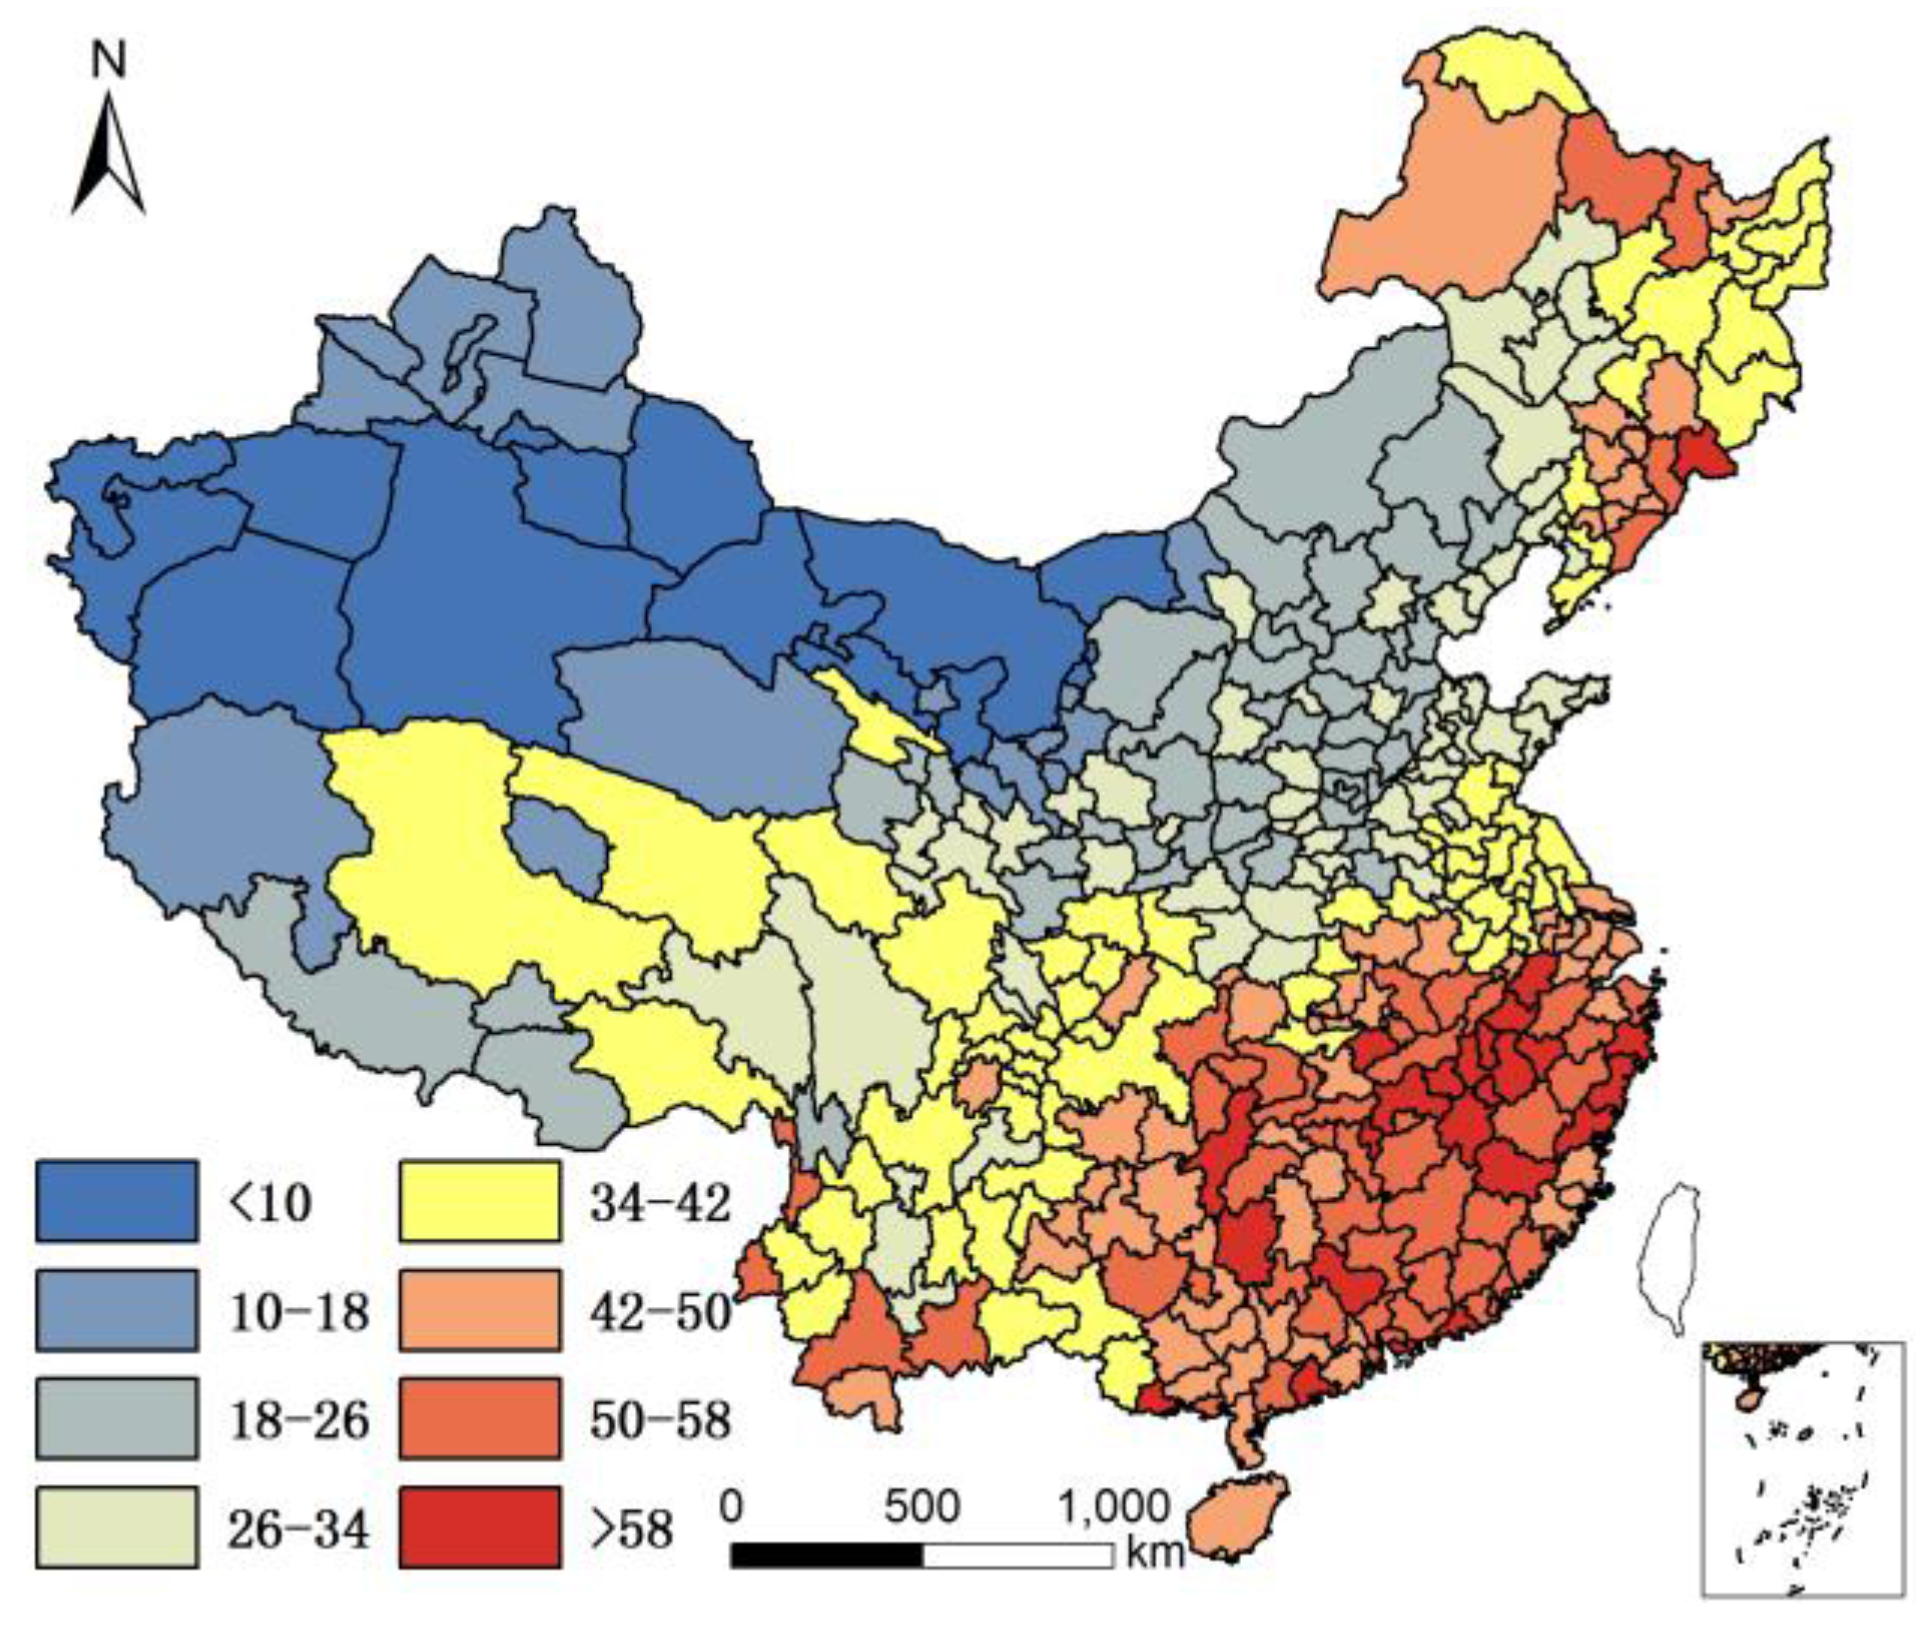
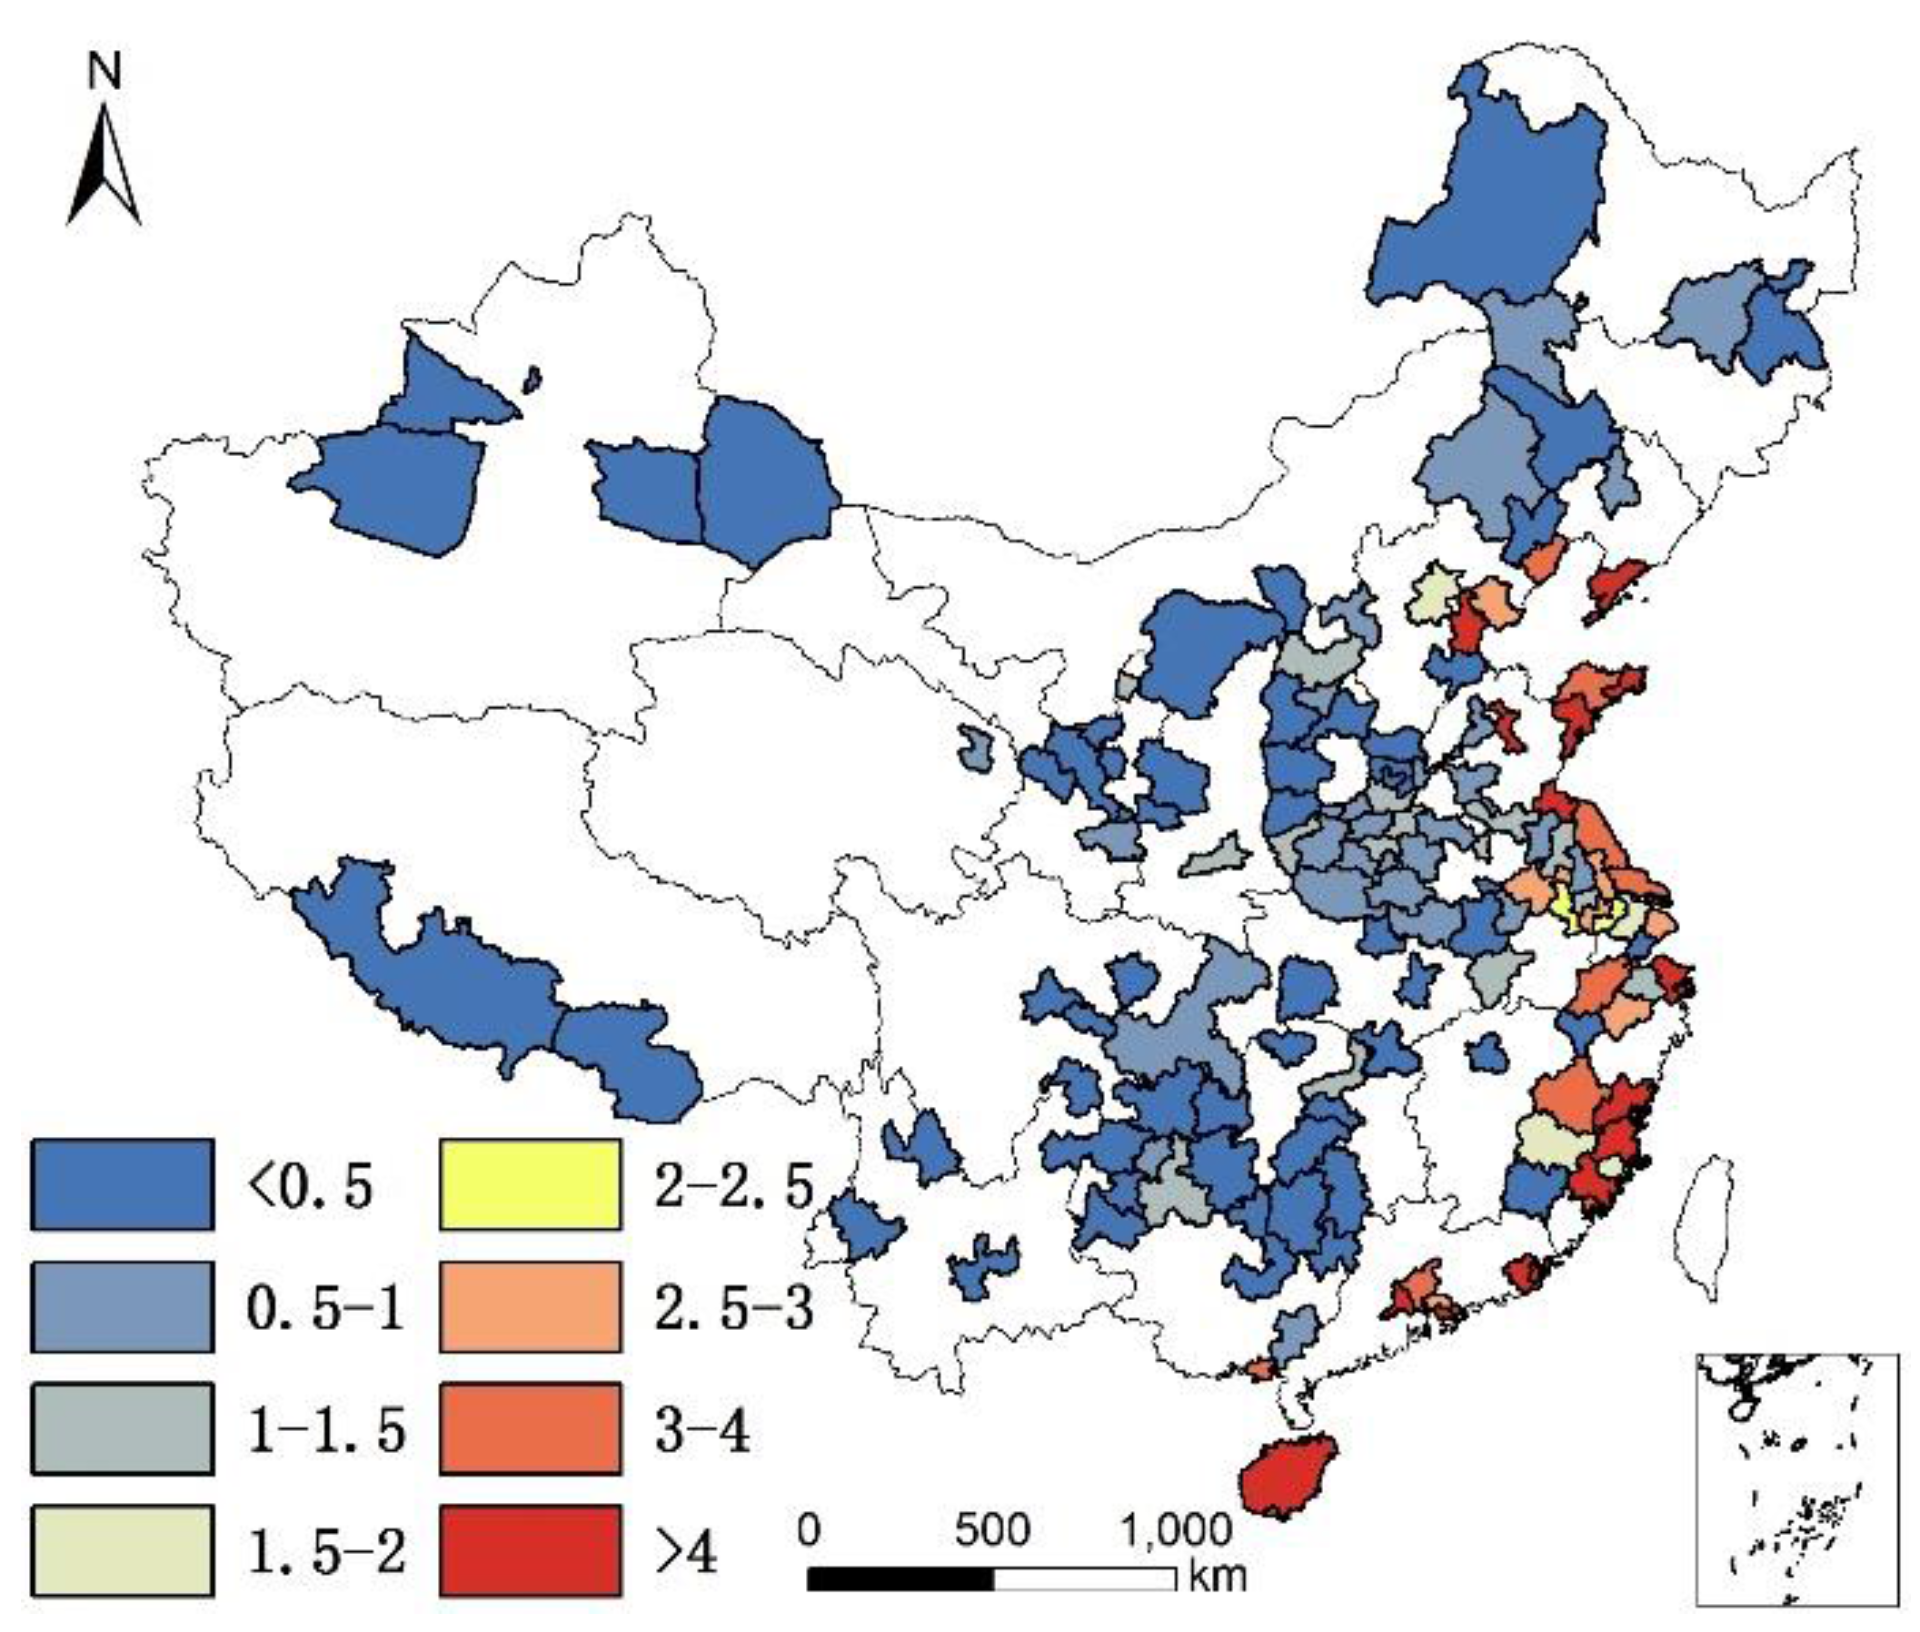
Figure 1.
Longevity rate (85+/65+) in China in 2000.
Figure 1.
Longevity rate (85+/65+) in China in 2000.
Figure 2.
Longevity rate (85+/65+) in China in 2010.
Figure 2.
Longevity rate (85+/65+) in China in 2010.
Figure 3.
Average temperature in China.
Figure 3.
Average temperature in China.
Figure 4.
Standard deviation of monthly mean temperature in China.
Figure 4.
Standard deviation of monthly mean temperature in China.
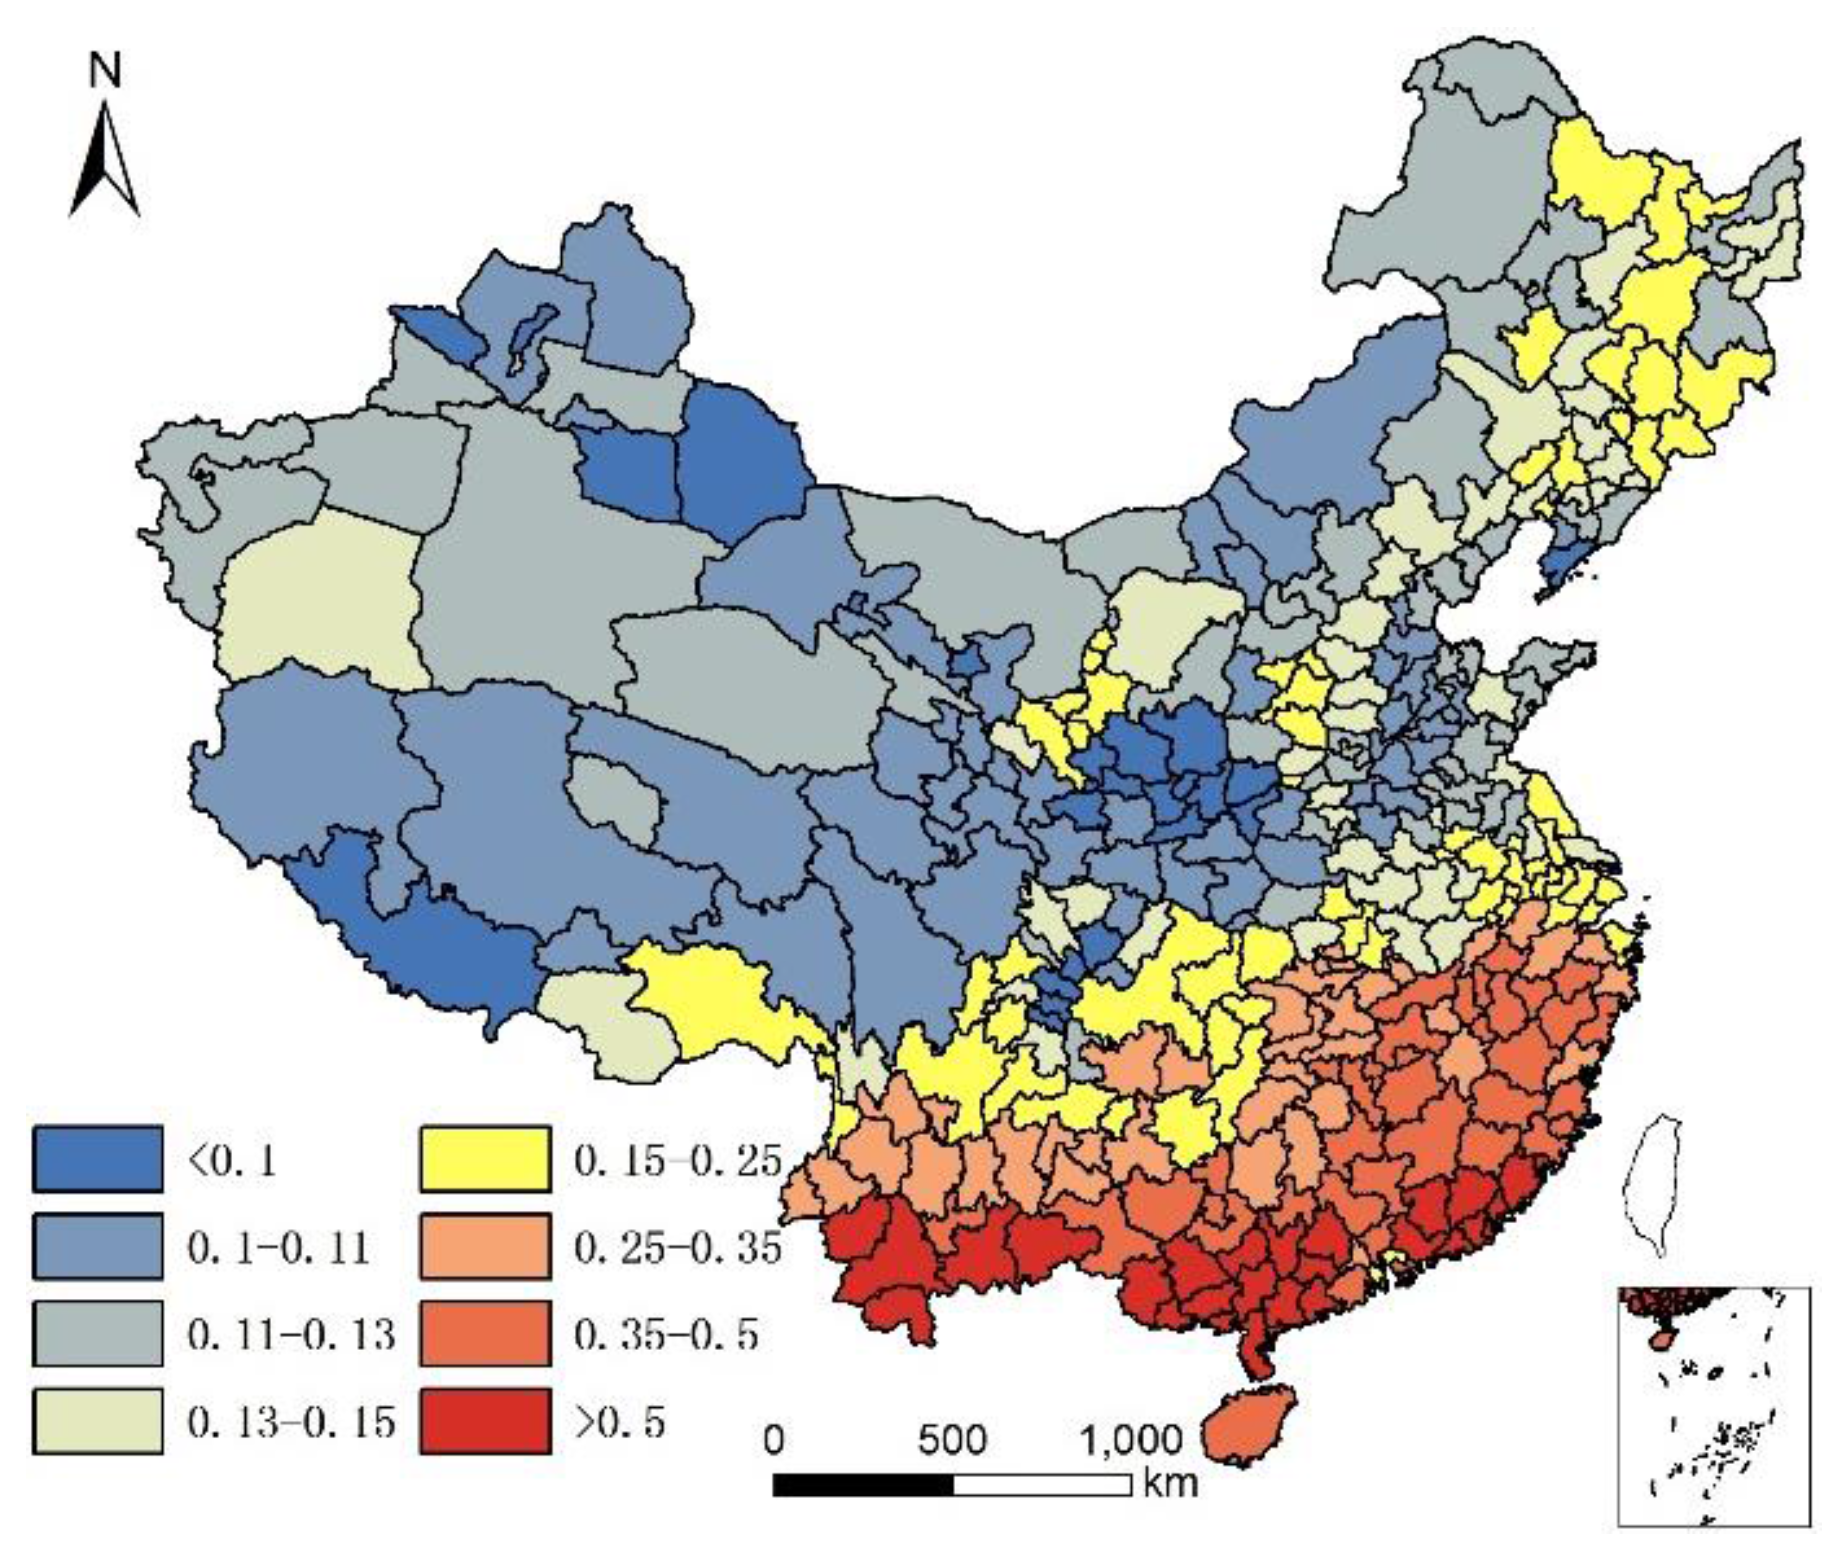
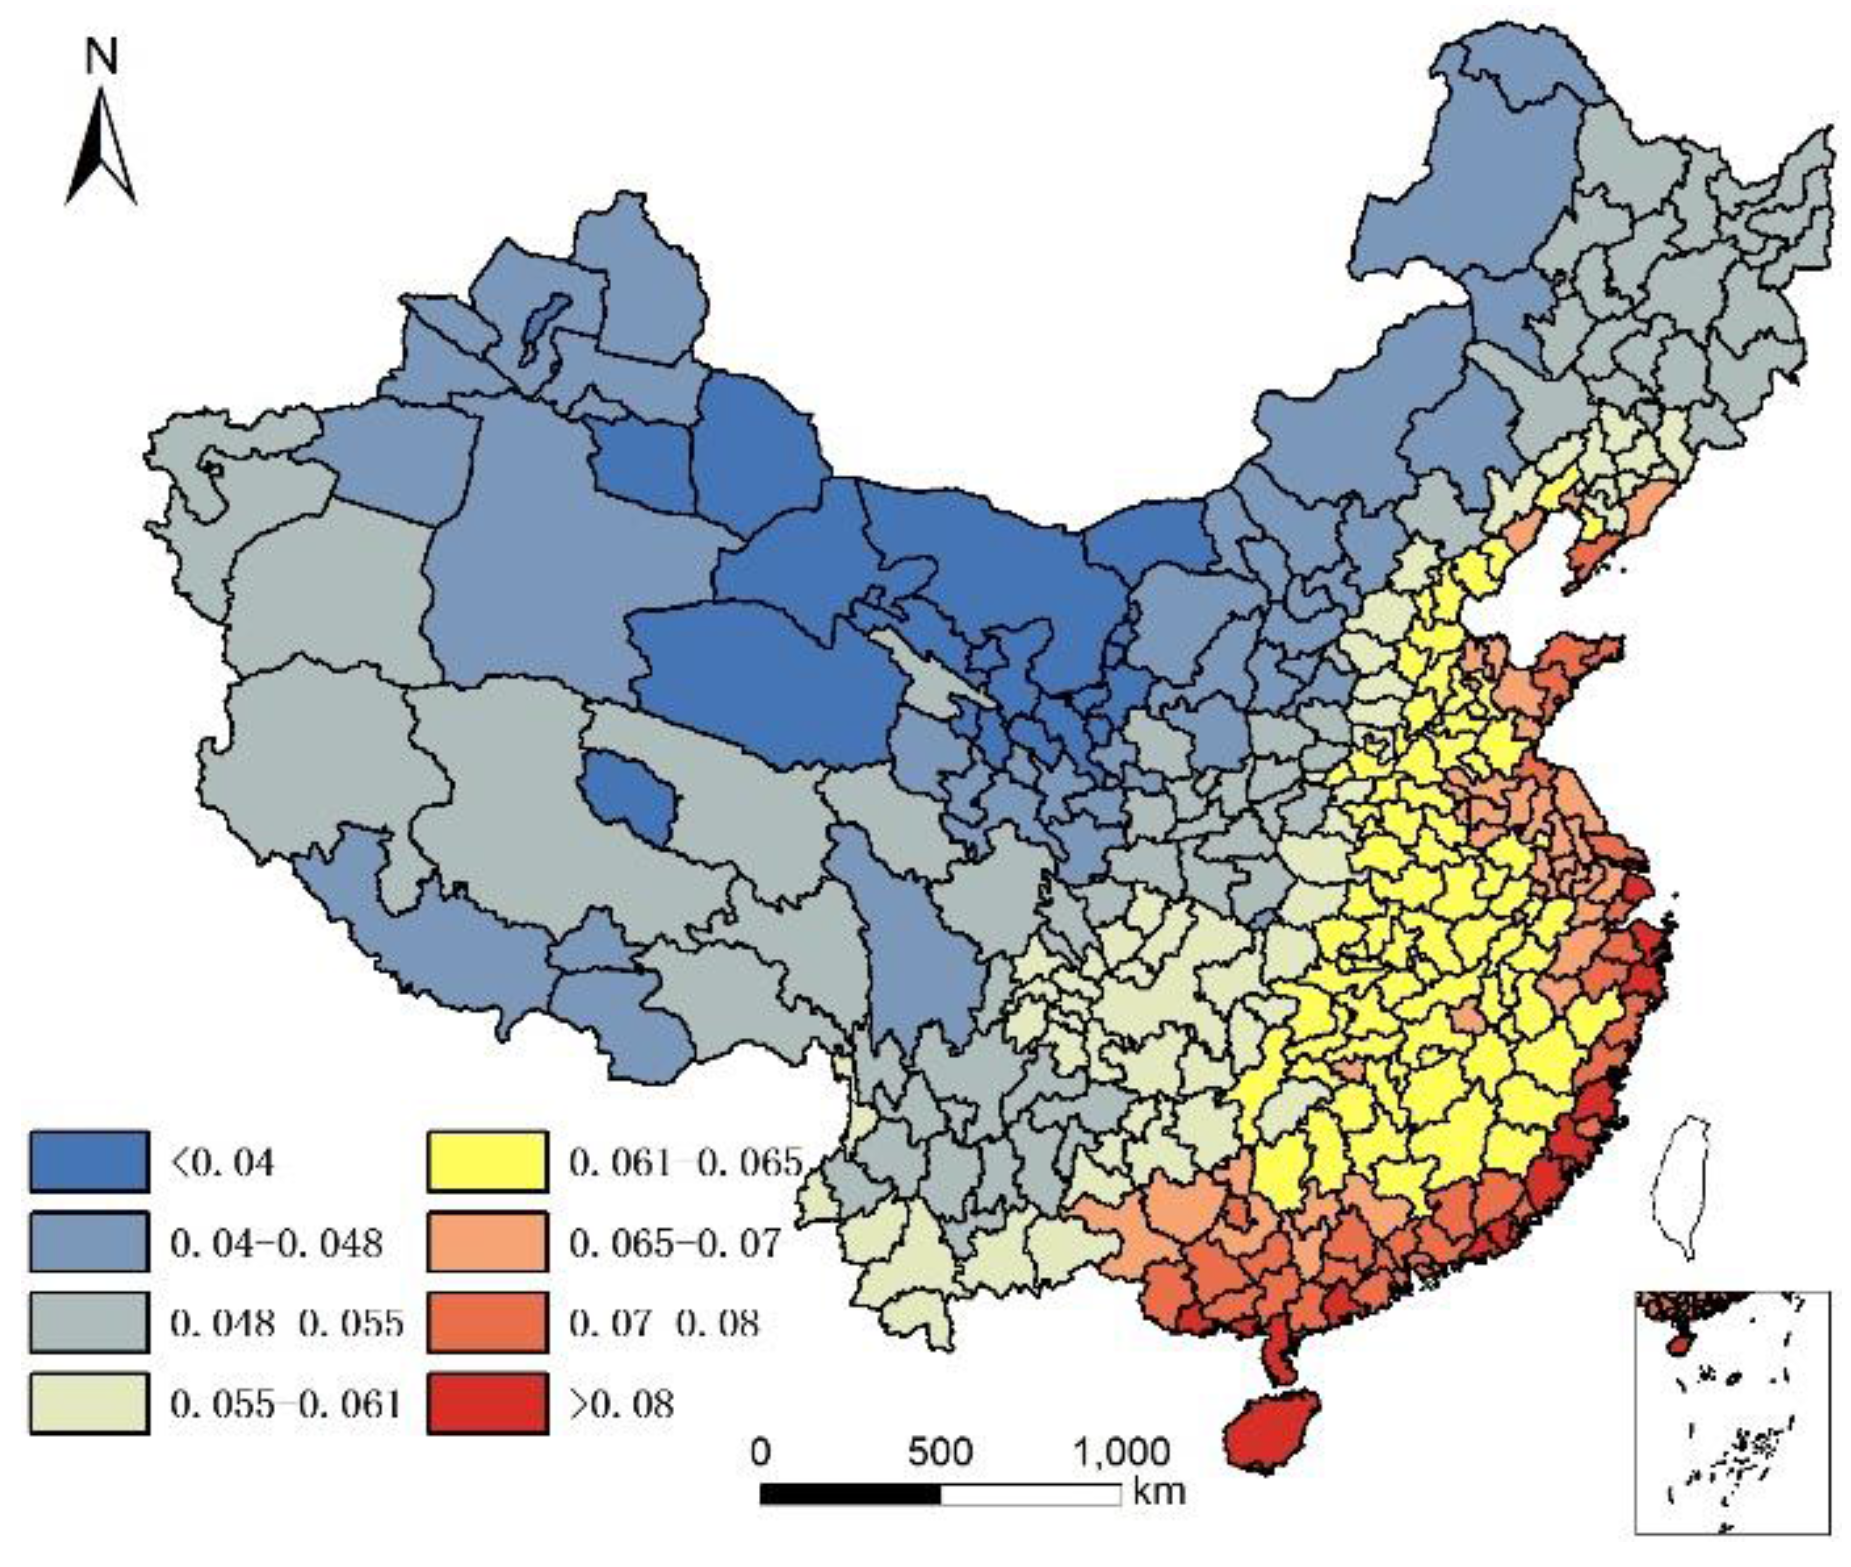
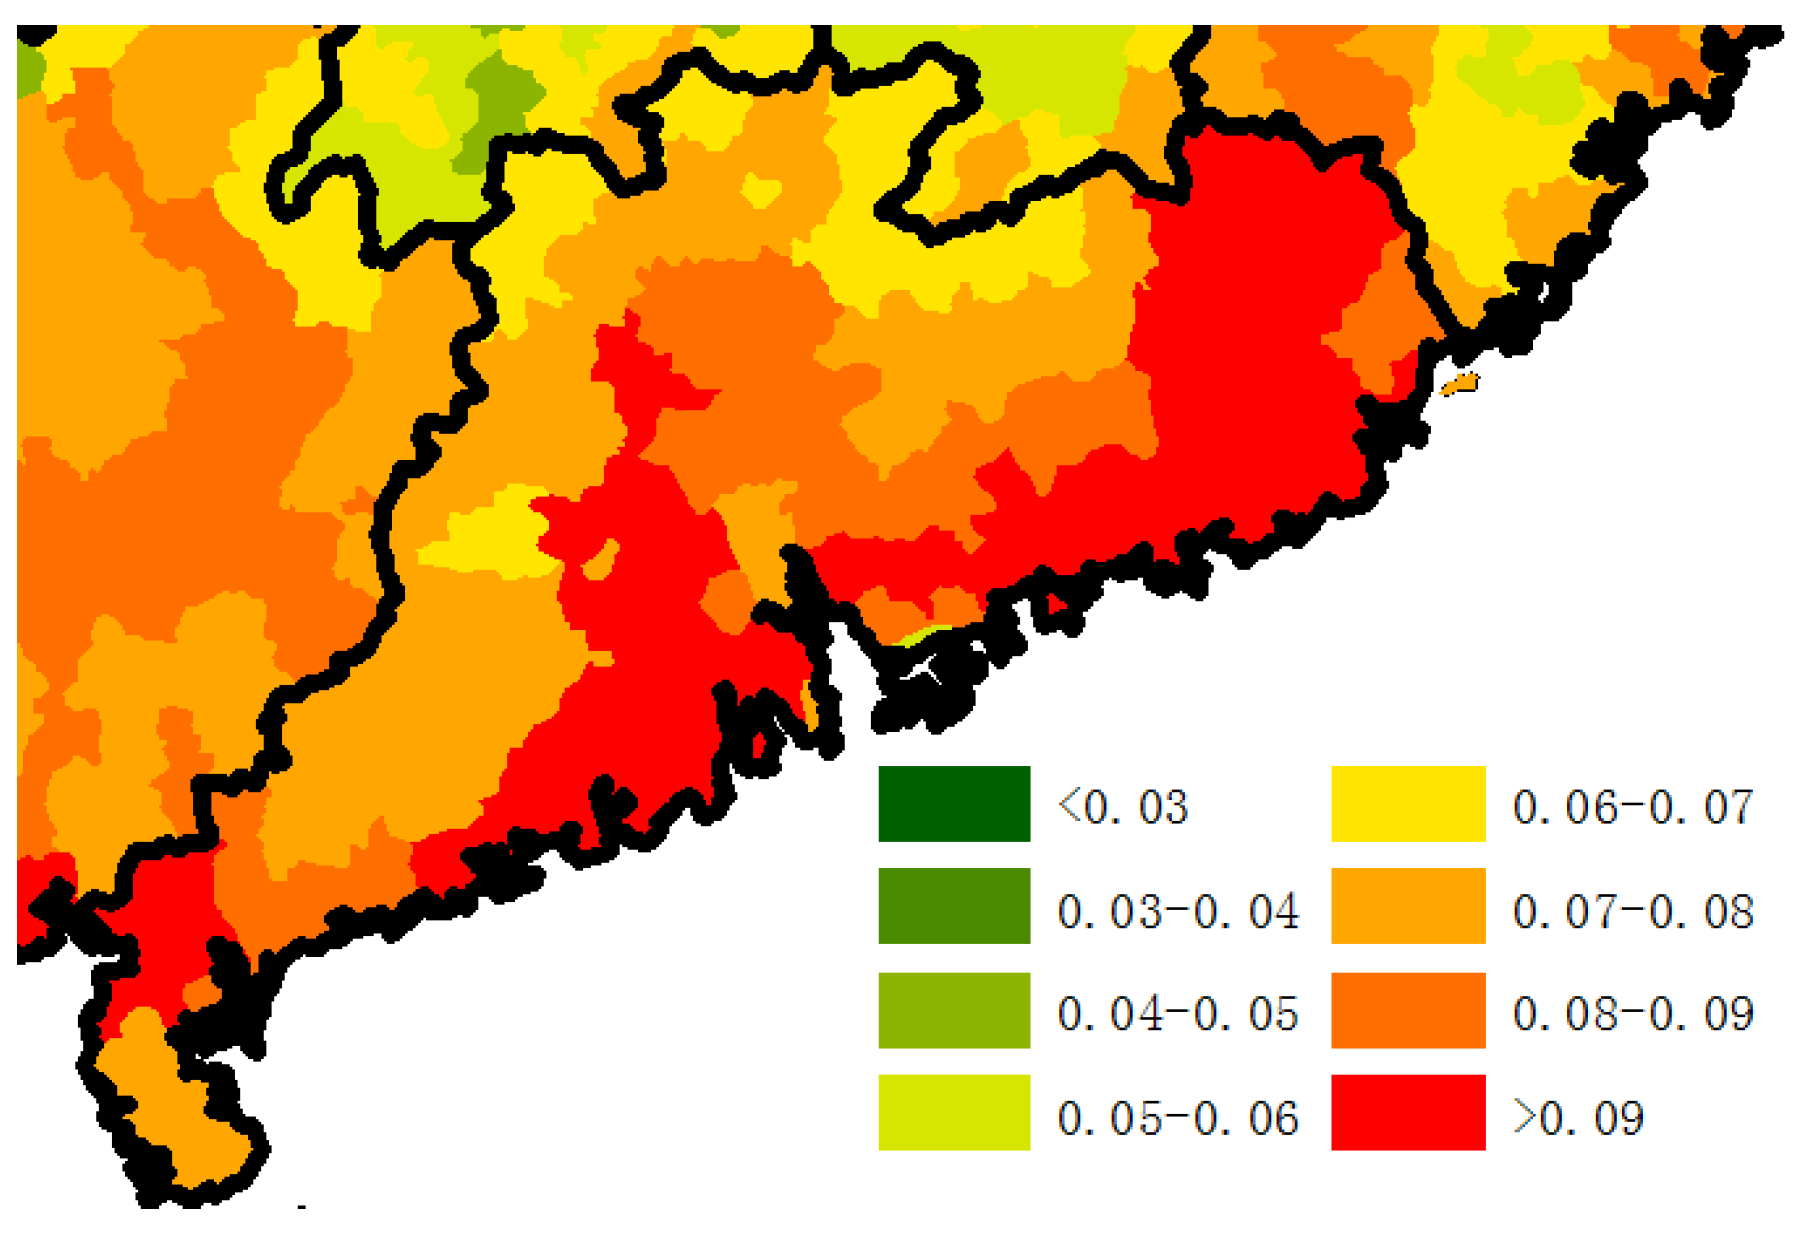
Figure 5.
Average yearly humidity in China.
Figure 5.
Average yearly humidity in China.
Figure 6.
Altitude of each city in China (m).
Figure 6.
Altitude of each city in China (m).
Figure 7.
Total selenium content in soil of each city in China (mg/kg).
Figure 7.
Total selenium content in soil of each city in China (mg/kg).
Figure 8.
Water-soluble selenium content in soil of each city in China (ug/kg).
Figure 8.
Water-soluble selenium content in soil of each city in China (ug/kg).
Figure 9.
Per capita meat production of each city in China in 2016 (kg).
Figure 9.
Per capita meat production of each city in China in 2016 (kg).
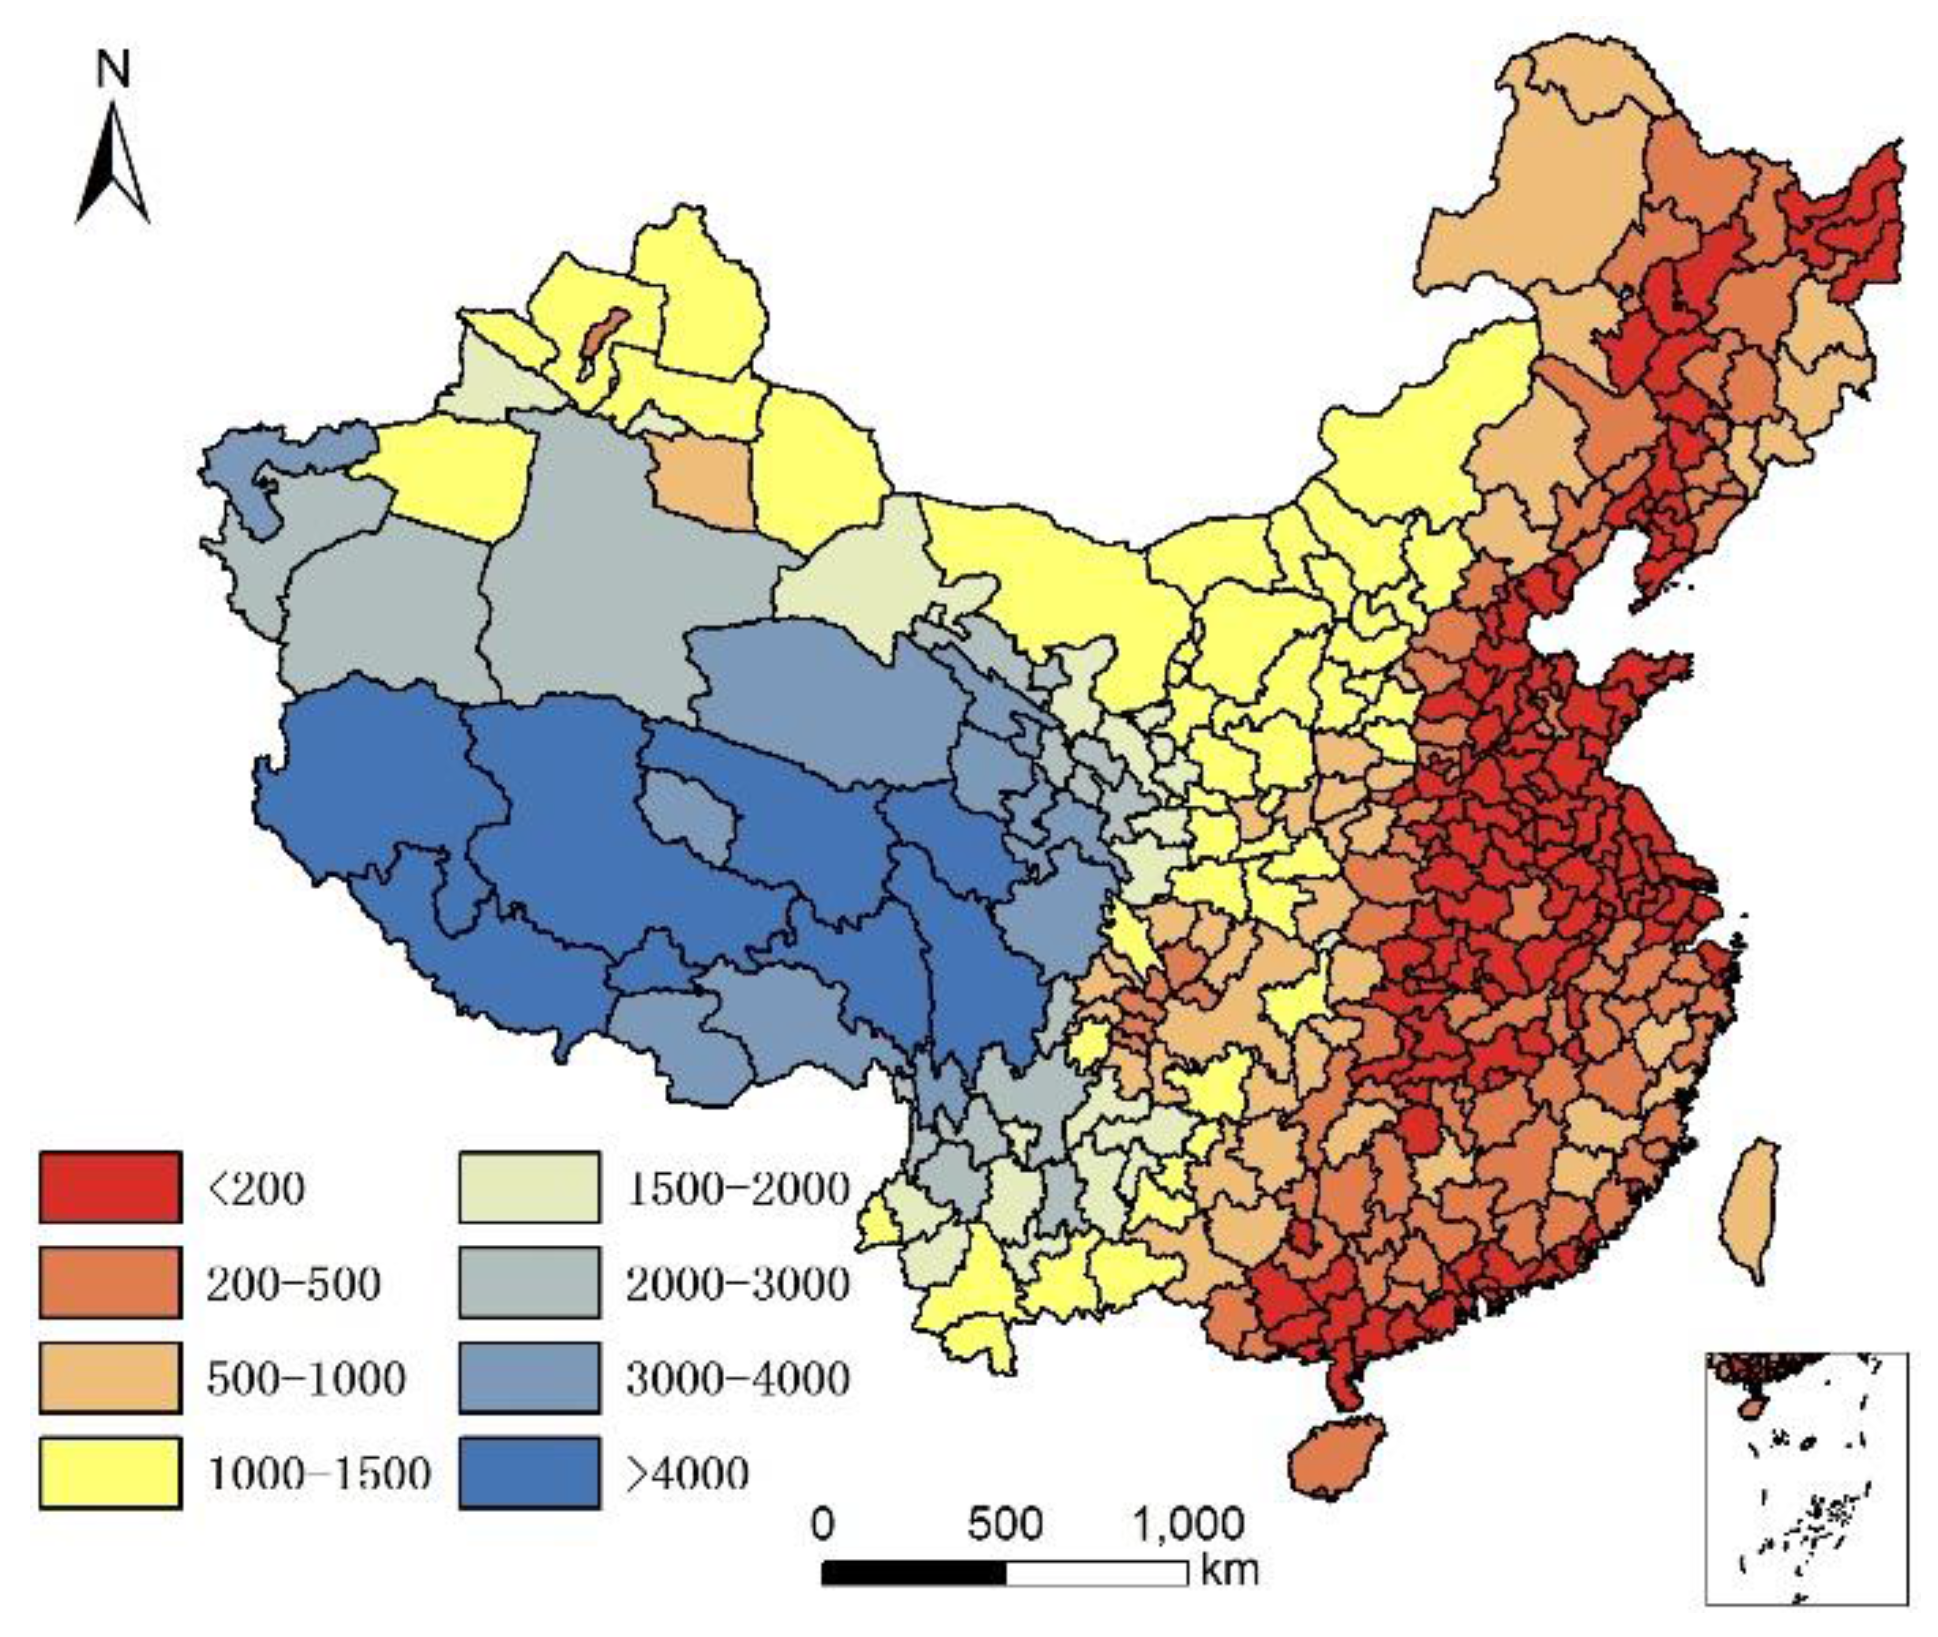
Figure 10.
Per capita freshwater-fish production of each city in China in 2016 (kg).
Figure 10.
Per capita freshwater-fish production of each city in China in 2016 (kg).
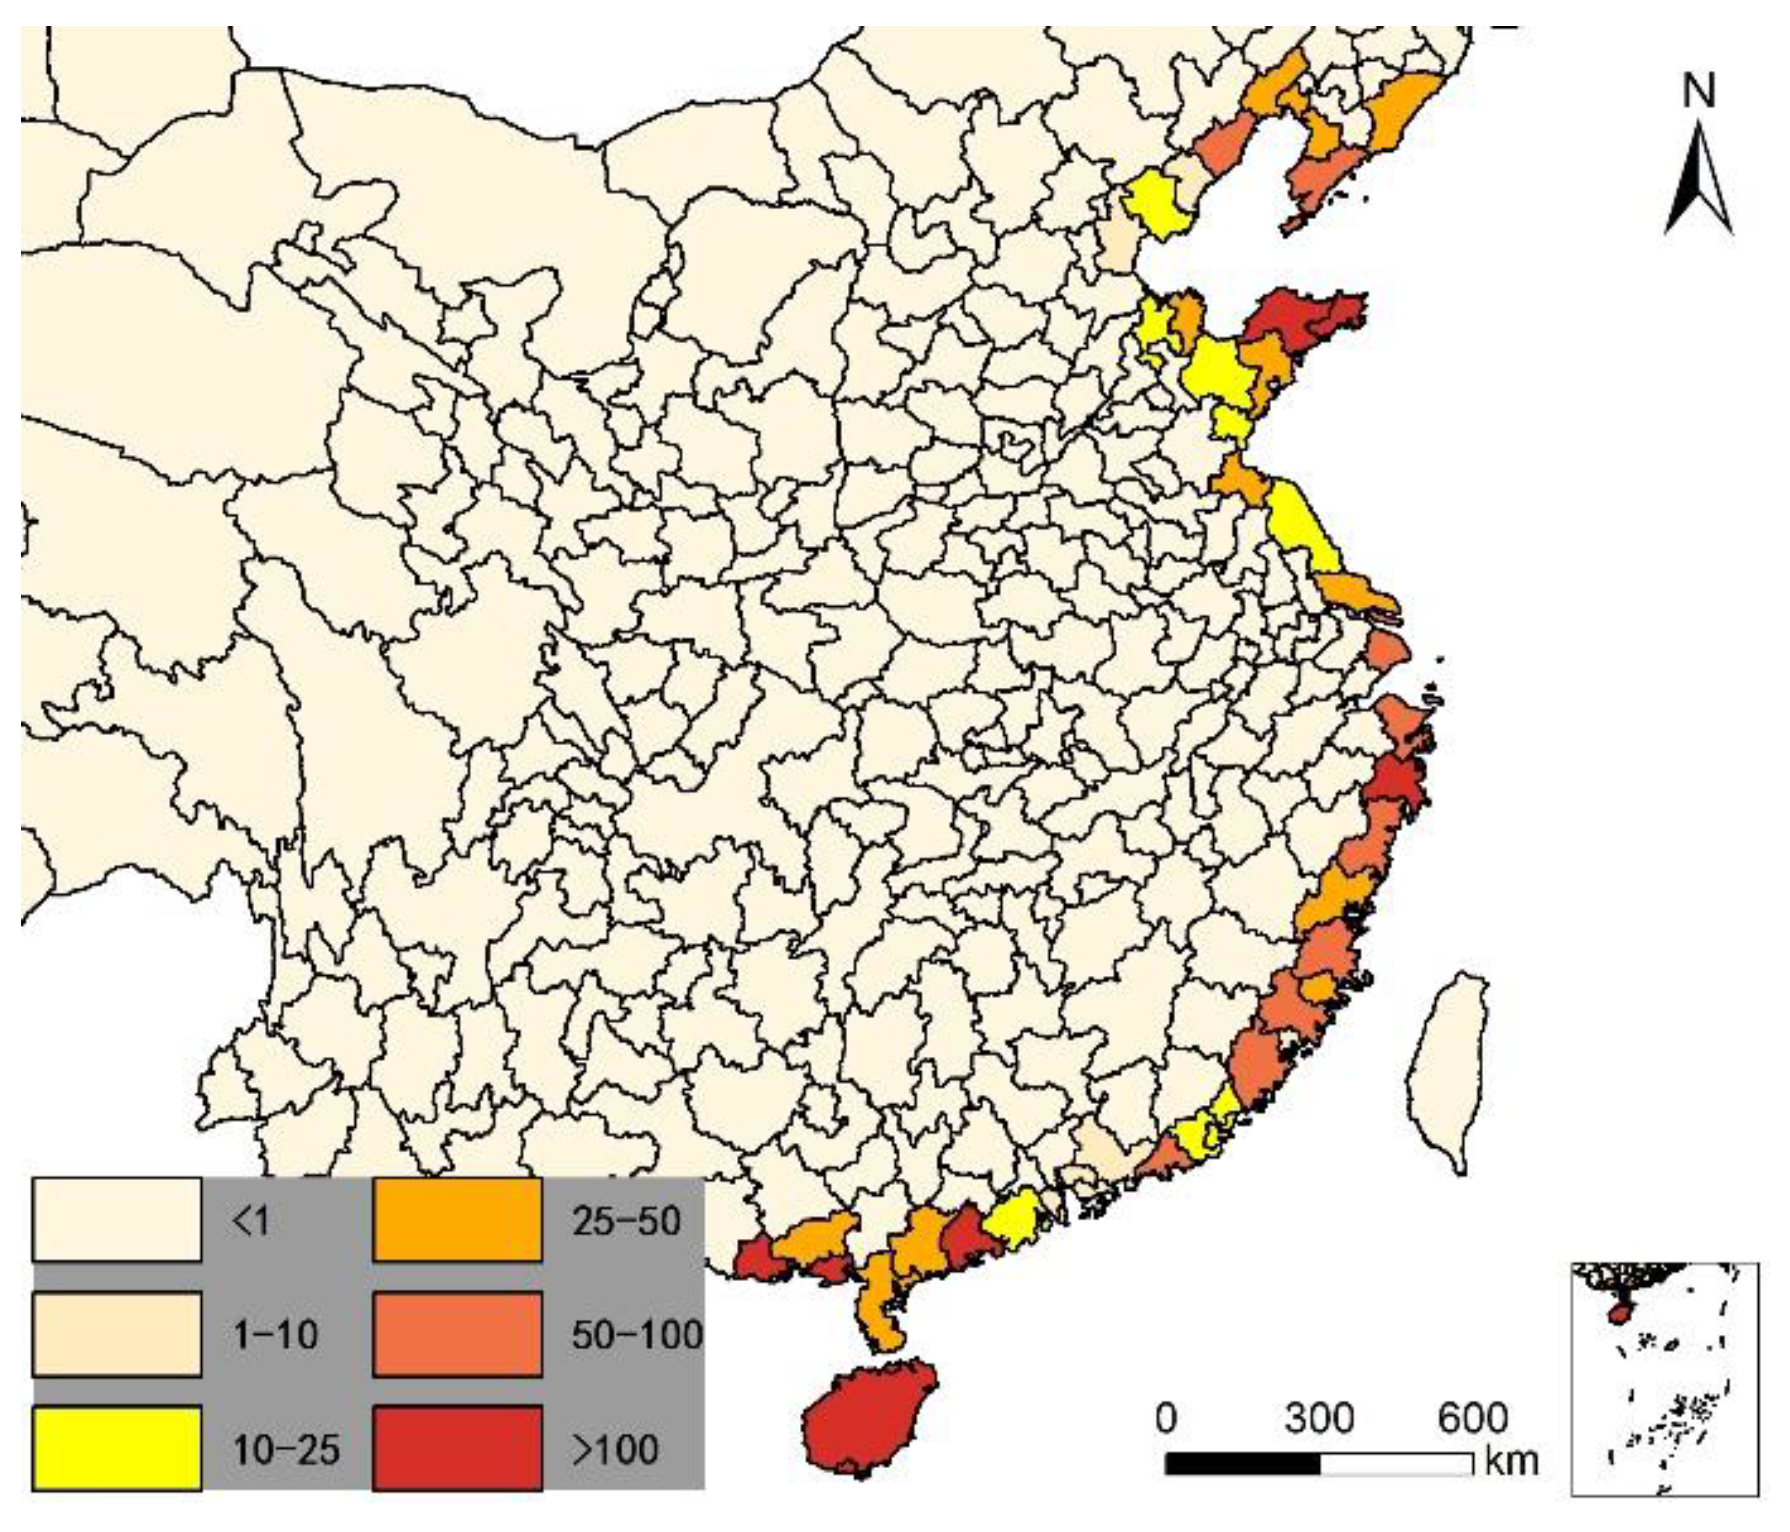
Figure 11.
Per capita sea fishing of each city in China in 2016 (kg).
Figure 11.
Per capita sea fishing of each city in China in 2016 (kg).
Figure 12.
Sea fish diet frequency per month of residents in 139 cities of China (kg).
Figure 12.
Sea fish diet frequency per month of residents in 139 cities of China (kg).
Figure 13.
Simulated Longevity rate (85+/65+) in China with altitude, per capita sea fish consumption and humidity in 2000.
Figure 13.
Simulated Longevity rate (85+/65+) in China with altitude, per capita sea fish consumption and humidity in 2000.
Figure 14.
Simulated Longevity rate (85+/65+) in China with altitude, per capita sea fish consumption and humidity in 2010.
Figure 14.
Simulated Longevity rate (85+/65+) in China with altitude, per capita sea fish consumption and humidity in 2010.
Figure 15.
Relation between real longevity index and simulated longevity index by humidity content in soil, altitude and per capita sea fish consumption in 2000.
Figure 15.
Relation between real longevity index and simulated longevity index by humidity content in soil, altitude and per capita sea fish consumption in 2000.
Figure 16.
Relation between real longevity index and simulated longevity index by humidity content in soil, altitude and per capita sea fish consumption in 2010.
Figure 16.
Relation between real longevity index and simulated longevity index by humidity content in soil, altitude and per capita sea fish consumption in 2010.
Figure 17.
The 85+/65+ ratio of county scale in Guangdong province.
Figure 17.
The 85+/65+ ratio of county scale in Guangdong province.
Figure 18.
Distribution of negative/positive correlation between humidity and longevity.
Figure 18.
Distribution of negative/positive correlation between humidity and longevity.
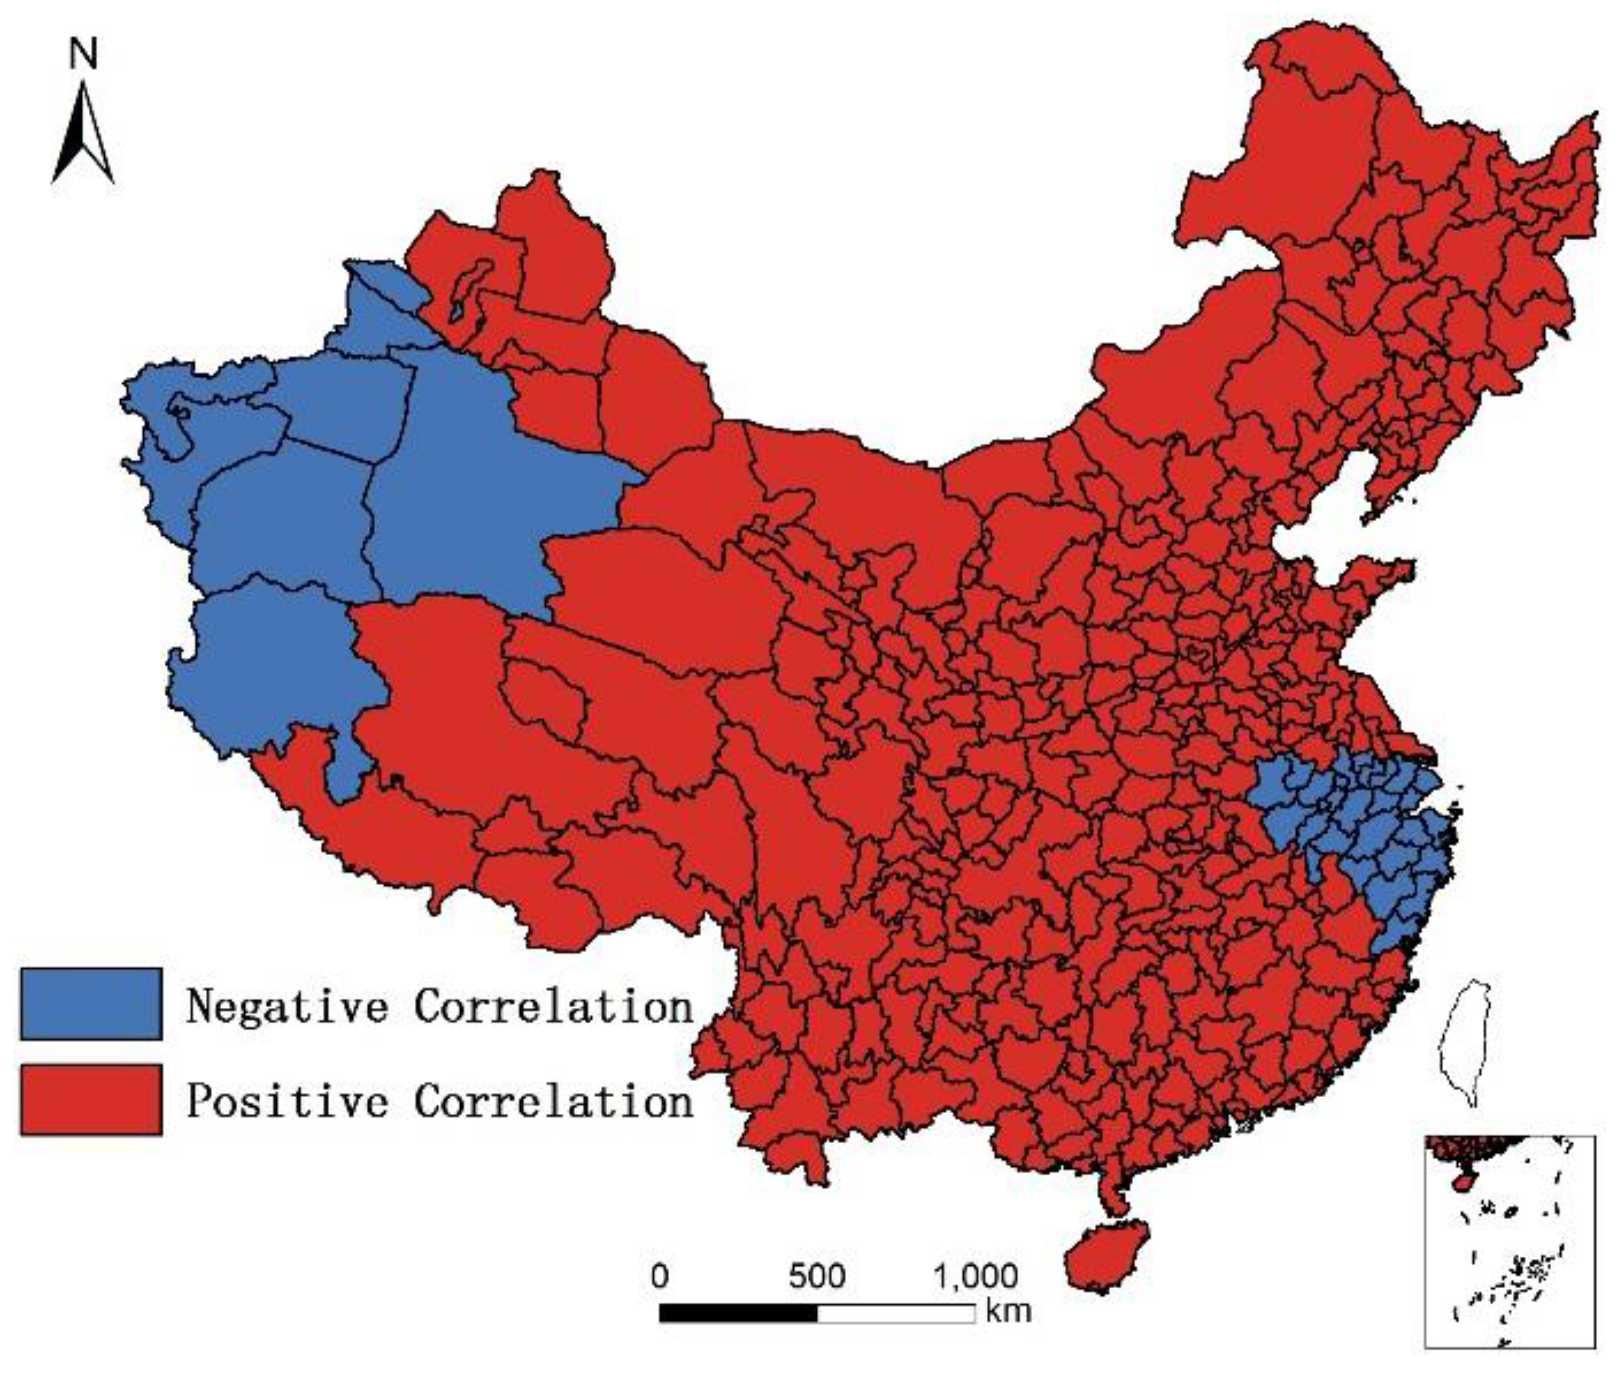
Figure 19.
Distribution of negative/positive correlation between altitude and longevity.
Figure 19.
Distribution of negative/positive correlation between altitude and longevity.
Table 1.
Water food production in China in 1990 and 2015 (104 Ton).
Table 1.
Water food production in China in 1990 and 2015 (104 Ton).
| Year | Seawater Food Fishing | Seawater Food Aquaculture | Freshwater Food Fishing | Freshwater Food Aquaculture |
|---|
| 1990 | 551 | 162 | 79 | 446 |
| 2015 | 1315 | 1876 | 228 | 3062 |
Table 2.
Spearman’s correlation coefficients for longevity ratio and each factor. Total selenium (T-Se); water-soluble selenium (WS-Se).
Table 2.
Spearman’s correlation coefficients for longevity ratio and each factor. Total selenium (T-Se); water-soluble selenium (WS-Se).
| Year | Sea Fish | Humidity Degree | T-Se | Altitude | SD of Temperature | WS-Se | Freshwater Food | Meat |
|---|
| 2000 | 0.575 ** | 0.468 ** | 0.505 ** | −0.338 ** | −0.502 ** | 0.401 ** | 0.123 * | −0.105 * |
| 2010 | 0.551 ** | 0.535 ** | 0.466 ** | −0.461** | −0.442 ** | 0.303 ** | 0.205 ** | −0.129 * |
Table 3.
Linear regression coefficient of each factor with longevity in regression analysis.
Table 3.
Linear regression coefficient of each factor with longevity in regression analysis.
| Year | Sea Fish | Humidity Degree | T-Se | Altitude | SD of Temperature | WS-Se | Freshwater Food | Meat |
|---|
| 2000 | 0.331 ** | 0.219 ** | 0.255 ** | 0.114 ** | 0.252 ** | 0.161 ** | 0.015 * | 0.011 |
| 2010 | 0.304 ** | 0.287 ** | 0.217 ** | 0.212 ** | 0.195 ** | 0.092 ** | 0.042 ** | 0.017 * |
Table 4.
Regression coefficient, standard error, t-value and probability of the estimated parameters in longevity model by the stepwise multiple linear regression (MLR) analysis in 2000.
Table 4.
Regression coefficient, standard error, t-value and probability of the estimated parameters in longevity model by the stepwise multiple linear regression (MLR) analysis in 2000.
| Parameter | Standard Coefficient | Standard Error | T Value | p Level |
|---|
| Intercept | | 0.002 | 30.594 | 0.000 ** |
| SD of temperature | −0.445 | 0.000 | −10.986 | 0.000 ** |
| Altitude | −0.310 | 0.000 | −7.719 | 0.000 ** |
| Sea fish consumption | 0.360 | 0.000 | 8.662 | 0.000 ** |
Table 5.
Regression coefficient, standard error, t-value and probability of the estimated parameters in longevity model by the stepwise MLR analysis in 2010.
Table 5.
Regression coefficient, standard error, t-value and probability of the estimated parameters in longevity model by the stepwise MLR analysis in 2010.
| Parameter | Standard Coefficient | Standard Error | T Value | p Level |
|---|
| Intercept | | 0.003 | 33.157 | 0.000 ** |
| SD of temperature | −0.404 | 0.000 | −10.136 | 0.000 ** |
| Altitude | −0.429 | 0.000 | −10.874 | 0.000 ** |
| Sea fish consumption | 0.302 | 0.000 | 7.338 | 0.000 ** |
Table 6.
Regression coefficient of the top four groups with highest R2 (Regression coefficient) of geographically weighted regression (GWR) in 2000.
Table 6.
Regression coefficient of the top four groups with highest R2 (Regression coefficient) of geographically weighted regression (GWR) in 2000.
| Group | R2 | Group | R2 |
|---|
| Humidity, altitude, sea fish | 0.664 ** | WS-Se, altitude, sea fish | 0.641 ** |
| SD of temperature, altitude, sea fish | 0.623 ** | SD of temperature, humidity, sea fish | 0.619 ** |
Table 7.
Regression coefficient of the top four groups with highest R2 of GWR in 2010.
Table 7.
Regression coefficient of the top four groups with highest R2 of GWR in 2010.
| Group | R2 | Group | R2 |
|---|
| Humidity, altitude, sea fish | 0.681 ** | WS-Se, altitude, sea fish | 0.659 ** |
| T-Se, altitude, sea fish | 0.639 ** | SD of temperature, altitude, sea fish | 0.628 ** |


