Abstract
Brown algae comprise up to 2000 species with wide dissemination in temperate zones. A comprehensive untargeted metabolic profiling guided by molecular networking of three uninvestigated Red-Sea-derived brown algae, namely Sirophysalis trinodis, Polycladia myrica, and Turbinaria triquetra, led to the identification of over 115 metabolites categorized as glycerolipids, fatty acids, sterol lipids, sphingolipids, and phospholipids. The three algae exhibited low-to-moderate antioxidant capacity using DPPH and ABTS assays. Preliminary in vitro antiproliferative studies showed that the algal extracts displayed high cytotoxic activity against a panel of cancer cell lines. The most potent activity was recorded against MCF-7 with IC50 values of 51.37 ± 1.19, 63.44 ± 1.13, and 59.70 ± 1.22 µg/mL for S. trinodis, P. myrica, and T. triquetra, respectively. The cytotoxicity of the algae was selective to MCF-7 without showing notable effects on the proliferation of normal human WISH cells. Morphological studies revealed that the algae caused cell shrinkage, increased cellular debris, triggered detachment, cell rounding, and cytoplasmic condensation in MCF-7 cancer cells. Mechanistic investigations using flow cytometry, qPCR, and Western blot showed that the algae induced apoptosis, initiated cell cycle arrest in the sub-G0/G1 phase, and inhibited the proliferation of cancer cells via increasing mRNA and protein expression of p53, while reducing the expression of PI3K, Akt, and mTOR.
1. Introduction
Nature has long been established as the cornerstone of traditional medicine, which continuously provides humanity with a plethora of metabolites with therapeutic potential against a wide spectrum of diseases [1,2]. Owing to the overconsumption of terrestrial plants, their relative depletion, and the threat of extinction of multiple species, elevated attention has recently been directed to marine natural products as a unique prolific mine of potential drug leads [3]. Constituting more than 70% of the earth’s surface, oceans and seas produce a great diversity of more than 300,000 living species, with chlorophyll-containing algae constituting more than 20,000 species [4].
Marine algae, as a copious source of minerals, vitamins, fibers, amino acids, polysaccharides, and polyunsaturated fatty acids, are globally consumed for their nutritional importance as food supplements and as sources of high-valued oils [5]. Their environmental applications are diverse and include heavy metal sequestering, water treatment, coloring agents, food additives, and preparation of hydrocolloids [6]. Miscellaneous secondary metabolites were isolated from algae, which exhibited propitious bioactivities including antimicrobial, anti-inflammatory, cytotoxic, antioxidant, anticoagulant, and antifungal effects [7,8,9]. Several algal-driven constituents were patented and marketed for nutritional and medicinal uses [10]. The diversity and pharmacological benefits of marine algae were our motive for in-depth mining for algal species, especially from the Red Sea, with its unique geography between Africa and Asia. The Red Sea is regarded as a valuable reservoir for a wide and unexplored marine ecosystem [11].
Brown algae (Phaeophyta) are characterized by the domination of fucoxanthin, a brown xanthophyll pigment imparting them with their color, and constitute a significant proportion of the Red Sea marine ecosystem [12]. Brown algae comprise a complex mixture of marine organisms extending from microscopic filamentous thallus to complex macroalgae. Phlorotannins, fucoxanthins, lanimarins, alginates, fatty acids, prostaglandins, sterols, and fucoidans are among the major secondary metabolites characterized by the different species of brown algae and they are probably responsible for their reported biological activities [13]. Despite comprising more than 2000 species [11], only a few of these brown algae were extensively studied for their chemical and biological properties.
Cancer poses a significant socioeconomic burden and a critical public health issue, especially in developing nations [14]. It is currently considered as the 3rd leading cause of mortality with more than 17 million cancer-related deaths, and over 26 million new cases are estimated to emerge by 2030 [15]. Conventional measures of treatment such as surgery, radiation, and chemotherapy are usually associated with dramatic side effects, raising an urge for alternative medicines with better safety profiles [16]. The PI3K/Akt/mTOR signaling axis, defined by phosphatidylinositol-3 kinase (PI3K), protein kinase B (Akt), and mechanistic target of rapamycin (mTOR), is a complex pathway with several upstream regulators and downstream effectors that play a key role in cancer pathology [17]. The PI3K/Akt/mTOR signaling axis is involved in a wide variety of cellular biological activities including cell growth, metastasis, survival, and metabolism. Inhibitors targeting important kinases of the PI3K/Akt/mTOR pathway have received increased interest from the scientific community [18].
The three brown algae, Turbinaria triquetra, Sirophysalis trinodis, and Polycladia myrica, are abundant species in the Red Sea and they belong to the Family Sargassaceae. P. myrica, also spreads along the Mediterranean Sea, the Pacific, and Indian Oceans [19]. Previous studies reported in vivo antidiabetic activities of the crude methanol extracts of S. trinodis and P. myrica, where the α-glucosidase inhibition IC50 values were 0.33, 3.50, and 3.31 μg/mL for T. triquetra, S. trinodis, and P. myrica, respectively, compared with 160.15 μg/mL for the standard acarbose. Additionally, S. trinodis reduced the postprandial blood glucose levels in diabetic rats [20]. Antioxidant and antibacterial effects were reported for the extracts of T. triquetra and P. myrica. The methanol extract of T. Triquetra and the petroleum ether extract of P. myrica were more active against Gram-negative bacteria with MIC values ranging from 0.5 to 2 µg/mL [19,21,22]. P. myrica displayed protective effects against UV-radiation, where a 5% formulated cream of P. myrica displayed a protective factor of 31.79 ± 4.73 [23]; however, nothing was detected in the literature concerning the cytotoxic potential of the selected brown algal species. Therefore, in the current study, the chemical metabolome of the crude extracts of T. triquetra, S. trinodis, and P. myrica was traced using untargeted HR-MS/MS profiling guided by GNPS molecular networking. Their antioxidant activities were studied using DPPH and ABTS assays. Preliminary cytotoxic studies were performed on several cancer cell lines, supported by extensive mechanistic investigations of their anti-proliferative effect using flow cytometry, qPCR, and Western blot analysis.
2. Results and Discussion
2.1. Untargeted Metabolome Analysis
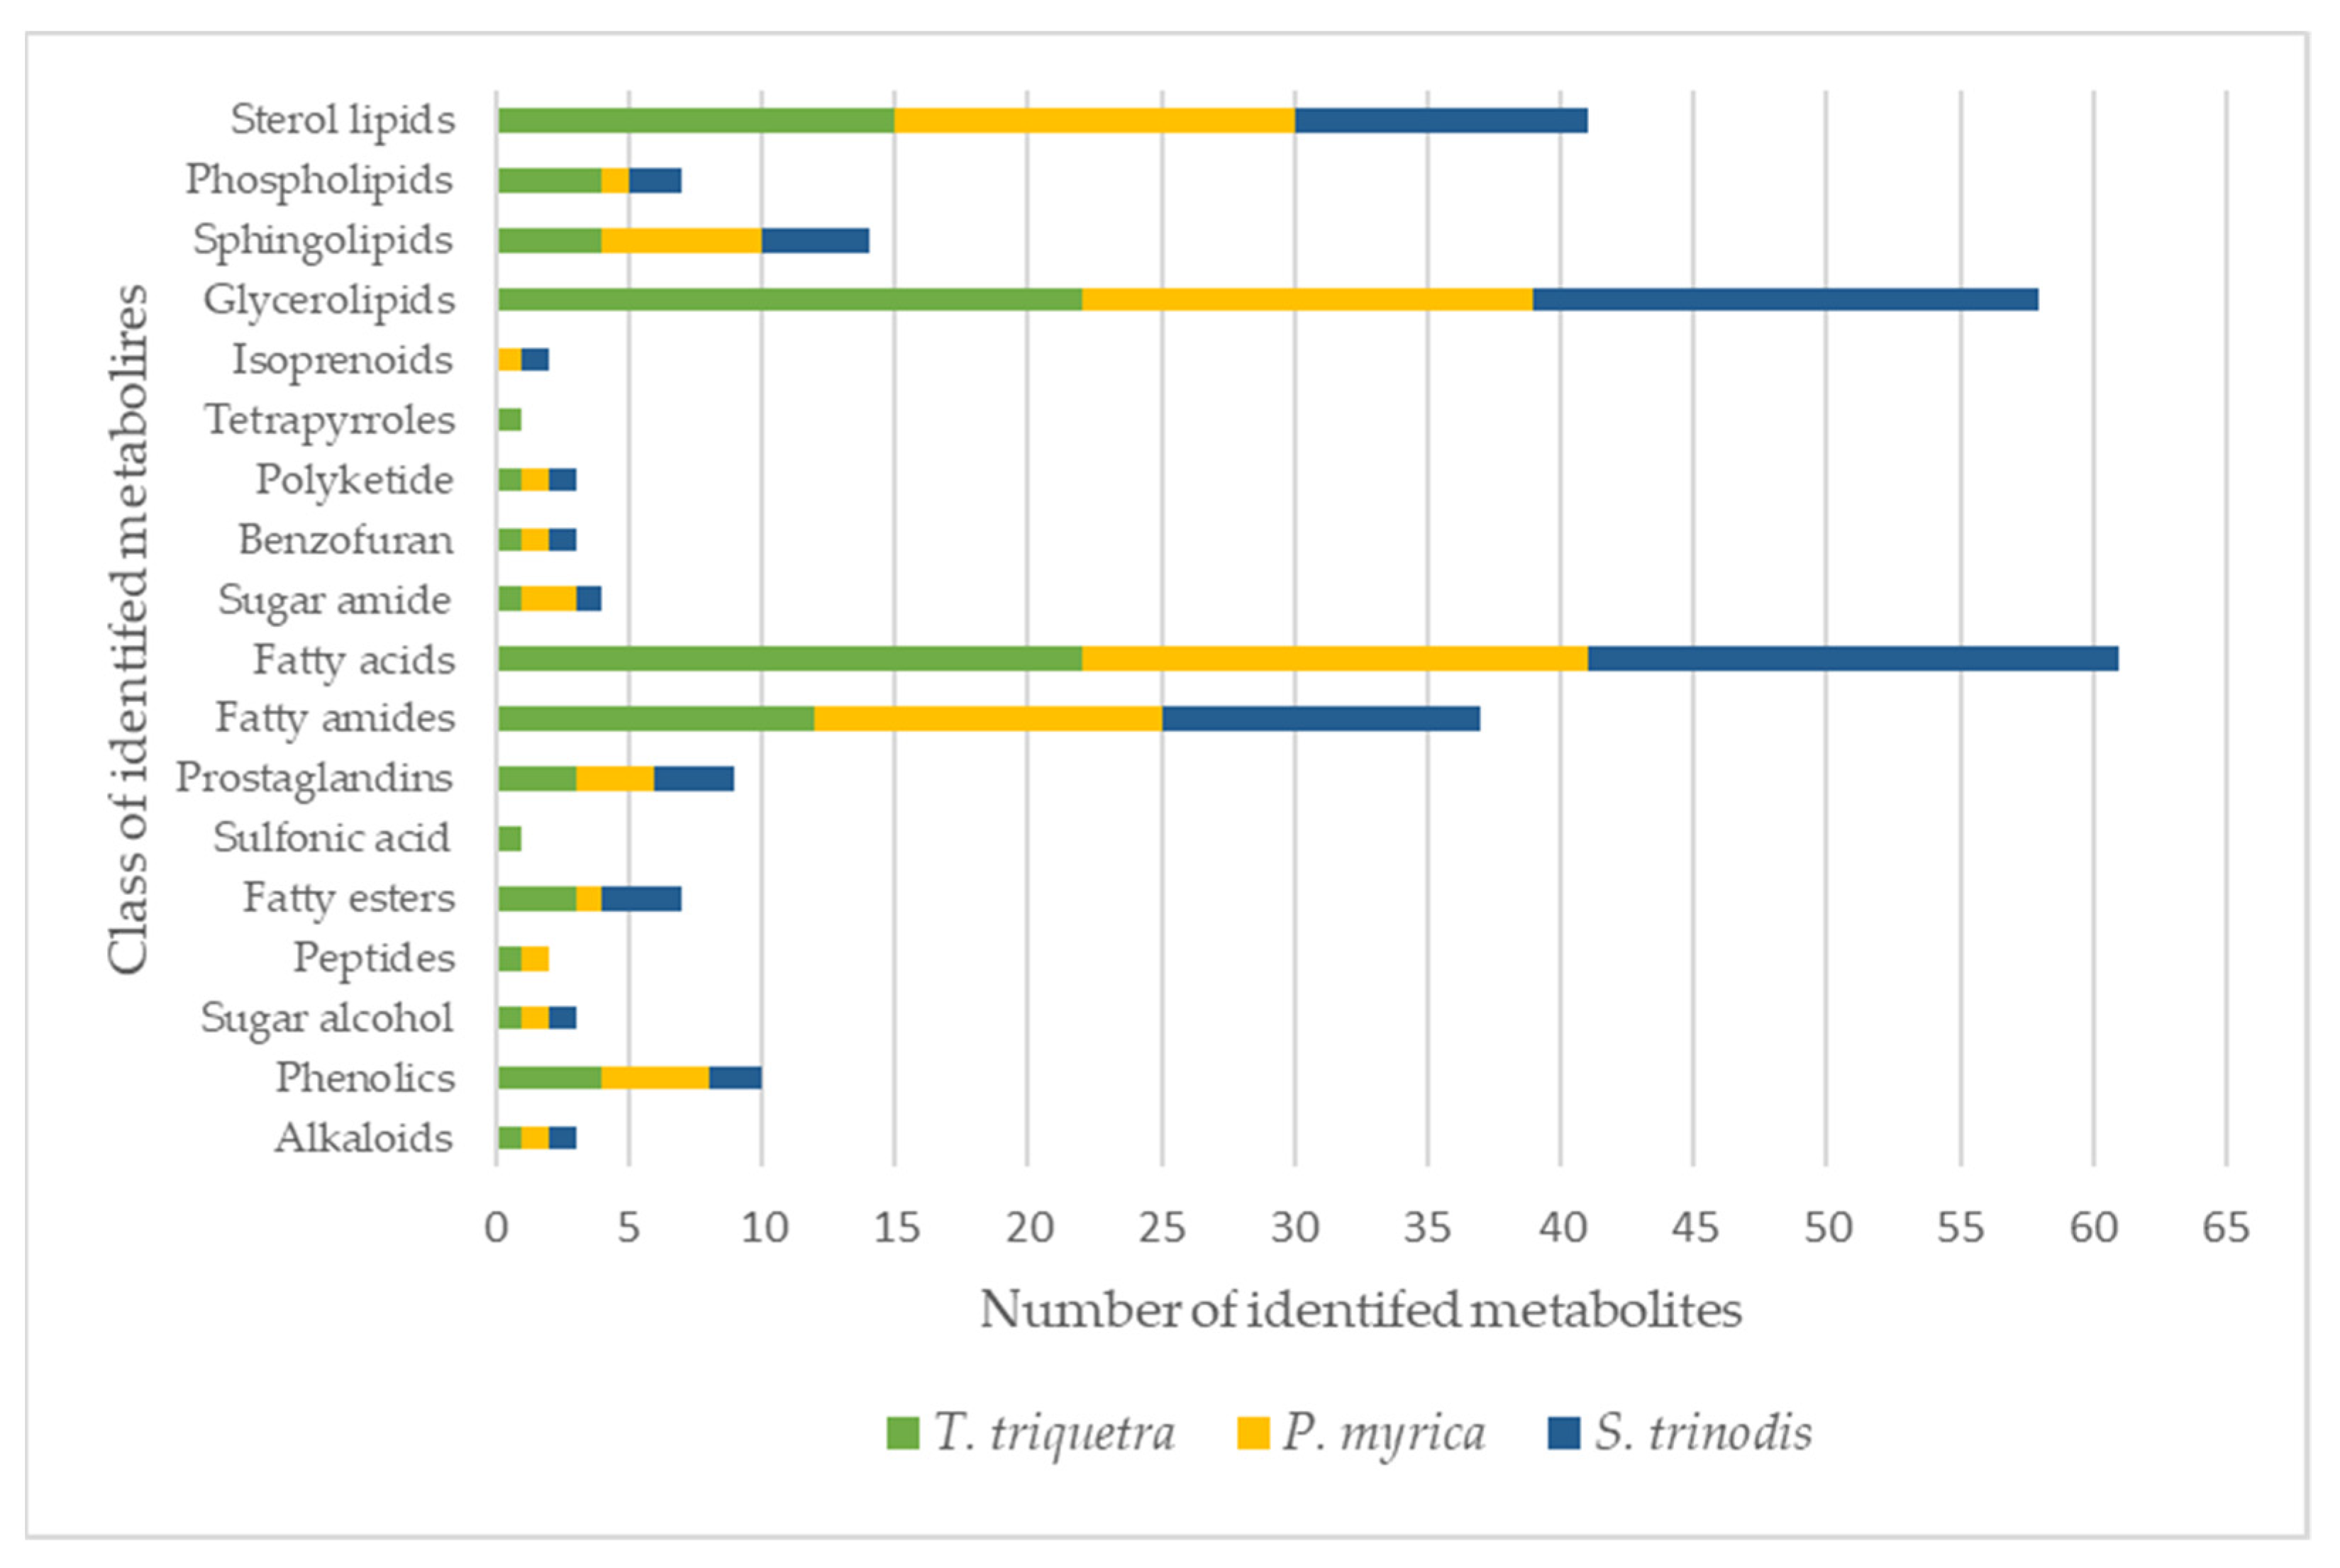
Detailed metabolomic analysis of the crude extracts of the three Red Sea algal samples measured in the positive and negative ion modes (for chromatograms see Figures S7–S9) resulted in the annotation of over 115 metabolites (with mass errors less than 5 ppm), including 25 fatty acids and their hydroxylated derivatives, 27 glycerolipids, 17 sterol lipids, 15 fatty amides, 6 sphingolipids, and 4 phospholipids (Table 1 and Figure 1). The current study is the first report elucidating the chemical metabolic profile of three Red-Sea-derived brown algae viz, Turbinaria triquetra, Sirophysalis trinodis, and Polycladia myrica using untargeted liquid chromatography-high-resolution mass spectrometry (LC-HRMS).

Table 1.
Annotated metabolites in the methanol extracts of the three Red Sea brown algae; namely, Sirophysalis (Cystoseira) trinodis, Turbinaria triquetra, and Polycladia myrica using LC/ MSD iQ analysis in positive and negative modes.
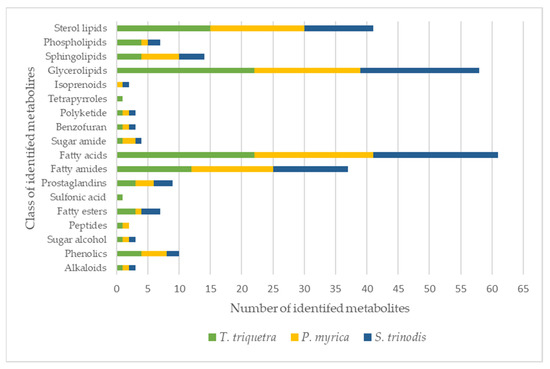
Figure 1.
Classes of metabolites identified in the three Red Sea algal species. The colors in each bar represent the total number of metabolites per algae.
2.1.1. Glyceroglycolipids
Glyceroglycolipids represented the major class of metabolites identified in the studied algae species with a total number of 27 compounds identified in the three species. Glyceroglycolipids, with their glycerol backbone attached to one or more glycosyl moieties and different acyl groups, are known to be highly abundant in marine algae and are responsible for a wide array of biological activities [24,25]. Monoacyl glycerol was detected either free or in conjugation with monogalactose (MGMG at tR 14.3, 14.5, 16.0, 16.5, and 21.0 min), digalactose (DGMG at tR 12.4 and 15.0 min), trimethyl homoserine (at tR 13.1, 14.3, and 14.8 min), glucuronic acid (tR at 15.9, 17.8, 18.4, 21.4, and 22.9 min), palmitoyl galactosyl, or sulfoquinovosyl moiety (SQMG at tR 14.06, 14.3, 15.04, 16.9, and 17.3 min). On the other hand, free diacylglycerol was not freely detected but only conjugated with glucuronic acid (DGGA at tR 15.3 min), monogalactose, or carboxyhydroxymethylcholine moieties. The relative distribution of the different glycerolipids [(i.e., monogalactosyldiacylglycerol (MGDG), digalactosyl-diacylglycerol (DGDG), and sulfoquinovosyl-diacylglycerol (SQDG)] were close to that observed in a previous study performed on a collection of brown algae from the Black Sea with ranges of MGDG, DGDG, and SQDG estimated as 26.8–46.5%, 19.6–44.1%, and 17.5–51.7%, respectively [26]. It is worth mentioning that the highest number of glycerolipids was detected in T. triquetra with a total of 22 vs. 19 and 17 in S. trinodis and P. myrica, respectively.
2.1.2. Fatty Acids and Hydroxy Fatty Acids
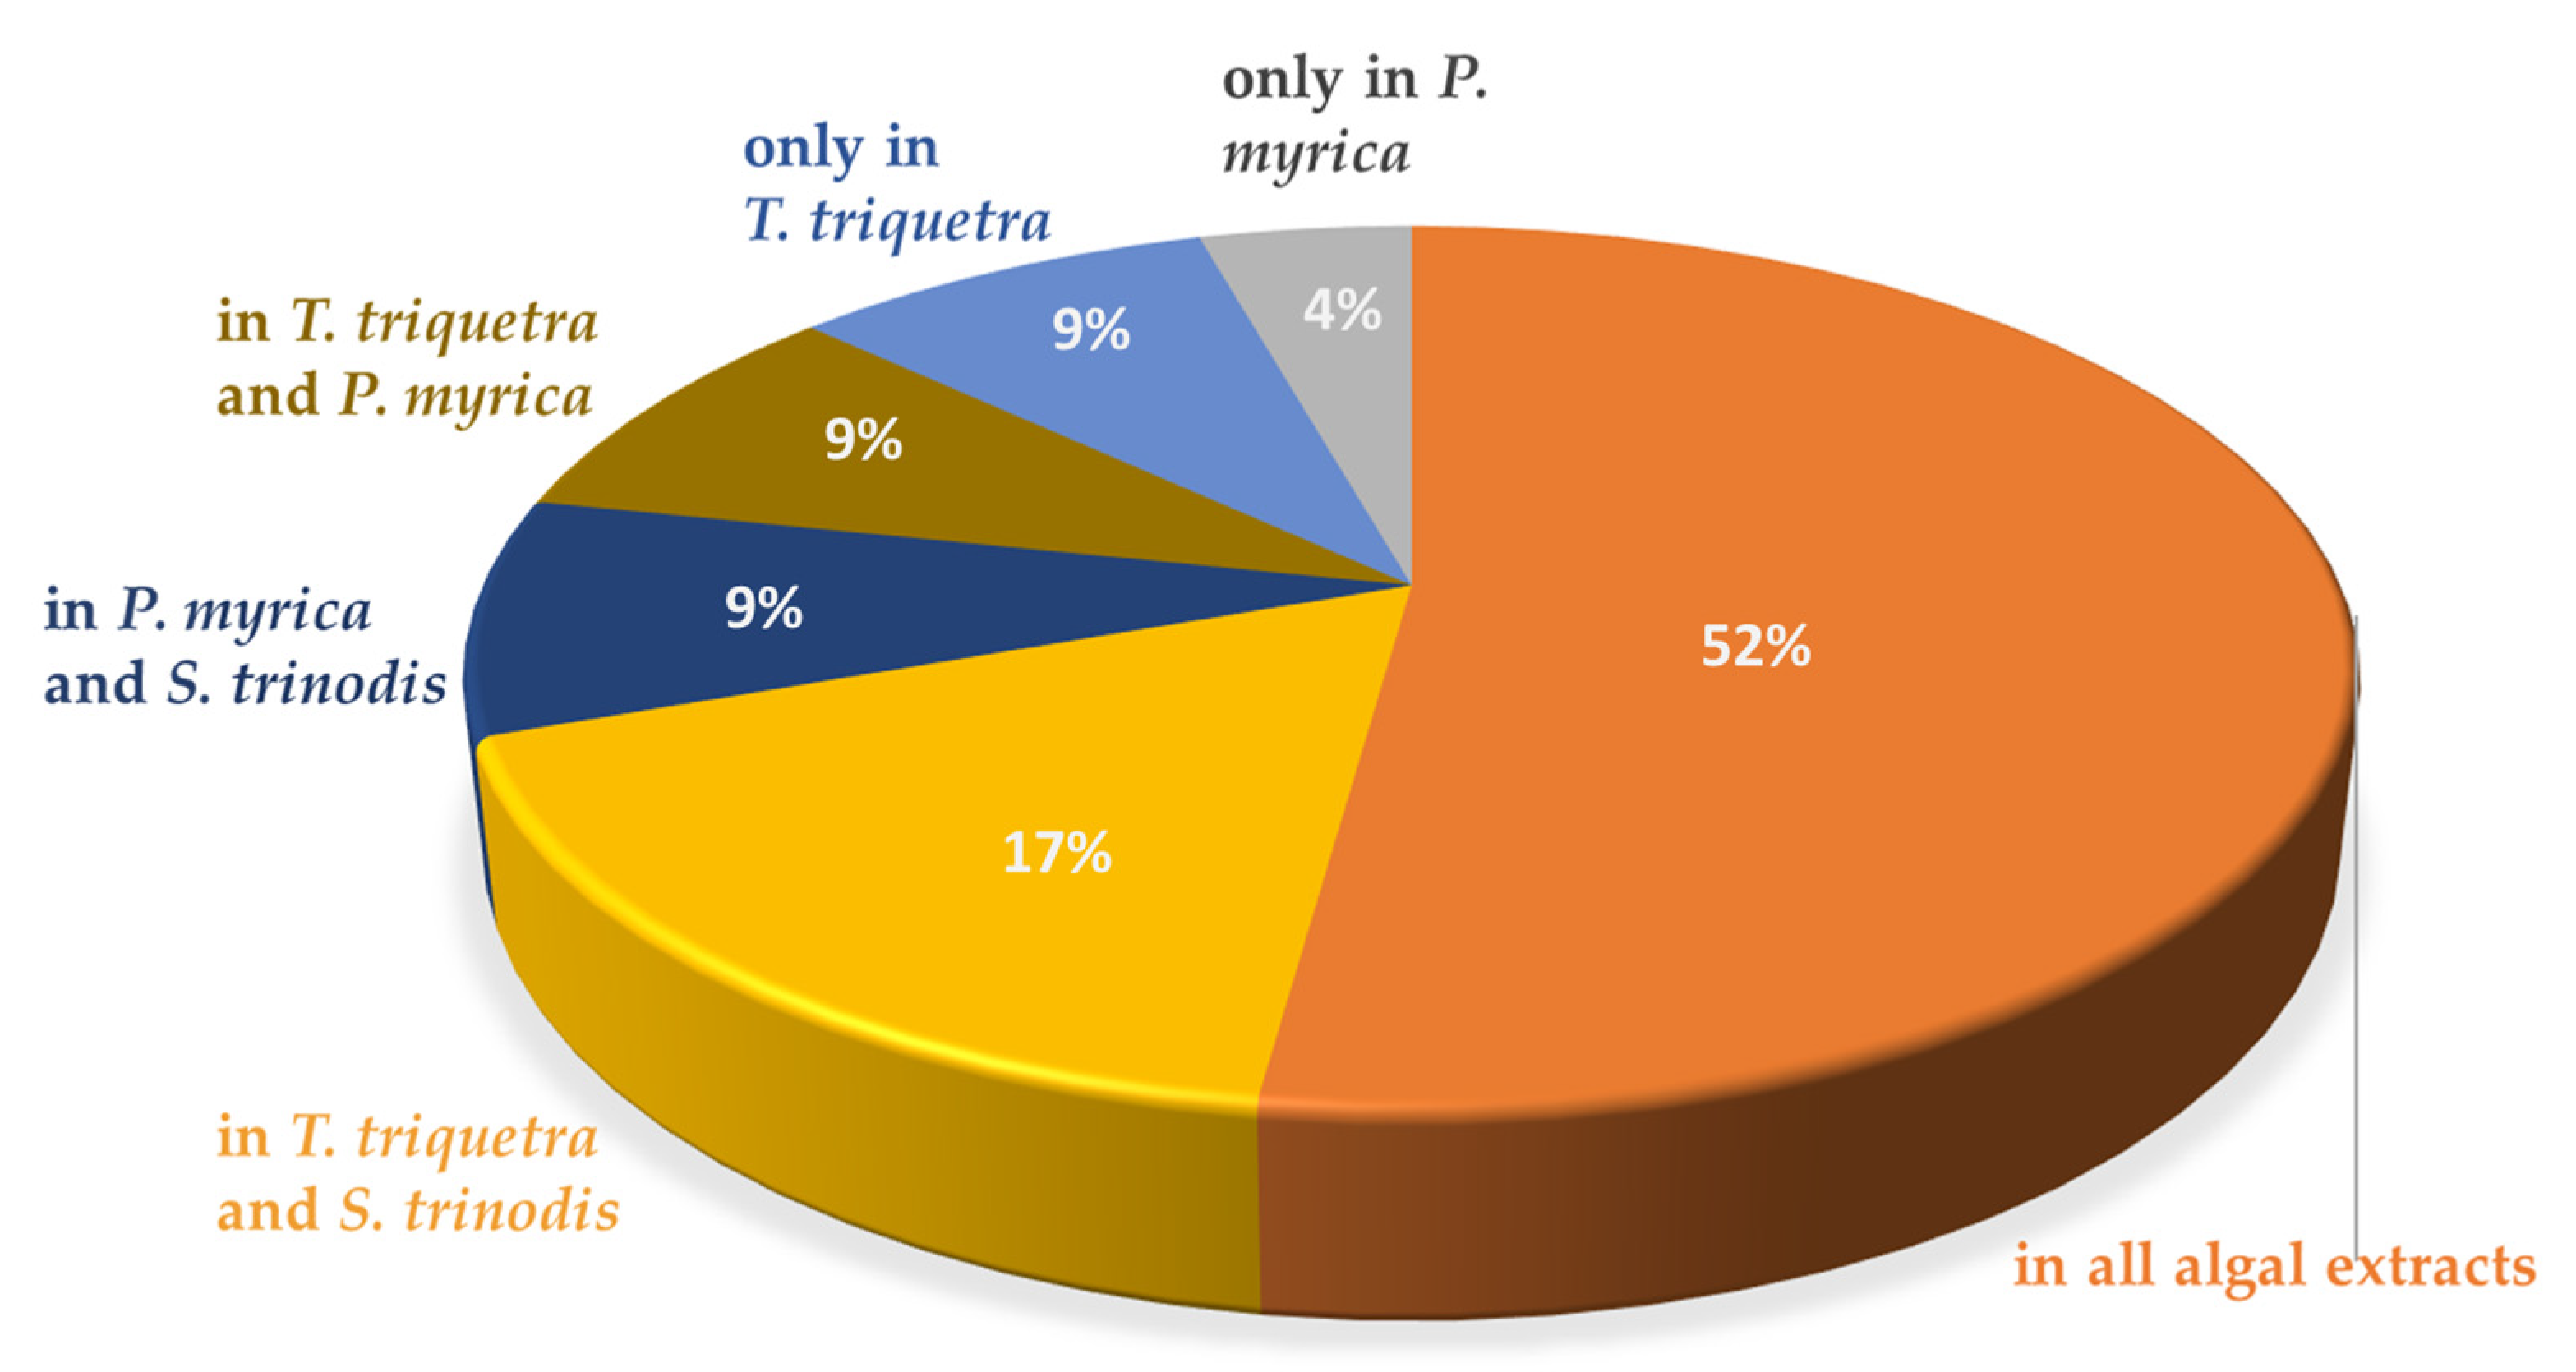
HR-LCMS analysis revealed the predominance of fatty acids and their hydroxides in the three algal extracts with chain lengths ranging between C9 and C29. A total of 25 fatty acids were detected, constituting ca. 21% of the identified chemical constituents. The highest number of fatty acids are present in T. triquetra with a total of 22 vs. 20 for S. trinodis and 19 for P. myrica. Unsaturated fatty acids were more prominent in the three algae, whereas hydroxyeicosanoic acid was the only saturated fatty acid identified in T. triquetra and P. myrica. Twelve fatty acids were common in the three algae (but with different concentrations; see Table 1) including trihydroxyoctadecadienoic acid (TriHODE), trihydroxyoctadecenoic acid (TriHOME), hydroxyoctadecenoic acid, hydroxyoctadecadienoic acid (HODE), hydroxyoctadecatrienoic acid, dihydroxyhexadecenoic acid, undecanedioic acid, undecatrienoic acid, eicosapentaenoic acid, hydroxyeicosapentaenoic acid, hydroxyeicosatetraenoic acid, hydroxyeicosadienoic acid, and dihydroxyeicosatetraenoic acid, representing ca. 23% of the total identified fatty acids. Azelaic acid, octadecatrienoic acid, hydroxynonacosahexaenoic acid, and hydroxyoctadecatetraenoic acid were only observed in T. triquetra and S. trinodis, while dodecanedioic acid and hydroxydioxoheptadecenoic acid were solely detected in P. myrica and S. trinodis. Octadecenoic acid and hydroxyeicosanoic acid were only identified in T. triquetra and P. myrica. It is worth mentioning that the two fatty acids dihydroxyoctadecatrienoic acid and hydroxynonacosaheptaenoic acid could be used as markers for discriminating T. triquetra from the other two species. Dihydroxyoctadecenoic acid was solely detected in P. myrica. Figure 2 illustrates the distribution of identified fatty acids as a percentage in each algal extract.
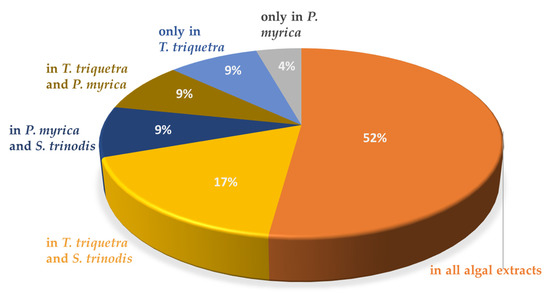
Figure 2.
Distribution of fatty acids in the Red Sea algal extracts.
Unsaturated fatty acids were more prominent in the three algae extracts, with hydroxyeicosanoic acid representing the only saturated fatty acid identified in both T. triquetra and P. myrica extracts. The results were in agreement with a previous study reporting the richness of S. trinodis collected from the Persian Gulf, with polyunsaturated fatty acids being primarily oleic acid and arachidonic acid [27]. Another study performed on P. indica and T. ornata macroalgae collected from the Red Sea shore in Egypt reported that oleic acid was the major unsaturated fatty acid in both brown seaweeds [28]. On the other hand, a study on S. trinodis and P. myrica from the Persian Gulf reported the presence of saturated fatty acids including myristic, palmitic, stearic, and arachidic acids, where the total saturated fatty acids constituted 41% and 45% of the estimated fatty acid composition in S. trinodis and P. myrica, respectively [29].
2.1.3. Sterol Lipids
Sterol lipids constituted the third major class of the identified constituents after glycerolipids and fatty acids with a total of 17 identified compounds. Sterols could be free or conjugated with glycine, hexose, or sulfate. Most identified sterols were free, having different degrees of saturation and oxygenation. Four of the unconjugated sterols were saturated (at tR 15.7, 15.8, 19.6, and 21.9 min) and present in the three algae. The remaining five sterols were unsaturated (at tR 18.2, 19.0, 20.2, 22.6, and 22.8 min), three of which were observed only in T. triquetra and P. myrica. Two sterols were conjugated with glycine (tR 6.8 and 17.8 min), one was conjugated with sulfate (tR 14.5 min), and two were conjugated with hexose (tR 15.5 and 20.2 min). There were three other sterols (tR 18.4, 18.8, and 19.7 min) that might be either hexose-conjugated or free, and were detected in the three algae. Glycine and hexose-conjugated sterols were at the highest amounts in P. myrica, whereas the only sulfate-conjugated sterol was found in T. triquetra. Overall, T. triquetra and P. myrica showed an almost similar content of sterol lipids, while S. trinodis demonstrated the lowest number of sterol lipids. Sterol lipids were previously identified in many brown algae species [30,31]. Previous studies reported sterols as a major prevailing class of marine metabolites responsible for different biological activities, particularly in the genus Turbinaria [32,33,34].
2.1.4. Fatty Amides
A total of 15 fatty amides were detected, 9 of which were found in the three algal samples such as oxododecanoyl homoserine (tR 5.9 min), stearoyl phenylalanine (tR 11.8 min), palmitoyl tryptophan (tR 15.1 min), linoleamide (tR 17.1 min), oleamide (tR 19.1 min), oleoyl alanine (or might be palmitoyl proline, tR 19.5 min), oleoyl GABA (tR 20.3 min), octadecanamide (tR 21.3 min), and palmitoyl valine (tR 21.6 min). Acyl- (tR 16.5 min) and lauroyl- (tR 17.7 min) carnitine were only observed in P. myrica, while palmitoyl alanine (tR 19.0 min) and palmitoyl (iso)leucine (tR 22.2 min) were solely detected in T. triquetra and S. trinodis. N-acyl glycine 28:6 (tR 13.2 min) was only identified in S. trinodis. The three algae had an almost similar percentage of fatty amides. Oleamide has been previously detected in the alcohol-macerated extract of Turbinaria ornata when analyzed by LC-HRMS, along with other amides and fatty acid esters including myristamide, erucamide, arachidonic acid ethyl ester, and γ-linolenic acid ethyl ester [35].
2.1.5. Sphingolipids
Sphingadienine (tR 14.6 min), sphingatrienine (tR 13.6 min), N-tridecanoyl-tetradecasphingenine (tR 15.2 min), deoxysphingatetraenine (tR 15.3 min), N-pentadecenoyl-tetradecasphingenine (tR 17.2 min), and hexose ceramide 37:4;O4 (tR 18.4 min) were the six sphingolipids detected in the algal samples. Sphingatrienine and hexose ceramide were solely identified in the extract of P. myrica, whereas the remaining sphingolipids were detected in the three algae. Our results agreed with the previous literature reporting the relatively low abundance of sphingolipids in microalgae relative to other types of lipids [36,37,38].
2.1.6. Phospholipids
Phospholipids generally belong to one of the two major subclasses which are phosphatidylcholines and phosphatidylglycerols. Many of these were reported in different brown algae from the Black Sea [26]. Four phospholipids were identified in the current study representing the two abundant classes in the marine ecosystem. Phosphatidylglycerol 20:1 (tR 16.0 min) was solely detected in T. triquetra, while its oxidized form PG 22:4;O3 (tR 21.4 min) was observed in both T. triquetra and P. myrica. Phosphatidylcholines such as lysophosphatidylcholine and its ether form were only observed in T. triquetra and S. trinodis. Phosphatidylglycerol and lysophosphatidylcholine were previously identified from different brown algae, viz. Undaria pinnatifida and Laminaria japonica [39,40].
2.1.7. Fatty Esters and Fatty Alcohols
Three fatty acid esters and one fatty alcohol were identified. A fatty acid ester of a hydroxy fatty acid (tR 18.19 min) and the phenolic fatty alcohol dodecylphenol (tR 16.99 min) were detected in all three algal extracts, however, stearyl citrate (tR 16.58 min) and palmitoyl hexitol (tR 18.17 min) were identified only in T. triquetra and S. trinodis. Saturated fatty alcohols had previously been reported from Turbinaria reniformis [31].
2.1.8. Phenolics
Six different phenolic compounds, including flavonoid, benzofuran, sulfonic acid derivative, and simple phenols were identified in the examined algae. Formononetin (tR 2.02 min), an isoflavone, was detected in T. triquetra and P. myrica extracts. The benzofuran analog (iso)loliolide (tR 7.07 min) was observed in all algae; however, the sulfonic acid derivative, N-undecyl benzene sulfonic acid (tR 20.91 min) was identified only in T. triquetra. Simple phenolics such as dimethoxyphenyl propene (tR 7.07 min), 4-dodecyl phenol (tR 16.99 min), and trimethylphenyl butanone (tR 8.37 min) were detected, with the former two compounds being observed in all algae and the latter one being identified in T. triquetra and P. myrica. Our results agreed with a previous study estimating the total phenolic content of the methanol extract of T. triquetra as 1218.51 ± 27.5 µg gallic acid equivalent /mL and the study reported the relative abundance of phenolic constituents in brown macroalgae compared with the green and red seaweeds [33,41].
2.1.9. Prostaglandins
Three prostaglandins were identified in the algae samples. Prostaglandin E2 (tR 9.30 min) and F2 (tR 10.0 min), and hydroxy PGE1 (or possibly hydroxy PGF2α, tR 9.0 min) were detected in all three Red Sea algal extracts. PGE2 was previously identified from the brown algae Laminaria digitata and was suggested to play a defensive role against copper-induced oxidative stress [42].
2.1.10. Short-Chain Peptides
Two short-chain peptides were recognized: the first one was composed of glutamic acid, histidine, and threonine (tR 2.21 min) and was only detected in T. triquetra, whereas the second peptide (tR 15.75 min) was identified solely in P. myrica and was composed of arginine and two lysine amino acid units. The glycine amino acid was observed as a conjugate with several sterols having different unsaturation and oxygenation patterns, as previously discussed.
2.1.11. Alkaloids
The anthranilic-acid-derived alkaloid, quinoline carboxylic acid (tR 1.93 min), was only detected in S. trinodis, while the quinolizidine alkaloid acrifoline (tR 11.81 min) was only observed in T. triquetra. On the other hand, the tetrahydro β-carboline alkaloid antirhine (tR 12.23 min) was detected in P. myrica.
2.1.12. Sugar Alcohols and Sugar Amides
The sugar alcohol galactitol (tR 2.08 min) and the sugar amide carbamoyl aminodeoxyhexitol (tR 10.07 min) were detected in all algae; however, glucaramide (tR 9.13 min) was solely detected in P. myrica extract.
2.1.13. Terpenes (Isoprenoids)
The plant hormone abscisic acid (tR 12.60 min) and the hydroazulene diterpene dictyone acetate (tR 16.18 min) were the only terpenes detected in the algal extracts.
2.1.14. Miscellaneous Compounds
The polyketide macrolide deoxyerythronolide B (tR 19.41 min), was detected in all three algae, while the chlorophyll derivative phaeophorbide “a” (tR 20.11 min) was only observed in T. triquetra.
2.2. HR-MS/MS-Based Molecular Networking
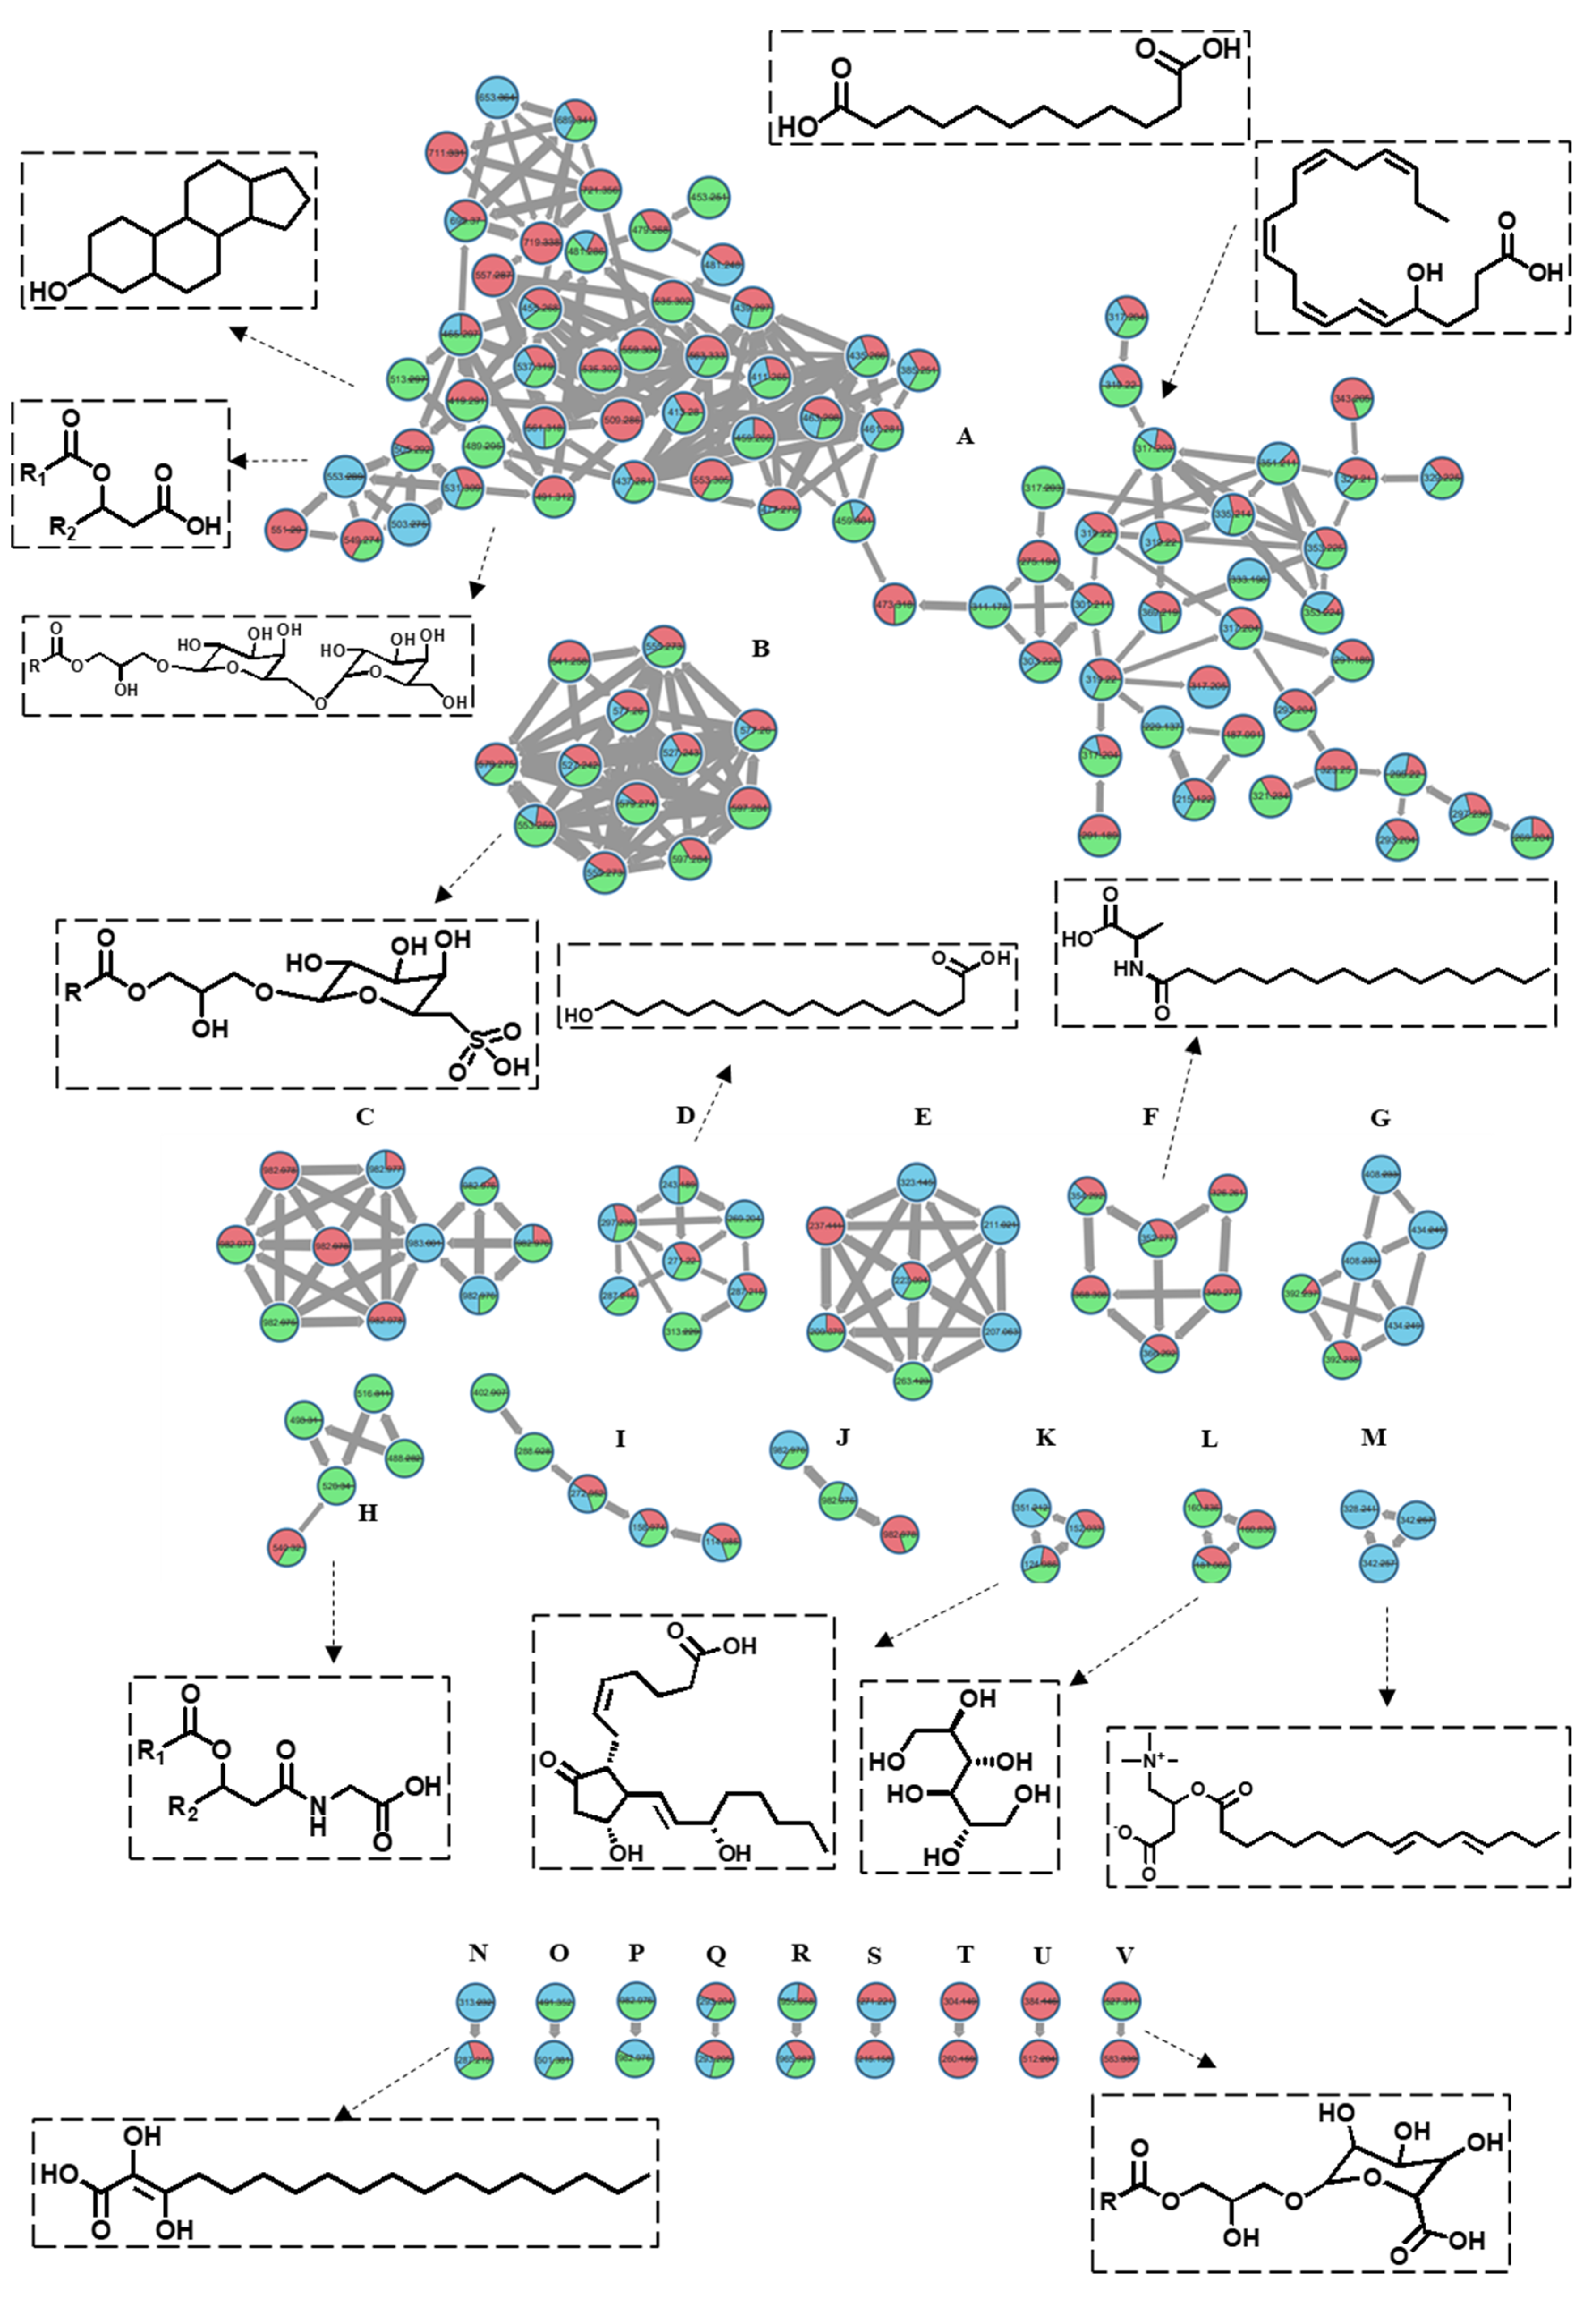
The tandem spectroscopic mining based on LC-MS2 data associated with the online GNPS (Global Natural Products Social Molecular Network) platform was carried out to build a molecular network that clusters molecules with matched MS/MS fragments, allowing the direct visualization of the metabolic profile of the three studied algae. The network, which is established based on the negative ionization data, consisted of 261 nodes comprising 22 clusters and 48 self-looped nodes (Figure 3). The dereplication of the nodes was performed manually and using the GNPS library. Each node, labeled with the molecular ion peak, was plotted as a pie chart showing its relative abundance in each alga. The nodes were color-coded, where blue stands for P. myrica, red for T. triquetra, and green for S. trinodis. Cluster A was the largest in the molecular network and constituted mainly of lipids with a closely related fragmentation pattern. The nodes in cluster A were classified into two major groups: The first one elucidated the presence of nine sterol lipids, three fatty esters, and nine glycerolipids primarily belonging to DGMG, MGGA, or MGMG. The second group of nodes exemplified the predominance of fatty acids, where 22 of them were outlined based on matched fragments.
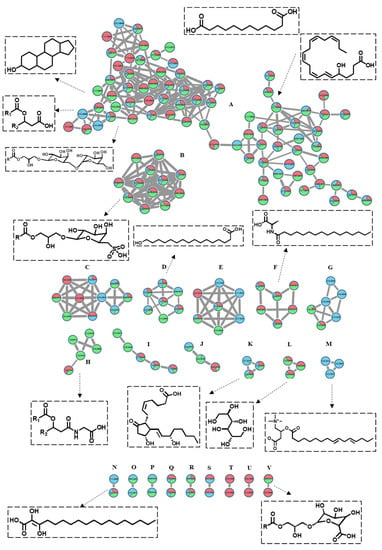
Figure 3.
The molecular network of the annotated metabolites in three Red Sea algal samples (established in the negative mode) shows 261 nodes and 22 clusters. The nodes are labeled with their parent masses. Those nodes showing similar parent masses indicate isomerism. The network is displayed as a pie chart to reflect the relative abundance of each ion in the analyzed samples. Turbinaria triquetra is indicated in red, Polycladia myrica in blue and Sirophysalis trinodis in green.
Cluster B comprised eight nodes, six of which were identified as SQMG, indicating the presence of glycerolipids conjugated with a sulfoquinovosyl moiety. The presence of characteristic fragments at m/z 80.965 and/or m/z 225.006 confirmed their identity. These compounds were concentrated in T. triquetra and S. trinodis when compared with P. myrica. Cluster D showed seven nodes, six of which were identified as fatty acids. Cluster F grouped six nodes, five of which showed parent masses at m/z 352.27, 326.26, 354.29, 368.31, and 366.292, and were identified as fatty amides, as evidenced by the presence of common fragments at m/z 116.07 and 130.08. Cluster H displayed sterol glycine lipid conjugated with a characteristic fragment ion at m/z 78.95.
Cluster K showed a precursor ion peak at m/z 351.212, annotated as prostaglandin E2, while cluster L reflected the presence of a sugar alcohol at m/z 181.065, identified as galactitol. These compounds were traced only in T. triquetra and S. trinodis. Cluster M proposed the presence of acylcarnitine derivatives which were exclusively detected in P. myrica. Closely related hydroxy fatty acids were clustered together. One example is dihydroxyoctadecenoic acid and dihydroxyhexadecanoic acid, which form cluster N and have a mass difference of 26 Da. Cluster U comprised two nodes that are exclusively present in T. triquetra, one of which belonged to peptides and was identified as Glu-His-Thr. Cluster V showed the presence of monoacylglycerylglucuronides (MGGA).
2.3. Assessment of the Antioxidant Activity Using DPPH and ABTS Assays
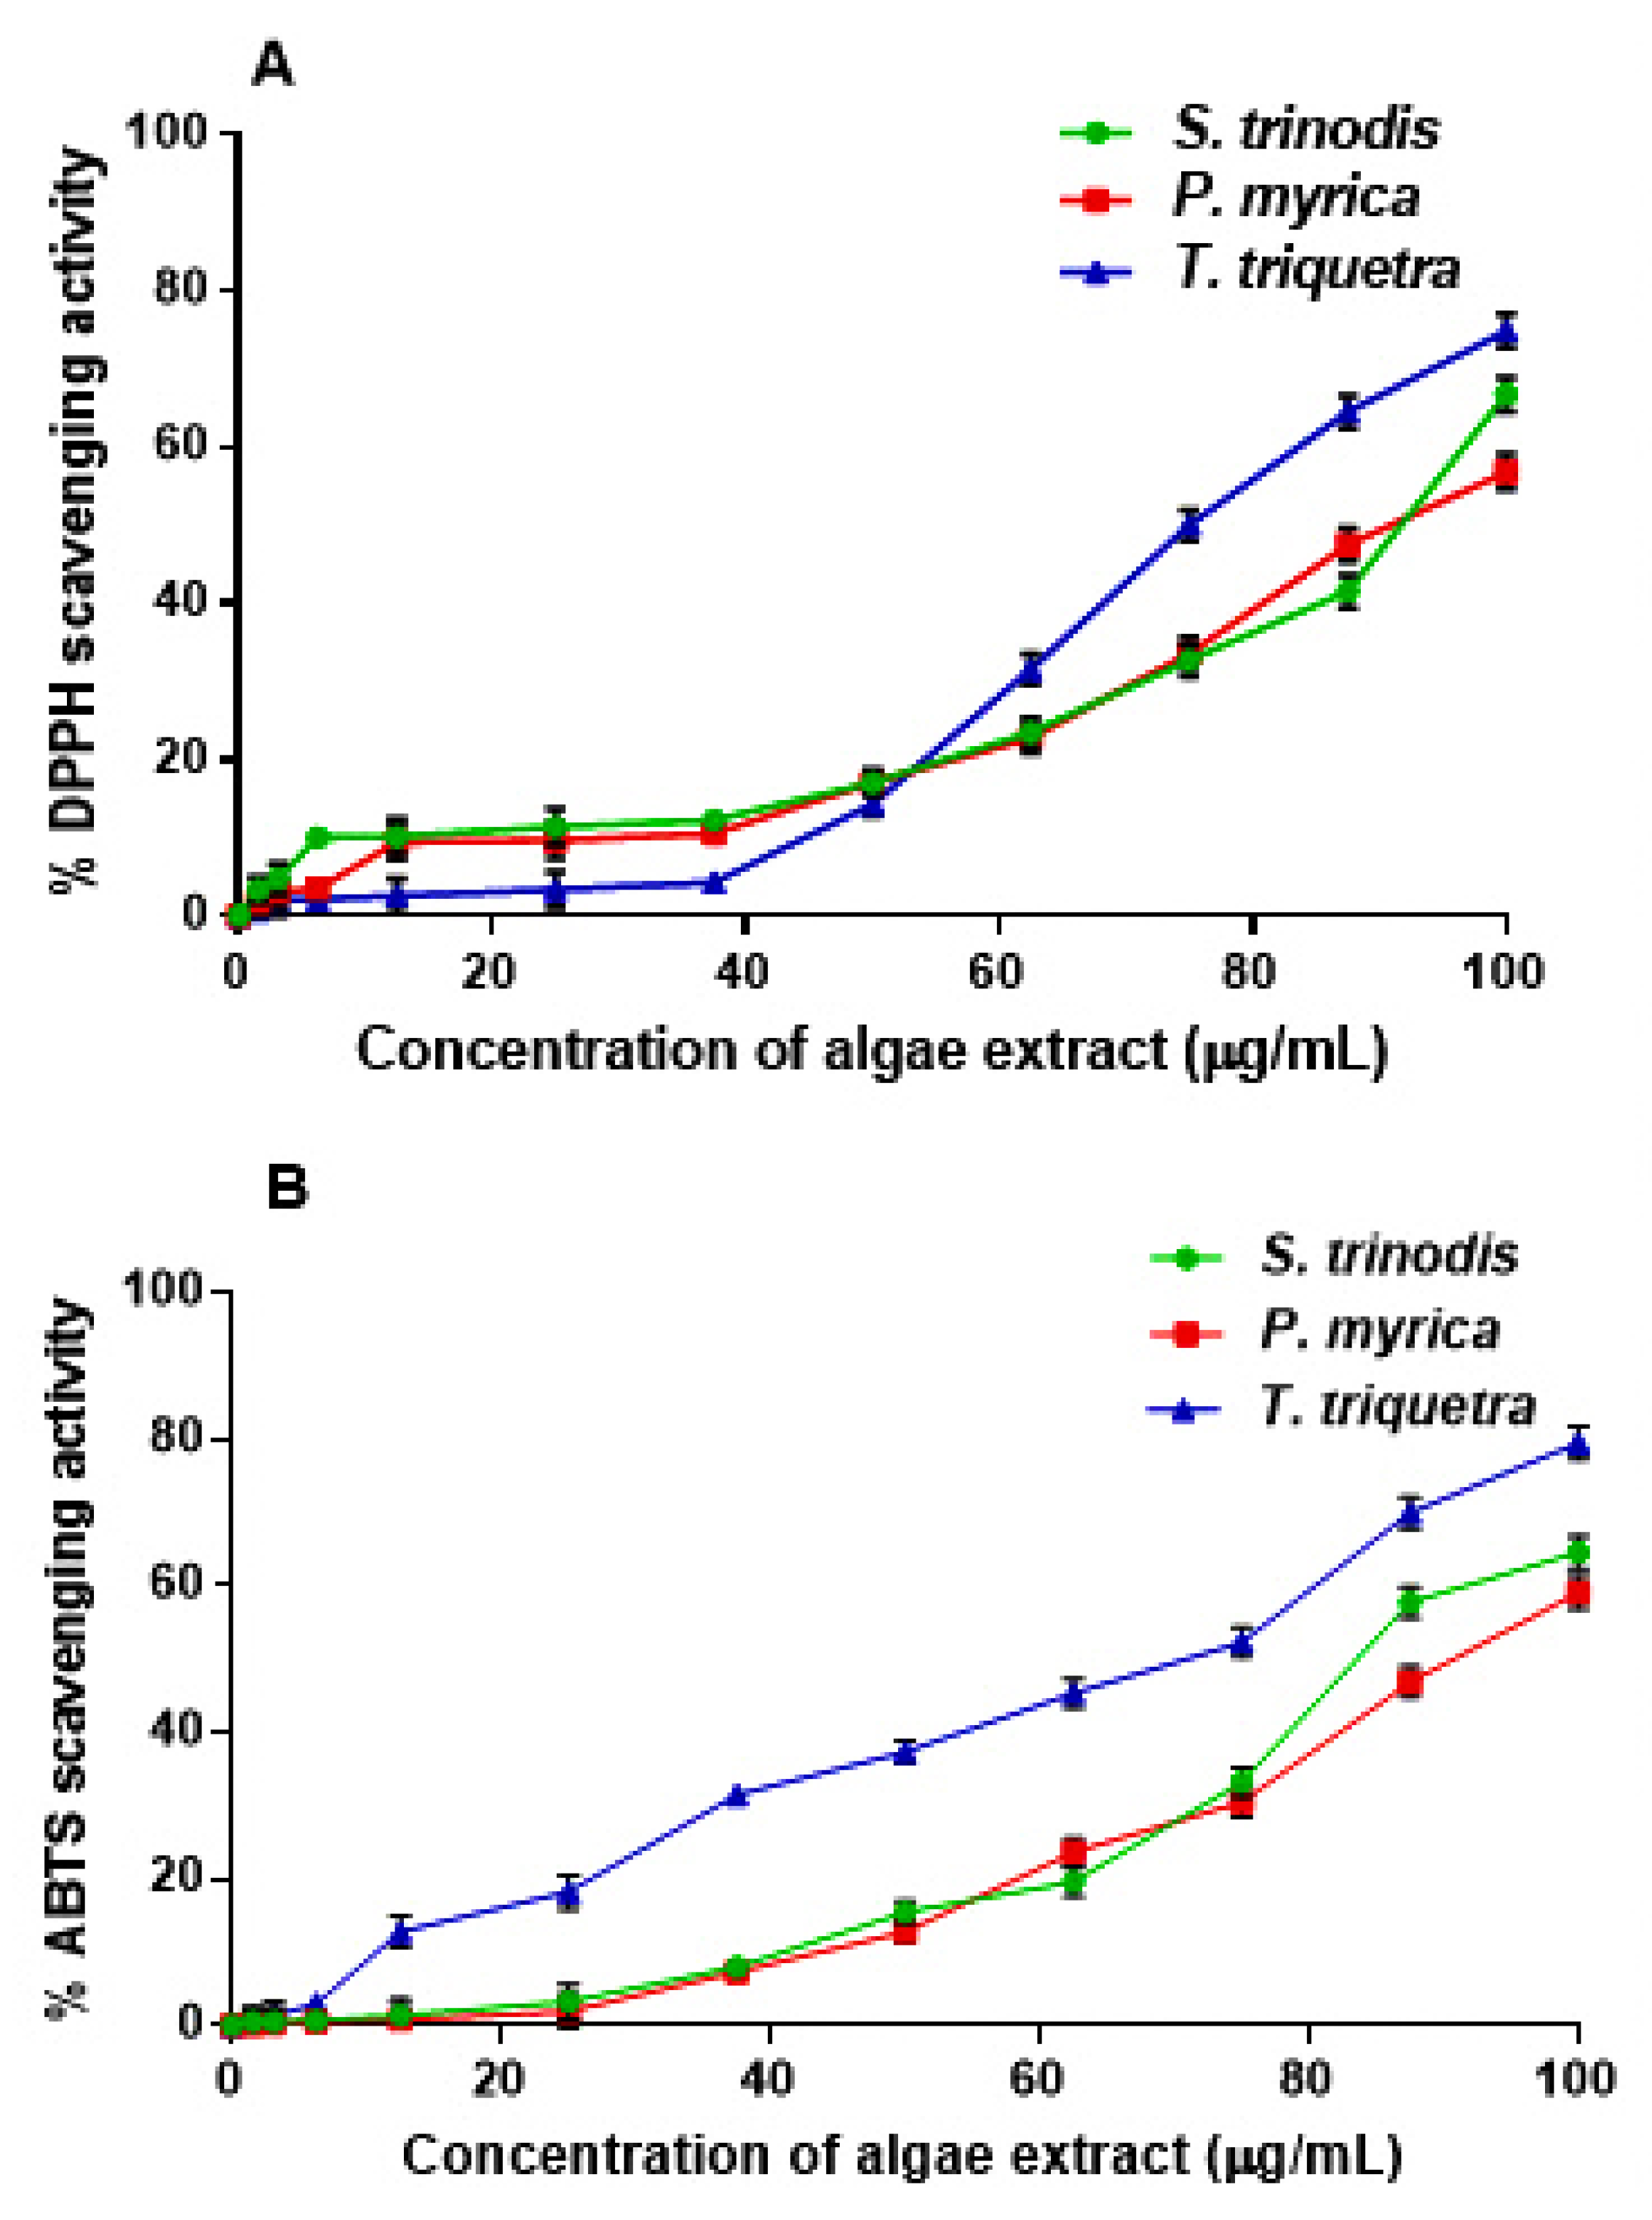
The free radical scavenging potential of the crude methanol extracts of the three Red Sea algae were assessed in vitro using the DPPH and ABTS assays (Figure 4). The three algae, S. trinodis, P. myrica, and T. triquetra, displayed weak-to-moderate antioxidant activities with IC50 values of 90.78 ± 1.52, 93.62 ± 1.74, and 75.71 ± 1.84 µg/mL, respectively, in the DPPH assay, compared with the standard L-ascorbic acid (IC50 value of 20.3 ± 0.14 µg/mL). In the ABTS assay, the antioxidant effect was also concentration-dependent, with IC50 values of 85.18 ± 1.12, 91.34 ± 1.71, and 61.20 ± 1.12 µg/mL, respectively, in comparison with L-ascorbic acid (IC50 value of 15.7 ± 0.21 µg/mL). Despite their relatively weak antioxidant properties, some reports from the literature showed antioxidant and preservative properties of the water extracts of P. myrica and S. trinodis on treated corn stacks within three months of storage at ambient temperature [29]. The antioxidant and antiproliferative activities were also reported for the extracts of Turbinaria conoides and Turbinaria ornata [43].
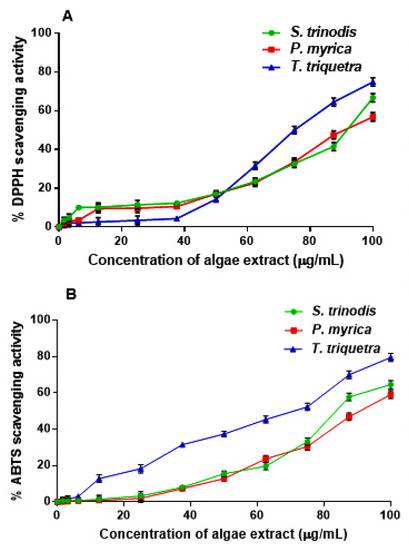
Figure 4.
Assessment of the free radical scavenging activity of the crude extracts of S. trinodis, P. myrica, and T. triquetra using DPPH (A) and ABTS (B) assays. Results were expressed as mean ± SE, (n = 3).
2.4. In Vitro Assessment of Cytotoxicity
The cytotoxic activity of the three algal extracts was assessed against a panel of cancer cell lines including MCF-7, MDA-231, Caco-2, and PANC-1, as well as normal WISH human cells to assign their selectivity (Table 2). The breast cancer MCF-7 cells were highly sensitive to the algal extracts, which demonstrated significant selectivity to cancer cells without causing toxicity to normal WISH cells, compared with tamoxifen (TAM), which was extremely toxic even to normal cells. The extract of S. trinodis displayed the highest cytotoxicity against MCF-7 followed by T. triquetra and then P. myrica. Therefore, the MCF-7 cells were accordingly chosen for further mechanistic investigations.

Table 2.
The anti-proliferative activity of the three Red Sea algal extracts S. trinodis, P. myrica, and T. triquetra.
2.5. Assessment of the Effect of the Algal Extracts on Cancer Cell Morphology
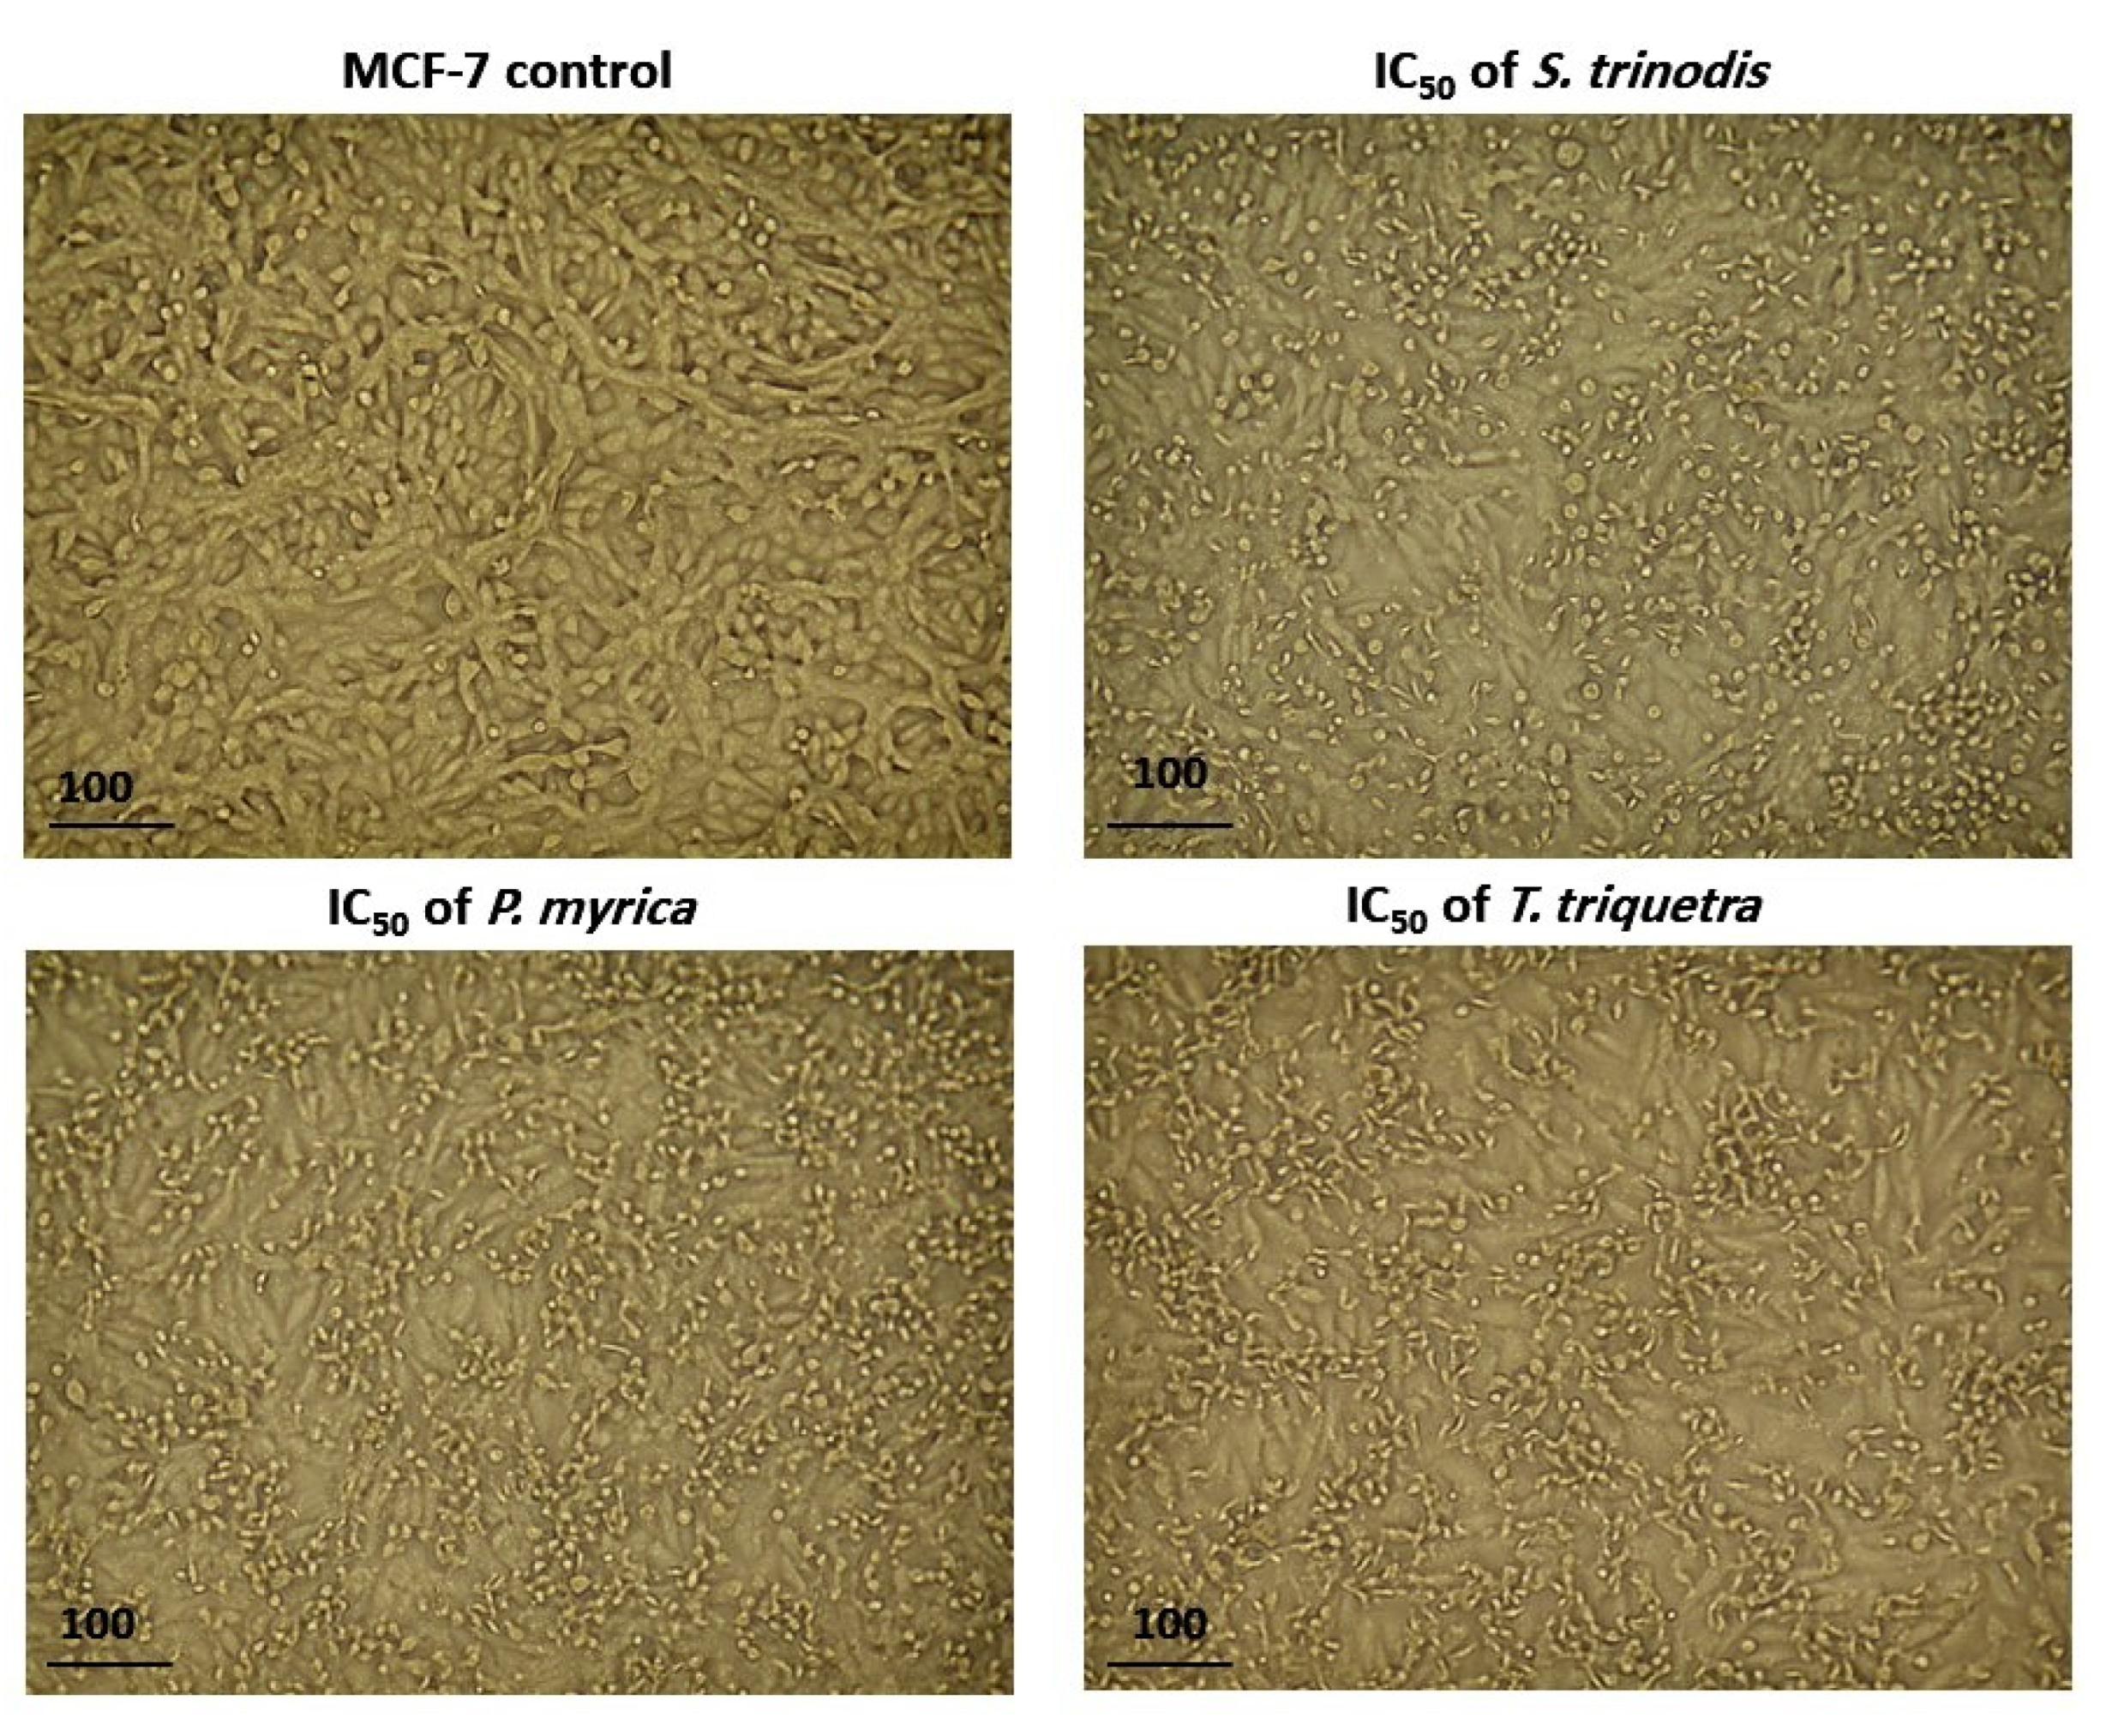
After 48 h of treatment of MCF-7 cells with the algal extracts at their IC50 concentration, cell shrinkage, increased cellular debris, detachment, cell rounding, and cytoplasmic condensation were observed under a light-inverted microscope. The untreated cells, on the other hand, appeared normally spindle in shape and confluent (Figure 5).
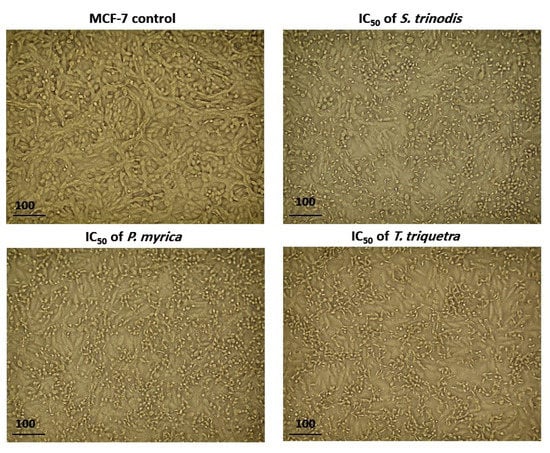
Figure 5.
Morphological alterations in MCF-7 cells after 48 h of treatment with the three algal extracts at their IC50 concentrations.
2.6. Cell Cycle Analysis Using Flow Cytometry
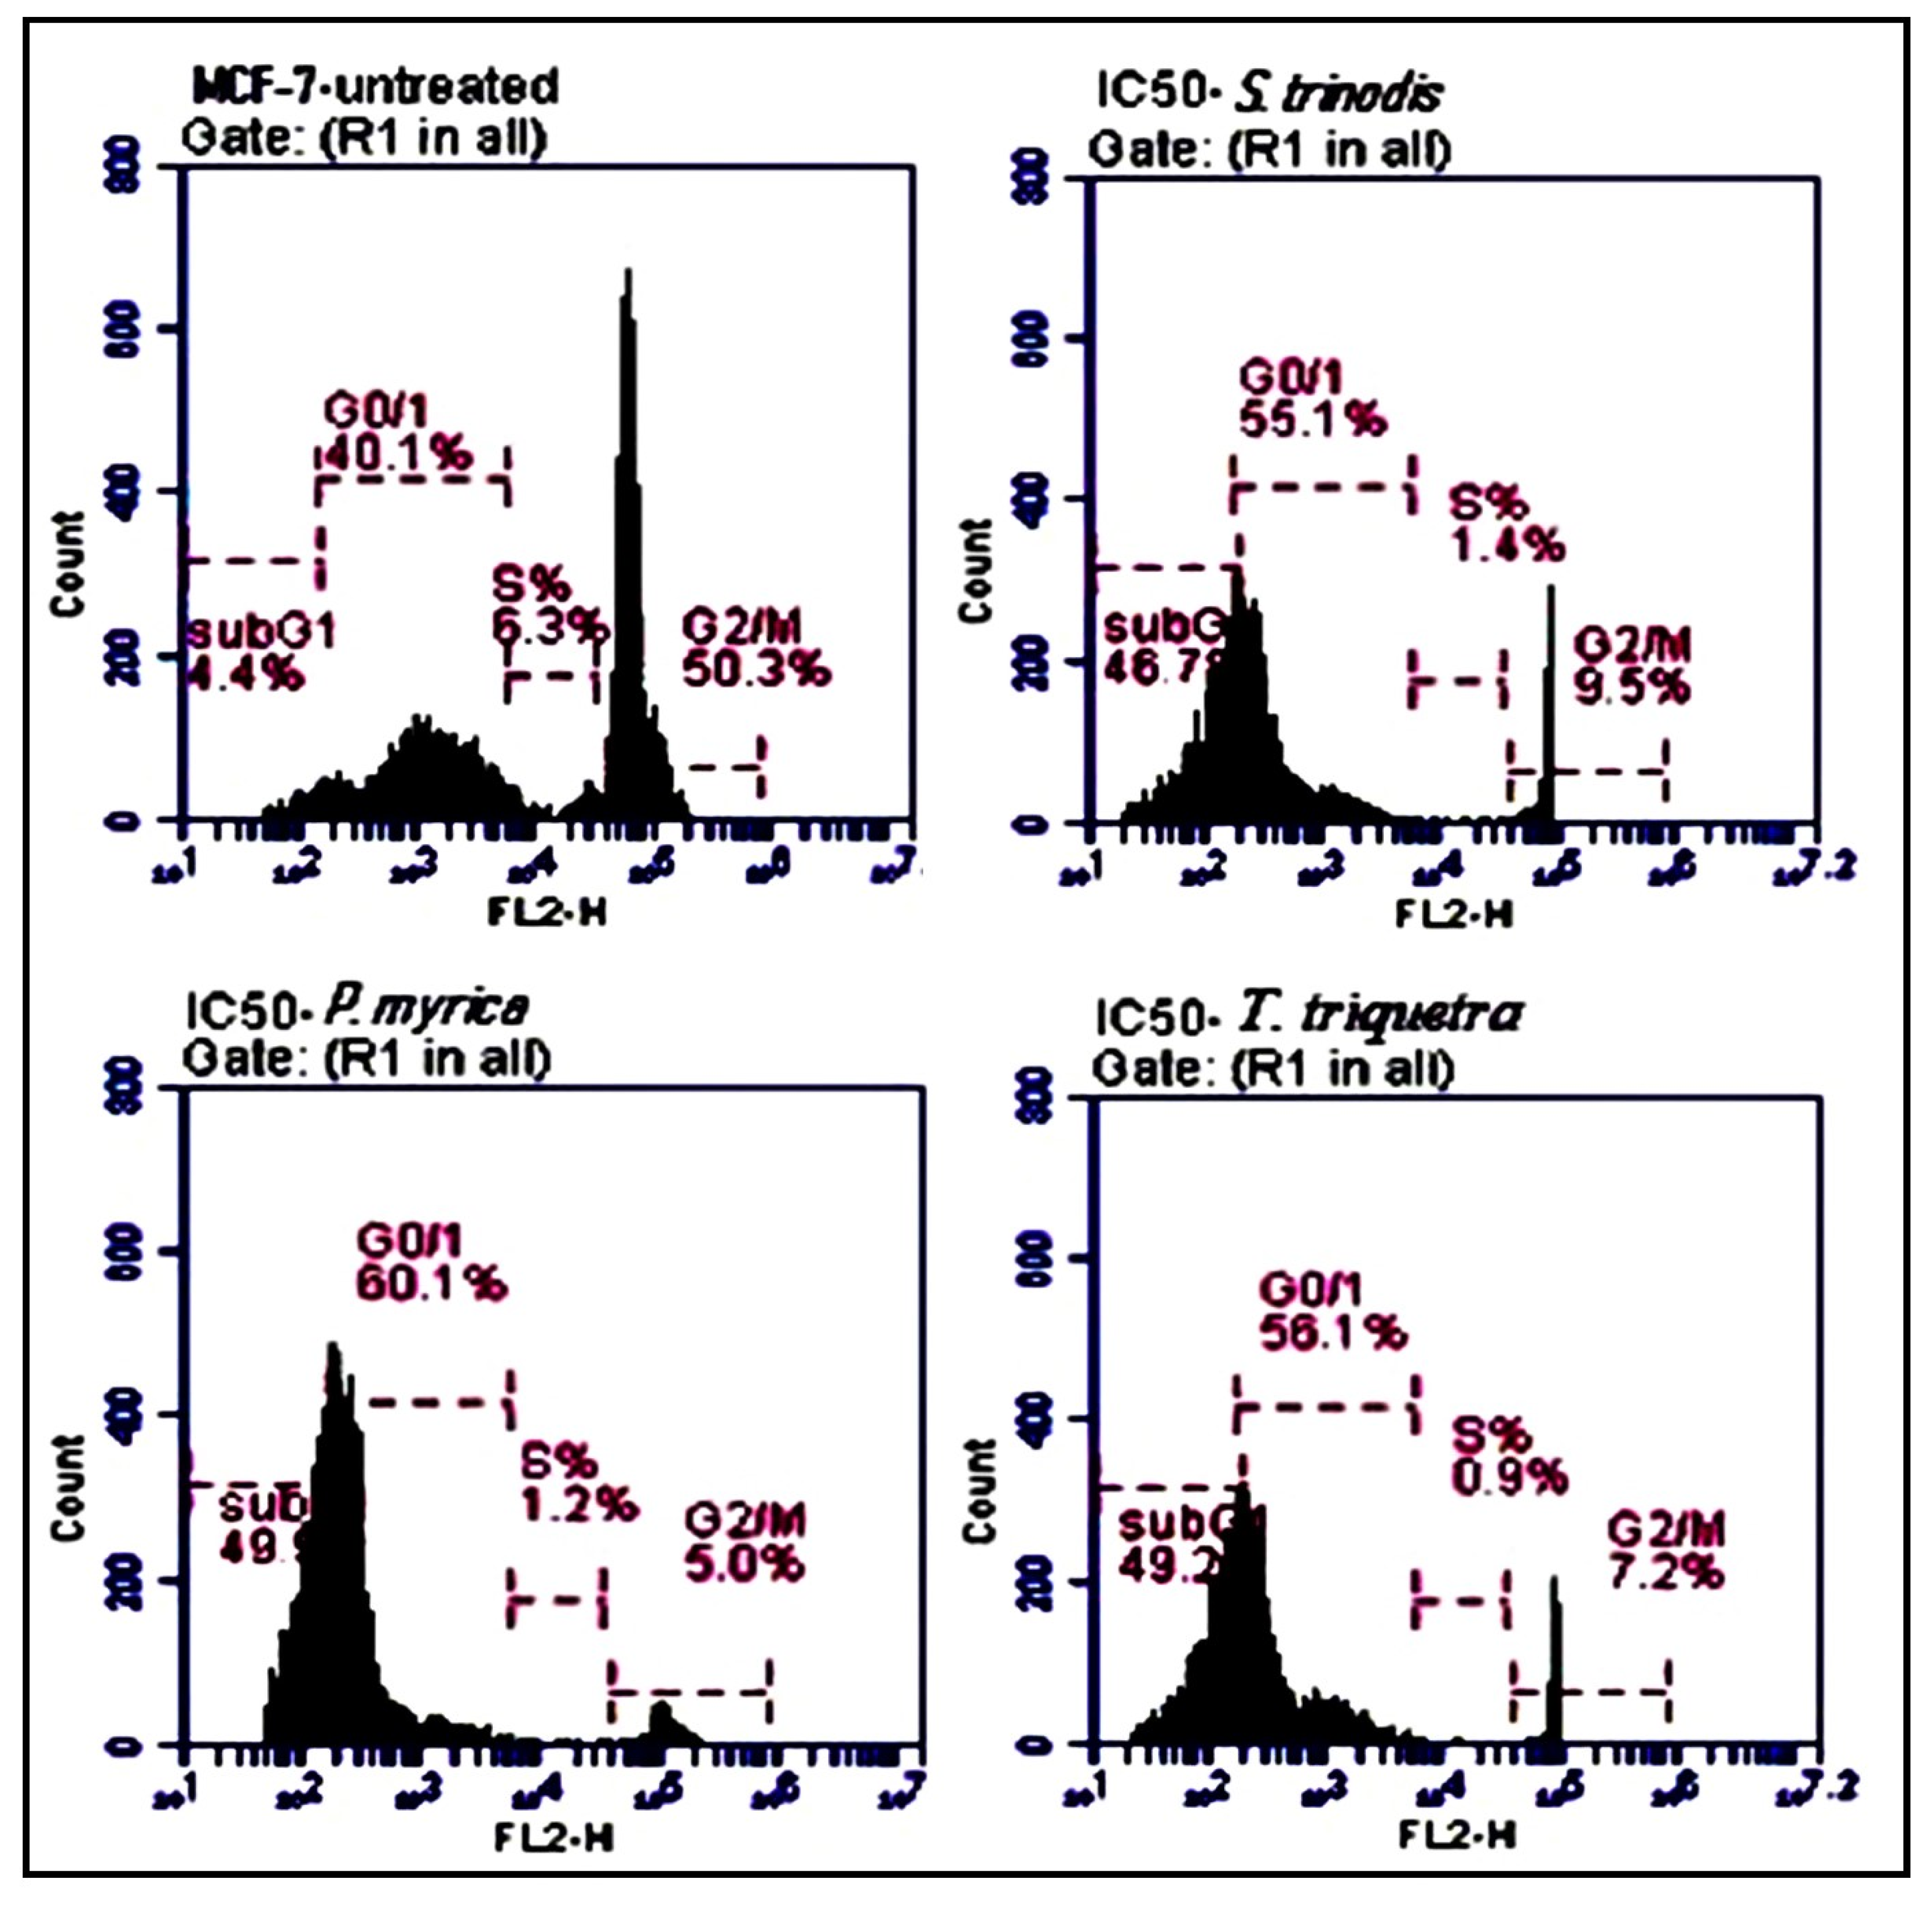
Compared with the untreated MCF-7 cells, the algal extracts (at their IC50 concentrations) induced apoptosis by increased the percentage of MCF-7 cells in the sub-G0/G1 phase. The treated cells with S. trinodis, P. myrica, and T. triquetra caused cell cycle arrest at rates of 46.7%, 49.3%, and 49.2%, respectively (Figure 6), compared with the untreated MCF-7 cells (4.4%).
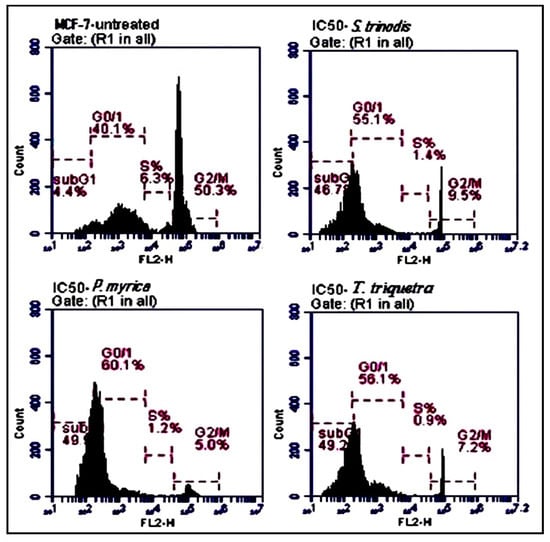
Figure 6.
Analysis of the population of MCF-7 cells at different phases of the cell cycle before and after 48 h of treatment with the three Red Sea algal extracts at their IC50 concentrations. Results are expressed as mean ± SE, (n = 3).
2.7. Real-Time Quantitative Reverse Transcription (qRT-PCR) Analysis
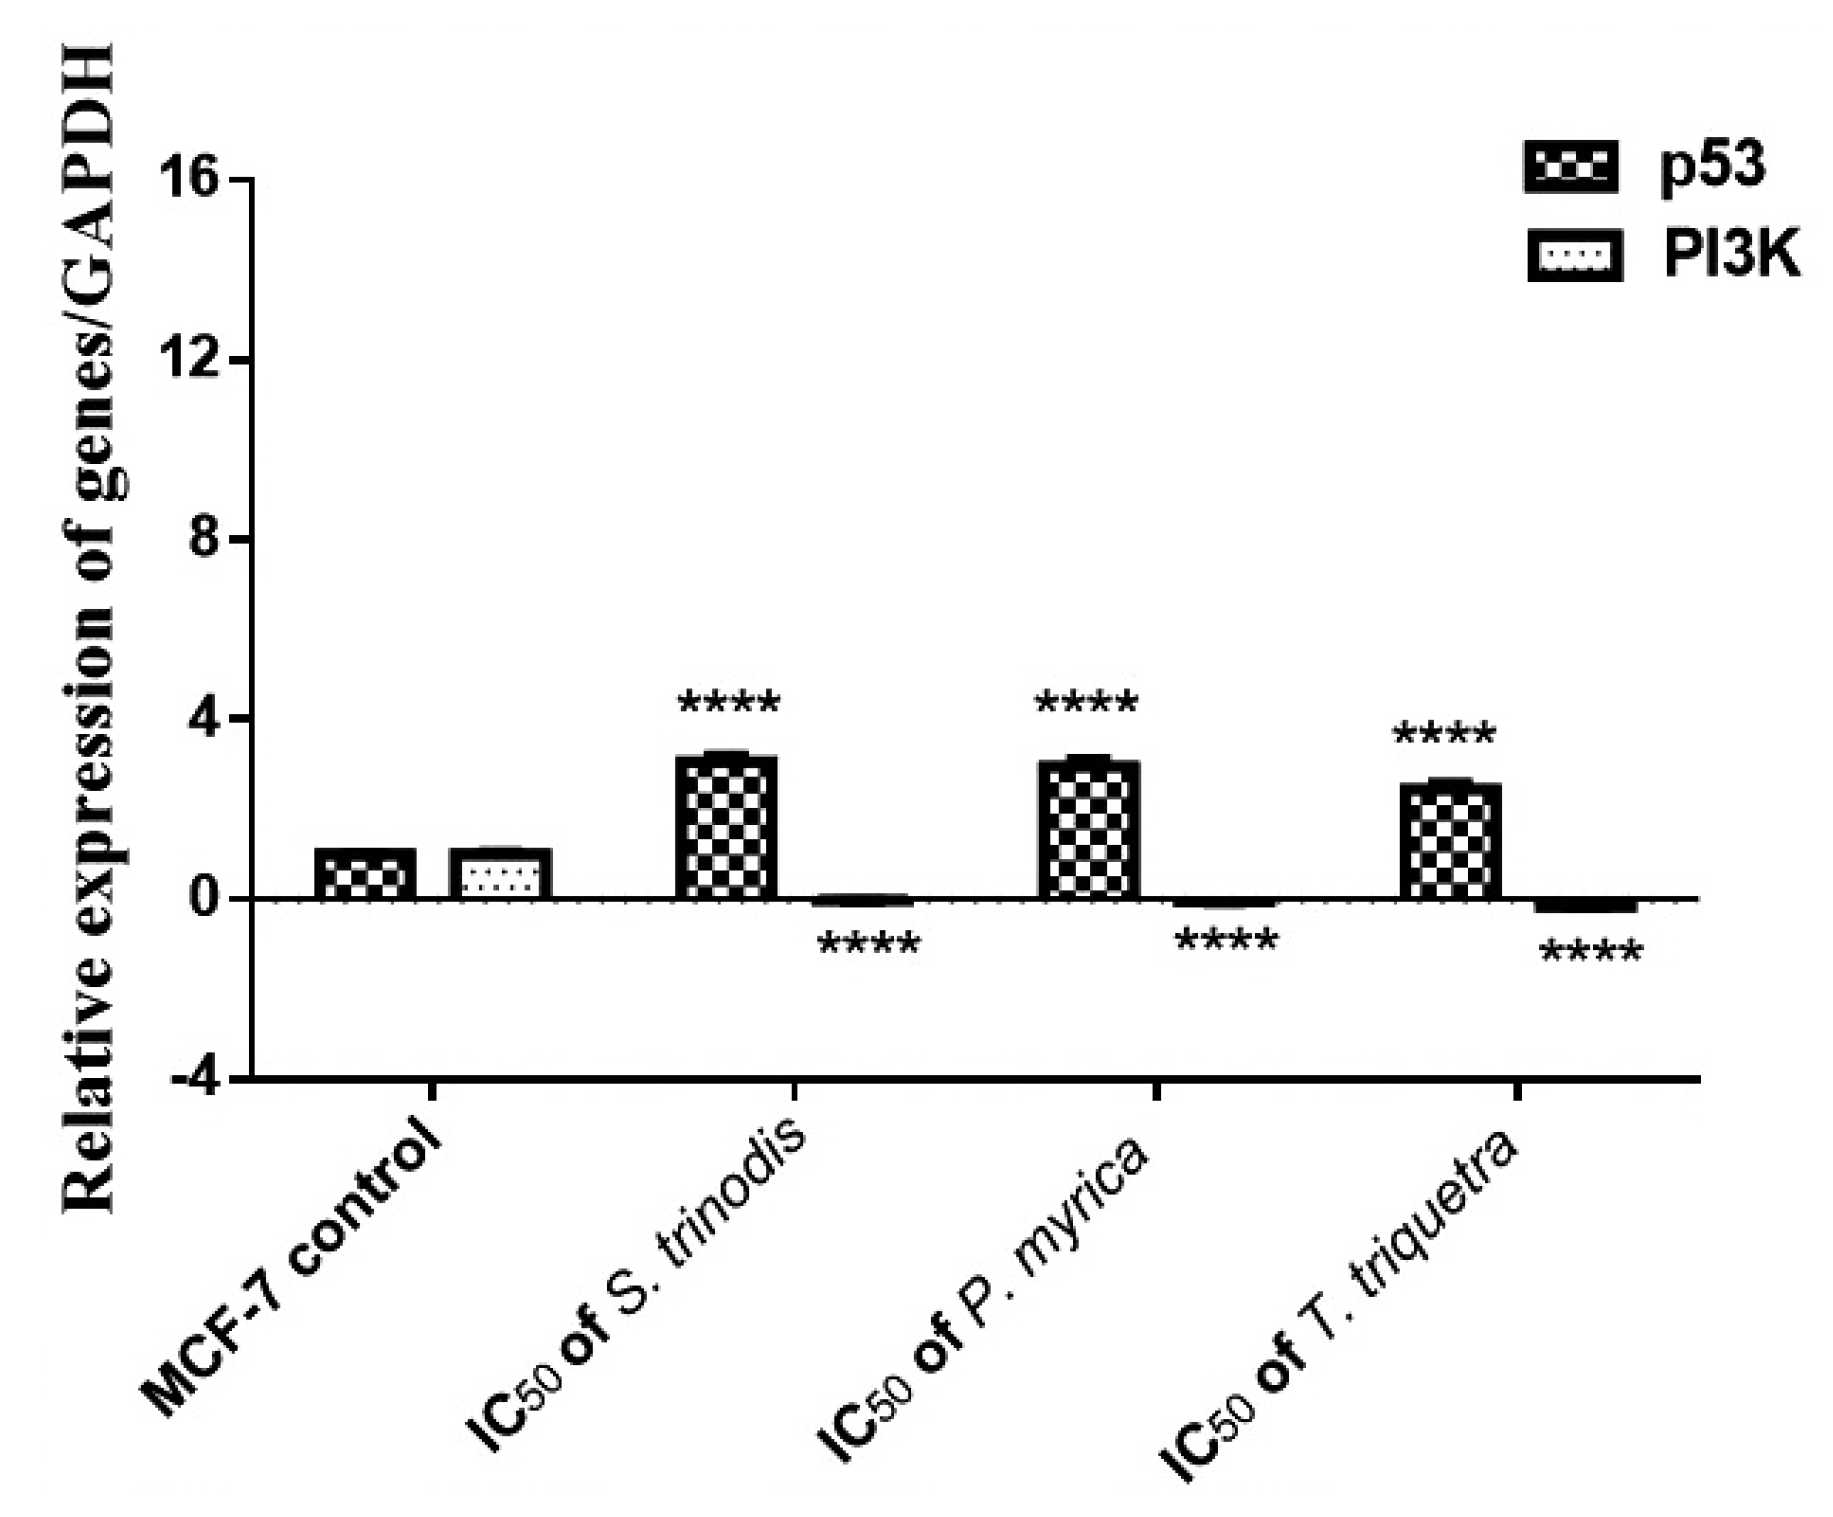
The pivotal role of the PI3K/Akt/mTOR intracellular signaling pathway was extensively investigated in the regulation of the cell cycle and oncogenic transformation. The mRNA expression of p53 and PI3K genes in MCF-7 cancer cells was measured using quantitative real-time polymerase chain reaction (qRT-PCR). The expression of the tumor suppressor gene p53 was significantly (p < 0.0001) increased in cells treated with the algal extracts; however, the expression of the PI3K gene was considerably (p < 0.0001) downregulated in the treated cells compared with the untreated ones (Figure 7).
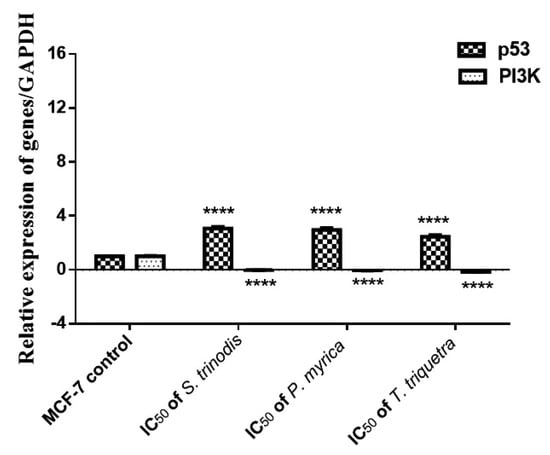
Figure 7.
Relative expression of p53 and PI3K in MCF-7 cell lines before and after 48 h of treatment with the three Red Sea algal extracts at their IC50 concentrations. Results were expressed as mean ± SE, (n = 3). **** p < 0.0001 is considered significant compared with the MCF-7 control untreated cells.
2.8. Immunoblotting Assay
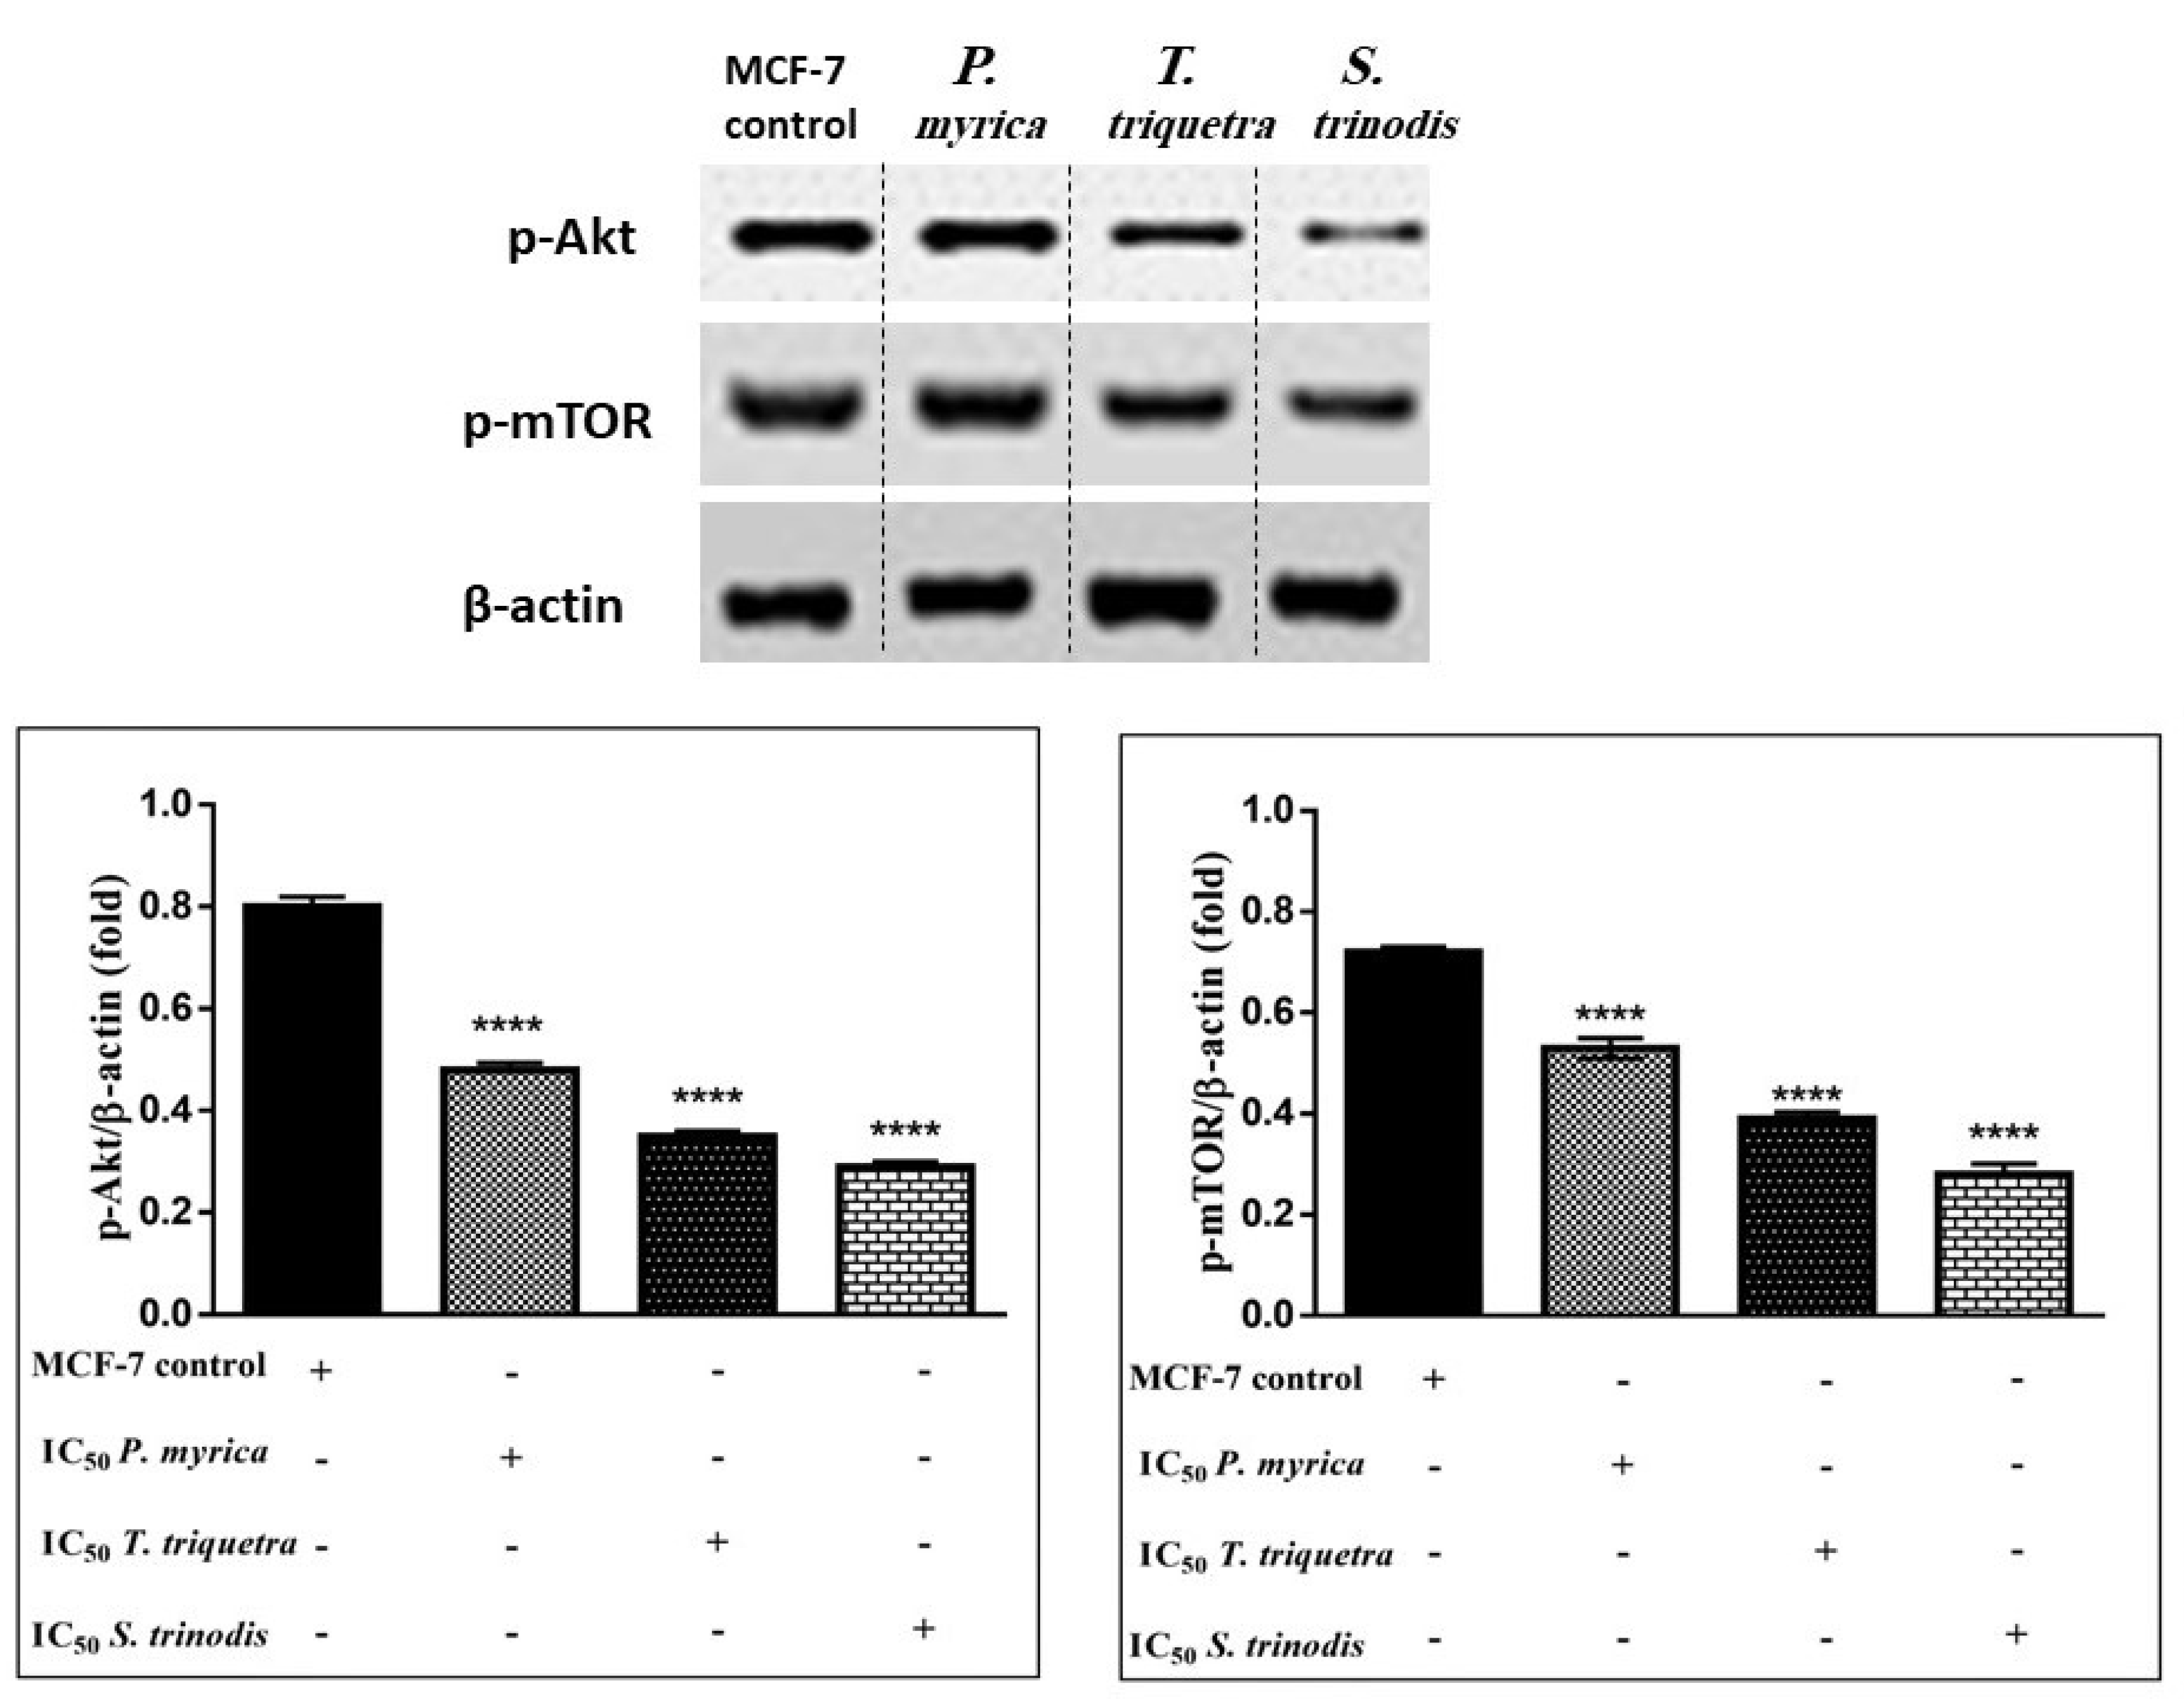
As the phosphorylation of PI3K activates Akt (protein kinase B) and other downstream proteins like mTOR (mammalian target of rapamycin), the algal extracts (in particular, S. trinodis, which displayed the highest potency) caused significant inhibition to p-Akt (Figures S1–S3) and p-mTOR (Figures S4–S6) in MCF-7 cancer cells compared with the untreated ones. These findings revealed that algal extracts probably decreased the phosphorylation of PI3K, hence preventing Akt activation. Once Akt is dephosphorylated, it enhances the release of p53, which suppresses cancer cell proliferation and induces apoptosis (Figure 8).
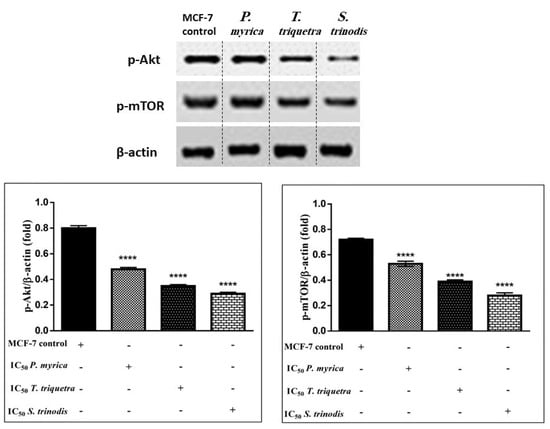
Figure 8.
Western blotting analysis reveals the efficacy of the three algal extracts, in particular S. trinodis, in reducing the levels of phosphorylated Akt and mTOR proteins in MCF-7 cells. Results were expressed as mean ± SE, (n = 3). **** p < 0.0001 is considered significant compared with the MCF-7 control untreated cells. Bands were relatively expressed to β-actin protein (internal control) (Tables S1 and S2) by Western blot analysis.
The promising antiproliferative activity of the studied algal extracts against MCF-cells, manifested through the different mechanistic investigations, is most probably attributed to their rich chemical metabolic profiles. Fatty acids, a major class of the three algal extracts, were reported to enhance the death of tumor cells through mechanisms related to the changes they impart in mitochondrial transmembrane potential, reducing the production of hydrogen peroxide, and inducing mitochondrial uncoupling [44]. Glycerolipids were also reported to possess potent cytotoxic activities through induction of apoptosis and inhibition of DNA polymerase [24,45]. Moreover, several sterols isolated from different Turbinaria species and other brown algae demonstrated prominent antiproliferative activities against different cancer cell lines [46,47]. A tautomeric sterol isolated from Vernonia amygdalina Delile demonstrated significant cytotoxic activity against Hela cells via modulating the PI3K/Akt/mTOR signaling pathway. Reduced phosphorylation levels of PI3K and Akt, besides the significant reduction of phosphorylated mTOR and its substrate ribosomal kinase, were responsible for the antiproliferative activity of the evaluated sterol [48]. Cytotoxic activities were likewise reported to different minor metabolites identified in the studied alga extracts including sphingolipids, phospholipids, and phenolics [49,50,51]. The antiproliferative potential of phenolic compounds was attributed to their direct influence on cell cycle arrest at different phases and mechanisms affecting the G1, G2, and M phases [52,53]. The antioxidant activity of phenolics, although involved in the interaction with the PI3K/Akt/mTOR pathway, proved to be highly engaged in their cytotoxic and antiproliferative activities [54,55].
3. Materials and Methods
3.1. Sample Collection and Extraction
P. myrica, T. triquetra, and S. trinodis were collected from the intertidal zone in front of the National Institute of Oceanography and Fisheries, Hurghada Red Sea, Egypt, during Autumn 2021. Voucher specimens were kept at the National Institute of Oceanography and Fisheries Herbarium, with codes 20, 30, and 35 for T. triquetra, S. trinodis, and P. myrica, respectively. The three algae were dried, cut into small pieces, and macerated in methanol at room temperature for three days. The extracts were filtered, and the methanol was evaporated under reduced pressure using rotavapor at 45 °C, yielding brown solid residues.
3.2. Chemicals and Reagents
Analytical grade methanol for extraction (Nasr Pharmaceutical Company, Cairo, Egypt). LC-MS grade acetonitrile (ACN) and HPLC grade deionized water (DW) were purchased from Merck, Darmstadt, Germany. For the biological study, Dulbecco’s modified Eagle’s was supplemented with 10% heat-inactivated fetal bovine serum (FBS, Thermo Fisher Scientific, GIBCO, Carlsbad, CA, USA; Cat. no. 10099133), 1% penicillin/streptomycin (Thermo Fisher Scientific, Waltham, MA, USA; Cat.no. SV30082), tetrazolium 3-(4,5-dimethylthiazol-2-yl)-2,5-diphenyl-tetrazolium bromide (Gibco-BRL, New York, NY, USA), 2,2-diphenyl-1-picrylhydrazyl (DPPH•, Sigma-Aldrich, St. Louis, MO, USA), and 2,2-azino-bis(3-ethylbenzothiazoline-6-sulfonic acid) (ABTS+, Sigma-Aldrich, Scotland, UK).
3.3. HR LC-MS Analysis and Molecular Networking
The samples were analyzed on an Agilent 1290 Infinity II UPLC coupled to a G6545B Q-TOF MS system with a dual ESI source (Agilent Technologies, Santa Clara, CA, USA). All samples were separated on a Waters ACQUITY UPLC® BEH C18 column (150 × 2.1 mm, 1.7 μm) using 0.1% formic acid–deionized water (A) and ACN (B). The concentration of samples was 1000 ppm. The UPLC solvent gradient systems were optimized as follows: 0–2 min, 5% B; 2–5 min, 5–50% B; 5–20 min, 50–100% B; 20–23 min 100% B; 23–24 min, 100–10% B; 24–25 min, 10% B. The column temperature was set at 30 °C, and the injection volume was 5 μL. The flow rate was 0.3 mL/min. The parameters of the TOF/Q-TOF mass spectrometer were optimized as follows: ion mode, positive- or negative-ion mode; gas temperature, 320 °C; gas flow, 8 L/min; nebulizer pressure, 35 psi; sheath gas temperature, 350 °C; sheath gas flow, 11 L/min; capillary voltage, 3500 V; nozzle voltage, 1000 V; fragmentor voltage, 100 V; MS range, 100–1700 m/z; MS Acquisition rate, 5 (positive-ion mode) or 3 (negative-ion mode) spectra/s; MS Acquisition time, 200 (positive-ion mode) or 333 (negative-ion mode) ms/spectrum; MS/MS range, 100–1700 (positive-ion mode) 50–1200 (negative-ion mode) m/z; MS/MS acquisition rate, 5 (positive-ion mode) or 2 (negative-ion mode) spectra/s; MS/MS acquisition time, 200 (positive-ion mode) or 500 (negative-ion mode) ms/spectrum; collision energy fixed, 50 (positive-ion mode) or 15/40 (negative-ion mode); max precursors per cycle, 5. Internal references (purine and HP-0921) were adopted to modify the measured masses in real-time. The reference masses were obtained at m/z 121.0508/922.0097 and 119.0363/1033.9881 in the positive- and negative-ion mode, respectively.
A molecular network was created using the online workflow (https://ccms-ucsd.github.io/GNPSDocumentation, accessed on 23 February 2023) on the GNPS website (http://gnps.ucsd.edu, accessed on 23 February 2023). The data were filtered by removing all MS/MS fragment ions within +/−17 Da of the precursor m/z. MS/MS spectra were window filtered by choosing only the top 6 fragment ions in the +/−50 Da window throughout the spectrum. The precursor ion mass tolerance was set to 0.02 Da and an MS/MS fragment ion tolerance of 0.02 Da. A network was then created where edges were filtered to have a cosine score above 0.5 and more than 3 matched peaks. The edges between 2 nodes were kept in the network if and only if each of the nodes appeared in each other’s respective top 10 most similar nodes. Finally, the maximum size of a molecular family was set to 100, and the lowest-scoring edges were removed from molecular families until the molecular family size was below this threshold. The spectra in the network were then searched against GNPS spectral libraries. The library spectra were filtered in the same manner as the input data. All matches kept between network spectra and library spectra were required to have a score above 0.6 and at least 3 matched peaks.
3.4. Assessment of the Antioxidant Activity In Vitro
3.4.1. DPPH Free Radical Scavenging Assay
The free radical scavenging capacity was tested using the DPPH assay, which was modified from the method reported by Burits et al. [56]. Briefly, 1.56–100 µg/mL from each extract was gently mixed with 975 µL of (0.003 g%) DPPH in methanol. After 1 h of dark incubation at room temperature, the absorbance (A) of the reaction mixtures was measured at 515 nm using a Jenway 6305 UV/Vis spectrophotometer (Glasgow, UK). L-Ascorbic acid (20–100 µg/mL) was used as the positive control. Experiments were carried out in triplicates and the DPPH radical scavenging activity (%) was calculated using the following equation:
3.4.2. ABTS Radical Scavenging Activity
The ABTS radical scavenging activity was measured following the method described by Re et al. [57]. ABTS radicals were generated by mixing 14 mM ABTS with 4.9 mM potassium persulfate for 16 h in the dark. The ABTS solution was initially diluted with distilled water to reach an absorbance of 0.734 at 734 nm. Then, 975 µL of ABTS+ solution was added to 25 µL of algal extract prepared at different concentrations (1.56–100 µg/mL), and the absorbance was measured at 734 nm after 4 min of dark incubation. Experiments were carried out in triplicates and the results were compared with the control, having an absorbance of 0.734 ± 0.12 (ABTS solution only). Ascorbic acid (20–100 µg/mL) was employed as the standard and the ABTS cation radical scavenging activity (%) was estimated using the following equation:
3.5. Assessment of the Cytotoxic Activity In Vitro
3.5.1. Cell Line Maintenance and Treatment
The triple-negative breast cancer cell line MDA-231, pancreatic cancer cell line (PANC), estrogen-receptor-positive breast cancer cell line MCF-7, colon cancer cell line (Caco-2), and WISH normal cell line, were seeded with (1 × 10⁴ cells/well) separately using complete media containing Dulbecco’s modified Eagle’s supplemented with 10% heat-inactivated fetal bovine serum, 1% penicillin/streptomycin in a 5% CO2 incubator and 95% humidified environment at 37 °C. All cell lines were provided by the Center of Excellence for Research in Regenerative Medicine and Its Applications, Alexandria University, Egypt. The cell lines were incubated with each algal extract at different concentrations (0–200 µg/mL) and with tamoxifen (TAM) as a standard chemotherapeutic drug (0–100 µg/mL) for 48 h. The viability of cells was determined using the tetrazolium 3-(4,5-dimethylthiazol-2-yl)-2,5-diphenyl-tetrazolium bromide MTT assay [58].
3.5.2. Cell Morphology Alterations
Briefly as described by Noser et al. [59], 1 × 10⁵ of the MCF-7 cell line was seeded in a 6-well plate, incubated for 24 h then treated with IC50 of the three algal extracts. After 48 h of incubation, morphological alterations of the treated and untreated cells were evaluated and captured using an inverted light microscope (Olympus, Santa Clara, CA, USA).
3.5.3. Cell Cycle Analysis
Flow cytometry was used to analyze cell cycle phases using an Accuri C6 flow cytometer (Becton Dickinson BD, USA) on MCF-7 cells (1 × 10⁵) that were trypsinized, centrifuged at 5000 rpm, then washed with 1× cold phosphate buffer saline (PBS), and fixed with cold absolute ethanol as described by Noser et al. [59] and Darzynkiewicz et al. [60].
3.5.4. Quantitative Real-Time PCR (qRT-PCR)
The MCF-7 (1 × 10⁵) control and treated cells were trypsinized, centrifuged at 4500 rpm, and washed with 1x PBS. The pelleted cells were subjected to RNA extraction and transcription to cDNA as described by Kvastad et al. [61]. On the treated and control cells, the expression of p53 and PI3K mRNA was quantified using Applied qPCR Biosystems (Foster City, CA, USA) according to Livak et al. [62]. Primer 3 plus was used to design the primer sequences, as shown in Table 3.

Table 3.
Primer sequences used for qRT-PCR.
3.5.5. Western Blot Assessment
For immunoblotting, Mruk and Cheng’s approach [63] was utilized. By cold RIPA lysis buffer, proteins were isolated from the MCF-7 control and treated cells, then quantified using the method established by Bradford [64]. A polyvinylidene difluoride (PVDF) membrane was used to separate equal amounts of proteins (20 µg). After blocking the membrane, phospho-Akt (ab81283) and phospho-mTOR (ab1093) primary antibodies were added and interacted with it. The primary antibodies were then washed several times before treatment with the secondary antibody horseradish peroxidase (HRP) (ab205718). An enhanced chemiluminescence (ECL) detection kit was used to see the bands (Promega, Madison, WI, USA). A gel documentation system (Geldoc-it, UVP, England), was applied for data analysis using Totallab analysis software, ww.totallab.com, Ver.1.0.1 (accessed on 1 March 2021).
3.5.6. Statistical Analysis
The experimental results are presented as mean ± SE. GraphPad Prism 6 software (Boston, MO, USA) was used to determine the significance of differences between the control and treated groups using one-way ANOVA.
4. Conclusions
Brown algae are widely disseminated along the Red Sea. LC-MS-guided metabolic studies, assisted by molecular networking, of three Red-Sea-derived brown algae showed their richness in lipids including glycerolipids, fatty acids, and sterol lipids. Despite their relatively low antioxidant power, (especially S. trinodis and T. triquetra), the algae extracts displayed high and selective antiproliferative activity against MCF-7 cancer cells without showing toxic effects on normal WISH cells. Mechanistic investigations revealed that the algae extracts reduced PI3K expression and activation, hence reducing Akt levels and subsequently increasing p53 levels. The prominent antiproliferative activities of the studied algal extracts are most likely due to the synergistic effect of their chemical metabolites, especially those belonging to classes of fatty acids, glycerolipids, and sterols, constituting the major proportion of the algae extracts with reported cytotoxic and antiproliferative potentials.
Supplementary Materials
The following supporting information can be downloaded at: https://www.mdpi.com/article/10.3390/md21070404/s1. Figure S1. Anti-p-Akt antibody protein expression level for the algae extracts; Figure S2. Computerized analysis of anti-p-Akt antibody protein expression level for the algae extracts; Figure S3. Dendrograms of anti-p-Akt antibody protein expression level for all samples; Figure S4. Anti-p-mTOR antibody protein expression level for algae extracts; Figure S5. Computerized analysis of anti-p-mTOR antibody protein expression level for algae extracts; Figure S6. Dendrograms of anti-p-mTOR antibody protein expression level for all samples; Figure S6. TIC chromatogram of the extract of the Red Sea algae T. triquetra in positive mode; Figure S7. TIC chromatogram of the extract of the Red Sea algae P. myrica in positive mode; Figure S8. TIC chromatogram of the extract of the Red Sea algae S. trinodis in positive mode; Figure S9. Total ion chromatogram of the extract of the Red Sea algae S. trinodis in positive mode; Table S1. The expression level of anti-p-Akt protein expression level for algae extracts; Table S2. The expression level of anti-p-mTOR protein expression level for algae extracts.
Author Contributions
Sample collection, S.H.R.; Analysis and networking, G.S.L., Y.S.J., K.H.K.; Annotation of metabolites and writing original draft, S.F., N.M.F., M.I.G.E.-D.; Biological studies and writing original draft, M.M.S.; Supervision and manuscript revision, M.E.-S., C.S.K. All authors have read and agreed to the published version of the manuscript.
Funding
This work was supported by a National Research Foundation (NRF) of Korea grant, funded by the government of Korea (MSIT) (No. 2022R1A6A1A03054419).
Institutional Review Board Statement
Not applicable.
Informed Consent Statement
Not applicable.
Data Availability Statement
The data presented in this study are available in the article or Supplementary Material.
Conflicts of Interest
The authors declare no conflict of interest.
References
- Molinski, T.F.; Dalisay, D.S.; Lievens, S.L.; Saludes, J.P. Drug development from marine natural products. Nat. Rev. Drug Discov. 2009, 8, 69–85. [Google Scholar] [CrossRef] [PubMed]
- El-Din, M.I.G.; Youssef, F.S.; Ashour, M.L.; Eldahshan, O.A.; Singab, A.N.B. New γ-pyrone glycoside from Pachira glabra and assessment of its gastroprotective activity using an alcohol-induced gastric ulcer model in rats. Food Funct. 2020, 11, 1958–1965. [Google Scholar] [CrossRef] [PubMed]
- Tammam, M.A.; El-Din, M.I.G.; Abood, A.; El-Demerdash, A. Recent Advances in Discovery, Biosynthesis and Therapeutic Potentialities of Isocoumarins Derived from Fungi: A Comprehensive Update. RSC Adv. 2023, 13, 8049–8089. [Google Scholar] [CrossRef] [PubMed]
- Donia, M.; Hamann, M.T. Marine natural products and their potential applications as anti-infective agents. Lancet Infect. Dis. 2003, 3, 338–348. [Google Scholar] [CrossRef]
- Ścieszka, S.; Klewicka, E. Algae in food: A general review. Crit. Rev. Food Sci. Nutr. 2019, 59, 3538–3547. [Google Scholar] [CrossRef] [PubMed]
- Kharkwal, H.; Joshi, D.; Panthari, P.; Pant, M.K.; Kharkwal, A.C. Algae as future drugs. Asian J. Pharm. Clin. Res 2012, 5, 1–4. [Google Scholar]
- Pradhan, B.; Nayak, R.; Patra, S.; Jit, B.P.; Ragusa, A.; Jena, M. Bioactive metabolites from marine algae as potent pharmacophores against oxidative stress-associated human diseases: A comprehensive review. Molecules 2020, 26, 37. [Google Scholar] [CrossRef]
- Lu, W.-Y.; Li, H.-J.; Wu, Y.-C. Marine Polysaccharides from Algae: Bioactivities and Application in Drug Research. In Marine Biochemistry; CRC Press: Boca Raton, FL, USA, 2023; pp. 85–109. [Google Scholar] [CrossRef]
- Nayak, G.; Bhuyan, R.; Sahu, A. Review on biomedical applications of marine algae-derived biomaterials. Univers. J. Public Health 2022, 10, 15–24. [Google Scholar] [CrossRef]
- Tsvetanova, F.; Yankov, D. Bioactive compounds from red microalgae with therapeutic and nutritional value. Microorganisms 2022, 10, 2290. [Google Scholar] [CrossRef]
- Gonçalves, A.; Fernandes, M.; Lima, M.; Gomes, J.P.; Silva, F.; Castro, S.; Sampaio, F.; Gomes, A.C. Nanotechnology to the Rescue: Therapeutic Strategies Based on Brown Algae for Neurodegenerative Diseases. Appl. Sci. 2023, 13, 1883. [Google Scholar] [CrossRef]
- Kamal, M.; Abdel-Raouf, N.; Alwutayd, K.; AbdElgawad, H.; Abdelhameed, M.S.; Hammouda, O.; Elsayed, K.N. Seasonal Changes in the Biochemical Composition of Dominant Macroalgal Species along the Egyptian Red Sea Shore. Biology 2023, 12, 411. [Google Scholar] [CrossRef]
- Remya, R.; Samrot, A.V.; Kumar, S.S.; Mohanavel, V.; Karthick, A.; Chinnaiyan, V.K.; Umapathy, D.; Muhibbullah, M. Bioactive potential of brown algae. Adsorpt. Sci. Technol. 2022, 2022, 9104835. [Google Scholar] [CrossRef]
- von Meyenfeldt, M. Cancer-associated malnutrition: An introduction. Eur. J. Oncol. Nurs. 2005, 9, S35–S38. [Google Scholar] [CrossRef] [PubMed]
- Thun, M.J.; DeLancey, J.O.; Center, M.M.; Jemal, A.; Ward, E.M. The global burden of cancer: Priorities for prevention. Carcinogenesis 2010, 31, 100–110. [Google Scholar] [CrossRef]
- Wang, C.-D.; Yuan, C.-F.; Bu, Y.-Q.; Wu, X.-M.; Wan, J.-Y.; Zhang, L.; Hu, N.; Liu, X.-J.; Zu, Y.; Liu, G.-L. Fangchinoline inhibits cell proliferation via Akt/GSK-3beta/cyclin D1 signaling and induces apoptosis in MDA-MB-231 breast cancer cells. Asian Pac. J. Cancer Prev. 2014, 15, 769–773. [Google Scholar] [CrossRef] [PubMed]
- Ghafouri-Fard, S.; Noie Alamdari, A.; Noee Alamdari, Y.; Abak, A.; Hussen, B.M.; Taheri, M.; Jamali, E. Role of PI3K/AKT pathway in squamous cell carcinoma with an especial focus on head and neck cancers. Cancer Cell Int. 2022, 22, 254. [Google Scholar] [CrossRef] [PubMed]
- Porta, C.; Paglino, C.; Mosca, A. Targeting PI3K/Akt/mTOR signaling in cancer. Front. Oncol 2014, 4, 64. [Google Scholar] [CrossRef]
- Mohammed, S. Assessment of Antimicrobial Activity and Antioxidant Properties of Three Brown Seaweeds, Sargassum polycystum, Turbinaria triquitra and Cystoseria myrica. Egypt. Acad. J. Biol. Sci. 2023, 14, 19–28. [Google Scholar] [CrossRef]
- Moheimanian, N.; Mirkhani, H.; Sohrabipour, J.; Jassbi, A.R. Inhibitory Potential of Six Brown Algae from the Persian Gulf on α-Glucosidase and In Vivo Antidiabetic Effect of Sirophysalis Trinodis. Iran. J. Med. Sci. 2022, 47, 484–493. [Google Scholar] [CrossRef]
- Al-Judaibi, A. Antibacterial effects of extracts of two types of Red Sea Algae. J. Biosci. Med. 2014, 2, 74. [Google Scholar] [CrossRef]
- Omar, H.; Shiekh, H.; Gumgumjee, N.; El-Kazan, M.; El-Gendy, A. Antibacterial activity of extracts of marine algae from the Red Sea of Jeddah, Saudi Arabia. Afr. J. Biotechnol. 2012, 11, 13576–13585. [Google Scholar] [CrossRef]
- Soleimani, S.; Yousefzadi, M.; Nezhad, S.; Pozharitskaya, O.; Shikov, A. Evaluation of fractions extracted from Polycladia myrica: Biological activities, UVR protective effect, and stability of cream formulation based on it. J. Appl. Psychol. 2022, 34, 1763–1777. [Google Scholar] [CrossRef]
- Guo, S.-S.; Wang, Z.-G. Glyceroglycolipids in marine algae: A review of their pharmacological activity. Front. Pharmacol. 2022, 13, 1008797. [Google Scholar] [CrossRef] [PubMed]
- El-Beltagi, H.S.; Mohamed, A.A.; Mohamed, H.I.; Ramadan, K.M.; Barqawi, A.A.; Mansour, A.T. Phytochemical and potential properties of seaweeds and their recent applications: A review. Mar. Drugs 2022, 20, 342. [Google Scholar] [CrossRef] [PubMed]
- Dembitsky, V.M.; Rozentsvet, O.A.; Pechenkina, E.E. Glycolipids, phospholipids and fatty acids of brown algae species. Phytochemistry 1990, 29, 3417–3421. [Google Scholar] [CrossRef]
- Pirian, K.; Jeliani, Z.Z.; Arman, M.; Sohrabipour, J.; Yousefzadi, M. Proximate analysis of selected macroalgal species from the Persian Gulf as a nutritional resource. Trop. Life Sci. Res. 2020, 31, 1. [Google Scholar] [CrossRef]
- Farghl, A.A.; Al-Hasawi, Z.M.; El-Sheekh, M.M. Assessment of Antioxidant Capacity and Phytochemical Composition of Brown and Red Seaweeds Sampled off Red Sea Coast. Appl. Sci. 2021, 11, 11079. [Google Scholar] [CrossRef]
- Etemadian, Y.; Shabanpour, B.; Ramzanpour, Z.; Shaviklo, A.R.; Kordjazi, M. Nutritional and functional properties of two dried brown seaweeds Sirophysalis trinodis and Polycladia myrica. J. Aquat. Food Prod. Technol. 2018, 27, 219–235. [Google Scholar] [CrossRef]
- El Shoubaky, G.A.; Salem, E.A. Terpenes and sterols composition of marine brown algae Padina pavonica (Dictyotales) and Hormophysa triquetra (Fucales). Int. J. Pharmacogn. Phytochem. 2014, 6, 894–900. [Google Scholar]
- Bouzidi, N.; Viano, Y.; Ortalo-Magne, A.; Seridi, H.; Alliche, Z.; Daghbouche, Y.; Culioli, G.; El Hattab, M. Sterols from the brown alga Cystoseira foeniculacea: Degradation of fucosterol into saringosterol epimers. Arab. J. Chem. 2019, 12, 1474–1478. [Google Scholar] [CrossRef]
- Caamal-Fuentes, E.; Moo-Puc, R.; Freile-Pelegrín, Y.; Robledo, D. Cytotoxic and antiproliferative constituents from Dictyota ciliolata, Padina sanctae-crucis and Turbinaria tricostata. Pharm. Biol. 2014, 52, 1244–1248. [Google Scholar] [CrossRef] [PubMed]
- Rushdi, M.I.; Abdel-Rahman, I.A.; Saber, H.; Attia, E.Z.; Abdelraheem, W.M.; Madkour, H.A.; Abdelmohsen, U.R. The genus Turbinaria: Chemical and pharmacological diversity. Nat. Prod. Res. 2021, 35, 4560–4578. [Google Scholar] [CrossRef] [PubMed]
- Treignier, C.; Tolosa, I.; Grover, R.; Reynaud, S.; Sa, C.F.-P. Carbon isotope composition of fatty acids and sterols in the scleractinian coral Turbinaria reniformis: Effect of light and feeding. Limnol. Oceanogr. 2009, 54, 1933–1940. [Google Scholar] [CrossRef]
- Sunarwidhi, A.L.; Hernawan, A.; Frediansyah, A.; Widyastuti, S.; Martyasari, N.W.R.; Abidin, A.S.; Padmi, H.; Handayani, E.; Utami, N.W.P.; Maulana, F.A. Multivariate Analysis Revealed Ultrasonic-Assisted Extraction Improves Anti-Melanoma Activity of Non-Flavonoid Compounds in Indonesian Brown Algae Ethanol Extract. Molecules 2022, 27, 7509. [Google Scholar] [CrossRef]
- Li, Y.; Lou, Y.; Mu, T.; Ke, A.; Ran, Z.; Xu, J.; Chen, J.; Zhou, C.; Yan, X.; Xu, Q. Sphingolipids in marine microalgae: Development and application of a mass spectrometric method for global structural characterization of ceramides and glycosphingolipids in three major phyla. Anal. Chim. Acta 2017, 986, 82–94. [Google Scholar] [CrossRef] [PubMed]
- Tilvi, S.; Majik, M.S.; Singh, K.S. Mass spectrometry for determination of bioactive compounds. In Comprehensive Analytical Chemistry; Elsevier: Amsterdam, The Netherlands, 2014; Volume 65, pp. 193–218. [Google Scholar]
- Zhao, F.; Xu, J.; Chen, J.; Yan, X.; Zhou, C.; Li, S.; Xu, X.; Ye, F. Structural elucidation of two types of novel glycosphingolipids in three strains of Skeletonema by liquid chromatography coupled with mass spectrometry. Rapid Commun. Mass Spectrom. 2013, 27, 1535–1547. [Google Scholar] [CrossRef] [PubMed]
- Kushnerova, T.; Fomenko, S.; Kushnerova, N.; Sprygin, V.; Lesnikova, L.; Khotimchenko, Y.S.; Kondratieva, E. Antioxidant and membrane-protective properties of an extract from the brown alga Laminaria japonica. Russ. J. Mar. Biol. 2010, 36, 390–395. [Google Scholar] [CrossRef]
- Tabakaeva, O.; Tabakaev, A. Compositions of lipids and fatty acids from various parts of the brown alga Undaria pinnatifida. Chem. Nat. Compd. 2017, 53, 843–848. [Google Scholar] [CrossRef]
- Rashedy, S.H.; Abd El Hafez, M.S.; Dar, M.A.; Cotas, J.; Pereira, L. Evaluation and characterization of alginate extracted from brown seaweed collected in the Red Sea. Appl. Sci. 2021, 11, 6290. [Google Scholar] [CrossRef]
- Di Costanzo, F.; Di Dato, V.; Ianora, A.; Romano, G. Prostaglandins in marine organisms: A review. Mar. Drugs 2019, 17, 428. [Google Scholar] [CrossRef]
- Chakraborty, K.; Joseph, D. Antioxidant potential and phenolic compounds of brown seaweeds Turbinaria conoides and Turbinaria ornata (class: Phaeophyceae). J. Aquat. Food Prod. Technol. 2016, 25, 1249–1265. [Google Scholar] [CrossRef]
- Deyab, M.A.; Habbak, L.Z.; Ward, F.M. Antitumor activity of water extract and some fatty acids of Turbinaria ornata (Turner) J. Agardh. Egypt J. Exp. Biol. Bot. 2012, 8, 199–204. [Google Scholar]
- Zhang, H.; Oh, J.; Jang, T.-S.; Min, B.S.; Na, M. Glycolipids from the aerial parts of Orostachys japonicus with fatty acid synthase inhibitory and cytotoxic activities. Food Chem. 2012, 131, 1097–1103. [Google Scholar] [CrossRef]
- Sheu, J.-H.; Wang, G.-H.; Sung, P.-J.; Duh, C.-Y. New cytotoxic oxygenated fucosterols from the brown alga Turbinaria conoides. J. Nat. Prod. 1999, 62, 224–227. [Google Scholar] [CrossRef] [PubMed]
- Sheu, J.-H.; Wang, G.-H.; Sung, P.-J.; Chiu, Y.-H.; Duh, C.-Y. Cytotoxic sterols from the formosan brown alga Turbinaria ornata. Planta Med. 1997, 63, 571–572. [Google Scholar] [CrossRef] [PubMed]
- Liu, X.; Yang, R.; Xu, Q.; Zhou, M.; Feng, J.; Wang, G.; Lin, T.; Tian, W.; Chen, H. Tautomeric phytosterols from Vernonia amygdalina Delile and their anti-cervical cancer activity. Bioorg. Chem. 2022, 128, 106068. [Google Scholar] [CrossRef] [PubMed]
- Nocedo-Mena, D.; Rivas-Galindo, V.M.; Navarro, P.; Garza-González, E.; González-Maya, L.; Ríos, M.Y.; García, A.; Ávalos-Alanís, F.G.; Rodríguez-Rodríguez, J.; del Rayo Camacho-Corona, M. Antibacterial and cytotoxic activities of new sphingolipids and other constituents isolated from Cissus incisa leaves. Heliyon 2020, 6, e04671. [Google Scholar] [CrossRef]
- Hossain, Z.; Hosokawa, M.; Takahashi, K. Growth inhibition and induction of apoptosis of colon cancer cell lines by applying marine phospholipid. Nutr. Cancer 2008, 61, 123–130. [Google Scholar] [CrossRef] [PubMed]
- Mateos, R.; Pérez-Correa, J.R.; Domínguez, H. Bioactive properties of marine phenolics. Mar. Drugs 2020, 18, 501. [Google Scholar] [CrossRef]
- Shin, S.Y.; Yoon, H.; Ahn, S.; Kim, D.-W.; Bae, D.-H.; Koh, D.; Lee, Y.H.; Lim, Y. Structural properties of polyphenols causing cell cycle arrest at G1 phase in HCT116 human colorectal cancer cell lines. Int. J. Mol. Sci. 2013, 14, 16970–16985. [Google Scholar] [CrossRef]
- Anantharaju, P.G.; Gowda, P.C.; Vimalambike, M.G.; Madhunapantula, S.V. An overview on the role of dietary phenolics for the treatment of cancers. Nutr. J. 2016, 15, 99. [Google Scholar] [CrossRef] [PubMed]
- Jafari, S.; Saeidnia, S.; Abdollahi, M. Role of natural phenolic compounds in cancer chemoprevention via regulation of the cell cycle. Curr. Pharm. Biotechnol. 2014, 15, 409–421. [Google Scholar] [CrossRef] [PubMed]
- Mirza-Aghazadeh-Attari, M.; Ekrami, E.M.; Aghdas, S.A.M.; Mihanfar, A.; Hallaj, S.; Yousefi, B.; Safa, A.; Majidinia, M. Targeting PI3K/Akt/mTOR signaling pathway by polyphenols: Implication for cancer therapy. Life Sci. 2020, 255, 117481. [Google Scholar] [CrossRef]
- Burits, M.; Bucar, F. Antioxidant activity of Nigella sativa essential oil. Phytother. Res. 2000, 14, 323–328. [Google Scholar] [CrossRef]
- Re, R.; Pellegrini, N.; Proteggente, A.; Pannala, A.; Yang, M.; Rice-Evans, C. Antioxidant activity applying an improved ABTS radical cation decolorization assay. Free Radic. Biol. Med. 1999, 26, 1231–1237. [Google Scholar] [CrossRef]
- Dash, S.K.; Ghosh, T.; Roy, S.; Chattopadhyay, S.; Das, D. Zinc sulfide nanoparticles selectively induce cytotoxic and genotoxic effects on leukemic cells: Involvement of reactive oxygen species and tumor necrosis factor alpha. J. Appl. Toxicol. 2014, 34, 1130–1144. [Google Scholar] [CrossRef]
- Noser, A.A.; Shehadi, I.A.; Abdelmonsef, A.H.; Salem, M.M. Newly Synthesized Pyrazolinone Chalcones as Anticancer Agents via Inhibiting the PI3K/Akt/ERK1/2 Signaling Pathway. ACS Omega 2022, 7, 25265–25277. [Google Scholar] [CrossRef]
- Darzynkiewicz, Z.; Halicka, H.D.; Zhao, H. Analysis of cellular DNA content by flow and laser scanning cytometry. Adv. Exp. Med. Biol. 2010, 676, 137–147. [Google Scholar] [CrossRef] [PubMed]
- Kvastad, L.; Werne Solnestam, B.; Johansson, E.; Nygren, A.O.; Laddach, N.; Sahlén, P.; Vickovic, S.; Bendigtsen, S.C.; Aaserud, M.; Floer, L.; et al. Single cell analysis of cancer cells using an improved RT-MLPA method has potential for cancer diagnosis and monitoring. Sci. Rep. 2015, 5, 16519. [Google Scholar] [CrossRef]
- Livak, K.J.; Schmittgen, T.D. Analysis of Relative Gene Expression Data Using Real-Time Quantitative PCR and the 2−ΔΔCT Method. Methods 2001, 25, 402–408. [Google Scholar] [CrossRef]
- Mruk, D.D.; Cheng, C.Y. Enhanced chemiluminescence (ECL) for routine immunoblotting: An inexpensive alternative to commercially available kits. Spermatogenesis 2011, 1, 121–122. [Google Scholar] [CrossRef] [PubMed]
- Bradford, M.M. A rapid and sensitive method for the quantitation of microgram quantities of protein utilizing the principle of protein-dye binding. Anal. Biochem. 1976, 72, 248–254. [Google Scholar] [CrossRef] [PubMed]
Disclaimer/Publisher’s Note: The statements, opinions and data contained in all publications are solely those of the individual author(s) and contributor(s) and not of MDPI and/or the editor(s). MDPI and/or the editor(s) disclaim responsibility for any injury to people or property resulting from any ideas, methods, instructions or products referred to in the content. |
© 2023 by the authors. Licensee MDPI, Basel, Switzerland. This article is an open access article distributed under the terms and conditions of the Creative Commons Attribution (CC BY) license (https://creativecommons.org/licenses/by/4.0/).

