
Regulation of Inflammation-Mediated Endothelial to Mesenchymal Transition with Echinochrome a for Improving Myocardial Dysfunction

 , , , , ,
 ,
,  , and
, and 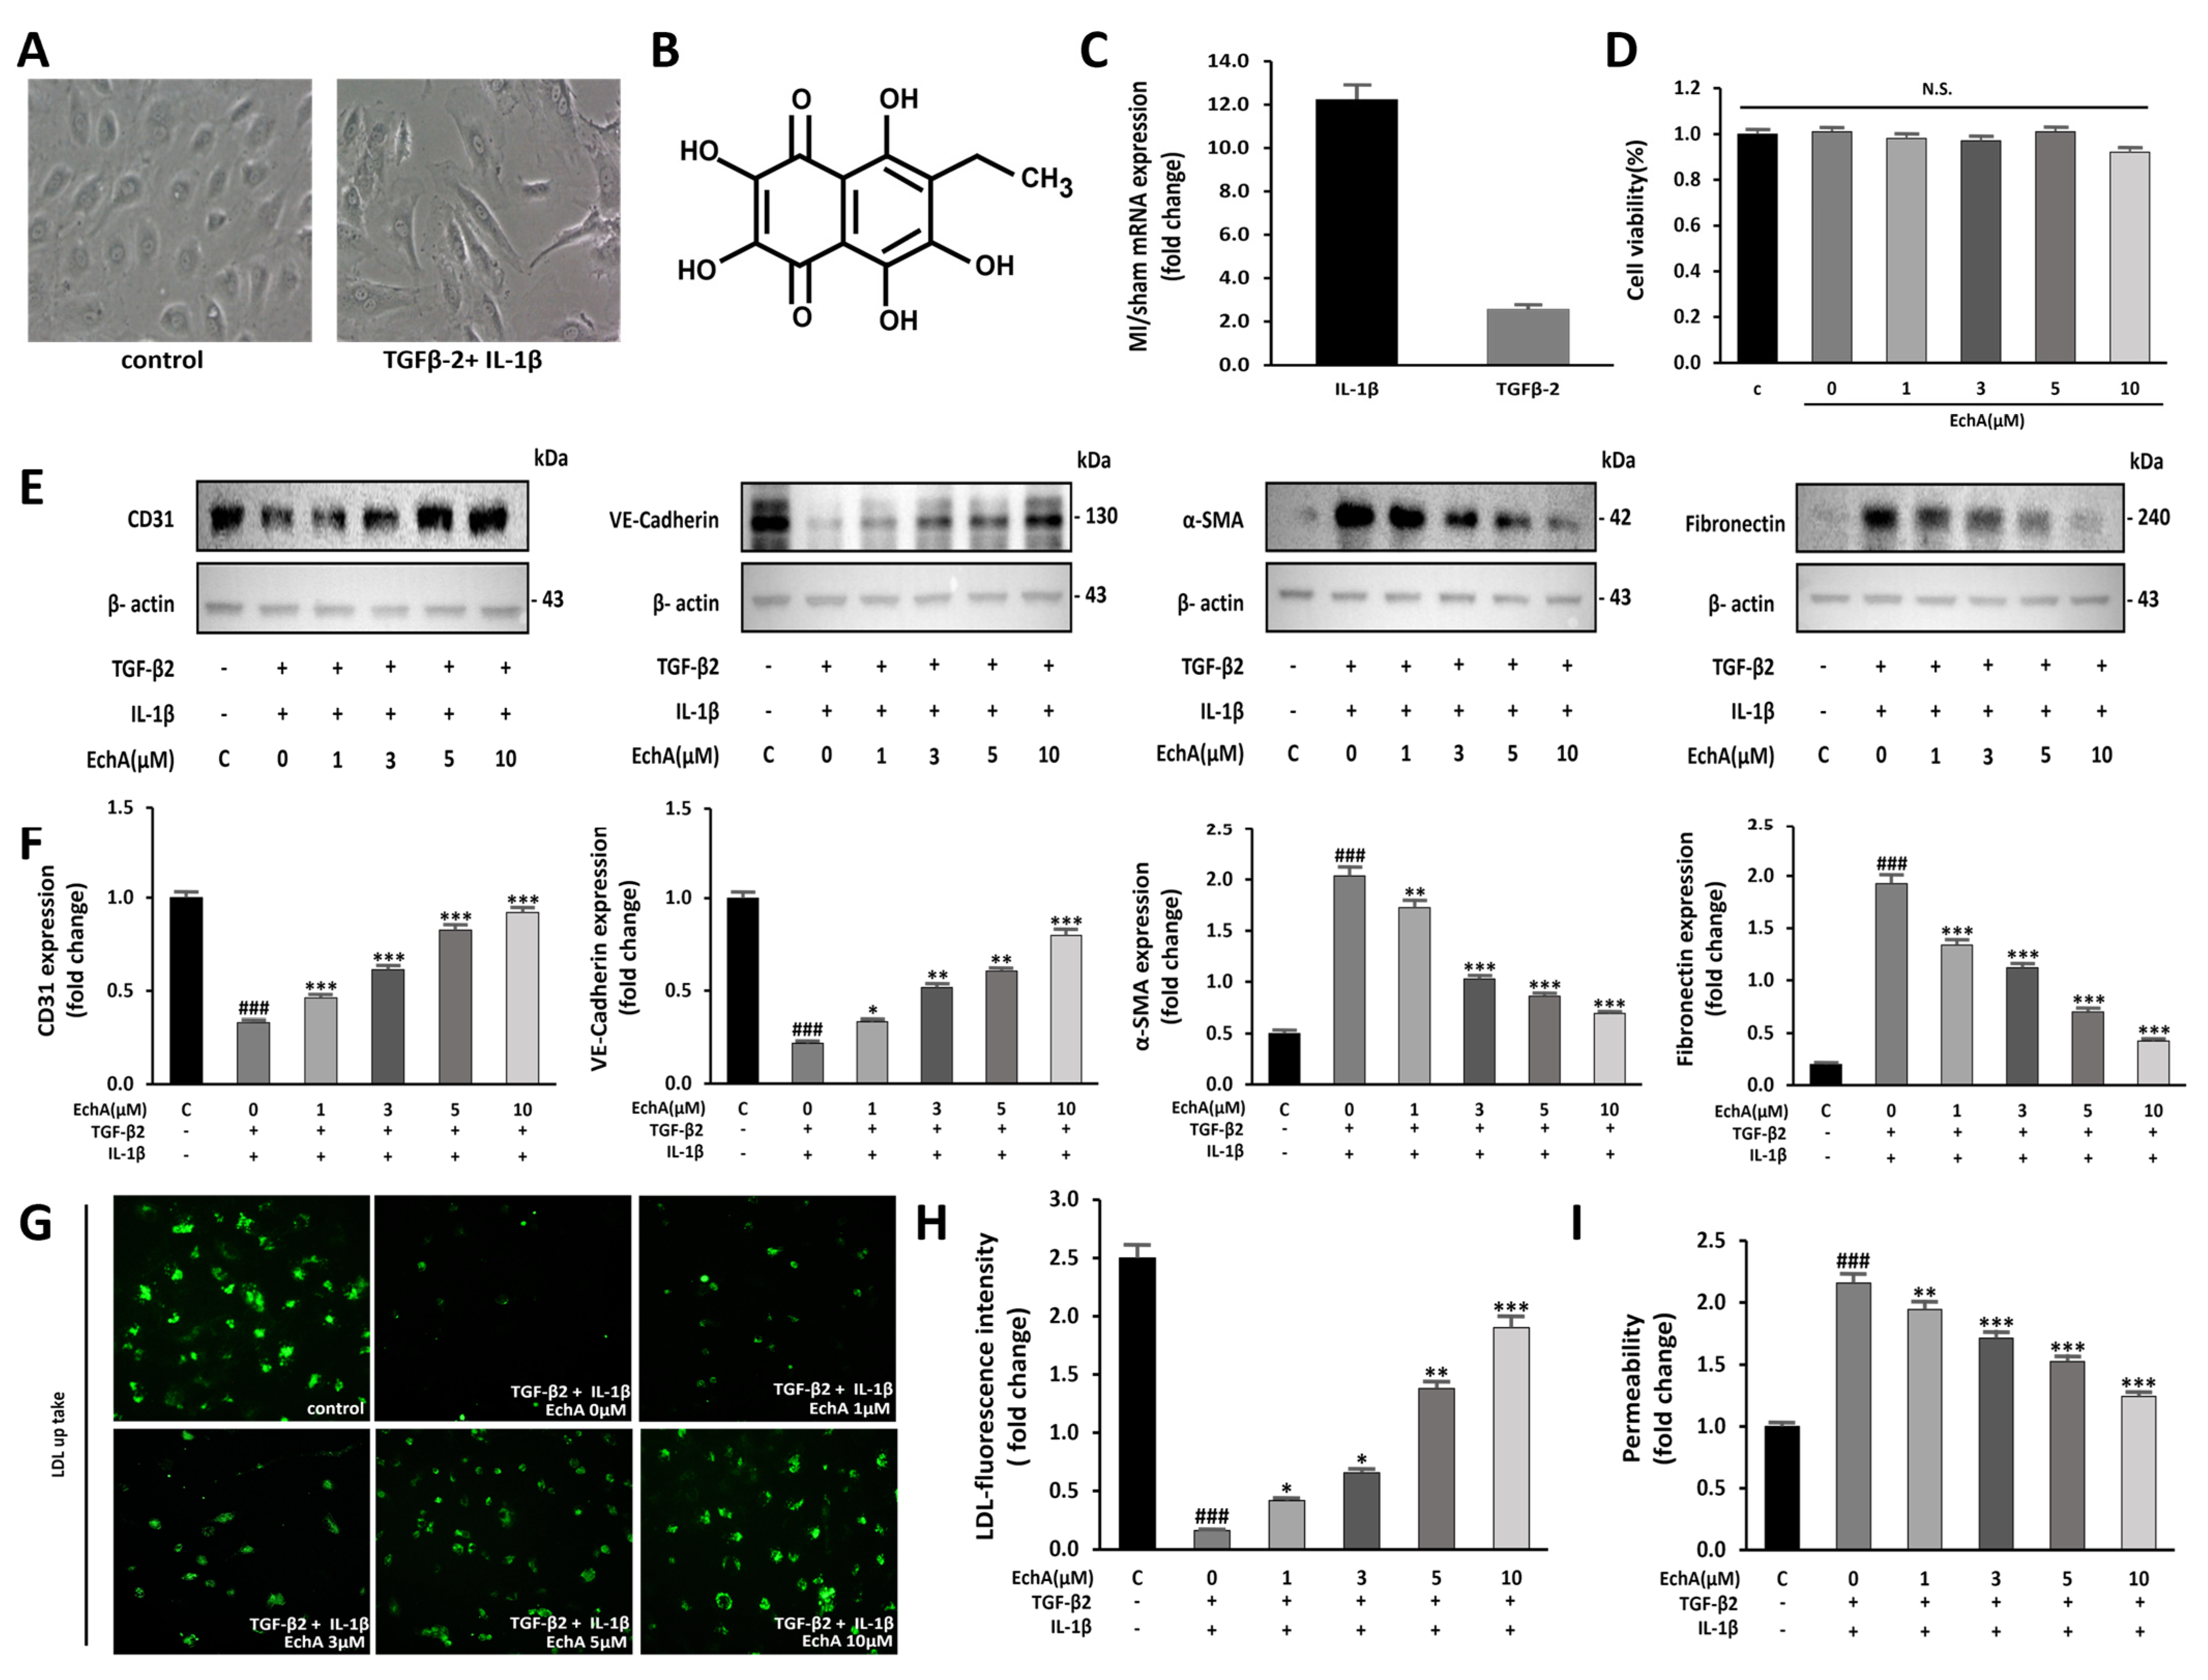
Abstract
1. Introduction
2. Results
2.1. EchA Inhibits EndMT Induced by TGF-β2 and IL-1β in HUVECs
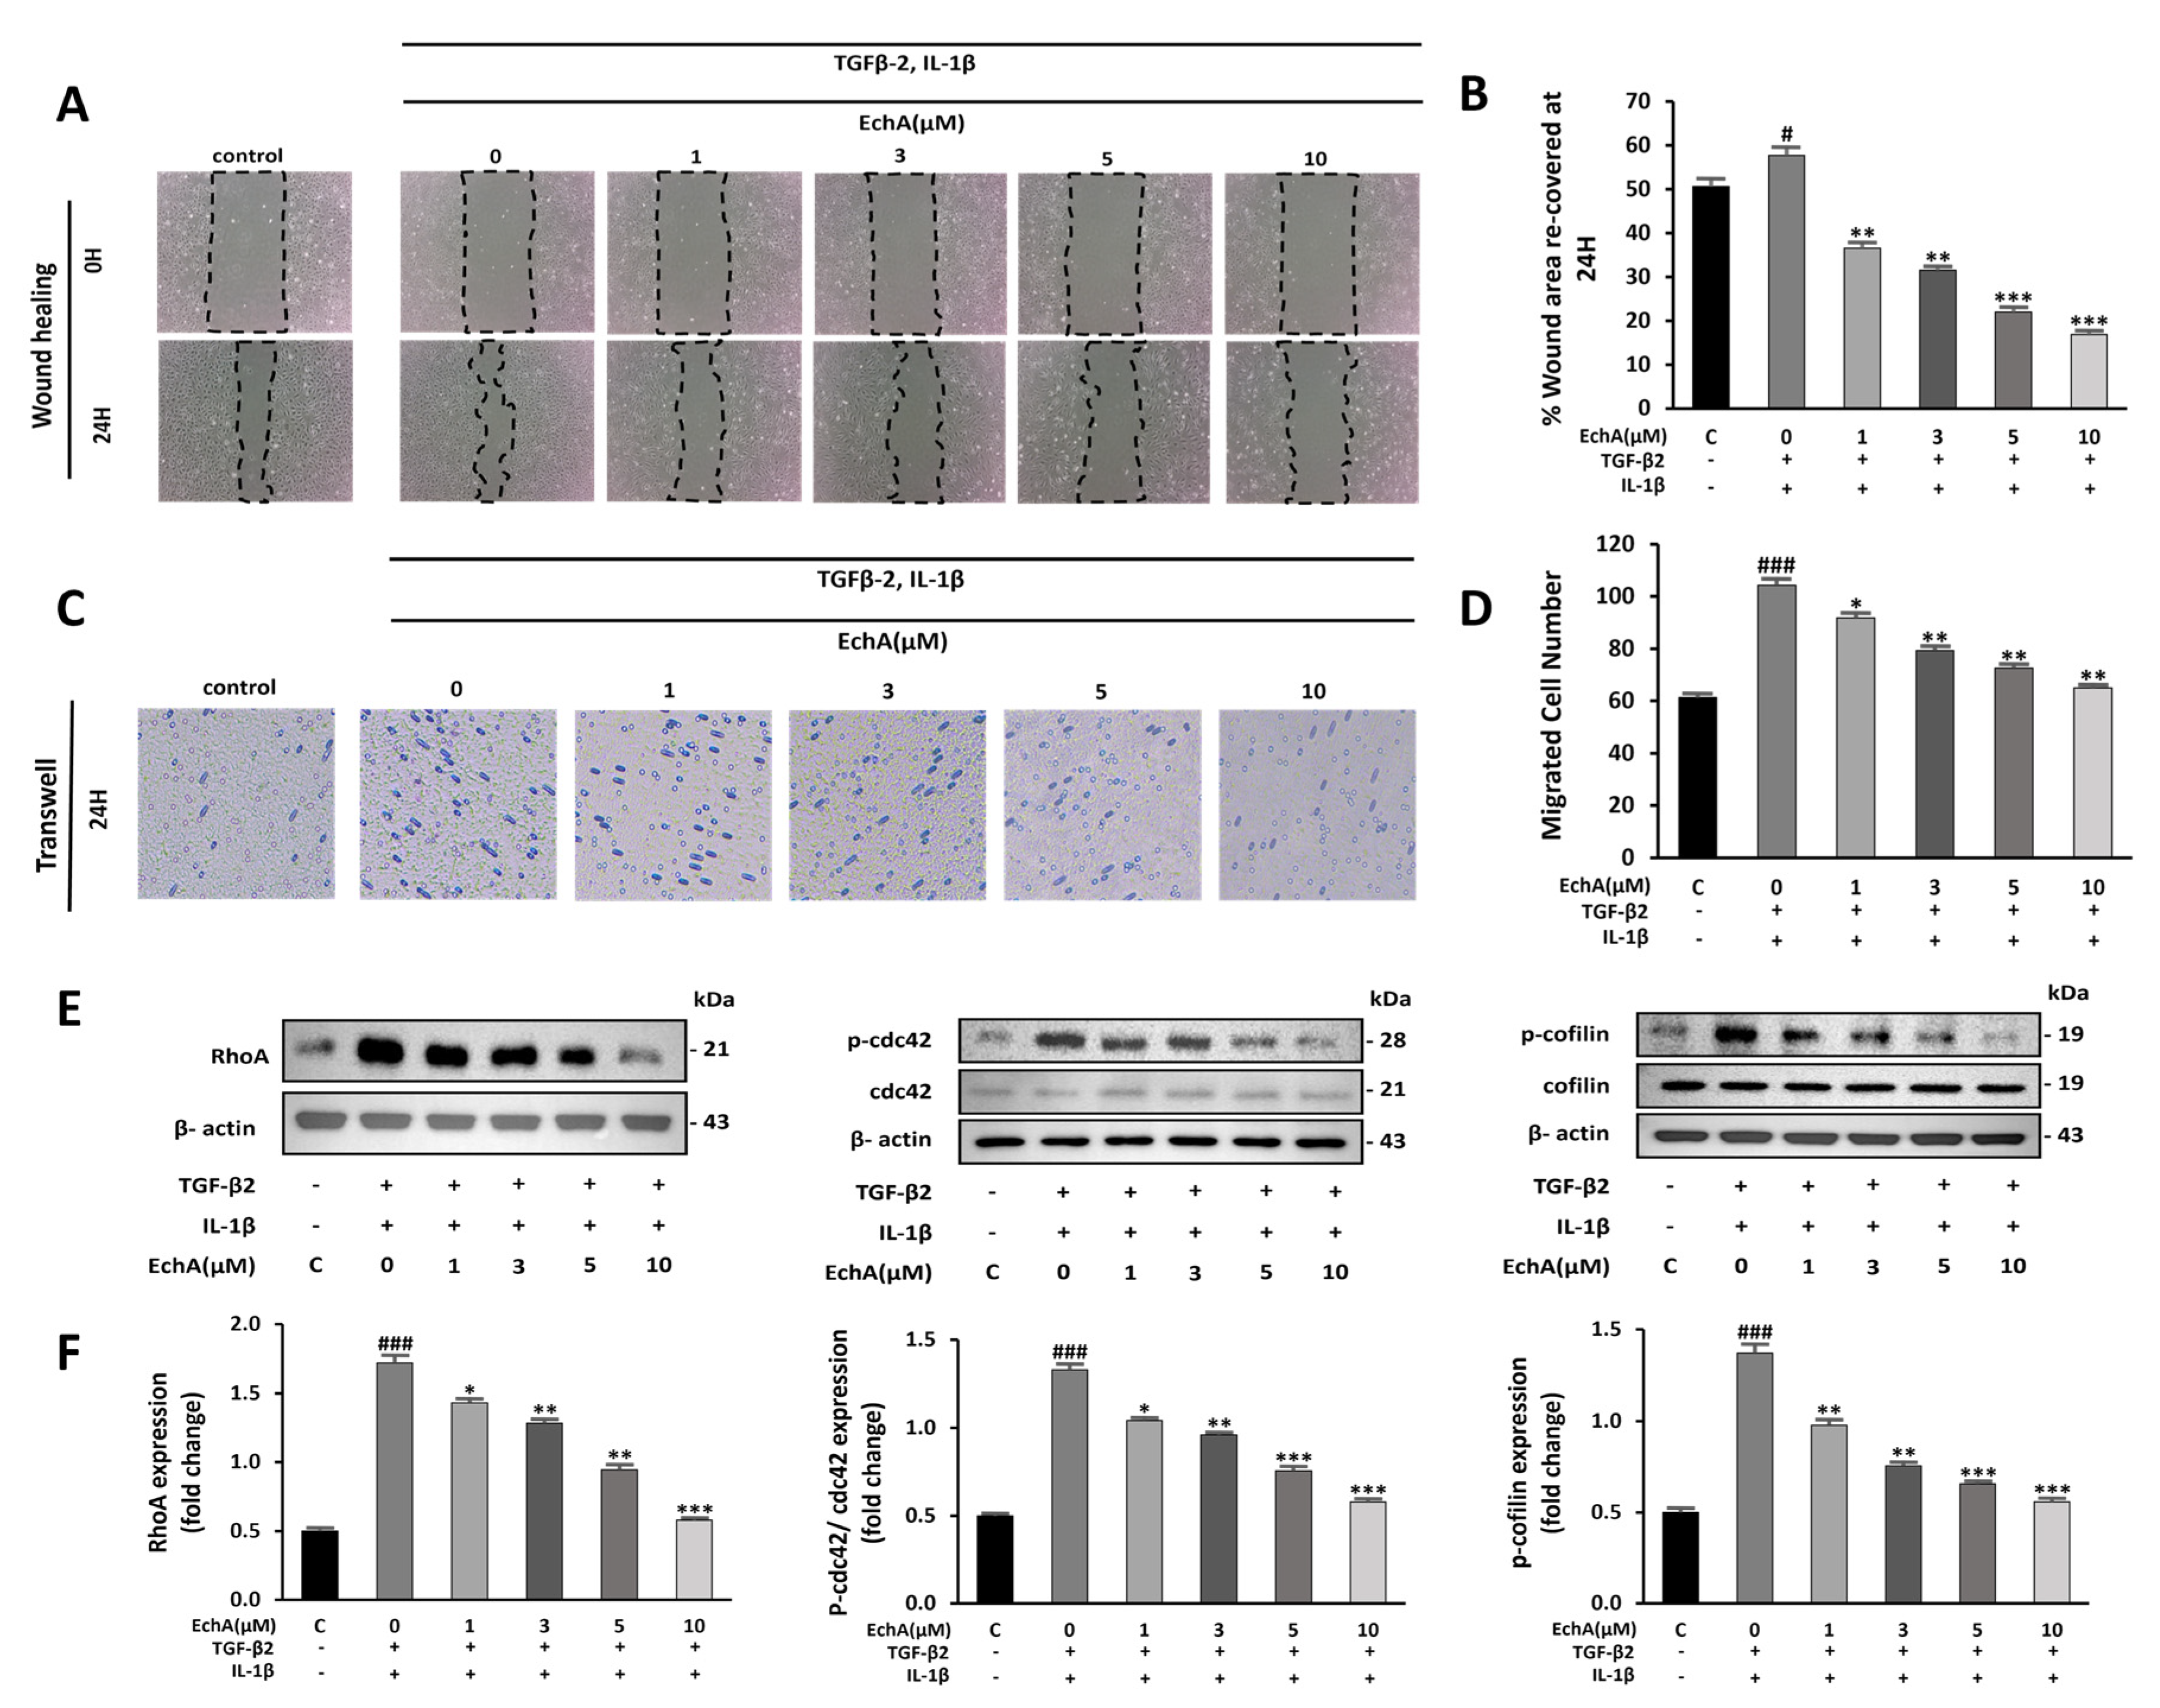
2.2. EchA Suppresses Cell Migration and Rho GTPase Pathway Activation
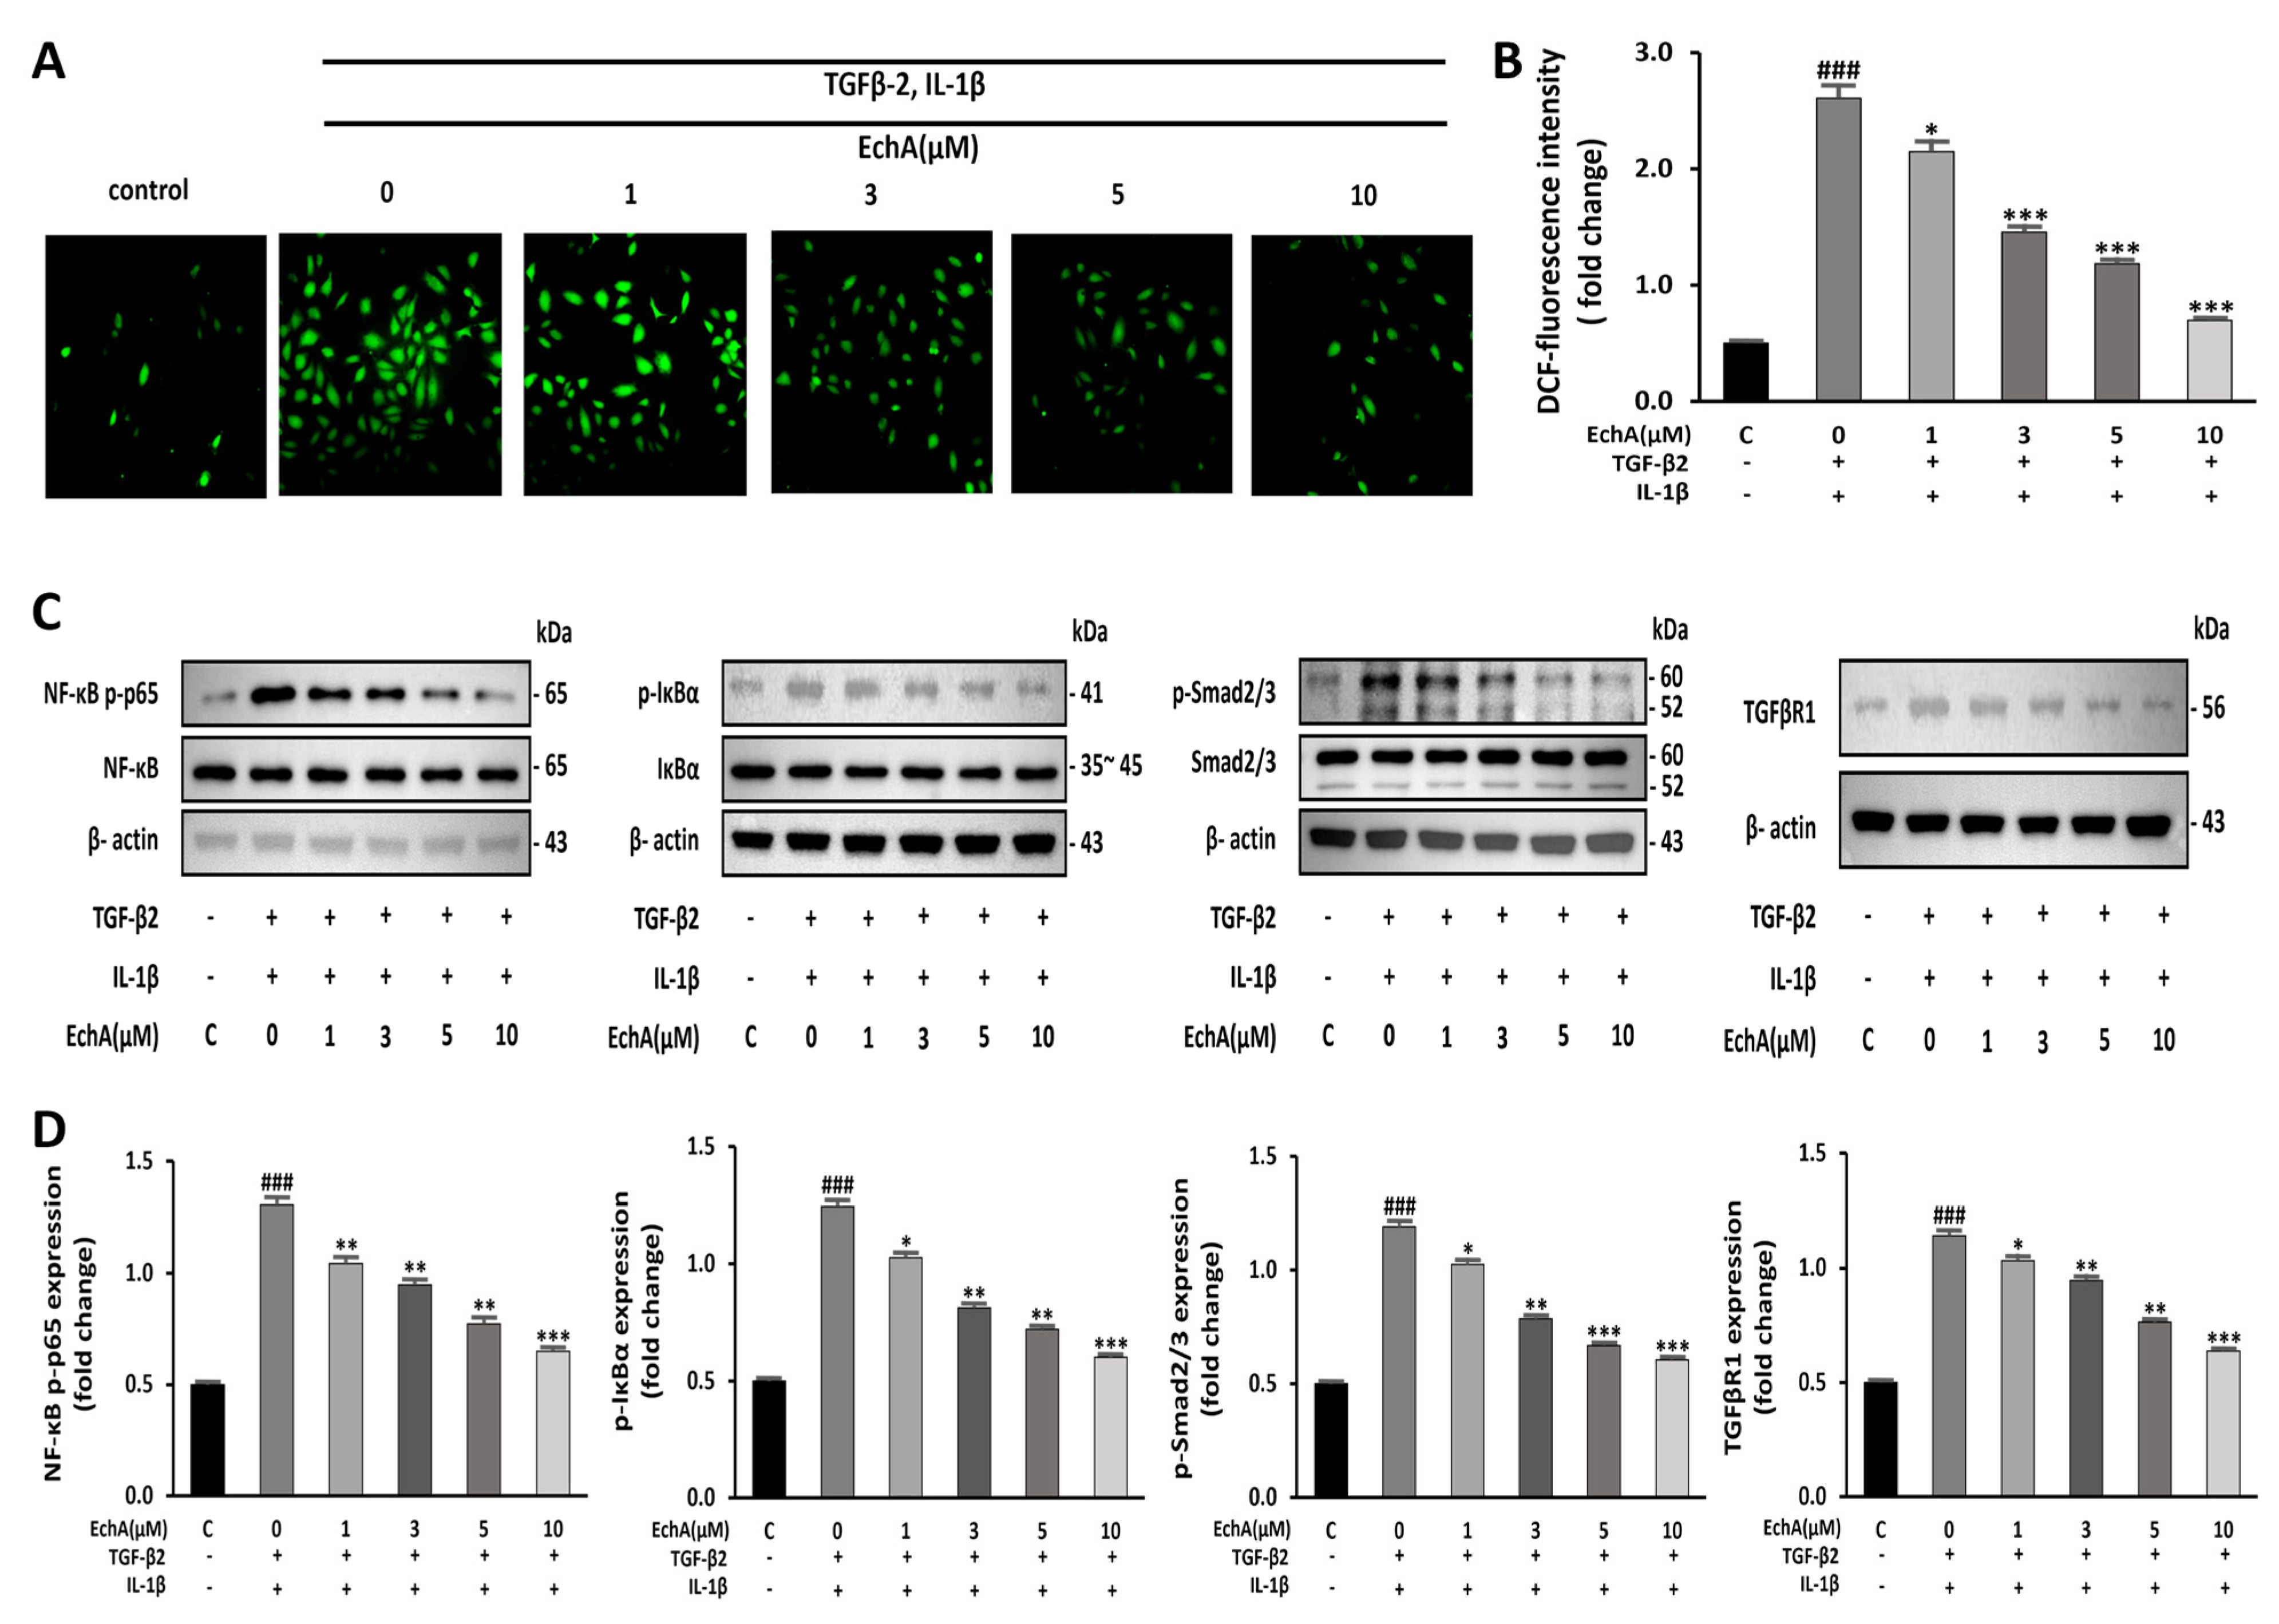
2.3. EchA Downregulates NF-κB and Smad Pathway and Reduces the Intracellular ROS Level
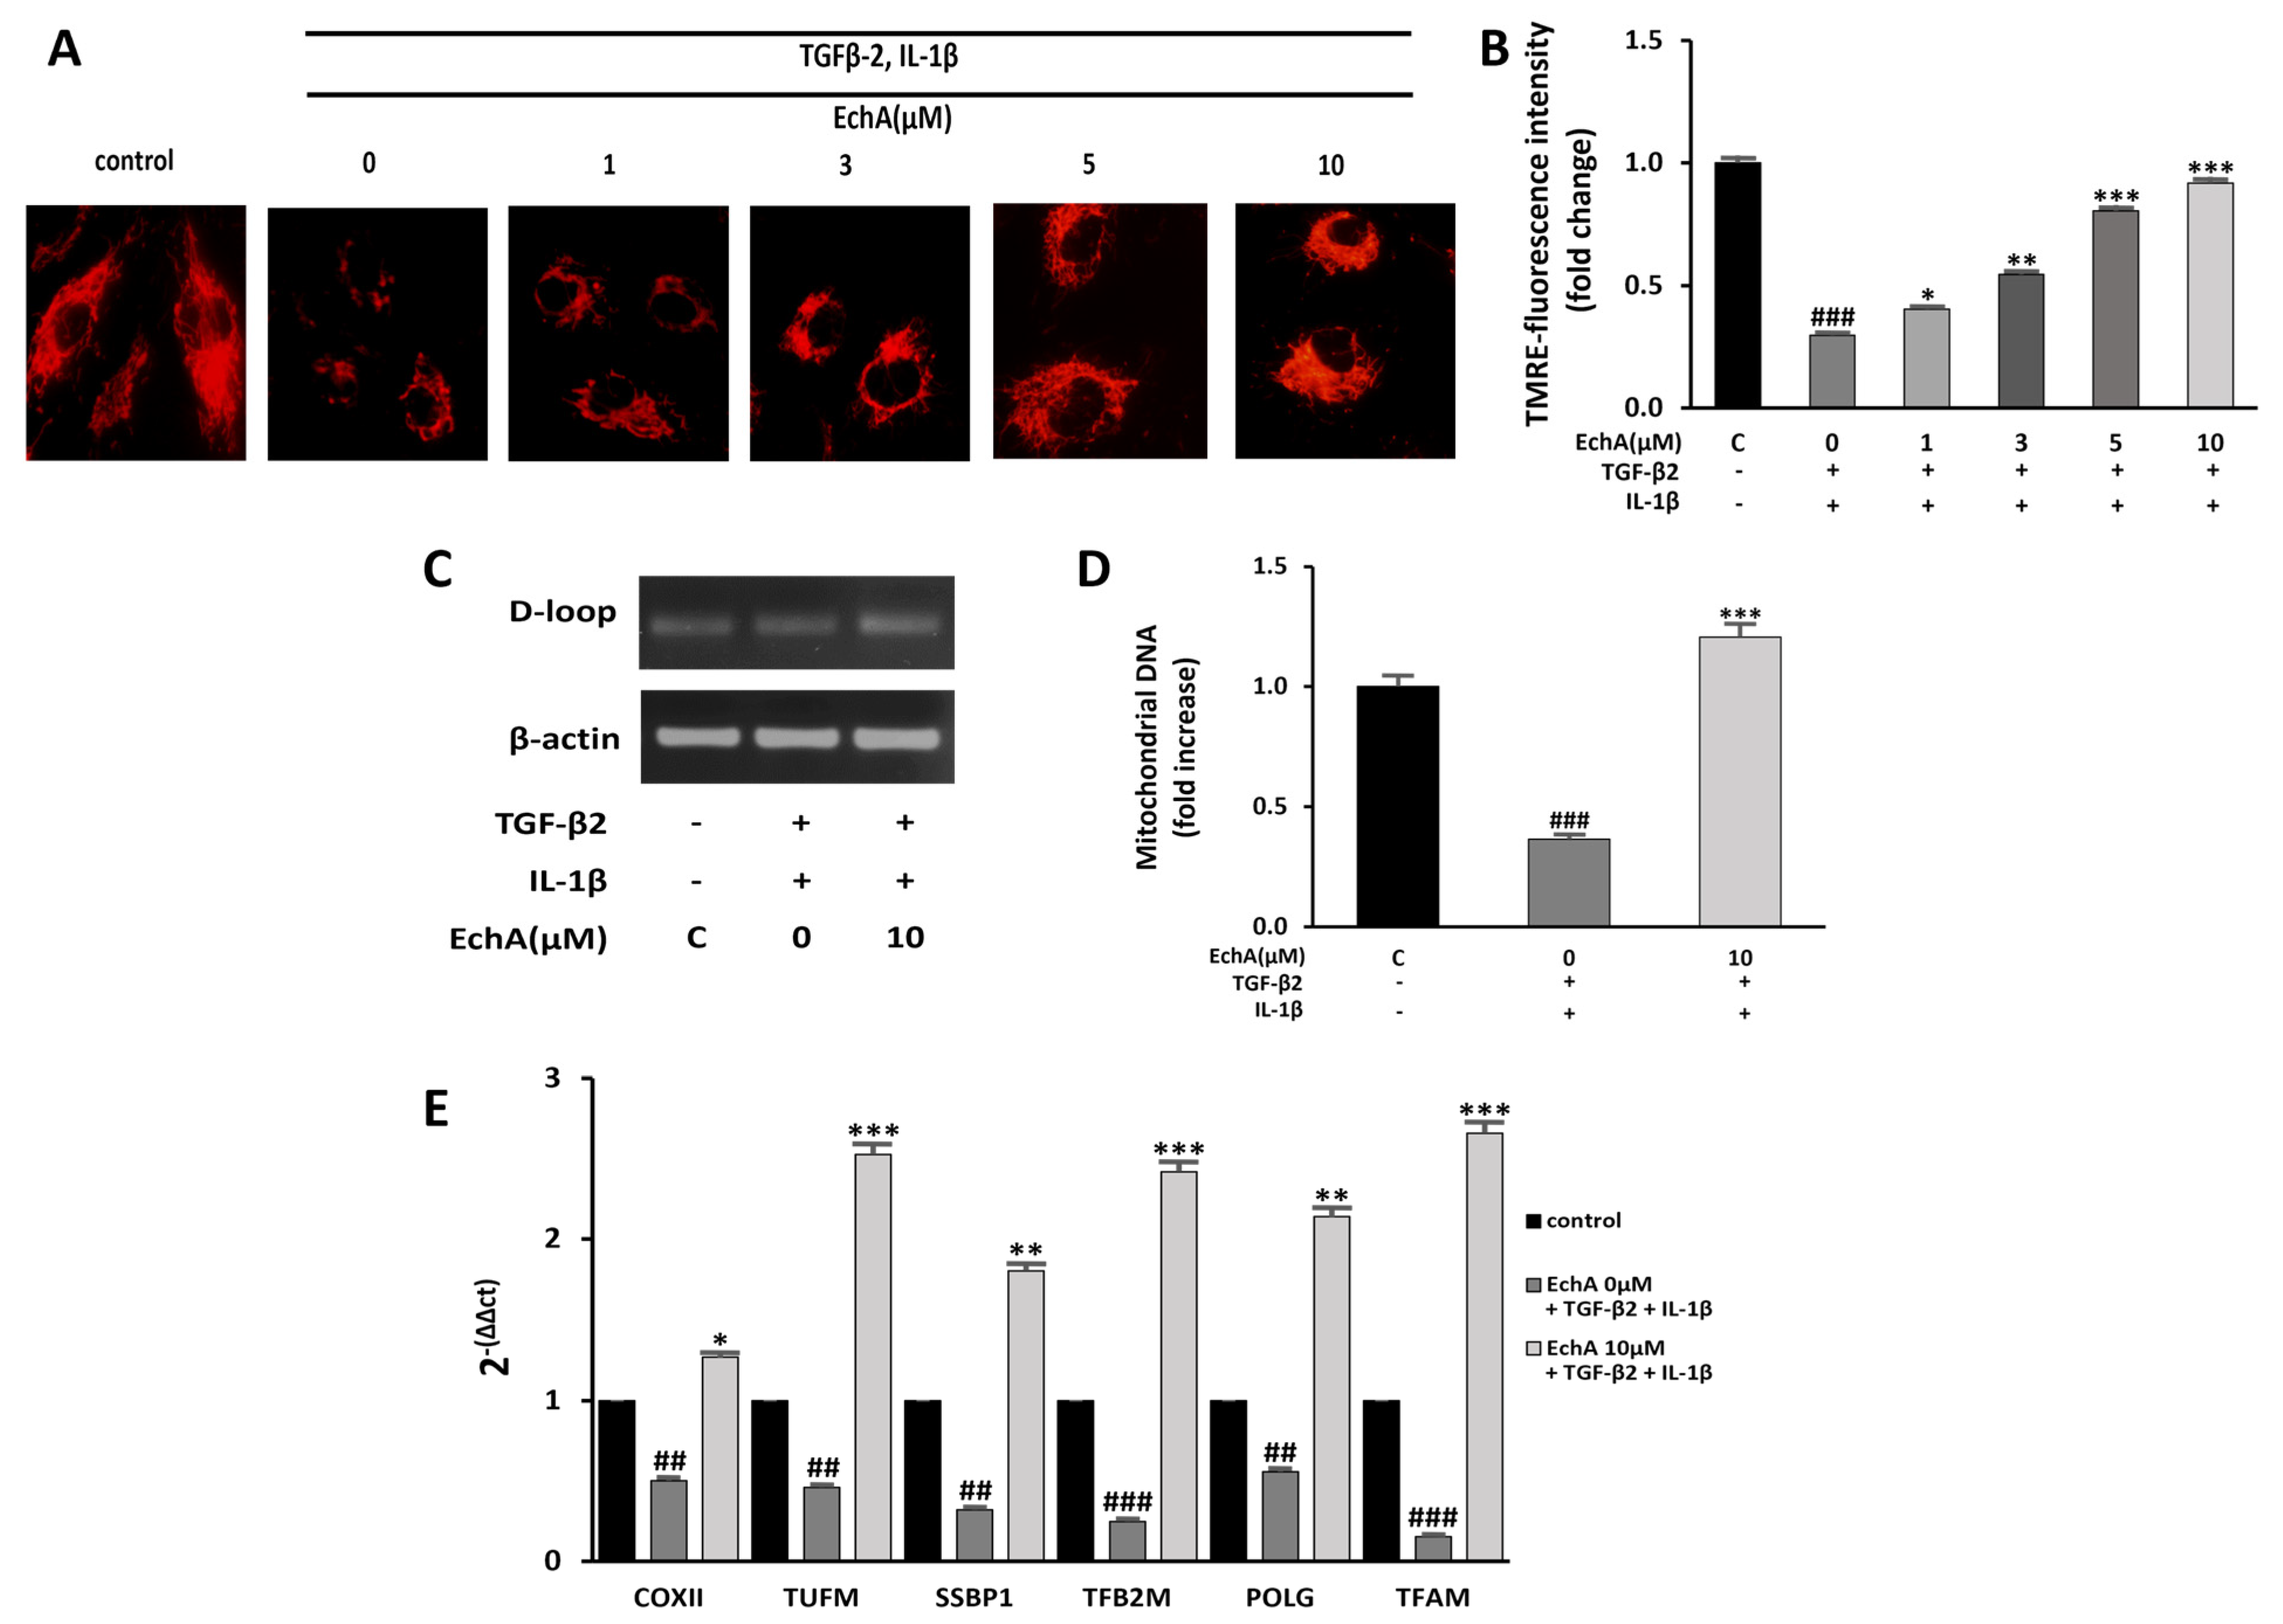
2.4. EchA Improves Mitochondrial Dysfunction of TGF-β2- and IL-1β-Induced EndMT in HUVECs
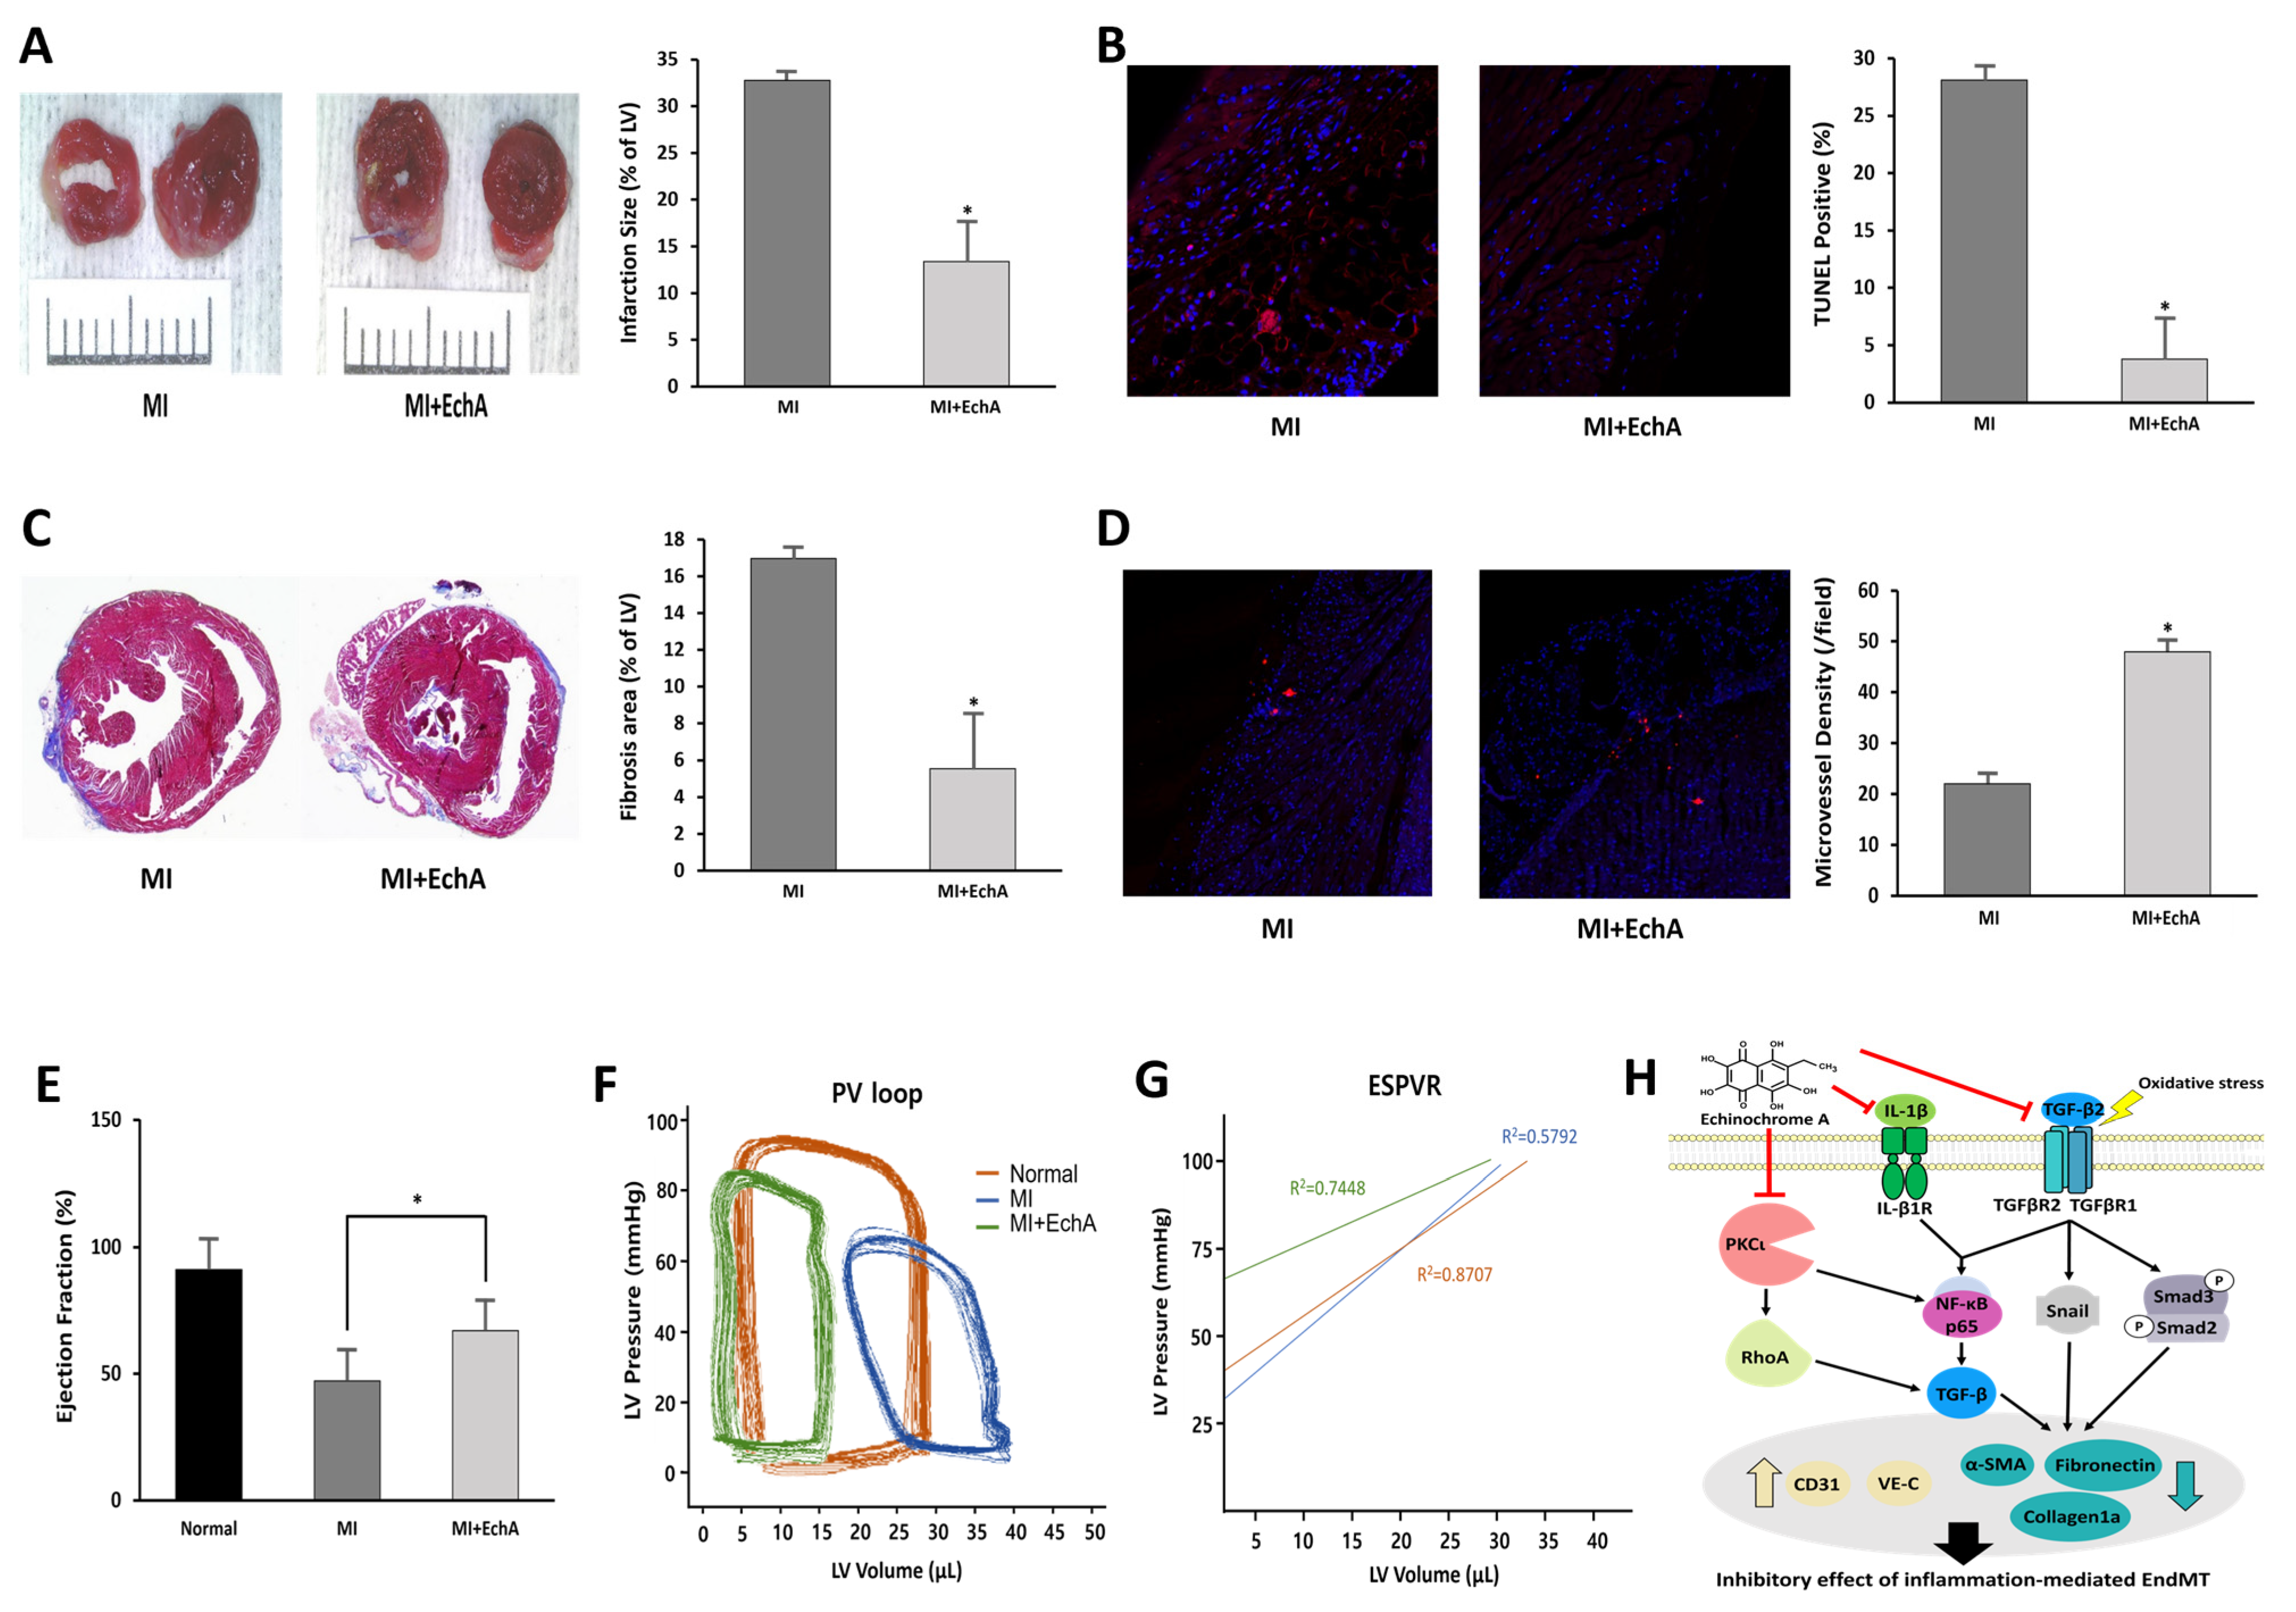
2.5. EchA Positively Regulates the EndMT Process in Ischemic Hearts
2.6. EchA Exerts Cardioprotective Effects by Preventing EndMT in Ischemic Hearts
3. Discussion
4. Materials and Methods
4.1. Cell Culture
4.2. Chemicals
4.3. EndMT Induction
4.4. Cell Viability Assay
4.5. Wound Healing Assay
4.6. Transwell Invasion Assay
4.7. Detection of Reactive Oxygen Species (ROS) Formation
4.8. Western Blot Analysis
4.9. Mitochondrial Membrane Potential Assay
4.10. Real Time PCR
4.11. Low-Density Lipoprotein (LDL) Uptake Assay
4.12. Permeability Assay
4.13. MI model and EchA Treatment
4.14. 2,3,5-Triphenyltetrazolium Chloride (TTC) Stain
4.15. Histology and Immunofluorescence
4.16. Cardiac Catheterization
4.17. Statistical Analysis
Supplementary Materials
Author Contributions
Funding
Institutional Review Board Statement
Data Availability Statement
Conflicts of Interest
References
- Aisagbonhi, O.; Rai, M.; Ryzhov, S.; Atria, N.; Feoktistov, I.; Hatzopoulos, A.K. Experimental myocardial infarction triggers canonical Wnt signaling and endothelial-to-mesenchymal transition. Dis. Model Mech. 2011, 4, 469–483. [Google Scholar] [CrossRef]
- Czubryt, M.P. Common threads in cardiac fibrosis, infarct scar formation, and wound healing. Fibrogenesis Tissue Repair 2012, 5, 19. [Google Scholar] [CrossRef]
- Tombor, L.S.; John, D.; Glaser, S.F.; Luxán, G.; Forte, E.; Furtado, M.; Rosenthal, N.; Baumgarten, N.; Schulz, M.H.; Wittig, J.; et al. Single cell sequencing reveals endothelial plasticity with transient mesenchymal activation after myocardial infarction. Nat. Commun. 2021, 12, 681. [Google Scholar] [CrossRef]
- Maleszewska, M.; Moonen, J.R.; Huijkman, N.; van de Sluis, B.; Krenning, G.; Harmsen, M.C. IL-1β and TGFβ2 synergistically induce endothelial to mesenchymal transition in an NFκB-dependent manner. Immunobiology 2013, 218, 443–454. [Google Scholar] [CrossRef]
- Li, Y.; Lui, K.O.; Zhou, B. Reassessing endothelial-to-mesenchymal transition in cardiovascular diseases. Nat. Rev. Cardiol. 2018, 15, 445–456. [Google Scholar] [CrossRef]
- Chen, Q.; Zhang, H.; Liu, Y.; Adams, S.; Eilken, H.; Stehling, M.; Corada, M.; Dejana, E.; Zhou, B.; Adams, R.H. Endothelial cells are progenitors of cardiac pericytes and vascular smooth muscle cells. Nat. Commun. 2016, 7, 12422. [Google Scholar] [CrossRef]
- Xiao, L.; Dudley, A.C. Fine-tuning vascular fate during endothelial-mesenchymal transition. J. Pathol. 2017, 241, 25–35. [Google Scholar] [CrossRef]
- Zeisberg, E.M.; Tarnavski, O.; Zeisberg, M.; Dorfman, A.L.; McMullen, J.R.; Gustafsson, E.; Chandraker, A.; Yuan, X.; Pu, W.T.; Roberts, A.B.; et al. Endothelial-to-mesenchymal transition contributes to cardiac fibrosis. Nat. Med. 2007, 13, 952–961. [Google Scholar] [CrossRef]
- Chen, P.Y.; Qin, L.; Baeyens, N.; Li, G.; Afolabi, T.; Budatha, M.; Tellides, G.; Schwartz, M.A.; Simons, M. Endothelial-to-mesenchymal transition drives atherosclerosis progression. J. Clin. Investig. 2015, 125, 4514–4528. [Google Scholar] [CrossRef]
- Evrard, S.M.; Lecce, L.; Michelis, K.C.; Nomura-Kitabayashi, A.; Pandey, G.; Purushothaman, K.R.; d’Escamard, V.; Li, J.R.; Hadri, L.; Fujitani, K.; et al. Endothelial to mesenchymal transition is common in atherosclerotic lesions and is associated with plaque instability. Nat. Commun. 2016, 7, 11853. [Google Scholar] [CrossRef]
- Caturano, A.; Vetrano, E.; Galiero, R.; Salvatore, T.; Docimo, G.; Efifani, R.; Alfano, M.; Sardu, C.; Marfella, R.; Rinaldi, L.; et al. Cardiac Hypertrophy: From Pathophysiological Mechanisms to Heart Failure Development. Rev. Cardiovasc. Med. 2021, 23, 165. [Google Scholar] [CrossRef]
- Salvatore, T.; Galiero, R.; Caturano, A.; Vetrano, E.; Rinaldi, L.; Coviello, F.; Di Martino, A.; Albanese, G.; Marfella, R.; Sardu, C.; et al. Effects of metformin in heart failure: From pathophysiological rationale to clinical evidence. Biomolecules 2021, 11, 1834. [Google Scholar] [CrossRef] [PubMed]
- Lebedev, A.V.; Levitskaya, E.L.; Tikhonova, E.V.; Ivanova, M.V. Antioxidant properties, autooxidation, and mutagenic activity of echinochrome a compared with its etherified derivative. Biochemistry 2001, 66, 885–893. [Google Scholar] [PubMed]
- Lennikov, A.; Kitaichi, N.; Noda, K.; Mizuuchi, K.; Ando, R.; Dong, Z.; Fukuhara, J.; Kinoshita, S.; Namba, K.; Ohno, S.; et al. Amelioration of endotoxin-induced uveitis treated with the sea urchin pigment echinochrome in rats. Mol. Vis. 2014, 20, 171–177. [Google Scholar]
- Jeong, S.H.; Kim, H.K.; Song, I.S.; Lee, S.J.; Ko, K.S.; Rhee, B.D.; Kim, N.; Mishchenko, N.P.; Fedoryev, S.A.; Stonik, V.A.; et al. Echinochrome A protects mitochondrial function in cardiomyocytes against cardiotoxic drugs. Mar. Drugs 2014, 12, 2922–2936. [Google Scholar] [CrossRef]
- Kim, H.K.; Youm, J.B.; Jeong, S.H.; Lee, S.R.; Song, I.S.; Ko, T.H.; Pronto, J.R.; Ko, K.S.; Rhee, B.D.; Kim, N.; et al. Echinochrome A regulates phosphorylation of phospholamban Ser16 and Thr17 suppressing cardiac SERCA2A Ca²⁺ reuptake. Pflügers Arch.-Eur. J. Physiol. 2015, 467, 2151–2163. [Google Scholar] [CrossRef]
- Yoon, C.S.; Kim, H.K.; Mishchenko, N.P.; Vasileva, E.A.; Fedoreyev, S.A.; Stonik, V.A.; Han, J. Spinochrome D Attenuates Doxorubicin-Induced Cardiomyocyte Death via Improving Glutathione Metabolism and Attenuating Oxidative Stress. Mar. Drugs 2018, 17, 2. [Google Scholar] [CrossRef]
- Kim, H.K.; Cho, S.W.; Heo, H.J.; Jeong, S.H.; Kim, M.; Ko, K.S.; Rhee, B.D.; Mishchenko, N.P.; Vasileva, E.A.; Fedoreyev, S.A.; et al. A Novel Atypical PKC-Iota Inhibitor, Echinochrome A, Enhances Cardiomyocyte Differentiation from Mouse Embryonic Stem Cells. Mar. Drugs 2018, 16, 192. [Google Scholar] [CrossRef]
- Kim, H.K.; Vasileva, E.A.; Mishchenko, N.P.; Fedoreyev, S.A.; Han, J. Multifaceted Clinical Effects of Echinochrome. Mar. Drugs 2021, 19, 412. [Google Scholar] [CrossRef] [PubMed]
- Cooley, B.C.; Nevado, J.; Mellad, J.; Yang, D.; St Hilaire, C.; Negro, A.; Fang, F.; Chen, G.; San, H.; Walts, A.D.; et al. TGF-β signaling mediates endothelial-to-mesenchymal transition (EndMT) during vein graft remodeling. Sci. Transl. Med. 2014, 6, 227ra34. [Google Scholar] [CrossRef]
- Mihira, H.; Suzuki, H.I.; Akatsu, Y.; Yoshimatsu, Y.; Igarashi, T.; Miyazono, K.; Watabe, T. TGF-β-induced mesenchymal transition of MS-1 endothelial cells requires Smad-dependent cooperative activation of Rho signals and MRTF-A. J. Biochem. 2012, 151, 145–156. [Google Scholar] [CrossRef] [PubMed]
- Mahler, G.J.; Farrar, E.J.; Butcher, J.T. Inflammatory cytokines promote mesenchymal transformation in embryonic and adult valve endothelial cells. Arterioscler. Thromb. Vasc. Biol. 2013, 33, 121–130. [Google Scholar] [CrossRef] [PubMed]
- Tian, Y.; He, Y.; Zhang, L.; Zhang, J.; Xu, L.; Ma, Y.; Xu, X.; Wei, L. Role of vasodilator-stimulated phosphoprotein in human cytomegalovirus-induced hyperpermeability of human endothelial cells. Exp. Ther. Med. 2018, 16, 1295–1303. [Google Scholar] [CrossRef] [PubMed]
- Li, X.; Zhang, W.; Cao, Q.; Wang, Z.; Zhao, M.; Xu, L.; Zhuang, Q. Mitochondrial dysfunction in fibrotic diseases. Cell Death Discov. 2020, 6, 80. [Google Scholar] [CrossRef]
- Shu, D.Y.; Butcher, E.R.; Saint-Geniez, M. Suppression of PGC-1α Drives Metabolic Dysfunction in TGFβ2-Induced EMT of Retinal Pigment Epithelial Cells. Int. J. Mol. Sci. 2021, 22, 4701. [Google Scholar] [CrossRef]
- Yi, E.Y.; Park, S.Y.; Jung, S.Y.; Jang, W.J.; Kim, Y.J. Mitochondrial dysfunction induces EMT through the TGF-β/Smad/Snail signaling pathway in Hep3B hepatocellular carcinoma cells. Int. J. Oncol. 2015, 47, 1845–1853. [Google Scholar] [CrossRef]
- Sun, X.; Lu, Q.; Yegambaram, M.; Kumar, S.; Qu, N.; Srivastava, A.; Wang, T.; Fineman, J.R.; Black, S.M. TGF-β1 attenuates mitochondrial bioenergetics in pulmonary arterial endothelial cells via the disruption of carnitine homeostasis. Redox Biol. 2020, 36, 101593. [Google Scholar] [CrossRef]
- Jeong, S.H.; Kim, H.K.; Song, I.S.; Noh, S.J.; Marquez, J.; Ko, K.S.; Rhee, B.D.; Kim, N.; Mishchenko, N.P.; Fedoreyev, S.A.; et al. Echinochrome a increases mitochondrial mass and function by modulating mitochondrial biogenesis regulatory genes. Mar. Drugs 2014, 12, 4602–4615. [Google Scholar] [CrossRef]
- Kovacic, J.C.; Dimmeler, S.; Harvey, R.P.; Finkel, T.; Aikawa, E.; Krenning, G.; Baker, A.H. Endothelial to Mesenchymal Transition in Cardiovascular Disease: JACC State-of-the-Art Review. J. Am. Coll. Cardiol. 2019, 73, 190–209. [Google Scholar] [CrossRef]
- Frantz, S.; Hu, K.; Adamek, A.; Wolf, J.; Sallam, A.; Maier, S.K.; Lonning, S.; Ling, H.; Ertl, G.; Bauersachs, J. Transforming growth factor beta inhibition increases mortality and left ventricular dilatation after myocardial infarction. Basic Res. Cardiol. 2008, 103, 485–492. [Google Scholar] [CrossRef]
- Ma, Y.; Iyer, R.P.; Jung, M.; Czubryt, M.P.; Lindsey, M.L. Cardiac Fibroblast Activation Post-Myocardial Infarction: Current Knowledge Gaps. Trends Pharmacol. Sci. 2017, 38, 448–458. [Google Scholar] [CrossRef]
- Manavski, Y.; Lucas, T.; Glaser, S.F.; Dorsheimer, L.; Günther, S.; Braun, T.; Rieger, M.A.; Zeiher, A.M.; Boon, R.A.; Dimmeler, S. Clonal Expansion of Endothelial Cells Contributes to Ischemia-Induced Neovascularization. Circ. Res. 2018, 122, 670–677. [Google Scholar] [CrossRef]
- Doerr, M.; Morrison, J.; Bergeron, L.; Coomber, B.L.; Viloria-Petit, A. Differential effect of hypoxia on early endothelial-mesenchymal transition response to transforming growth beta isoforms 1 and 2. Microvasc. Res. 2016, 108, 48–63. [Google Scholar] [CrossRef]
- Zeisberg, M.; Neilson, E.G. Biomarkers for epithelial-mesenchymal transitions. J. Clin. Investig. 2009, 119, 1429–1437. [Google Scholar] [CrossRef]
- Elliott, G.C.; Gurtu, R.; McCollum, C.; Newman, W.G.; Wang, T. Foramen ovale closure is a process of endothelial-to-mesenchymal transition leading to fibrosis. PLoS ONE 2014, 9, e107175. [Google Scholar] [CrossRef]
- Edgley, A.J.; Krum, H.; Kelly, D.J. Targeting fibrosis for the treatment of heart failure: A role for transforming growth factor-β. Cardiovasc. Ther. 2012, 30, e30–e40. [Google Scholar] [CrossRef]
- Bansal, R.; Nakagawa, S.; Yazdani, S.; van Baarlen, J.; Venkatesh, A.; Koh, A.P.; Song, W.M.; Goossens, N.; Watanabe, H.; Beasley, M.B.; et al. Integrin alpha 11 in the regulation of the myofibroblast phenotype: Implications for fibrotic diseases. Exp. Mol. Med. 2017, 49, e396. [Google Scholar] [CrossRef]
- Ma, J.; Sanchez-Duffhues, G.; Goumans, M.J.; Ten Dijke, P. TGF-β-Induced Endothelial to Mesenchymal Transition in Disease and Tissue Engineering. Front. Cell Dev. Biol. 2020, 8, 260. [Google Scholar] [CrossRef]
- Crawford, J.R.; Haudek, S.B.; Cieslik, K.A.; Trial, J.; Entman, M.L. Origin of developmental precursors dictates the pathophysiologic role of cardiac fibroblasts. J. Cardiovasc. Transl. Res. 2012, 5, 749–759. [Google Scholar] [CrossRef]
- Streef, T.J.; Smits, A.M. Epicardial Contribution to the Developing and Injured Heart: Exploring the Cellular Composition of the Epicardium. Front. Cardiovasc. Med. 2021, 8, 750243. [Google Scholar] [CrossRef]
- Kim, R.; Song, B.W.; Kim, M.; Kim, W.J.; Lee, H.W.; Lee, M.Y.; Kim, J.; Chang, W. Regulation of alternative macrophage activation by MSCs derived hypoxic conditioned medium, via the TGF-β1/Smad3 pathway. BMB Rep. 2020, 53, 600–604. [Google Scholar] [CrossRef]
- Kim, R.; Lee, S.; Lee, J.; Kim, M.; Kim, W.J.; Lee, H.W.; Lee, M.Y.; Kim, J.; Chang, W. Exosomes derived from microRNA-584 transfected mesenchymal stem cells: Novel alternative therapeutic vehicles for cancer therapy. BMB Rep. 2018, 51, 406–411. [Google Scholar] [CrossRef]
- Lee, A.; McLean, D.; Choi, J.; Kang, H.; Chang, W.; Kim, J. Therapeutic implications of microRNAs in pulmonary arterial hypertension. BMB Rep. 2014, 47, 311–317. [Google Scholar] [CrossRef]
- Kim, J.D.; Lee, A.; Choi, J.; Park, Y.; Kang, H.; Chang, W.; Lee, M.S.; Kim, J. Epigenetic modulation as a therapeutic approach for pulmonary arterial hypertension. Exp. Mol. Med. 2015, 47, e175. [Google Scholar] [CrossRef]
- He, J.; Xu, Y.; Koya, D.; Kanasaki, K. Role of the endothelial-to-mesenchymal transition in renal fibrosis of chronic kidney disease. Clin. Exp. Nephrol. 2013, 17, 488–497. [Google Scholar] [CrossRef]
- Li, A.; Peng, W.; Xia, X.; Li, R.; Wang, Y.; Wei, D. Endothelial-to-Mesenchymal Transition: A Potential Mechanism for Atherosclerosis Plaque Progression and Destabilization. DNA Cell Biol. 2017, 36, 883–891. [Google Scholar] [CrossRef]
- Guan, S.; Zhou, J. CXCR7 attenuates the TGF-β-induced endothelial-to-mesenchymal transition and pulmonary fibrosis. Mol. Biosyst. 2017, 13, 2116–2124. [Google Scholar] [CrossRef]
- Maddaluno, L.; Rudini, N.; Cuttano, R.; Bravi, L.; Giampietro, C.; Corada, M.; Ferrarini, L.; Orsenigo, F.; Papa, E.; Boulday, G.; et al. EndMT contributes to the onset and progression of cerebral cavernous malformations. Nature 2013, 498, 492–496. [Google Scholar] [CrossRef]
- Yoshimatsu, Y.; Watabe, T. Emerging roles of inflammation-mediated endothelial-mesenchymal transition in health and disease. Inflamm. Regen. 2022, 42, 9. [Google Scholar] [CrossRef]
- Boguslavskaya, L.V.; Khrapova, N.G.; Maksimov, O.B. Polyhydroxynaphthoquinones—A New Class of Natural Antioxidants. Bull. Acad. Sci. USSR 1985, 34, 1345–1350. [Google Scholar] [CrossRef]
- Lebedev, A.V.; Ivanova, M.V.; Levitsky, D.O. Iron chelators and free radical scavengers in naturally occurring polyhydroxylated 1,4-naphthoquinones. Hemoglobin 2008, 32, 165–179. [Google Scholar] [CrossRef]
- Fedoreyev, S.A.; Krylova, N.V.; Mishchenko, N.P.; Vasileva, E.A.; Pislyagin, E.A.; Iunikhina, O.V.; Lavrov, V.F.; Svitich, O.A.; Ebralidze, L.K.; Leonova, G.N. Antiviral and Antioxidant Properties of Echinochrome A. Mar. Drugs 2018, 16, 509. [Google Scholar] [CrossRef]
- Zhang, H.; Liu, X.; Liu, Y.; Yi, B.; Yu, X. Epithelial-mesenchymal transition of rat peritoneal mesothelial cells via Rhoa/Rock pathway. Vitr. Cell. Dev. Biol. Anim. 2011, 47, 165–172. [Google Scholar] [CrossRef]
- Apostolatos, A.H.; Ratnayake, W.S.; Win-Piazza, H.; Apostolatos, C.A.; Smalley, T.; Kang, L.; Salup, R.; Hill, R.; Acevedo-Duncan, M. Inhibition of atypical protein kinase C-ι effectively reduces the malignancy of prostate cancer cells by downregulating the NF-κB signaling cascade. Int. J. Oncol. 2018, 53, 1836–1846. [Google Scholar] [CrossRef]
- Ratnayake, W.S.; Apostolatos, A.H.; Ostrov, D.A.; Acevedo-Duncan, M. Two novel atypical PKC inhibitors; ACPD and DNDA effectively mitigate cell proliferation and epithelial to mesenchymal transition of metastatic melanoma while inducing apoptosis. Int. J. Oncol. 2017, 51, 1370–1382. [Google Scholar] [CrossRef]
- Forteza, R.; Figueroa, Y.; Mashukova, A.; Dulam, V.; Salas, P.J. Conditional knockout of polarity complex (atypical) PKCι reveals an anti-inflammatory function mediated by NF-κB. Mol. Biol. Cell 2016, 27, 2186–2197. [Google Scholar] [CrossRef]
- Yang, T.; Deng, Z.; Xu, L.; Li, X.; Yang, T.; Qian, Y.; Lu, Y.; Tian, L.; Yao, W.; Wang, J. Macrophages-aPKCι-CCL5 Feedback Loop Modulates the Progression and Chemoresistance in Cholangiocarcinoma. J. Exp. Clin. Cancer Res. 2022, 41, 23. [Google Scholar] [CrossRef]
- Jimenez, S.A.; Piera-Velazquez, S. Endothelial to mesenchymal transition (EndoMT) in the pathogenesis of Systemic Sclerosis-associated pulmonary fibrosis and pulmonary arterial hypertension. Myth or reality? Matrix Biol. 2016, 51, 26–36. [Google Scholar] [CrossRef]
- Du, G.S.; Qiu, Y.; Wang, W.S.; Peng, K.; Zhang, Z.C.; Li, X.S.; Xiao, W.D.; Yang, H. Knockdown on aPKC-ι inhibits epithelial-mesenchymal transition, migration and invasion of colorectal cancer cells through Rac1-JNK pathway. Exp. Mol. Pathol. 2019, 107, 57–67. [Google Scholar] [CrossRef]
- Ma, C.Q.; Yang, Y.; Wang, J.M.; Du, G.S.; Shen, Q.; Liu, Y.; Zhang, J.; Hu, J.L.; Zhu, P.; Qi, W.P.; et al. The aPKCι blocking agent ATM negatively regulates EMT and invasion of hepatocellular carcinoma. Cell Death Dis. 2013, 5, e1129. [Google Scholar] [CrossRef]
- Mischenko, N.P.; Fedoreyev, S.A.; Pokhilo, N.D.; Anufriev, V.P.; Denisenko, V.A.; Glazunov, V.P. Echinamines A and B, first aminated hydroxynaphthazarins from the sea urchin Scaphechinus mirabilis. J. Nat. Prod. 2005, 68, 1390–1393. [Google Scholar] [CrossRef]


Publisher’s Note: MDPI stays neutral with regard to jurisdictional claims in published maps and institutional affiliations. |
© 2022 by the authors. Licensee MDPI, Basel, Switzerland. This article is an open access article distributed under the terms and conditions of the Creative Commons Attribution (CC BY) license (https://creativecommons.org/licenses/by/4.0/).
Share and Cite
Song, B.-W.; Kim, S.; Kim, R.; Jeong, S.; Moon, H.; Kim, H.; Vasileva, E.A.; Mishchenko, N.P.; Fedoreyev, S.A.; Stonik, V.A.; et al. Regulation of Inflammation-Mediated Endothelial to Mesenchymal Transition with Echinochrome a for Improving Myocardial Dysfunction. Mar. Drugs 2022, 20, 756. https://doi.org/10.3390/md20120756
Song B-W, Kim S, Kim R, Jeong S, Moon H, Kim H, Vasileva EA, Mishchenko NP, Fedoreyev SA, Stonik VA, et al. Regulation of Inflammation-Mediated Endothelial to Mesenchymal Transition with Echinochrome a for Improving Myocardial Dysfunction. Marine Drugs. 2022; 20(12):756. https://doi.org/10.3390/md20120756
Chicago/Turabian StyleSong, Byeong-Wook, Sejin Kim, Ran Kim, Seongtae Jeong, Hanbyeol Moon, Hojin Kim, Elena A. Vasileva, Natalia P. Mishchenko, Sergey A. Fedoreyev, Valentin A. Stonik, and et al. 2022. "Regulation of Inflammation-Mediated Endothelial to Mesenchymal Transition with Echinochrome a for Improving Myocardial Dysfunction" Marine Drugs 20, no. 12: 756. https://doi.org/10.3390/md20120756
APA StyleSong, B.-W., Kim, S., Kim, R., Jeong, S., Moon, H., Kim, H., Vasileva, E. A., Mishchenko, N. P., Fedoreyev, S. A., Stonik, V. A., Lee, M. Y., Kim, J., Kim, H. K., Han, J., & Chang, W. (2022). Regulation of Inflammation-Mediated Endothelial to Mesenchymal Transition with Echinochrome a for Improving Myocardial Dysfunction. Marine Drugs, 20(12), 756. https://doi.org/10.3390/md20120756