Abstract
The main bearing of a tunnel boring machine (TBM) is a critical component of the main driving system that enables continuous excavation, and its performance is crucial for ensuring the safe operation of the TBM. Currently, there are few testing technologies for TBM main bearings, and a comprehensive testing and evaluation system has yet to be established. This study presents an experimental investigation using a self-developed, full-scale TBM main bearing test bench. Based on a representative load spectrum, both operational condition tests and life cycle tests are conducted alternately, during which the signals of the main bearing are collected. The observed vibration signals are weak, with significant vibration attenuation occurring in the large structural components. Compared with the test bearing, which reaches a vibration amplitude of 10 g in scale tests, the difference is several orders of magnitude smaller. To effectively utilize the selected evaluation indicators, the entropy weight method is employed to assign weights to the indicators, and a comprehensive analysis is conducted using grey relational analysis. This strategy results in the development of a comprehensive evaluation method based on entropy weighting and grey relational analysis. The main bearing performance is evaluated under various working conditions and the same working conditions in different time periods. The results show that the greater the bearing load, the lower the comprehensive evaluation coefficient of bearing performance. A multistage evaluation method is adopted to evaluate the performance and condition of the main bearing across multiple working scenarios. With the increase of the test duration, the bearing performance exhibits gradual degradation, aligning with the expected outcomes. The findings demonstrate that the proposed performance evaluation method can effectively and accurately evaluate the performance of TBM main bearings, providing theoretical and technical support for the safe operation of TBMs.
1. Introduction
A tunnel boring machine (TBM) is essential for underground space construction, and its technological advancement has become an important indicator of a country’s high-end equipment manufacturing capabilities [1,2,3]. Figure 1 illustrates the TBM structure, including the cutterhead, main drive system, traction motor, main beam 1, push cylinder, gripper system, main beam 2, and rear support [4,5]. The main bearing is a key component of the main drive system, allowing the performance of continuous tunneling by bearing and transmitting loads [6,7,8]. Most TBM main bearings are slewing bearings, usually consisting of three rows of cylindrical roller bearings. The main bearing comprises an inner ring, an outer ring, main thrust rollers, auxiliary thrust rollers, and radial rollers. The thrust rollers are mainly used to transmit the axial load and capsizing moment, while the radial rollers withstand the radial load and the gravity of the main bearing. Additionally, the auxiliary thrust rollers help resist the overturning moment, ensuring stable operation [7,8,9,10,11].
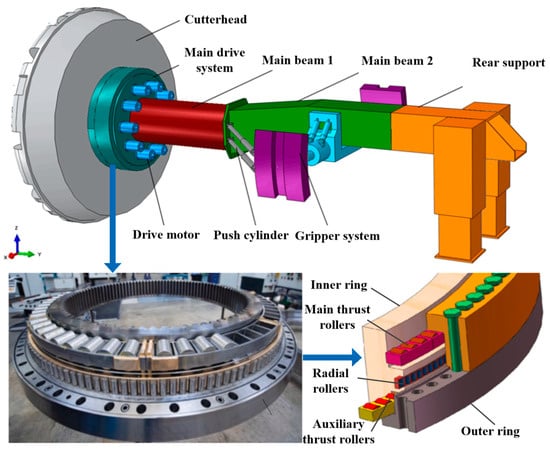
Figure 1.
The structural diagram of a TBM and its main bearings [4,5].
TBM main bearings are low-speed, heavy-duty rolling bearings. Their diameters can reach several meters (sometimes exceeding ten meters), with rotational speeds below 10 r/min and axial loads up to tens of thousands of kilonewtons. These bearings have very long manufacturing and replacement cycles and require advanced technology, special equipment, and strict environmental conditions. Typically, the service life of the main bearing system is equivalent to that of the TBM itself. Ensuring the safety and reliability of the main bearings is therefore critical to the safe operation of the TBM [12,13,14].
TBMs operate underground, making the underlying geological environment and working conditions critical to their efficient operation. The unique structure and working conditions pose significant challenges in evaluating bearing performance. The health of the main bearing is vital to TBM efficiency, as failure modes such as wear, spalling, cracking, and rusting can cause irreversible damage to TBM components [15,16,17]. Zhang et al. [4] investigated the spatiotemporal damage evolution laws of the main bearing using finite element analysis. Their findings indicated that the damage risk of the raceway is greater than that of the rollers, and that of the main push raceway is greater than that of the other two raceways. Zhang et al. [12] studied the residual strength of roller–raceway contact using a stress–strength interference model that accounted for nonlinear strength degradation and material dispersion, and calculated the reliability of the main bearing structure. Fu et al. [18] proposed a two-stream convolutional neural network with multi-channel detrending input (TSCNN-MCDI) to analyze three-axis vibration signals from an accelerometer inside the roller, enabling the detection of faults in either the roller or the entire raceway. Peng [19] developed a comprehensive tool load model and a main bearing load distribution model for composite rock strata, and investigated the impact of the condition of the strata on the distribution of external and internal loads on the main bearing. Wang et al. [20] proposed a hierarchical finite element modeling method in which constant contact pressure is replaced with rolling contact to examine the problems of low hardness and easy fatigue spalling in the soft zone of TBM main bearings.
Numerous studies have focused on developing models for the accurate analysis of the dynamic characteristics of bearings. For instance, He et al. [21] studied the load-bearing capacity of single-row four-point contact ball slewing bearings, and optimized parameters such as the number of balls and their diameter. Zhang et al. [22] determined the load distribution of slewing bearings in wind turbine units based on rigid and flexible rings, and provided suggestions for their structural parameters. Han et al. [23] conducted a finite element analysis of the TBM main bearing under radial loads using the ANSYS software, and analyzed its internal contact stresses and load distribution. Zong et al. [24] developed a dynamic model using the Abaqus software to simulate raceway defects in slewing bearings, and determined the vibration responses of bearings caused by defects of varying sizes. Huo et al. [2] developed a novel test bench for hard rock TBM main systems and established a multi-degree-of-freedom coupled dynamic model, which they validated through experiments under typical working conditions. Cao et al. [25] developed a dynamic model of the TBM main bearing that incorporated local defects; they investigated the effects of uneven loads on the vibration of the main bearing and revealed the vibration mechanisms associated with these defects. Zhang et al. [26] characterized the time-varying displacement excitation of rolling elements to describe the changes in contact clearance between the rolling elements and their inner and outer rings. They also proposed the time-varying impact force excitation function for defective rolling elements, and analyzed how the rotational speed and defect size influence the fault vibration characteristics of the rolling elements.
Fault diagnosis and performance evaluation primarily depend on monitoring the operating status of the bearing during use to predict its reliability or remaining service life [27,28,29,30,31,32,33]. Bastami et al. [34] utilized specific vibration patterns generated by defective rolling bearings as diagnostic tools for predictive maintenance. They simulated and analyzed the vibration signals of the rolling bearings using physical models to represent natural defects and established the relationships between the defect size and vibration characteristics. Minhas et al. [35] proposed a bearing fault diagnosis method combining complementary set empirical mode decomposition (EMD) and weighted multi-scale entropy to address the problem of strong noise in vibration signals. They validated the effectiveness of their method using actual acoustic signal data. Pancaldi et al. [36] proposed a fault detection method for rolling bearings based on the statistical definition of cyclic stationary states, which demonstrated high robustness against mechanical noise. Ma et al. [37] proposed a state detection method for DBN tailored to non-stationary signals generated by bearings operating under variable-speed conditions. They optimized the method using the sparrow search algorithm and used fault features extracted via the Fourier transform for the classification, identification, and diagnosis of bearing faults. Zareapoor et al. [38] addressed the problem of class imbalance in industrial signal data by proposing a generative adversarial network for minority class oversampling. This method generates new minority class samples by combining the majority class distribution and employs a discriminator for fault diagnosis. Zhao et al. [39] proposed a novel adaptive decomposition algorithm based on CEEMDAN and fractal dimension analysis to overcome issues such as redundancy and mode confusion in traditional EMD-based algorithms. Chen et al. [40] proposed a residual deep subdomain adaptive network for intelligent bearing fault diagnosis across multiple domains, with the key advantage that only one transfer task is required regardless of changes in operating conditions.
Although the aforementioned studies achieved promising results, most were based on small-scale experiments. Only a few full-scale testing platforms are capable of evaluating the main bearings of TBMs. Notable facilities with such advanced testing abilities include SKF’s Sven Wingquist Test Center, Schaeffler’s FAG bearing ASTRAIOS Test Platform, Liebherr’s Large Bearing Test Platform, Wafangdian Bearing Group Corp., Ltd.’s 3.6 m large fan bearing test bench, and Luoyang LYC Bearing Corp., Ltd.’s comprehensive performance test bench for slewing bearings. Due to the large structures of full-scale test benches and the limited number of test samples, few experimental studies have been conducted on the performance evaluation of TBM main bearings. Research in this area remains in its early stages and lacks the capability to accurately evaluate and predict bearing health, or to provide timely and reliable information for intelligent operation and maintenance.
In summary, a dedicated testing technology for TBM main bearings does not yet exist. Therefore, in this work, a full-scale (1:1) TBM main bearing test bench was established to conduct an experimental study based on the test load spectrum. A performance evaluation method for TBM bearings, combining the entropy weight and grey relational degree, is proposed. This method relies on the collection of main bearing signals during testing and the selection of evaluation indices that reflect the operational state of the bearing. The results provide technical support for the safe operation of TBM main bearings.
2. Main Bearing Test
2.1. Test Bench Introduction
A systematic study was conducted by designing a full-scale test bench for the main bearing based on the main drive structure of the TBM, as shown in Figure 1. The test bench accommodates replaceable bearings with diameters ranging from 3 to 6 m. The loading principle is illustrated in Figure 2. Two bearings are arranged back-to-back to eliminate the influence of the bearing rotation pair on the applied load. The axial force, radial force, and overturning moment are applied via evenly distributed hydraulic cylinders, each capable of independent loading to simulate various load conditions. The inner gear ring of the main bearing is driven by driving motors, while the load torque is provided by a separate load motor. The load conditions of the test bearing are consistent with real working conditions. The test bench is equipped with a comprehensive control, data acquisition, and monitoring system capable of tracking various signals, such as the bearing load, torque, speed, temperature, and vibration. Four vibration acceleration sensors are installed on the two test bearings in both the axial and radial directions, and an online oil sensor is positioned at the front end of the filter valve. The structure of the test bench is shown in Figure 3. In addition to the test system, the test bench includes personnel channels and maintenance platforms to ensure its safe and reliable operation.
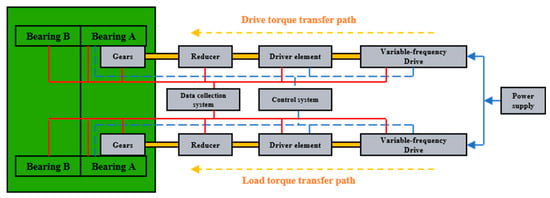
Figure 2.
The schematic of the test bench loading system.
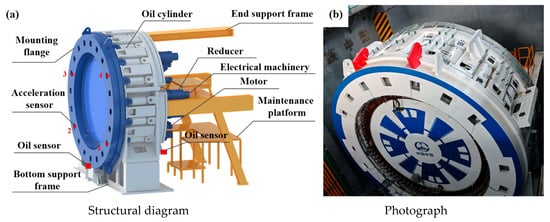
Figure 3.
The structure of the test bench.
2.2. Testing Program
In a previous study [41], a mechanical model of the TBM main drive was developed and the relationship between the main bearing load and the cylinder attitude was identified, as illustrated in Figure 4. This model enabled the determination of the main bearing load for the TBM. A typical geological section was selected to analyze the load spectrum experienced by the main bearing, resulting in the identification of eight load spectrum conditions, as summarized in Table 1 [42].
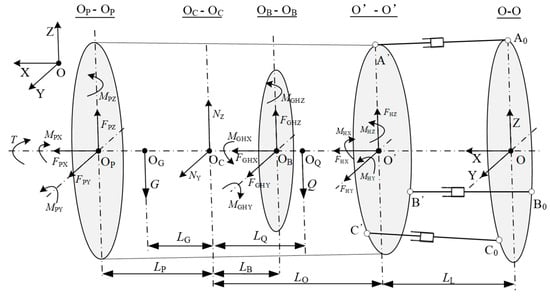
Figure 4.
The simplified mechanical model of the main drive structure [41].

Table 1.
The composite load spectrum of the entire section [42].
In this study, tests were conducted according to these load conditions. An empty running test was performed between different working conditions to eliminate their mutual influence. Moreover, an accelerated life cycle test with a duration of 20 days was conducted after each working condition. The life cycle test and working condition test were alternately conducted to simulate the full bearing life cycle. Each working condition test (including the empty running test) had a duration of 5 min, during which the signals were collected.
3. Data Analysis
3.1. Characteristic Parameters
Time-domain statistical parameters can be derived from the system’s time-domain signals and are commonly used to evaluate its operating status. These parameters are generally classified into two categories: dimensional parameters (i.e., peak value, root mean square (RMS), and variance) and dimensionless parameters (i.e., peak factor, waveform factor, pulse factor, margin factor, and kurtosis). In this study, the characteristic parameters selected for comprehensive evaluation included the peak factor, RMS, margin factor, kurtosis, lubricating oil temperature, and oil kinematic viscosity. These indicators were used to analyze and evaluate the state of the bearing throughout the test process.
3.2. Analysis of Vibration Signal Results
Figure 5 and Figure 6 show the vibration signals of two test bearings under an axial force of 13,846 kN, a radial force of 6954 kN, and an overturning moment of 5352 kN·m (i.e., Working Condition 1). For Test Bearing A, the amplitude of the four axial vibration accelerations was 0.04 g, while the four radial vibration acceleration amplitudes were approximately 0.08 g. In contrast, the four axial vibration acceleration amplitudes of Test Bearing B reached 0.2 g, with radial vibration acceleration amplitudes equal to 0.08 g. The radial vibration amplitudes of the two bearings were comparable, whereas the axial vibration amplitudes differed by an order of magnitude. This discrepancy may have been due to the vibration attenuation caused by the different positions of the vibration acceleration sensors. Overall, the vibration levels of the bearings were significantly lower than those of the entire TBM. During the testing of a shield machine in a previous study, the bearing vibration was more than ten times greater than that of the entire shield machine [43]. The vibration amplitude observed in this test was also several orders of magnitude lower than the 10 g amplitude recorded in scaled tests of the main TBM bearing in a previous study [25]. Because only the bearings were tested here, the measured vibration was low. This is primarily due to the significant attenuation during vibration transmission through large structural components, which poses a challenge for accurately testing the main bearings of the shield machine.
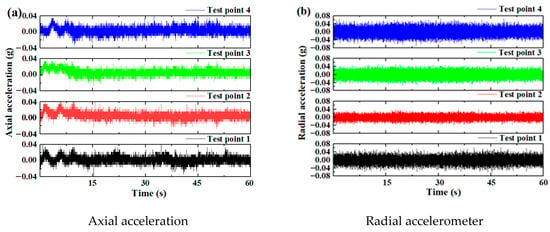
Figure 5.
The vibration time-domain signal of Test Bearing A.
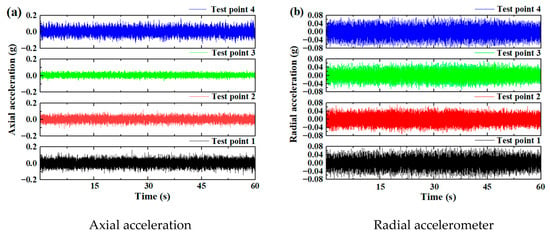
Figure 6.
The vibration time-domain signal of Test Bearing B.
Figure 5 and Figure 6 also illustrate that vibration signals alone are insufficient to effectively reflect the operating state of the bearings. Therefore, various data fusion approaches were adopted for bearing performance evaluation. The effective value, kurtosis, peak factor, and margin factor of the vibration signals, as well as the lubricating oil temperature and oil kinematic viscosity, of Test Bearings A and B were selected as performance evaluation indices. These indicators were calculated based on data collected by the test bench.
4. Performance Evaluation Method Based on Entropy Weight
The entropy weight method was employed to calculate the weight of each evaluation index. The performance of the TBM main bearing was then evaluated via a combination of the entropy weight method and grey relational analysis. Grey relational analysis is particularly suitable for this application due to its ability to effectively excavate intrinsic patterns in test data along with its low data requirements, ease of calculation, and straightforward implementation [44,45,46]. The entropy weight method eliminates the influence of subjective factors on weighting, allowing for an objective assessment of indicator importance. This approach has demonstrated high accuracy in practical applications [47,48,49,50]. As an objective weighting technique, it employs information entropy to calculate the weight coefficient of each indicator based on the degree of variation between the indicators. The calculation process is summarized as follows.
The proportion of the index value (Pij) of the j-th item in scheme i is computed as follows.
The entropy () of the j-th index is calculated as
where .
The difference coefficient () of the j-th index is computed as follows.
The weight () of the j-th indicator is calculated as follows.
The final entropy weight vector is then obtained:
4.1. Calculation of Grey Relational Coefficient
Correlations often exist among the indicators used in monitoring methods. The degree of association between each indicator can be determined using the grey relational coefficient. A set of reference indicators is selected as the comparison sequence, which is compared against the decision series to assess the degree of correlation. The calculation process is summarized as follows.
The reference sequence (x0) and decision sequence (xi) are set as follows.
The aforementioned sequence is normalized by adopting the range normalization treatment:
The correlation coefficient is given as follows:
where ,, and are, respectively, the two-stage minimum and maximum differences, and p is a parameter usually set in the range of 0.5–0.6.
4.2. Main Bearing Performance Evaluation
Based on the previously calculated weight vector and grey relational coefficient matrix, a comprehensive evaluation is performed to determine the relative correlation degree, as given by the following equation.
To assess bearing performance, test data from various working conditions are used for a first-level comprehensive evaluation. This yields a decision matrix corresponding to each working condition, representing its classification type.
The second-level comprehensive evaluation is then conducted based on the decision matrix obtained in the first level and following the previously described calculation steps. Additionally, the weight vector for each working condition is computed using Equations (1)–(5). These weights are applied to obtain the final second-level comprehensive evaluation result :
where represents the comprehensive evaluation coefficient of the relative reference under the n-th working condition.
5. Performance Evaluation of the Main Bearing
5.1. Comprehensive Bearing Performance Evaluation Under Different Loading Conditions
The effective value, kurtosis, peak value, and margin of the vibration signals, as well as the lubricating oil temperature and oil kinematic viscosity, of Test Bearings A and B were selected as performance evaluation indices. Tests were conducted under the eight load conditions presented in Table 1, and the rotational speed was set to 0.5 r/min, corresponding to the typical operating speed of the TBM. The performance indices for both bearings were obtained and are presented in Table 2.

Table 2.
The performance indices of the main bearing under eight loading conditions and a rotational speed of 0.5 r/min.
After applying normalization using Equation (6), the normalized main bearing evaluation indices under the eight loading conditions at a speed of 0.5 r/min were calculated. The results are reported in Table 3.

Table 3.
The normalized performance indices of the main bearing under eight loading conditions and a rotational speed of 0.5 r/min.
The entropy weights were calculated via Equations (1)–(5), with the results as follows:
W = [0.095, 0.038, 0.047, 0.048, 0.100, 0.084, 0.042, 0.052, 0.138, 0.098, 0.150, 0.108].
The correlation coefficients of the performance indices of the main bearing under the eight loading conditions at a speed of 0.5 r/min were calculated using Equation (7). The results are visualized in Figure 7.
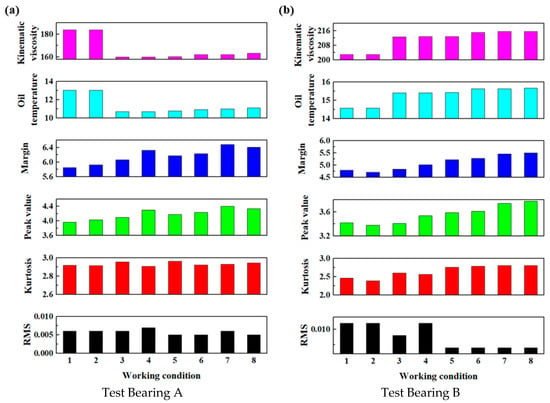
Figure 7.
The correlation coefficients of the performance indices of the main bearing under the eight loading conditions at a speed of 0.5 r/min.
The evaluation coefficients under these working conditions were then calculated using Equation (8), with the following results:
R1 = W1ξ1 = [1, 0.9071, 0.5053, 0.5186, 0.4224, 0.4282, 0.4027, 0.3978],
Similarly, the evaluation coefficients under the eight working conditions at speeds of 1, 1.5, and 2 r/min were calculated, with the following results:
R2 = W2ξ2 = [1, 0.6524, 0.6053, 0.5192, 0.5176, 0.4747, 0.4301, 0.3803],
R3 = W3ξ3 = [1, 0.5946, 0.5903, 0.5111, 0.5556, 0.5284, 0.4876, 0.4158],
R4 = W4ξ4 = [1, 0.8387, 0.6940, 0.6361, 0.6601, 0.5414, 0.6680, 0.4998].
The evaluation coefficients under 32 different working conditions were obtained, and the results are shown in Figure 8. It can be seen from the Figure 8 that the variation trends of the evaluation coefficients of the bearing under different working conditions.
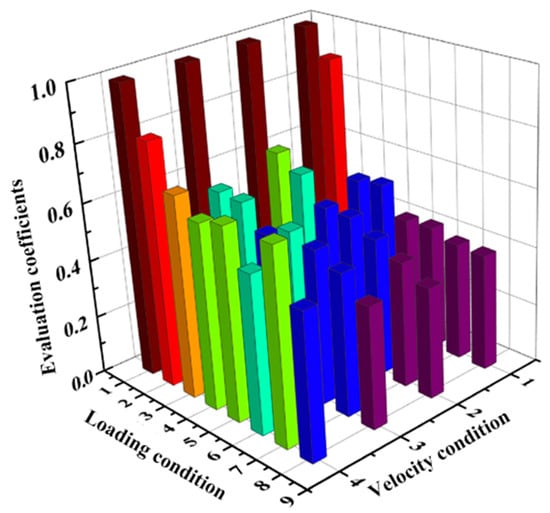
Figure 8.
The evaluation coefficients under different working conditions.
The entropy weight values under different speeds were computed via Equation (9), as follows:
ER = WMRMT = [1, 0.7677, 0.5735, 0.5326, 0.5057, 0.4757, 0.4620, 0.4103].
Figure 9 presents the comprehensive evaluation coefficients under different loading conditions. Using the first working condition as a reference, it can be seen that the closer the bearing performance was to this condition, the closer the comprehensive evaluation coefficient was to the theoretical value of one. Additionally, as the bearing load increased, the comprehensive evaluation coefficient decreased. Therefore, it can be concluded that the entropy weight–grey relational evaluation method can accurately evaluate the bearing performance.
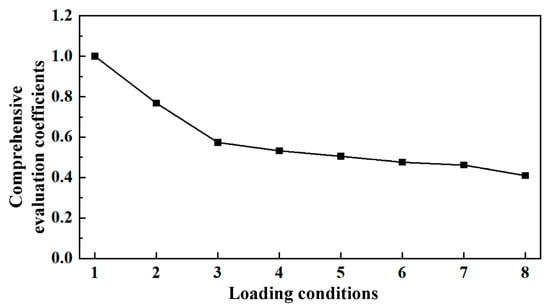
Figure 9.
The comprehensive evaluation coefficients under different loading conditions.
5.2. Bearing Performance Evaluation Under Cyclic Working Conditions
To study the evolution of the bearing performance under the same working conditions, a set of prior working condition tests was used as a reference. Life cycle tests were then conducted to analyze the subsequent test data across multiple repeated working cycles. The corresponding evaluation coefficient (R) was calculated using the entropy weight–grey relational degree evaluation method. To minimize discrepancies caused by varying test references, a relative evaluation coefficient was used to assess the life cycle tests. The differences were calculated based on the obtained evaluation coefficients , and the relative error evaluation coefficient was computed as follows.
The relative evaluation coefficient was then calculated as follows.
Five life cycle tests were selected for analysis, with repeated test conditions of a speed of 1 r/min and a loading force of 37,500 kN. The resulting evaluation indices are reported in Table 4.

Table 4.
The main bearing evaluation indices under a loading force of 32,500 kN and a speed of 1 r/min.
After applying normalization using Equation (6), the main bearing evaluation indices under a normalized loading force of 37,500 kN and speed of 1 r/min were calculated. The results are exhibited in Figure 10.
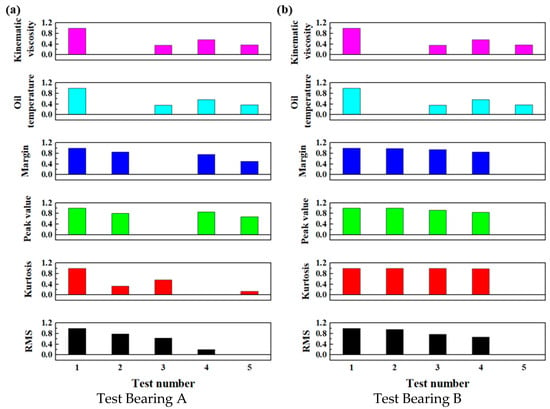
Figure 10.
The normalized evaluation indices of the main bearings under a loading force of 32,500 kN and a speed of 1 r/min.
Using the data from the first test as the reference and the remaining test data as the calculation input, the entropy weights were calculated according to Equations (1)–(5), as follows:
W = [0.1353, 0.1697, 0.0921, 0.0994, 0.026, 0.772, 0.115, 0.112, 0.1259, 0.1259, 0.1259, 0.1259].
The correlation coefficients of the main bearing under a loading force of 32,500 kN and a speed of 1 r/min were then calculated using Equation (3). The results are presented in Figure 11.
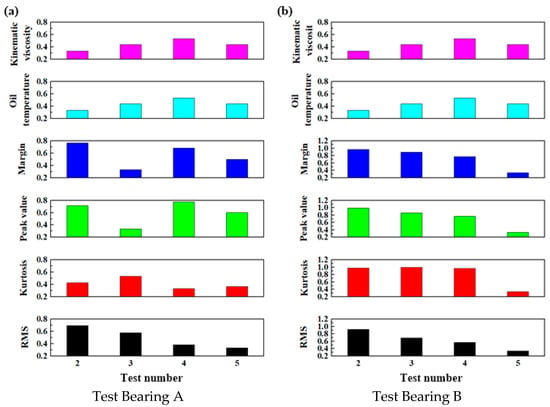
Figure 11.
The correlation coefficients of the main bearings under a loading force of 32,500 kN and a speed of 1 r/min.
The relative errors and relative evaluation coefficients of the two bearings were respectively calculated using Equations (10) and (11), with the following results.
Relative error:
△RA = [0.0462, 0.1220, 0.1578]
△RB = [0.0104, 0.0436, 0.0606]
Relative evaluation coefficient:
△CRB = [0.9538, 0.8780, 0.8422]
△CRB = [0.98, 0.95, 0.87]
Figure 12 shows the relative evaluation coefficients under different test cycles. As the test duration increased, the relative evaluation coefficients of the bearings gradually decreased, while the relative evaluation errors gradually increased. Each group of working conditions underwent a 20-day life cycle test. The observed degradation in bearing performance over time is consistent with the downward trend of the relative evaluation coefficient.
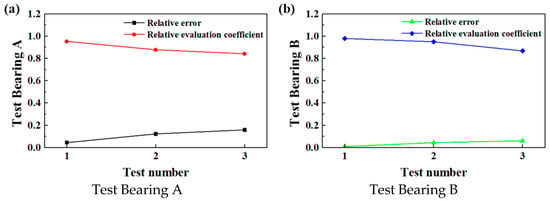
Figure 12.
The relative evaluation coefficients under different test cycles.
6. Conclusions
In this study, tests were conducted on a self-designed, full-scale (1:1) test bench for the main bearing of a TBM to evaluate its performance. The test conditions were chosen according to a typical load spectrum, and a 20-day life cycle test was conducted after each set of working conditions. The data collected during the test process were used to evaluate the bearing performance using the entropy weight–grey relational method. The conclusions of this work are as follows.
- (1)
- During the shield machine main bearing test, the vibration signal amplitude was low, with significant attenuation caused by large structural components. This resulted in vibration amplitudes several orders of magnitude lower than the 10 g amplitude observed in scale tests of the main bearing.
- (2)
- To effectively utilize the selected evaluation indicators, the entropy weight method was employed to assign their weights. Furthermore, a comprehensive analysis combining the entropy weight and grey relational methods was developed, resulting in a unified evaluation method that determines the comprehensive evaluation coefficient.
- (3)
- Using the first working condition as a reference, the bearing performance closer to this condition corresponded to a comprehensive evaluation coefficient nearer to the theoretical value of one. As the bearing load increased, the comprehensive evaluation coefficient decreased, indicating a decline in bearing performance.
- (4)
- A multistage comprehensive evaluation method was applied to assess the performance and condition of the main bearing under multiple working conditions. Over time, with the increase of the test duration, the bearing performance gradually degraded.
Author Contributions
Conceptualization, Z.S. and Y.W.; methodology, Y.W.; software, Z.W.; validation, Z.S., H.X. and P.H.; formal analysis, Z.W.; investigation, W.S.; resources, Z.S.; data curation, H.X.; writing—original draft preparation, Z.S. and Y.W.; visualization, P.H.; supervision, W.S.; project administration, S.X.; funding acquisition, Y.W. All authors have read and agreed to the published version of the manuscript.
Funding
This research was financially supported by the Henan Province Science and Technology Research Project, China (Grant No. 242102221010).
Informed Consent Statement
Informed consent was obtained from all subjects involved in the study.
Data Availability Statement
Due to industry confidentiality, no data is available.
Conflicts of Interest
Authors Zhihong Sun, Yuanke Wu, Hao Xiao, Panpan Hu, Zhenyong Weng and Shunhai Xu were employed by the company China Railway Engineering Equipment Group Co., Ltd. The remaining authors declare that the research was conducted in the absence of any commercial or financial relationships that could be construed as a potential conflict of interest.
References
- Sun, W.; Zhu, Y.; Huo, J.-Z.; Chen, X.-H. Multiple cracks failure rule for TBM cutterhead based on three-dimensional crack propagation calculation. Eng. Fail. Anal. 2018, 93, 224–240. [Google Scholar] [CrossRef]
- Huo, J.; Zhang, Z.; Meng, Z.; Li, J.; Wu, H.; Jia, L. Dynamic analysis and experimental study of a Tunnel boring Machine testbed under multiple conditions. Eng. Fail. Anal. 2021, 127, 105557. [Google Scholar] [CrossRef]
- Fu, J.; Zeng, G.; Zhang, H.; Zhang, L.; Yin, X.; Xia, Y. Experimental investigation on wear behaviors of TBM disc cutter ring with different cooling methods. Eng. Fail. Anal. 2022, 134, 106076. [Google Scholar] [CrossRef]
- Zhang, H.; Qu, C. Research on Tunnel-Boring Machine Main Bearing Fatigue Damage and Vibration Response. Metals 2023, 13, 4. [Google Scholar] [CrossRef]
- Zheng, J.-Y.; Hu, S.; Ji, J.-C.; Zhang, X.-Y.; Tong, V.-C.; Yin, S.; Feng, K.; Dong, H.-J.; Xu, L.-Y. A review of fatigue failure and structural design of main bearings in tunnel boring machines based on engineering practical examples. Eng. Fail. Anal. 2024, 163, 108611. [Google Scholar] [CrossRef]
- Li, J.; Zhang, Z.; Meng, Z.; Huo, J.; Chen, J. Tunnel boring machine cutterhead crack propagation life prediction with time integration method. Adv. Mech. Eng. 2019, 11, 168781401985345. [Google Scholar] [CrossRef]
- Chen, S.-H.; Zhao, J.; Liu, S.-H.; Ling, J.-X.; Zang, R.-C. Fatigue Reliability Prediction of TBM Main Bearings Based on Non-dimensional Interference Model. Recent Pat. Eng. 2025, e18722121356578. [Google Scholar] [CrossRef]
- Zhong, T.; Qin, C.; Shi, G.; Zhang, Z.; Tao, J.; Liu, C. A residual denoising and multiscale attention-based weighted domain adaptation network for tunnel boring machine main bearing fault diagnosis. Sci. China Technol. Sci. 2024, 67, 2594–2618. [Google Scholar] [CrossRef]
- Wang, H.; He, P.; Pang, B.; Gao, X. A new computational model of large three-row roller slewing bearings using nonlinear springs. Proc. Inst. Mech. Eng. Part C J. Mech. Eng. Sci. 2017, 231, 3831–3839. [Google Scholar] [CrossRef]
- Wang, X.; Wang, L.; Chi, H.; Yuan, B.; Sun, Q.; Sun, W.; Cui, Y. Uncertainty design optimization of the main bearing in tunnel boring machine based on the Kriging model with partial least squares. Tunn. Undergr. Space Technol. 2025, 162, 106648. [Google Scholar] [CrossRef]
- Xiong, Z.; Chen, N. Research on the lubrication flow field characteristics of the main bearing of a tunnel boring machine. Int. Commun. Heat. Mass. Transf. 2025, 164, 108861. [Google Scholar] [CrossRef]
- Zhang, X.; Zhang, Y.; Sun, Y.; Wen, B.; Jiang, L. Reliability model of TBM main bearing based on nonlinear strength degradation theory. Int. J. Perform. Eng. 2018, 14, 3054–3065. [Google Scholar] [CrossRef]
- Fu, X.; Jiao, K.; Tao, J.; Liu, C. Multi-stream domain adversarial prototype network for integrated smart roller TBM main bearing fault diagnosis across various low rotating speeds. Reliab. Eng. Syst. Saf. 2024, 250, 110284. [Google Scholar] [CrossRef]
- Fu, X.; Tao, J.; Jiao, K.; Liu, C. A novel semi-supervised prototype network with two-stream wavelet scattering convolutional encoder for TBM main bearing few-shot fault diagnosis. Knowl.-Based Syst. 2024, 286, 111408. [Google Scholar] [CrossRef]
- Wang, X.; Sun, W.; Wang, L.; Liang, S.; Mu, X. Structural Optimization of the Main Bearing in a Tunnel Boring Machine Considering Clearance. J. Tribol. 2024, 146, 14. [Google Scholar] [CrossRef]
- Luo, G.; Zhang, H.; Liu, D.; Li, W.; Li, M.; Li, Z.; Sun, L.; Yang, P.; Maeda, R.; Zhao, L. Determination of Main Bearing Dynamic Clearance in a Shield Tunneling Machine Through a Broadband PMUT Array with a Decreased Blind Area and High Accuracy. Sensors 2025, 25, 4182. [Google Scholar] [CrossRef] [PubMed]
- Cao, A.; Gao, H.; Fan, S.; Liu, Y. Study on vibration characteristics and mechanism of tbm main bearing under uneven load. In Proceedings of the 2nd International Conference on Mechanical System Dynamics, Beijing, China, 1 September 2023; pp. 463–475. [Google Scholar] [CrossRef]
- Fu, X.; Tao, J.; Qin, C.; Wei, Q.; Liu, C. A roller state-based fault diagnosis method for tunnel boring machine main bearing using two-stream CNN with multichannel detrending inputs. IEEE Trans. Instrum. Meas. 2022, 71, 1–12. [Google Scholar] [CrossRef]
- Zhou, P.; Yu, L.; Wang, Z.; He, E. Study on the load distribution of main bearing of full-face rock tunnel boring machine under composite rock layer. In Proceedings of the Second International Conference on Advanced Manufacturing Technology and Manufacturing Systems (ICAMTMS 2023), Nanjing, China, 26–28 May 2023; Volume 12744, pp. 559–566. [Google Scholar]
- Wang, X.; Sun, W.; Wang, L.; Liang, S.; Chi, H.; Yuan, B. Rolling contact fatigue analysis of the soft zone for the main bearing in a tunnel boring machine. Eng. Fail. Anal. 2024, 162, 108363. [Google Scholar] [CrossRef]
- He, P.; Wang, Y.; Liu, H.; Guo, E.; Wang, H. Optimization design of structural parameters of single-row four-point contact ball slewing bearing. J. Braz. Soc. Mech. Sci. Eng. 2020, 42, 1–12. [Google Scholar] [CrossRef]
- Zhang, H.; Chen, S.; Dou, Y.; Fan, H.; Wang, Y. Mechanical model and contact properties of double row slewing ball bearing for wind turbine. Rev. Adv. Mater. Sci. 2021, 60, 112–126. [Google Scholar] [CrossRef]
- Han, H.; Li, J.; Liu, H. FEA analysis of the shield machine main bearing under radial force. In Proceedings of the International Conference on Advanced Technology of Design and Manufacture (ATDM 2010), Beijing, China, 23–25 November 2010; pp. 236–239. [Google Scholar]
- Zong, H.; Wang, H.; Hong, R. Dynamic research on single-row slewing bearing with local spalling of inner ring. Adv. Mech. Eng. 2016, 8, 1687814016632488. [Google Scholar] [CrossRef]
- Cao, A.; Gao, H.; Fan, S.; Guo, L.; You, Z.; Lei, Y.; Sun, Y.; He, J. Study on vibration mechanism and dynamic characteristics for TBM main bearing defects. Mech. Syst. Signal Process 2025, 222, 111807. [Google Scholar] [CrossRef]
- Zhang, R.; Guo, L.; Zong, Z.; Gao, H.; Qian, M.; Chen, Z. Dynamic modeling and analysis of rolling bearings with rolling element defect considering time-varying impact force. J. Sound Vib. 2023, 562, 117820. [Google Scholar] [CrossRef]
- Chen, Z.; Tian, S.; Shi, X.; Lu, H. Multiscale shared learning for fault diagnosis of rotating machinery in transportation infrastructures. IEEE Trans. Ind. Inform. 2022, 19, 447–458. [Google Scholar] [CrossRef]
- An, W.; Gu, Y.; Chen, C.; Zheng, H.; Tian, M. Investigation on the influence of temperature-variation clearance on the frequency of rolling bearing defects. Meas. Sci. Technol. 2024, 35, 66126. [Google Scholar] [CrossRef]
- Liu, D.; Cui, L.; Cheng, W. Fault diagnosis of wind turbines under nonstationary conditions based on a novel tacho-less generalized demodulation. Renew. Energy 2023, 206, 645–657. [Google Scholar] [CrossRef]
- Dong, F.; Liu, C. A new framework based on supervised joint distribution adaptation for bearing fault diagnosis across diverse working conditions. Shock Vib. 2024, 2024, 24. [Google Scholar] [CrossRef]
- Zhang, Y.; Yang, B.; Zhao, Z. Differential out-of-distribution error guidance for unknown bearing fault diagnosis with conditional diffusion model. Eng. Appl. Artif. Intell. 2025, 158, 111350. [Google Scholar] [CrossRef]
- Kumar, R.; Anand, R.S. Bearing fault diagnosis using multiple feature selection algorithms with SVM. Prog. Artif. Intell. 2024, 13, 119–133. [Google Scholar] [CrossRef]
- Li, X.; Yang, Y.; Pan, H.; Cheng, J.; Cheng, J. A novel deep stacking least squares support vector machine for rolling bearing fault diagnosis. Comput. Ind. 2019, 110, 36–47. [Google Scholar] [CrossRef]
- Bastami, A.R.; Vahid, S. A comprehensive evaluation of the effect of defect size in rolling element bearings on the statistical features of the vibration signal. Mech. Syst. Signal Process. 2021, 151, 107334. [Google Scholar] [CrossRef]
- Minhas, A.S.; Kankar, P.K.; Kumar, N.; Singh, S. Bearing fault detection and recognition methodology based on weighted multiscale entropy approach. Mech. Syst. Signal Process. 2021, 147, 107073. [Google Scholar] [CrossRef]
- Pancaldi, F.; Rubini, R.; Cocconcelli, M. Time-varying metrics of cyclostationarity for bearing diagnostic. Mech. Syst. Signal Process. 2021, 151, 107329. [Google Scholar] [CrossRef]
- Ma, J.; Li, S.; Wang, X. Condition monitoring of rolling bearing based on multi-order FRFT and SSA-DBN. Symmetry 2022, 14, 320. [Google Scholar] [CrossRef]
- Zareapoor, M.; Shamsolmoali, P.; Yang, J. Oversampling adversarial network for class-imbalanced fault diagnosis. Mech. Syst. Signal Process. 2021, 149, 107175. [Google Scholar] [CrossRef]
- Zhao, K.-C.; Xiao, J.-Q.; Li, C.; Xu, Z.-F.; Yue, M.-N. Fault diagnosis of rolling bearing using CNN and PCA fractal based feature extraction. Measurement 2023, 223, 113754. [Google Scholar] [CrossRef]
- Chen, Z.-Y.; Wu, J.; Deng, C.; Wang, C.; Wang, Y.-H. Residual deep subdomain adaptation network: A new method for intelligent fault diagnosis of bearings across multiple domains. Mech. Mach. Theory 2022, 169, 104635. [Google Scholar] [CrossRef]
- Sun, Z.; Liu, J.; Cheng, Y.; Wu, Y.; Sun, W. Load characterization of the main bearing of a large tunnel boring machine based on dynamic characteristic parameters. Adv. Mech. Eng. 2023, 15, 16878132231164232. [Google Scholar] [CrossRef]
- Wang, J.-W.; Cheng, C.-L.; Liu, J.-L.; Dong, B.-W.; Wu, Y.-K.; Sun, Z.-H. Load spectrum compilation for main bearing of shield under complex operating conditions. Tunn. Constr. 2023, 43, 106. [Google Scholar]
- Wu, F.; Gong, Q.; Li, Z.; Qiu, H.; Yin, L. Development and application of cutterhead vibration monitoring system for TBM tunnelling. Int. J. Rock. Mech. Min. Sci. 2021, 146, 104887. [Google Scholar] [CrossRef]
- Wang, Y.; Gao, Y.; Sun, L.; Li, Y.; Zheng, B.; Zhai, W. Effect of physical properties of Cu-Ni-graphite composites on tribological characteristics by grey correlation analysis. Results Phys. 2017, 7, 263–271. [Google Scholar] [CrossRef]
- Xia, X.-T.; Meng, F.-N. Grey relational analysis of measure for uncertainty of rolling bearing friction torque as time series. J. Grey Syst. 2011, 23, 2. [Google Scholar] [CrossRef]
- Yuan, H.-W.; Zheng, Y.-C.; Guo, L.-N.; Wang, J.-L.; Liu, X. Correlation degree analysis of sliding bearing oil monitor data based on grey theory. Vibroengineering Procedia 2025, 58, 192. [Google Scholar] [CrossRef]
- Li, C.; Ma, W.-S.; Gao, Z.-B. Rolling bearing degradation trend prediction based on composite multiscale grey entropy and dynamic particle filter. Meas. Sci. Technol. 2024, 35, 066119. [Google Scholar] [CrossRef]
- Babak, V.; Zaporozhets, A.; Kuts, Y.; Fryz, M.; Scherbak, L. Identification of Vibration Noise Signals of Electric Power Facilities BT—Noise Signals: Modelling and Analyses; Babak, V., Zaporozhets, A., Kuts, Y., Fryz, M., Scherbak, L., Eds.; Springer Nature: Cham, Switzerland, 2025; pp. 143–170. [Google Scholar] [CrossRef]
- Babak, V.; Babak, S.; Zaporozhets, A. Experimental Studies of Statistical Diagnostics Information and Measuring Systems BT—Statistical Diagnostics of Electric Power Equipment; Babak, V., Babak, S., Zaporozhets, A., Eds.; Springer Nature: Cham, Switzerland, 2025; pp. 279–344. [Google Scholar] [CrossRef]
- Babak, V.; Babak, S.; Zaporozhets, A. Stochastic Models of Diagnostic Signals Arising During the Operation of Electrical Equipment BT—Statistical Diagnostics of Electric Power Equipment; Babak, V., Babak, S., Zaporozhets, A., Eds.; Springer Nature: Cham, Switzerland, 2025; pp. 75–122. [Google Scholar] [CrossRef]
Disclaimer/Publisher’s Note: The statements, opinions and data contained in all publications are solely those of the individual author(s) and contributor(s) and not of MDPI and/or the editor(s). MDPI and/or the editor(s) disclaim responsibility for any injury to people or property resulting from any ideas, methods, instructions or products referred to in the content. |
© 2025 by the authors. Licensee MDPI, Basel, Switzerland. This article is an open access article distributed under the terms and conditions of the Creative Commons Attribution (CC BY) license (https://creativecommons.org/licenses/by/4.0/).