
Transformer-Based Detection and Clinical Evaluation System for Torsional Nystagmus

 , , , and
Abstract
1. Introduction
2. Materials and Methods
2.1. Datasets
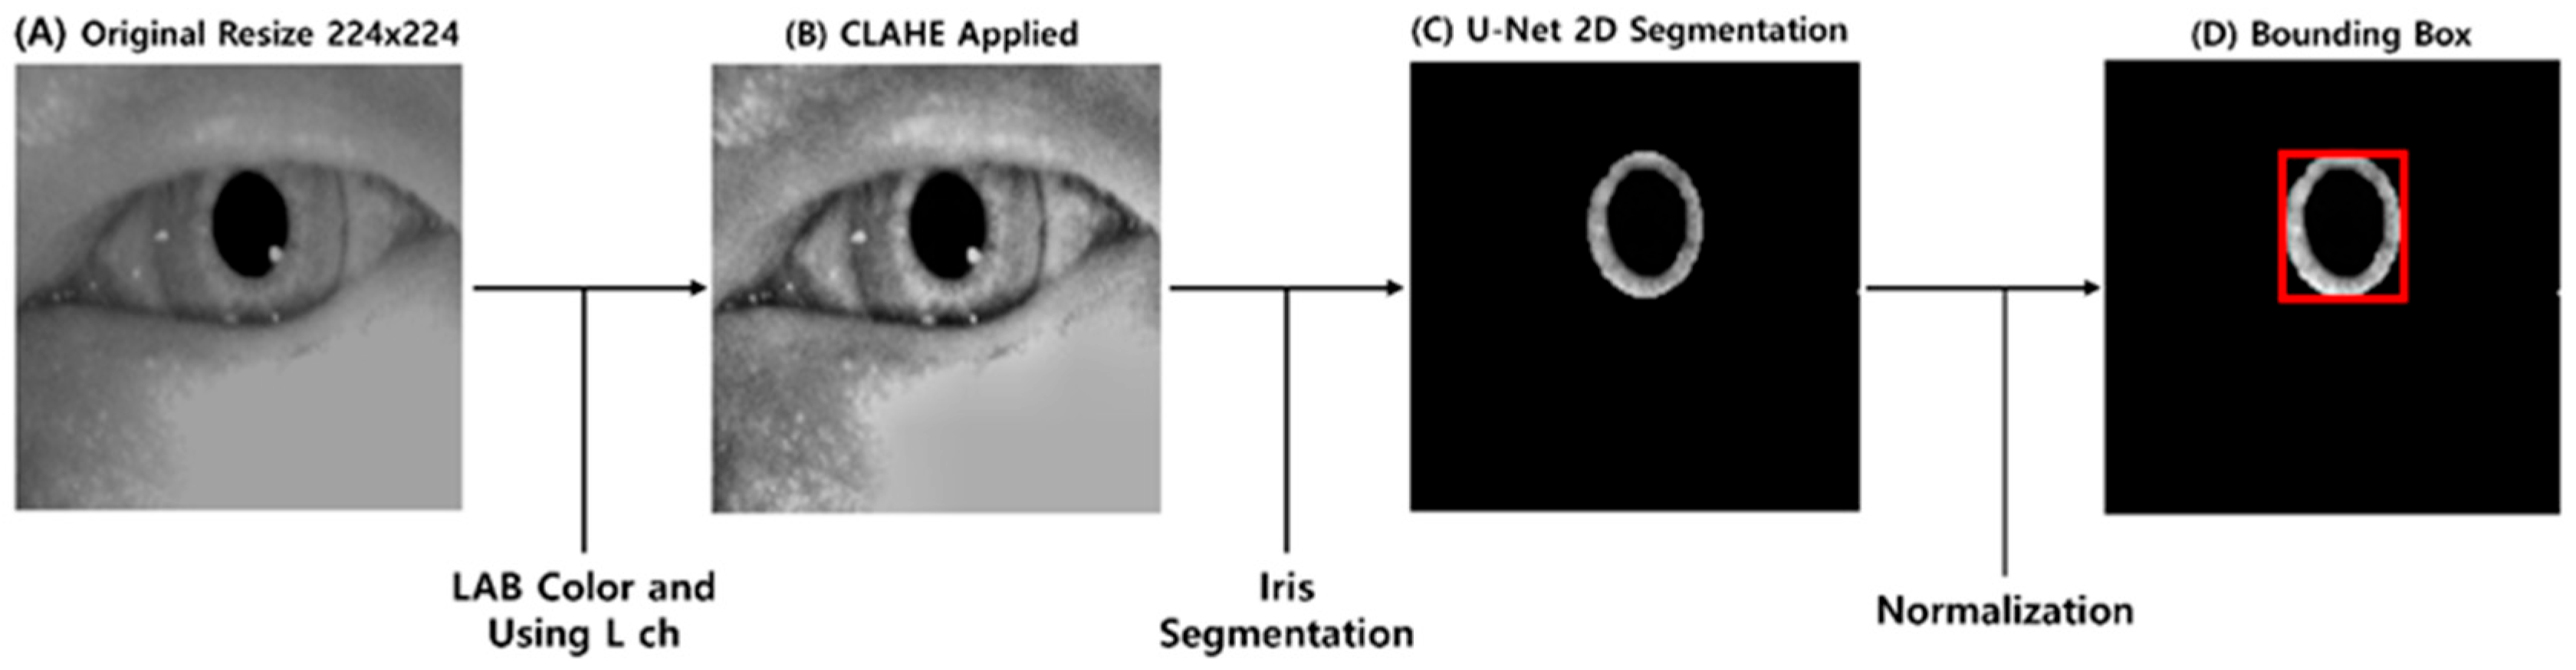
2.2. Preprocessing
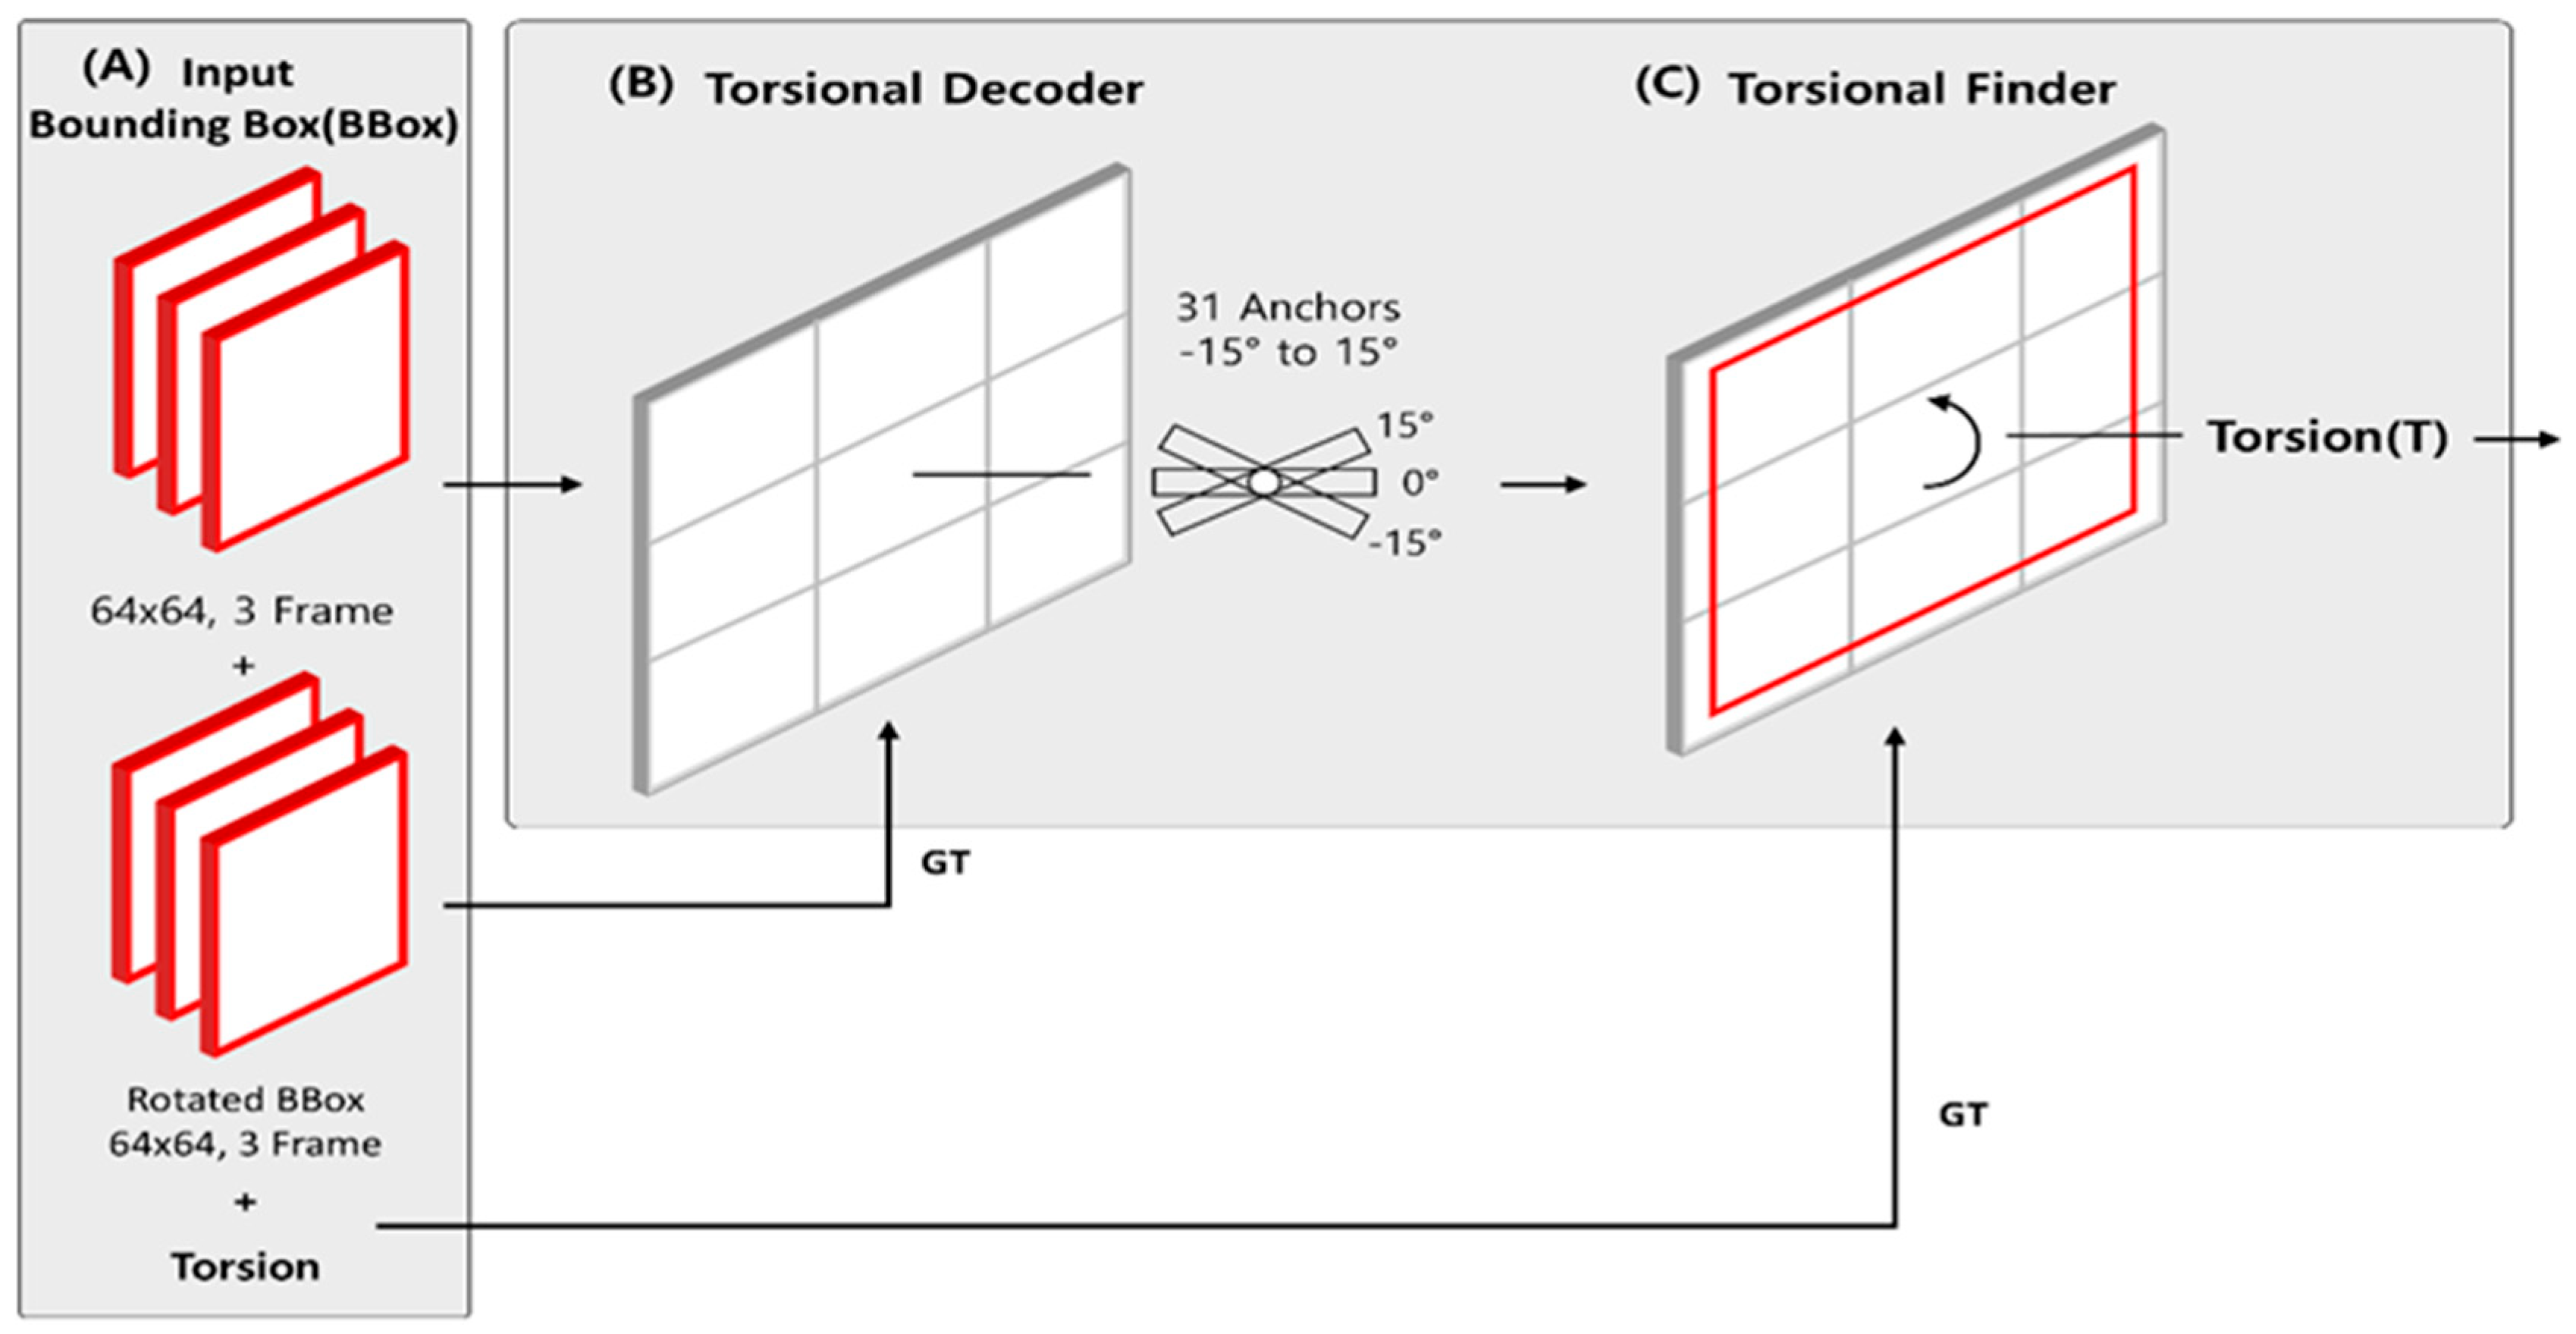
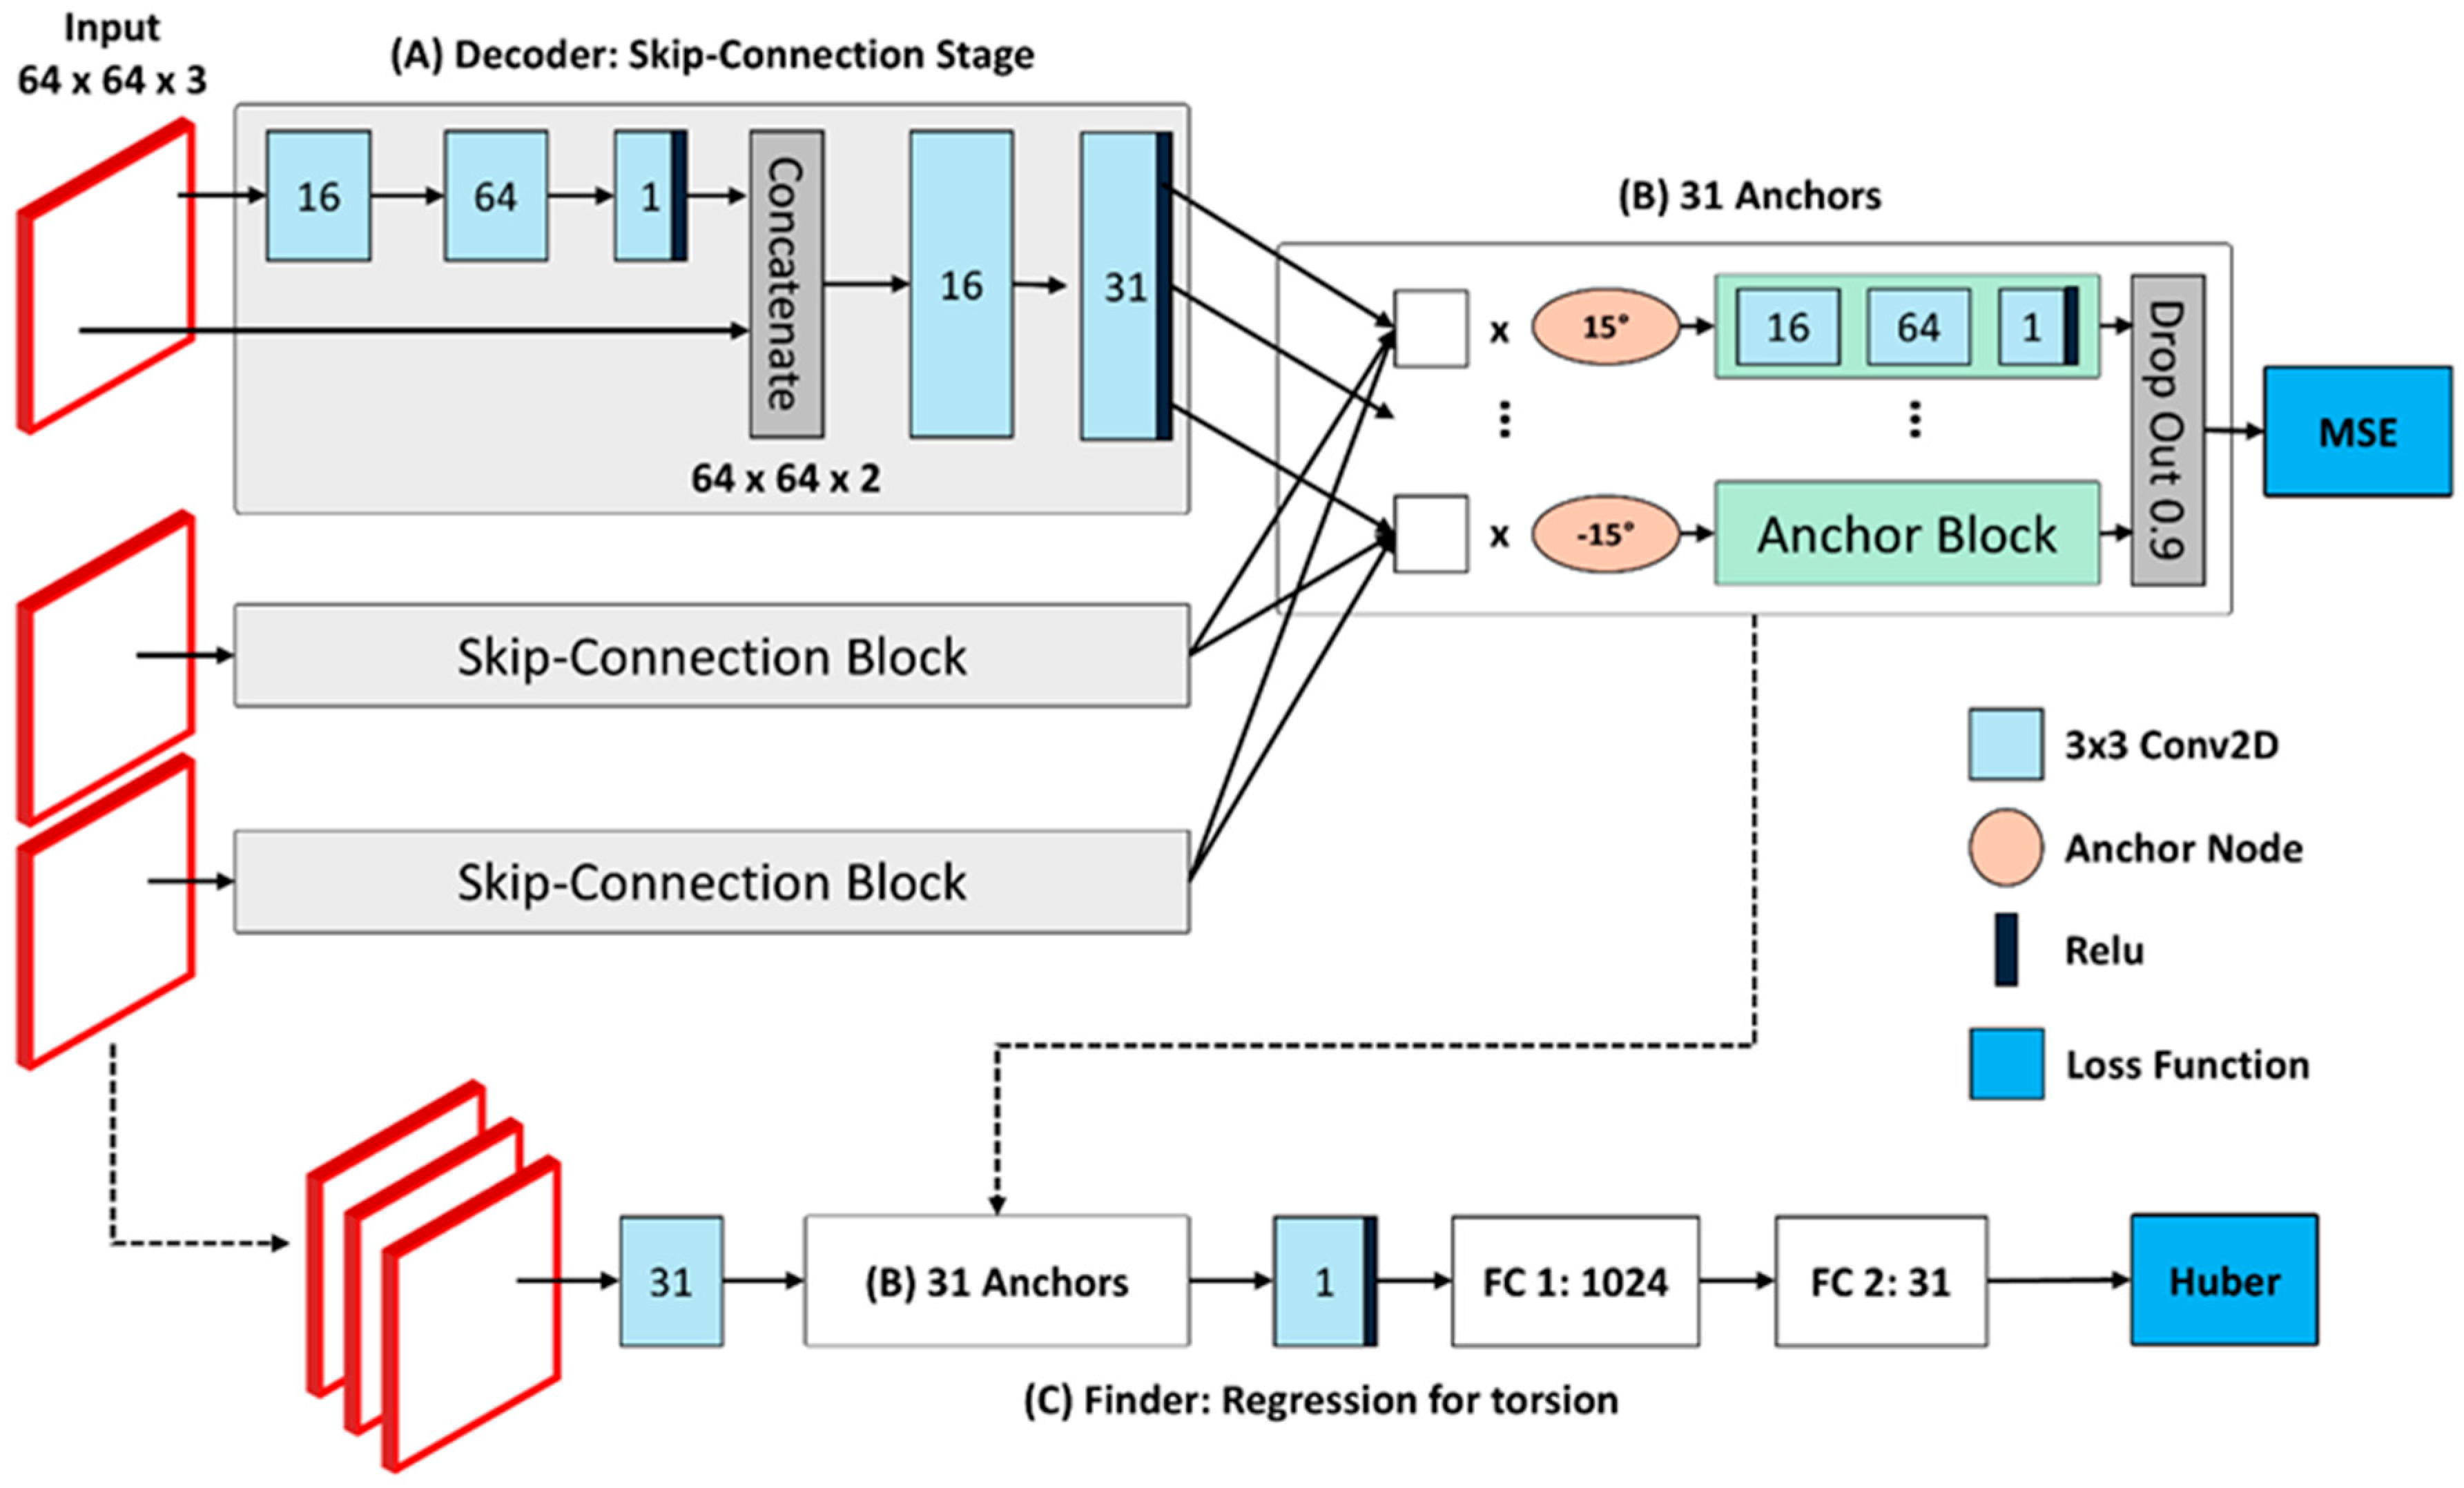
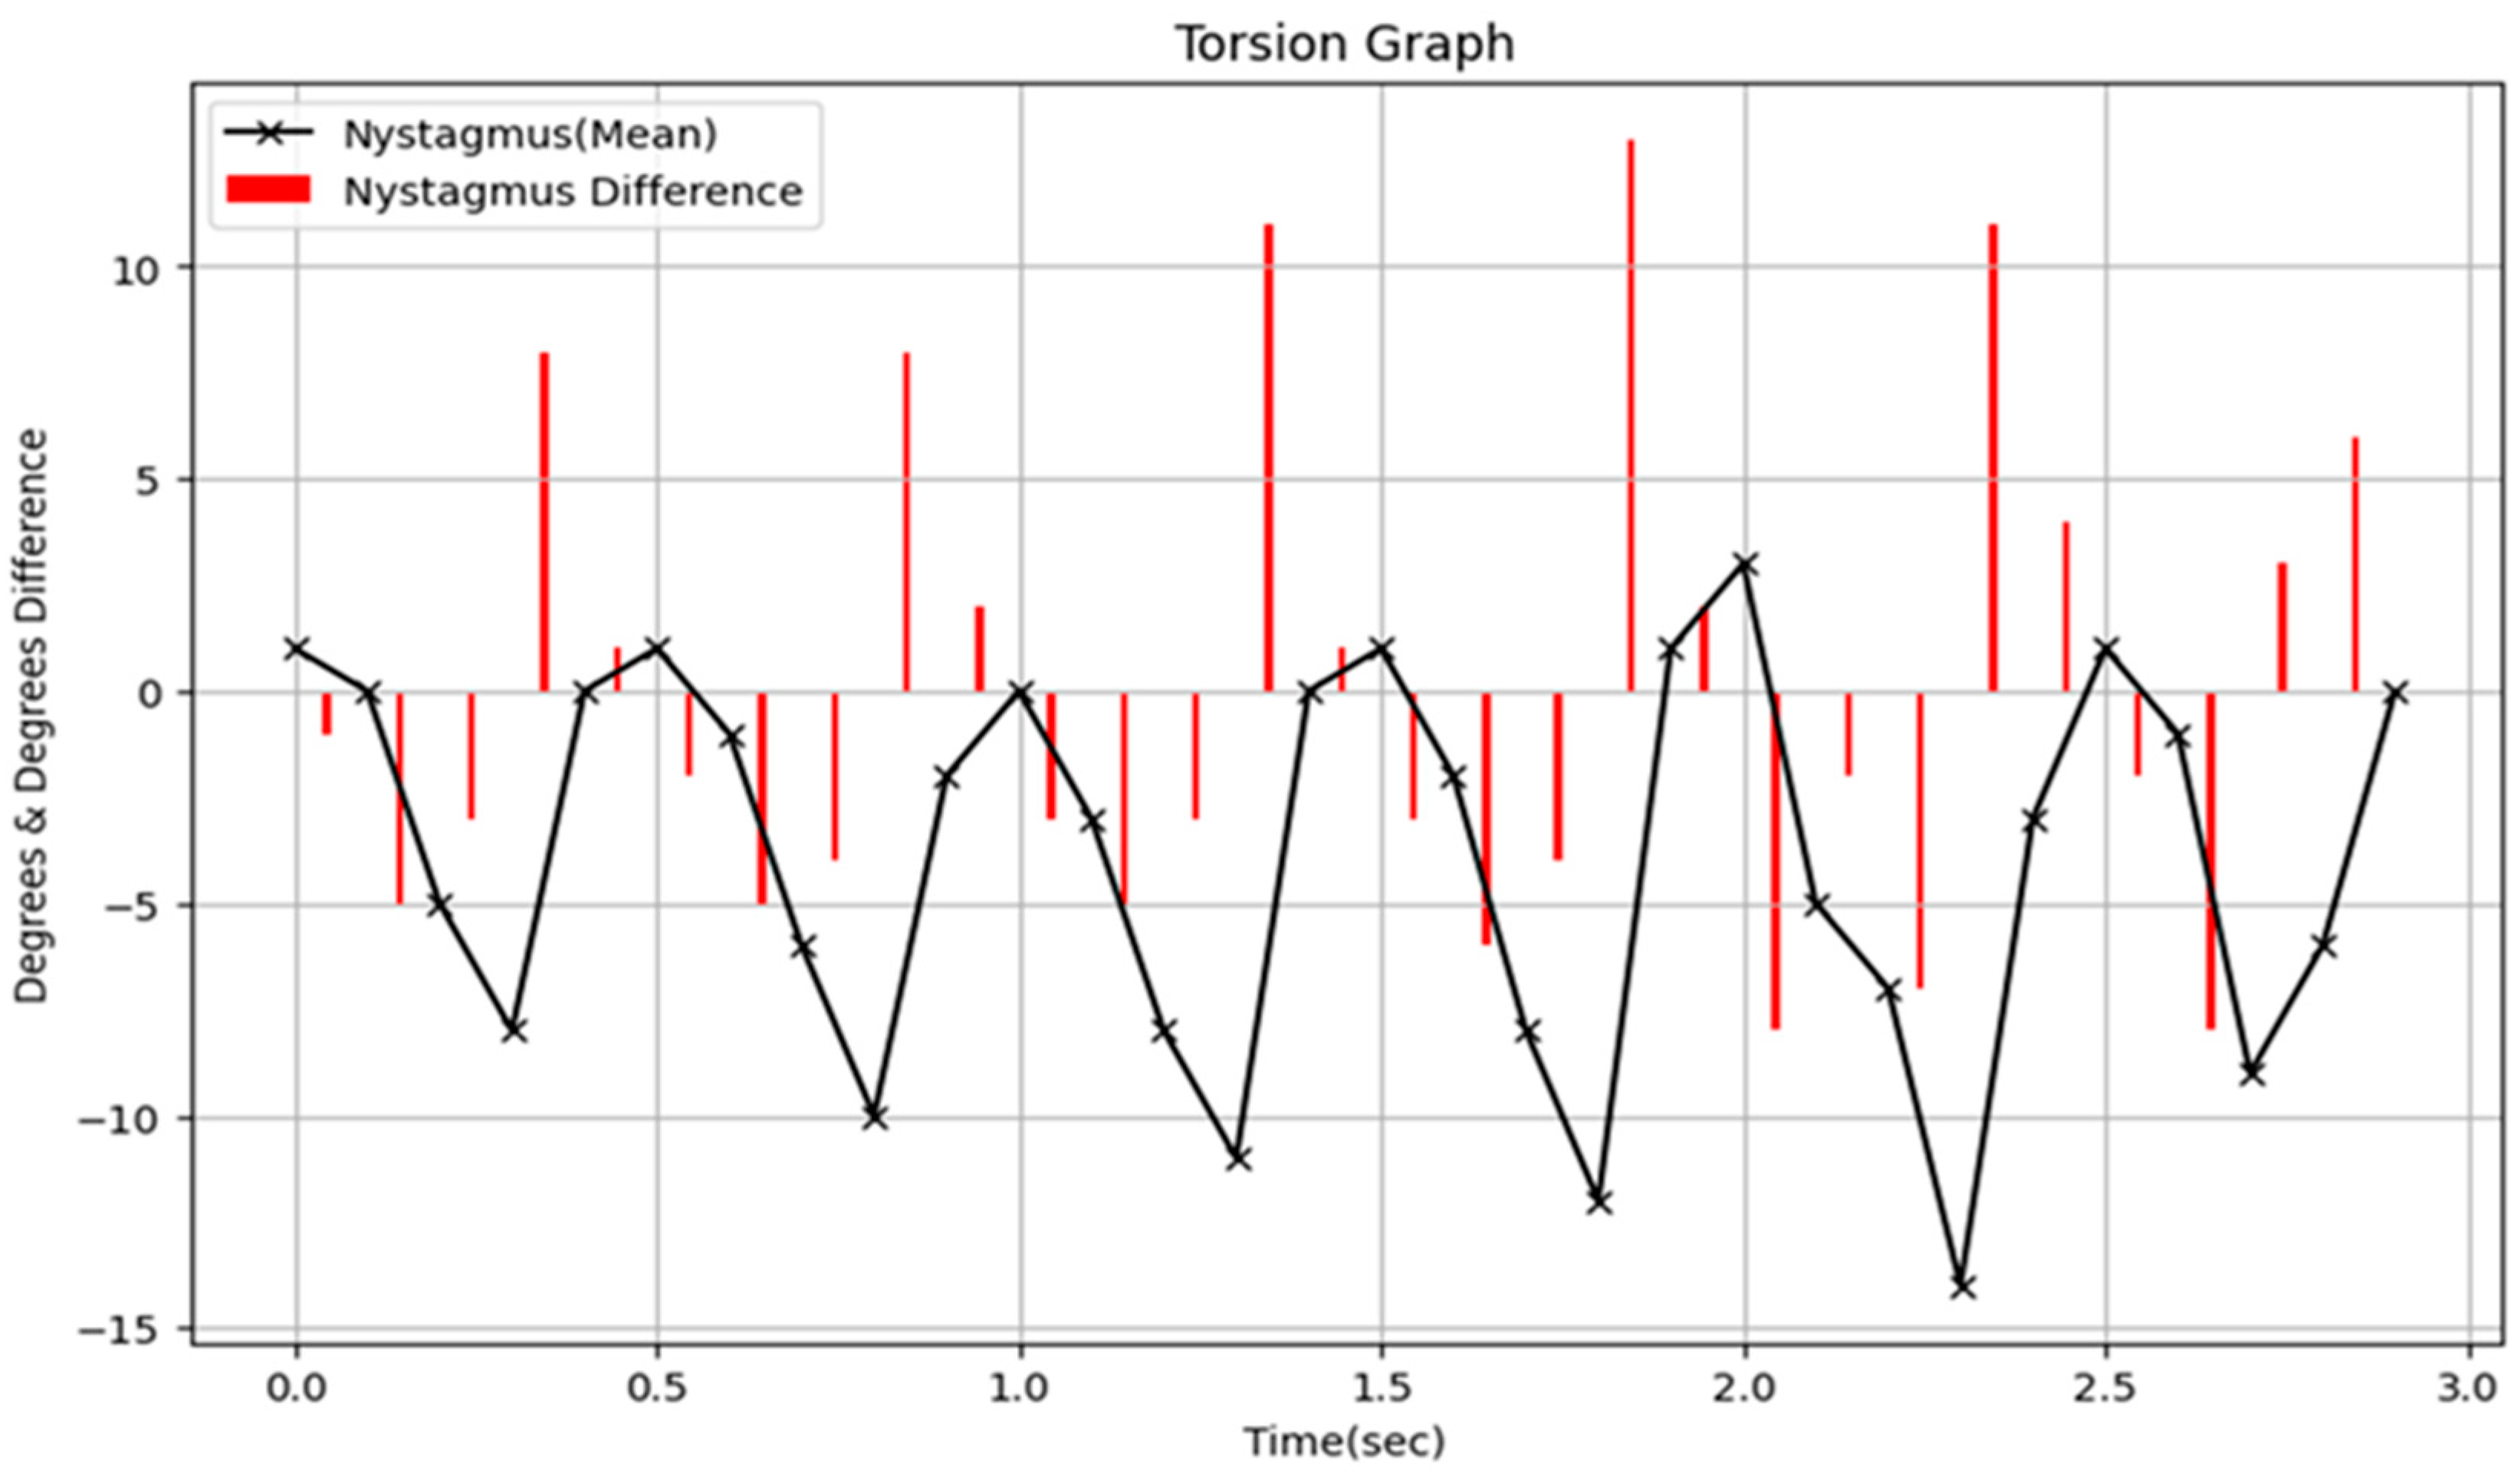
2.3. Torsion Transformer
2.4. Nystagmus Detection Model
3. Results
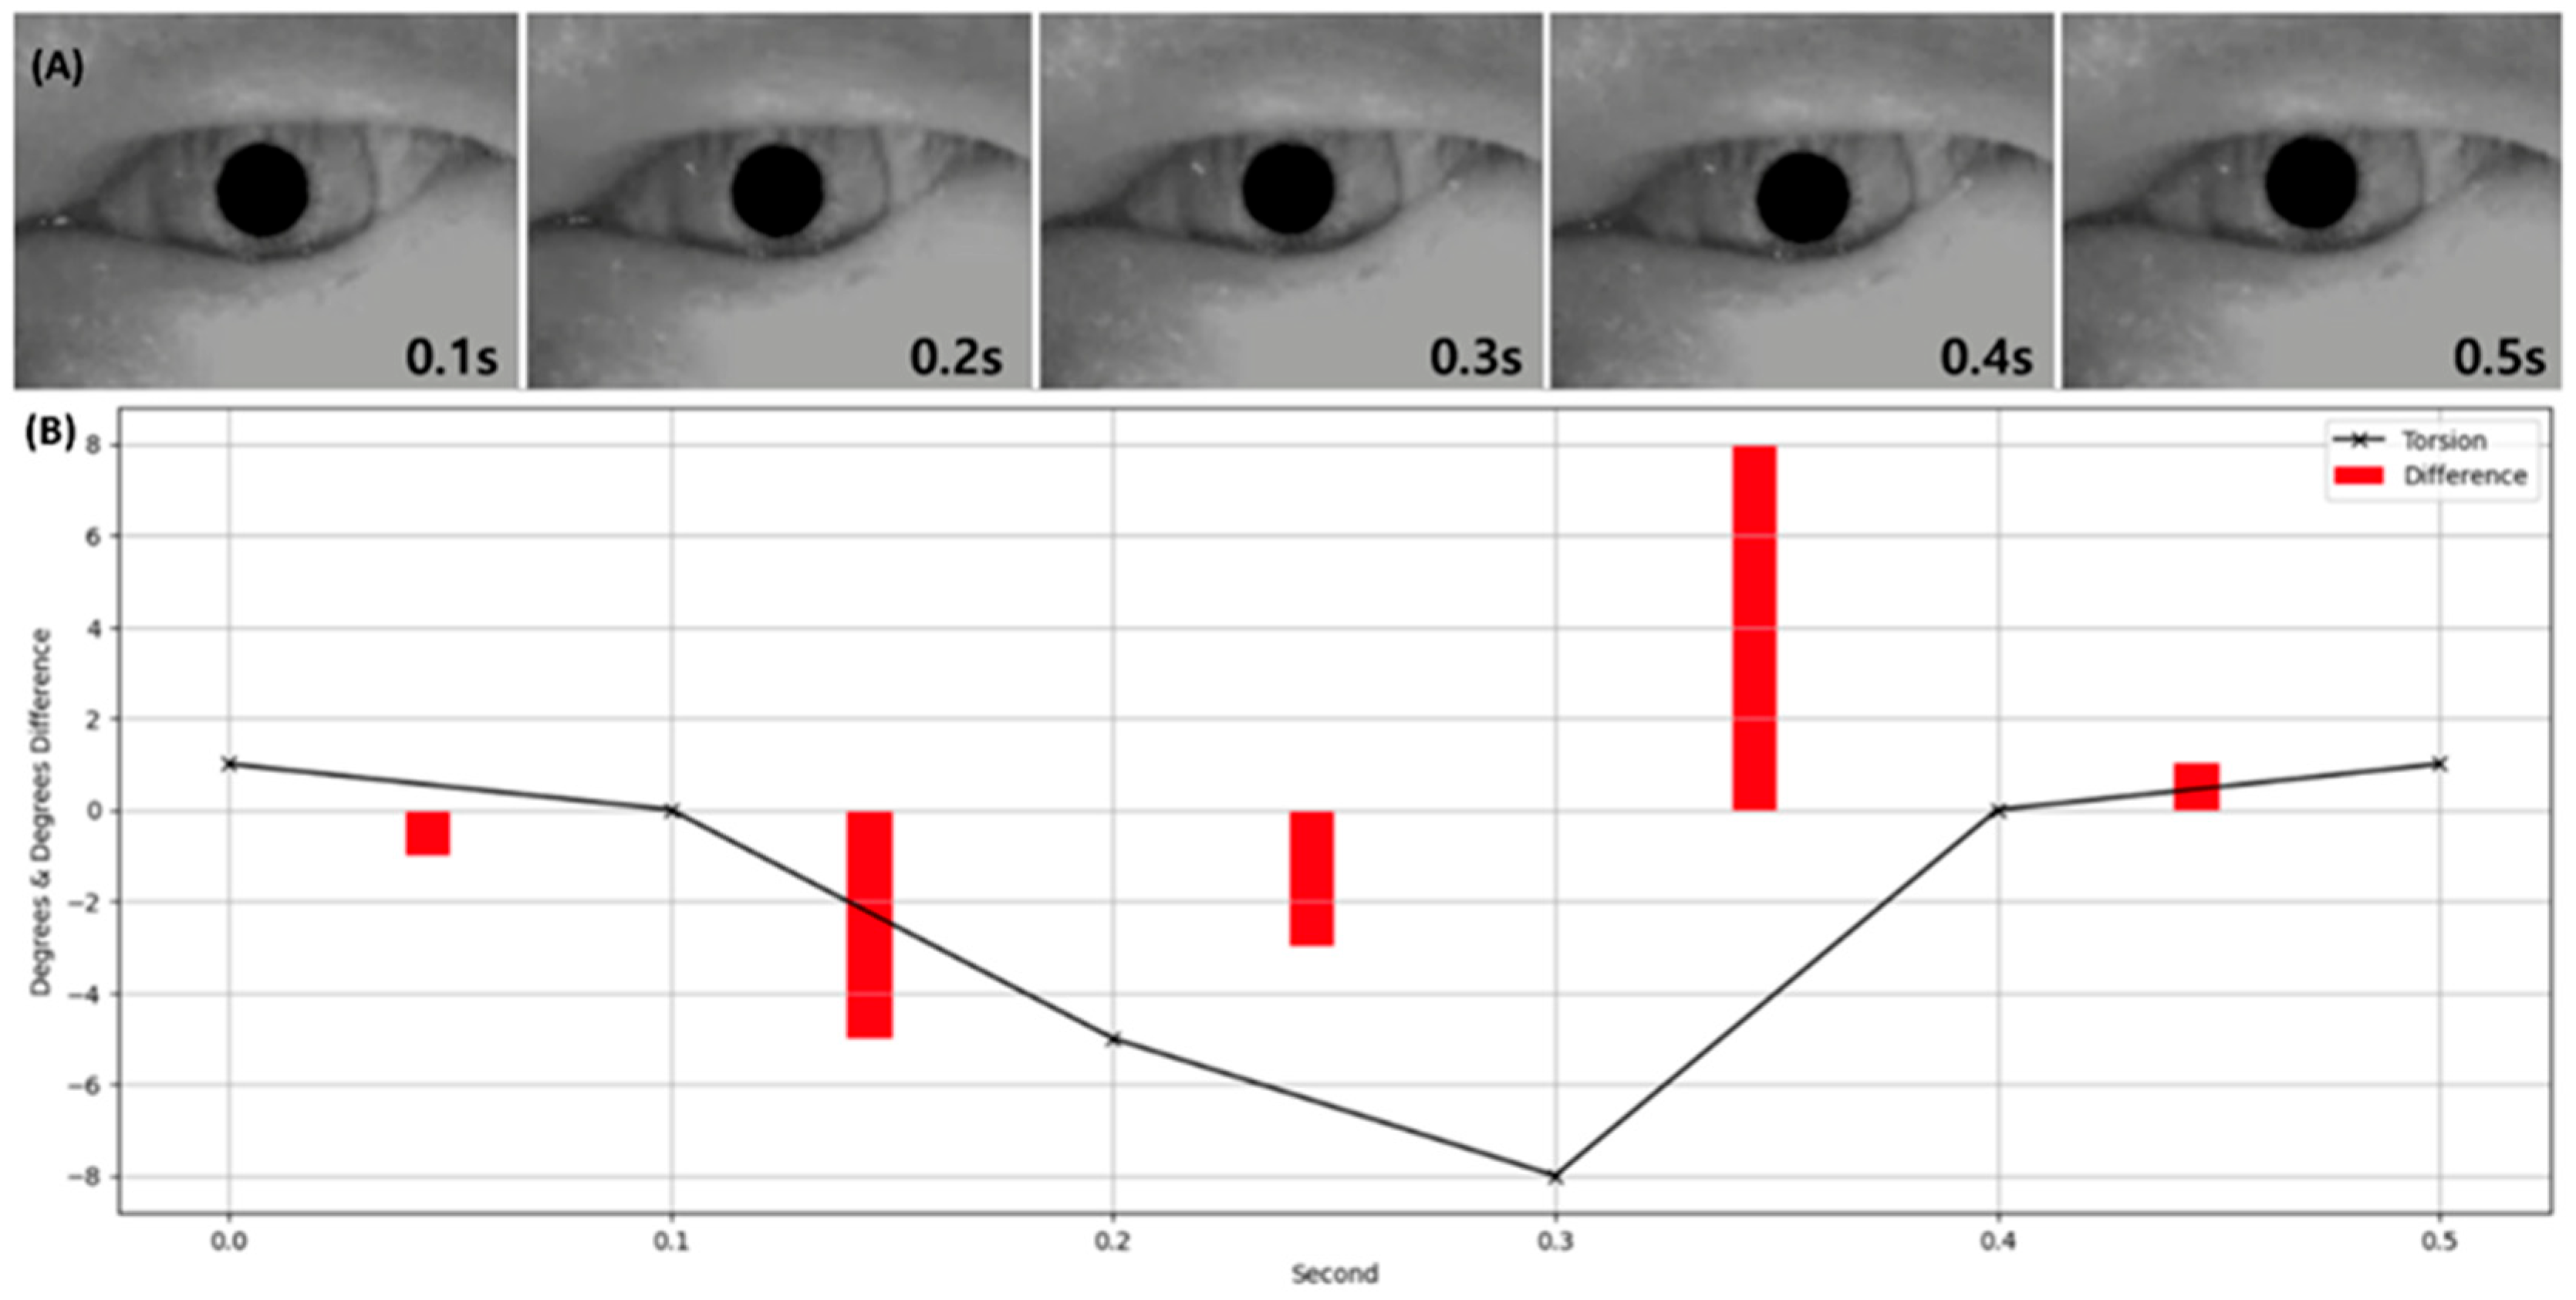
3.1. Performance Evaluation of Torsion Transformer for Torsion Prediction
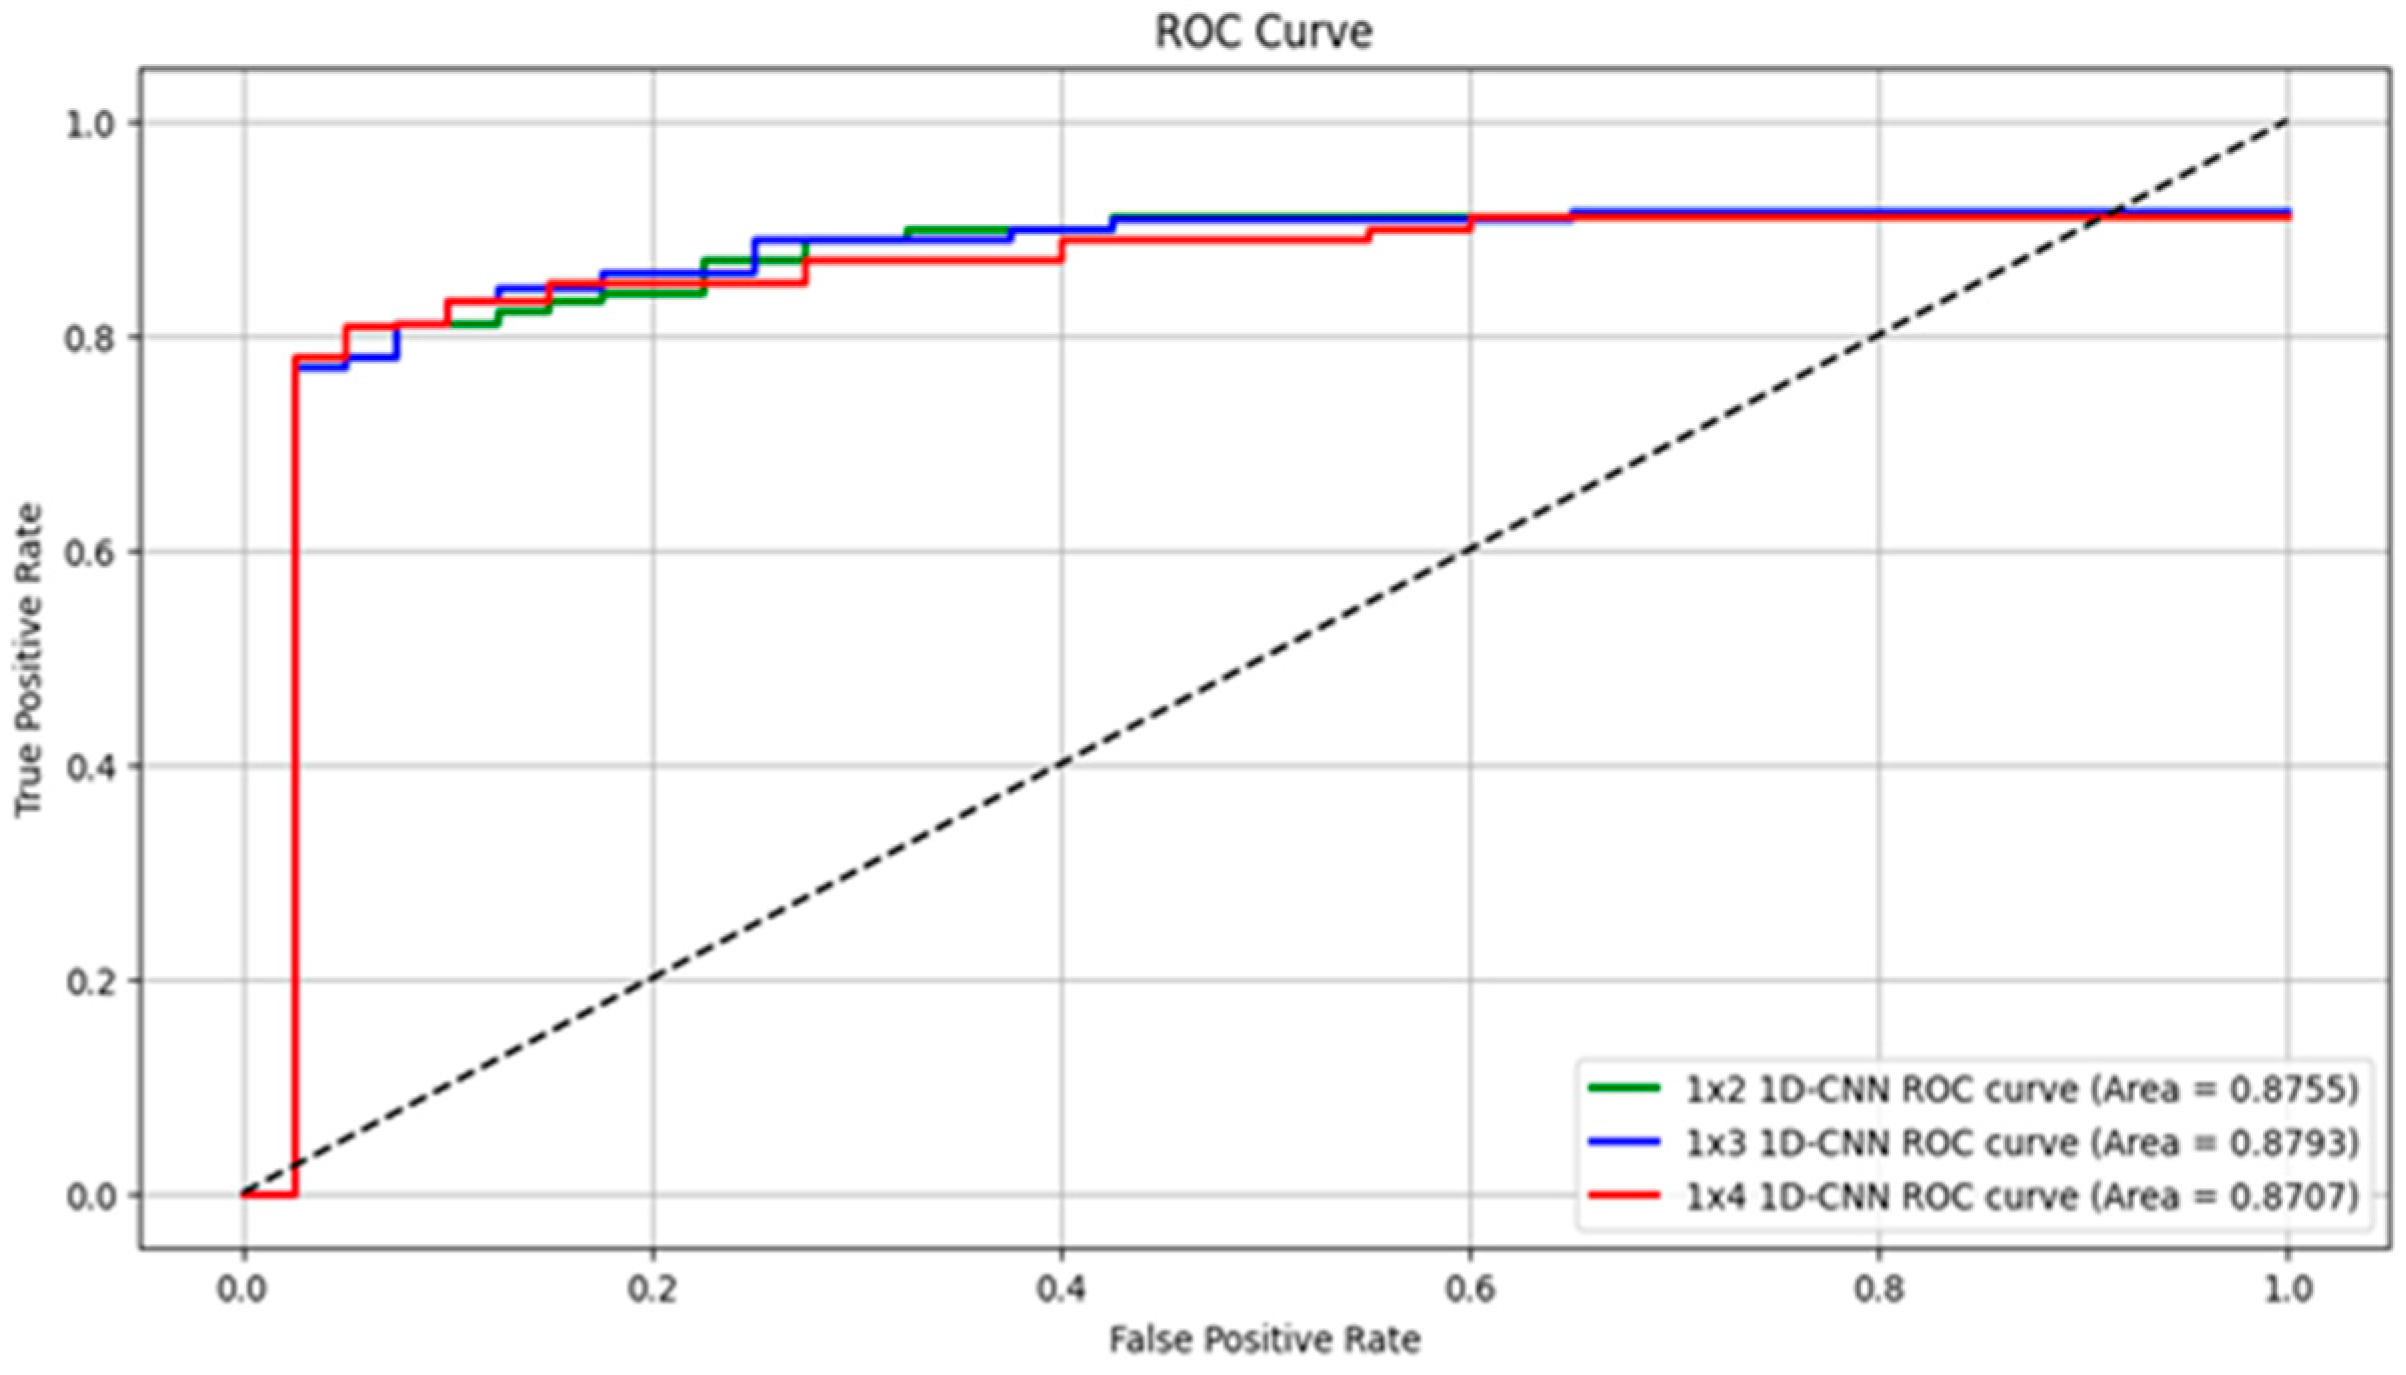
3.2. Performance and Optimization of Nystagmus Detection Model
4. Discussion
5. Conclusions
Author Contributions
Funding
Institutional Review Board Statement
Informed Consent Statement
Data Availability Statement
Conflicts of Interest
References
- Eggers, S.D.Z.; Bisdorff, A.; Von Brevern, M.; Zee, D.S.; Kim, J.S.; Perez-Fernandez, N.; Welgampola, M.S.; Della Santina, C.C.; Newman Toker, D.E. Classification of vestibular signs and examination techniques: Nystagmus and nystagmus-like movements. J. Vestib. Res. 2019, 29, 57–87. [Google Scholar] [CrossRef]
- Farhat, R.; Awad, A.A.; Shaheen, W.A.; Alwily, D.; Avraham, Y.; Najjar, R.; Merchavy, S.; Massoud, S. The “Vestibular Eye Sign”-”VES”: A new radiological sign of vestibular neuronitis can help to determine the affected vestibule and support the diagnosis. J. Neurol. 2023, 270, 4360–4367. [Google Scholar] [CrossRef]
- Carmona, S.; Zalazar, G.J.; Fernández, M.; Grinstein, G.; Lemos, J. Atypical positional vertigo: Definition, causes, and mechanisms. Audiol. Res. 2022, 12, 152–161. [Google Scholar] [CrossRef] [PubMed]
- Kim, H.J.; Park, J.; Kim, J.S. Update on benign paroxysmal positional vertigo. J. Neurol. 2021, 268, 1995–2000. [Google Scholar] [CrossRef] [PubMed]
- Balatsouras, D.G.; Koukoutsis, G.; Ganelis, P.; Economou, N.C.; Moukos, A.; Aspris, A.; Katotomichelakis, M. Benign paroxysmal positional vertigo secondary to vestibular neuritis. Eur. Arch. Oto-Rhino-Laryngol. 2014, 271, 919–924. [Google Scholar] [CrossRef]
- Li, H.; Yang, Z. Torsional nystagmus recognition based on deep learning for vertigo diagnosis. Front. Neurosci. 2023, 17, 1160904. [Google Scholar] [CrossRef] [PubMed]
- Tanimoto, H.; Doi, K.; Nishikawa, T.; Nibu, K. Risk factors for recurrence of benign paroxysmal positional vertigo. J. Otolaryngol.--Head Neck Surg. 2008, 37, 832–835. [Google Scholar]
- Hu, Y.; Lu, Y.; Wang, S.; Quan, X.; Ren, Y.; Rong, K.; Pan, S.; Lu, X.; Chen, L.; Tian, C.; et al. Global research trends in benign paroxysmal positional vertigo: A bibliometric analysis. Front. Neurol. 2023, 14, 1204038. [Google Scholar] [CrossRef]
- Lim, E.C.; Park, J.H.; Jeon, H.J.; Kim, H.J.; Lee, H.J.; Song, C.G.; Hong, S.K. Developing a Diagnostic Decision Support System for Benign Paroxysmal Positional Vertigo Using a Deep-Learning Model. J. Clin. Med. 2019, 8, 633. [Google Scholar] [CrossRef]
- Barin, K.; Petrak, M.R.; Cassidy, A.R.; Whitney, S.L. Quantified assessment of 3D nystagmus in BPPV: Practical considerations. Front. Neurol. 2025, 16, 1549407. [Google Scholar] [CrossRef]
- Yetiser, S.; Ince, D. Bilateral simultaneous presentation of posterior canal benign paroxysmal positional vertigo. J. Laryngol. Otol. 2024, 138, 284–288. [Google Scholar] [CrossRef] [PubMed]
- Ganança, M.M.; Caovilla, H.H.; Ganança, F.F. Eletronistagmografia versus videonistagmografia. Braz. J. Otorhinolaryngol. 2010, 76, 399–403. [Google Scholar] [CrossRef] [PubMed]
- Kang, J.J.; Choi, S.; Na, S.; Oh, S.Y. Recording and interpretation of ocular movements: Spontaneous and induced nystagmus. Ann. Clin. Neurophysiol. 2023, 25, 10–18. [Google Scholar] [CrossRef]
- Hirvonen, T.P.; Aalto, H. Three-dimensional video-oculography in patients with vestibular neuritis. Acta Oto-Laryngol. 2009, 129, 1400–1403. [Google Scholar] [CrossRef] [PubMed]
- Choi, E.H.; Kim, H.J.; Kim, J.S. Digital therapeutics and telemedicine for benign paroxysmal positional vertigo and other vestibular disorders: A review. Res. Vestib. 2024, 23, 115–123. [Google Scholar] [CrossRef]
- Mun, S.B.; Kim, Y.J.; Lee, J.H.; Han, G.C.; Cho, S.H.; Jin, S.; Kim, K.G. Deep learning-based nystagmus detection for BPPV diagnosis. Sensors 2024, 24, 3417. [Google Scholar] [CrossRef]
- Zhang, W.; Wu, H.; Liu, Y.; Zheng, S.; Liu, Z.; Li, Y.; Zhao, Y.; Zhu, Z. Deep Learning Based Torsional Nystagmus Detection for Dizziness and Vertigo Diagnosis. Biomed. Signal Process. Control 2021, 68, 102616. [Google Scholar] [CrossRef]
- Pham, T.X.; Choi, J.W.; Mina, R.J.L.; Nguyen, T.X.; Madjid, S.R.; Yoo, C.D. Lad: A hybrid deep learning system for benign paroxysmal positional vertigo disorders diagnostic. IEEE Access 2022, 10, 113995–114007. [Google Scholar] [CrossRef]
- Ong, J.K.; Haslwanter, T. Measuring torsional eye movements by tracking stable iris features. J. Neurosci. Methods 2010, 192, 261–267. [Google Scholar] [CrossRef]
- Pham, T. BPPV videos dataset samples. IEEE Dataport, 17 October 2022. [Google Scholar] [CrossRef]
- Zhu, H.; Fan, H.; Shu, Z.; Yu, Q.; Zhao, X.; Gan, P. Edge detection with chroma components of video frame based on local autocorrelation. IEEE Access 2019, 7, 48543–48550. [Google Scholar] [CrossRef]
- UNet2DModel, Hugging Face. Available online: https://huggingface.co/docs/diffusers/v0.33.1/en/api/models/unet2d#unet2dmodel (accessed on 24 May 2025).
- Pourafkham, B.; Khotanlou, H. ES-Net: Unet-based model for the semantic segmentation of Iris. Multimed. Tools Appl. 2024, 84, 12395–12416. [Google Scholar] [CrossRef]
- Kim, C.H.; Shin, J.E.; Kim, H.; Park, J.Y. Posterior canal benign paroxysmal positional vertigo with long duration: Heavy or light cupula? Laryngoscope Investig. Otolaryngol. 2023, 8, 1108–1113. [Google Scholar] [CrossRef] [PubMed]
- Jain, G.; Mahara, T.; Sharma, S.C.; Agarwal, S.; Kim, H. TD-DNN: A Time Decay-Based Deep Neural Network for Recommendation System. Appl. Sci. 2022, 12, 6398. [Google Scholar] [CrossRef]
- Mukunda, K.; Ye, T.; Luo, Y.; Zoitou, A.; Kwon, K.; Singh, R.; Woo, J.W.; Sivakumar, N.; Greenstein, J.L.; Taylor, C.O.; et al. Comparing and Explaining Deep-learning Torsional Nystagmus Detection. Neurology 2025, 104, 3852. [Google Scholar] [CrossRef]


| Class = Subject(%) | RMSE 1 (STD) | SSIM 2 | Accuracy |
|---|---|---|---|
| Normal = 29,514(0.7) | 28.38 (±1.36) | 0.9208 | 81.53 |
| Nystagmus= 12,651(0.3) | 27.41 (±1.21) | 0.9320 |
| Window Size | Input Time (s) | Recall | Specificity | Precision | ACC | F1 Score |
|---|---|---|---|---|---|---|
| 2 × 1 | 0.2 | 87.13 | 88.37 | 89.74 | 87.70 | 88.42 |
| 3 × 1 | 0.3 | 89.99 | 86.36 | 87.67 | 87.57 | 88.82 |
| 4 × 1 | 0.4 | 88.97 | 85.46 | 87.61 | 87.34 | 88.28 |
| 5 × 1 | 0.5 | 82.81 | 82.01 | 84.59 | 82.44 | 83.69 |
| 6 × 1 | 0.6 | 78.30 | 77.20 | 79.56 | 77.79 | 78.93 |
| 7 × 1 | 0.7 | 78.00 | 76.58 | 78.80 | 77.33 | 78.40 |
| 8 × 1 | 0.8 | 78.15 | 75.77 | 78.26 | 77.02 | 78.20 |
| 9 × 1 | 0.9 | 77.93 | 76.58 | 78.79 | 77.29 | 78.36 |
| Study (Year) | Target 1 (Quantitative Information) 2 | Dataset No. Patients (No. VNG) | Method | Performance(%) | |||||
|---|---|---|---|---|---|---|---|---|---|
| Recall | Specificity | Precision | ACC | F1 Score | AUROC | ||||
| Ours (2025) | Torsional (Torsion) | 127 (225) | 1D-CNN Using Torsional Feature Components | 89.99 | 86.36 | 87.67 | 87.57 | 88.82 | 87.93 |
| Krishna et al. (2025) [26] | Torsional (No Measure) | 72 (60) | 2.5D ResNet | 89.62 | 83.96 | - | 86.79 | - | 93.08 |
| Li et al. (2023) [6] | Torsional (No Measure) | 1236 (24,521) | BiLSTM | 91.20 | - | 94.30 | 92.90 | - | - |
| Zhang et al. (2021) [17] | Torsional (No Measure) | No reported (77) | TBSIN model with pupil position correction and optical flow | 78.92 | - | 81.88 | 85.73 | 81.00 | - |
| Lim et al. (2019) [9] | Torsional (No Measure) | No data reported for Torsion | 2D-CNN using grid images | 78.30 | 79.9 | - | - | - | 85.30 |
Disclaimer/Publisher’s Note: The statements, opinions and data contained in all publications are solely those of the individual author(s) and contributor(s) and not of MDPI and/or the editor(s). MDPI and/or the editor(s) disclaim responsibility for any injury to people or property resulting from any ideas, methods, instructions or products referred to in the content. |
© 2025 by the authors. Licensee MDPI, Basel, Switzerland. This article is an open access article distributed under the terms and conditions of the Creative Commons Attribution (CC BY) license (https://creativecommons.org/licenses/by/4.0/).
Share and Cite
Han, J.-H.; Kim, Y.-S.; Lee, J.B.; Kim, H.; Kim, J.-Y.; Cho, Y. Transformer-Based Detection and Clinical Evaluation System for Torsional Nystagmus. Sensors 2025, 25, 4039. https://doi.org/10.3390/s25134039
Han J-H, Kim Y-S, Lee JB, Kim H, Kim J-Y, Cho Y. Transformer-Based Detection and Clinical Evaluation System for Torsional Nystagmus. Sensors. 2025; 25(13):4039. https://doi.org/10.3390/s25134039
Chicago/Turabian StyleHan, Ju-Hyuck, Yong-Suk Kim, Jong Bin Lee, Hantai Kim, Jong-Yeup Kim, and Yongseok Cho. 2025. "Transformer-Based Detection and Clinical Evaluation System for Torsional Nystagmus" Sensors 25, no. 13: 4039. https://doi.org/10.3390/s25134039
APA StyleHan, J.-H., Kim, Y.-S., Lee, J. B., Kim, H., Kim, J.-Y., & Cho, Y. (2025). Transformer-Based Detection and Clinical Evaluation System for Torsional Nystagmus. Sensors, 25(13), 4039. https://doi.org/10.3390/s25134039