
Sustainable Self-Training Pig Detection System with Augmented Single Labeled Target Data for Solving Domain Shift Problem

 ,
, 
Abstract
Highlights
- The proposed approach combining a single labeled target sample, genetic algorithm-optimized augmentation, and super-low-threshold self-training more than doubled pig detection accuracy under domain shift (36.86 → 90.62), achieving a performance comparable to fully supervised training;
- The proposed system maintained high detection precision across diverse pigsty conditions (e.g., varying lighting, camera viewpoints, and pig sizes), demonstrating robust object detection performance against real-world domain shifts with minimal labeled data.
- The proposed solution requires only one labeled target image for model adaptation, drastically reducing the manual labeling effort and enabling quick, cost-effective deployment of pig detection models in new farm environments;
- By ensuring high accuracy under real-world domain shift scenarios, the system enables practical and scalable intelligent livestock management, improving monitoring reliability and overall farm efficiency.
Abstract
1. Introduction
- This study effectively addressed the domain shift problem using a single SLOT (target label) sample generated with minimal manual effort. The selected SLOT samples effectively captured the core characteristics of the target domain, enabling the model to adapt efficiently to the target environment while significantly reducing the burden of manual labeling.
- A DAS based on Genetic Algorithms (GAs) was applied to optimally augment the data derived from the SLOT sample, thereby constructing a more accurate base model. The automated exploration of the augmentation parameters improved the model’s performance in a stable and efficient manner.
- A novel super-low-threshold strategy, previously unexplored in existing self-training approaches, was introduced to incorporate pseudo-labels with low confidence scores into the training process. Owing to the high accuracy of the base model achieved in the SLOT+DAS stage, this approach was able to suppress excessive false detection noise while further enhancing the domain adaptation performance.
- Integrating these components into a unified system confirmed that the model consistently maintained high accuracy even under varying real-world deployment conditions (e.g., lighting, camera angles, and background). This integration is considered a key factor that increases the practical applicability of the system in operational settings such as livestock farms.
2. Related Work
3. Proposed Method
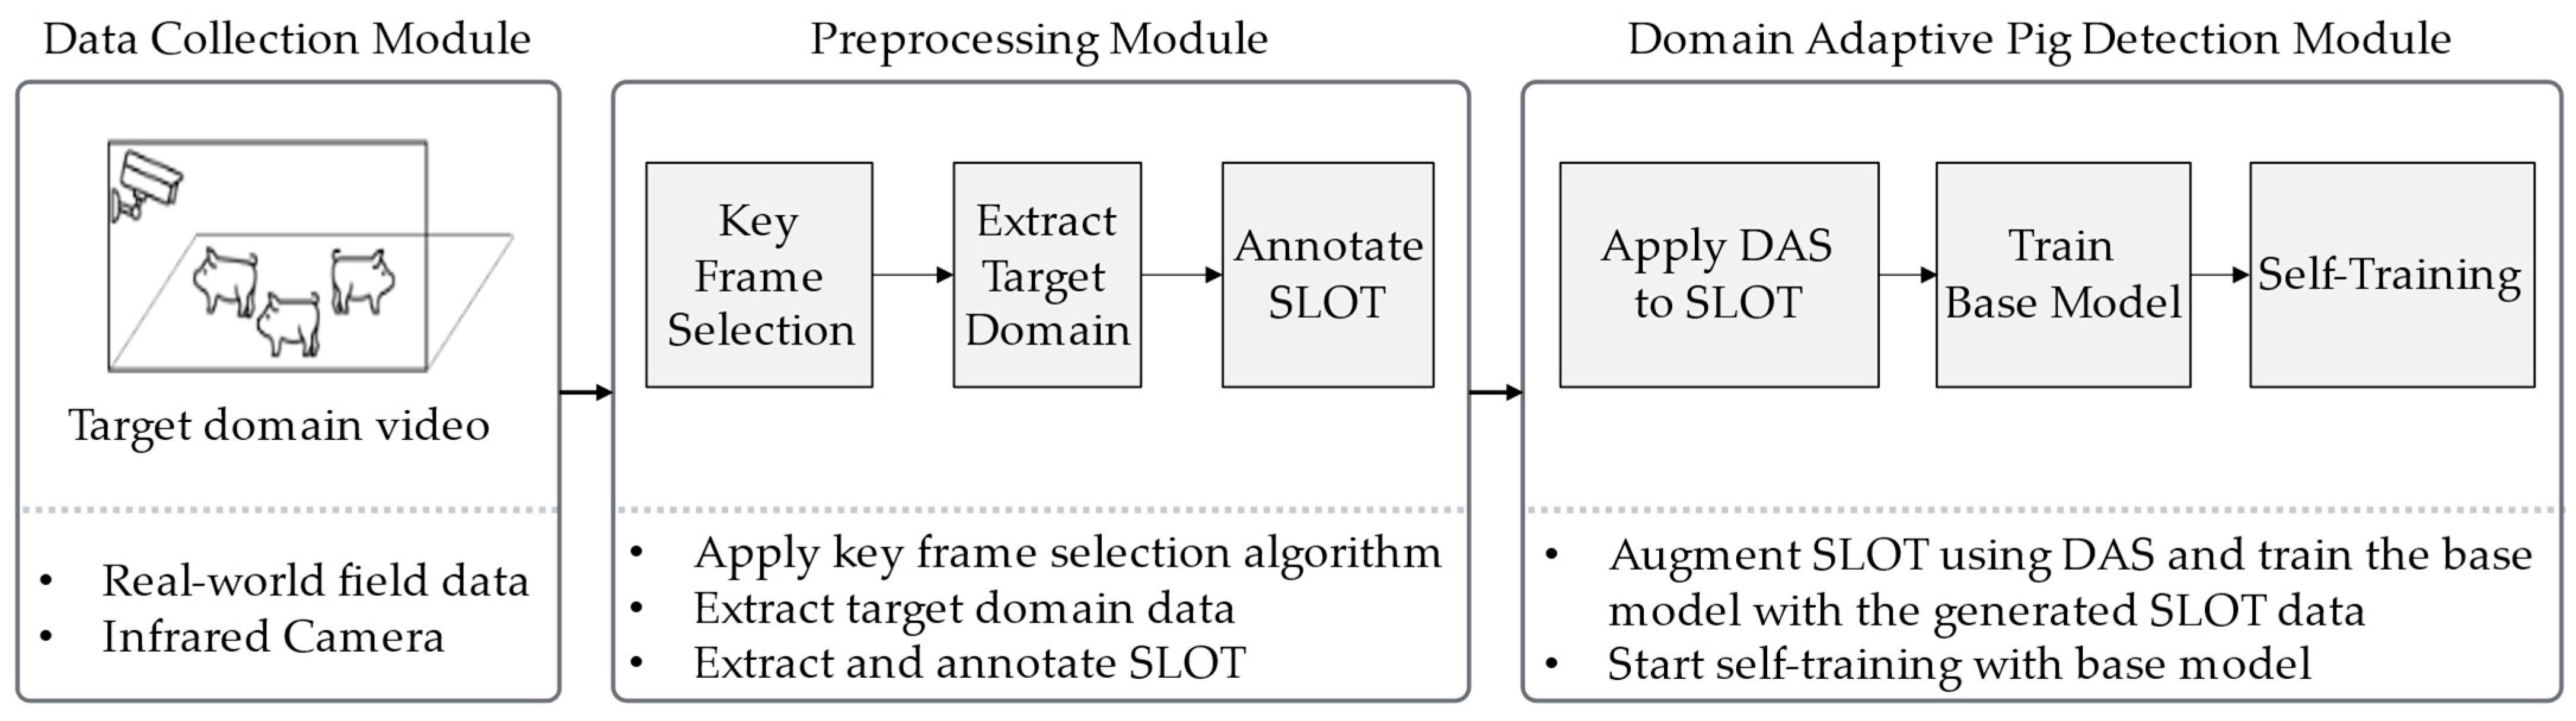
3.1. Data Collection Module
3.2. Preprocessing Module
3.2.1. Key Frame Selection
3.2.2. Single Label on Target Data Selection
3.3. Domain-Adaptive Pig Detection Module
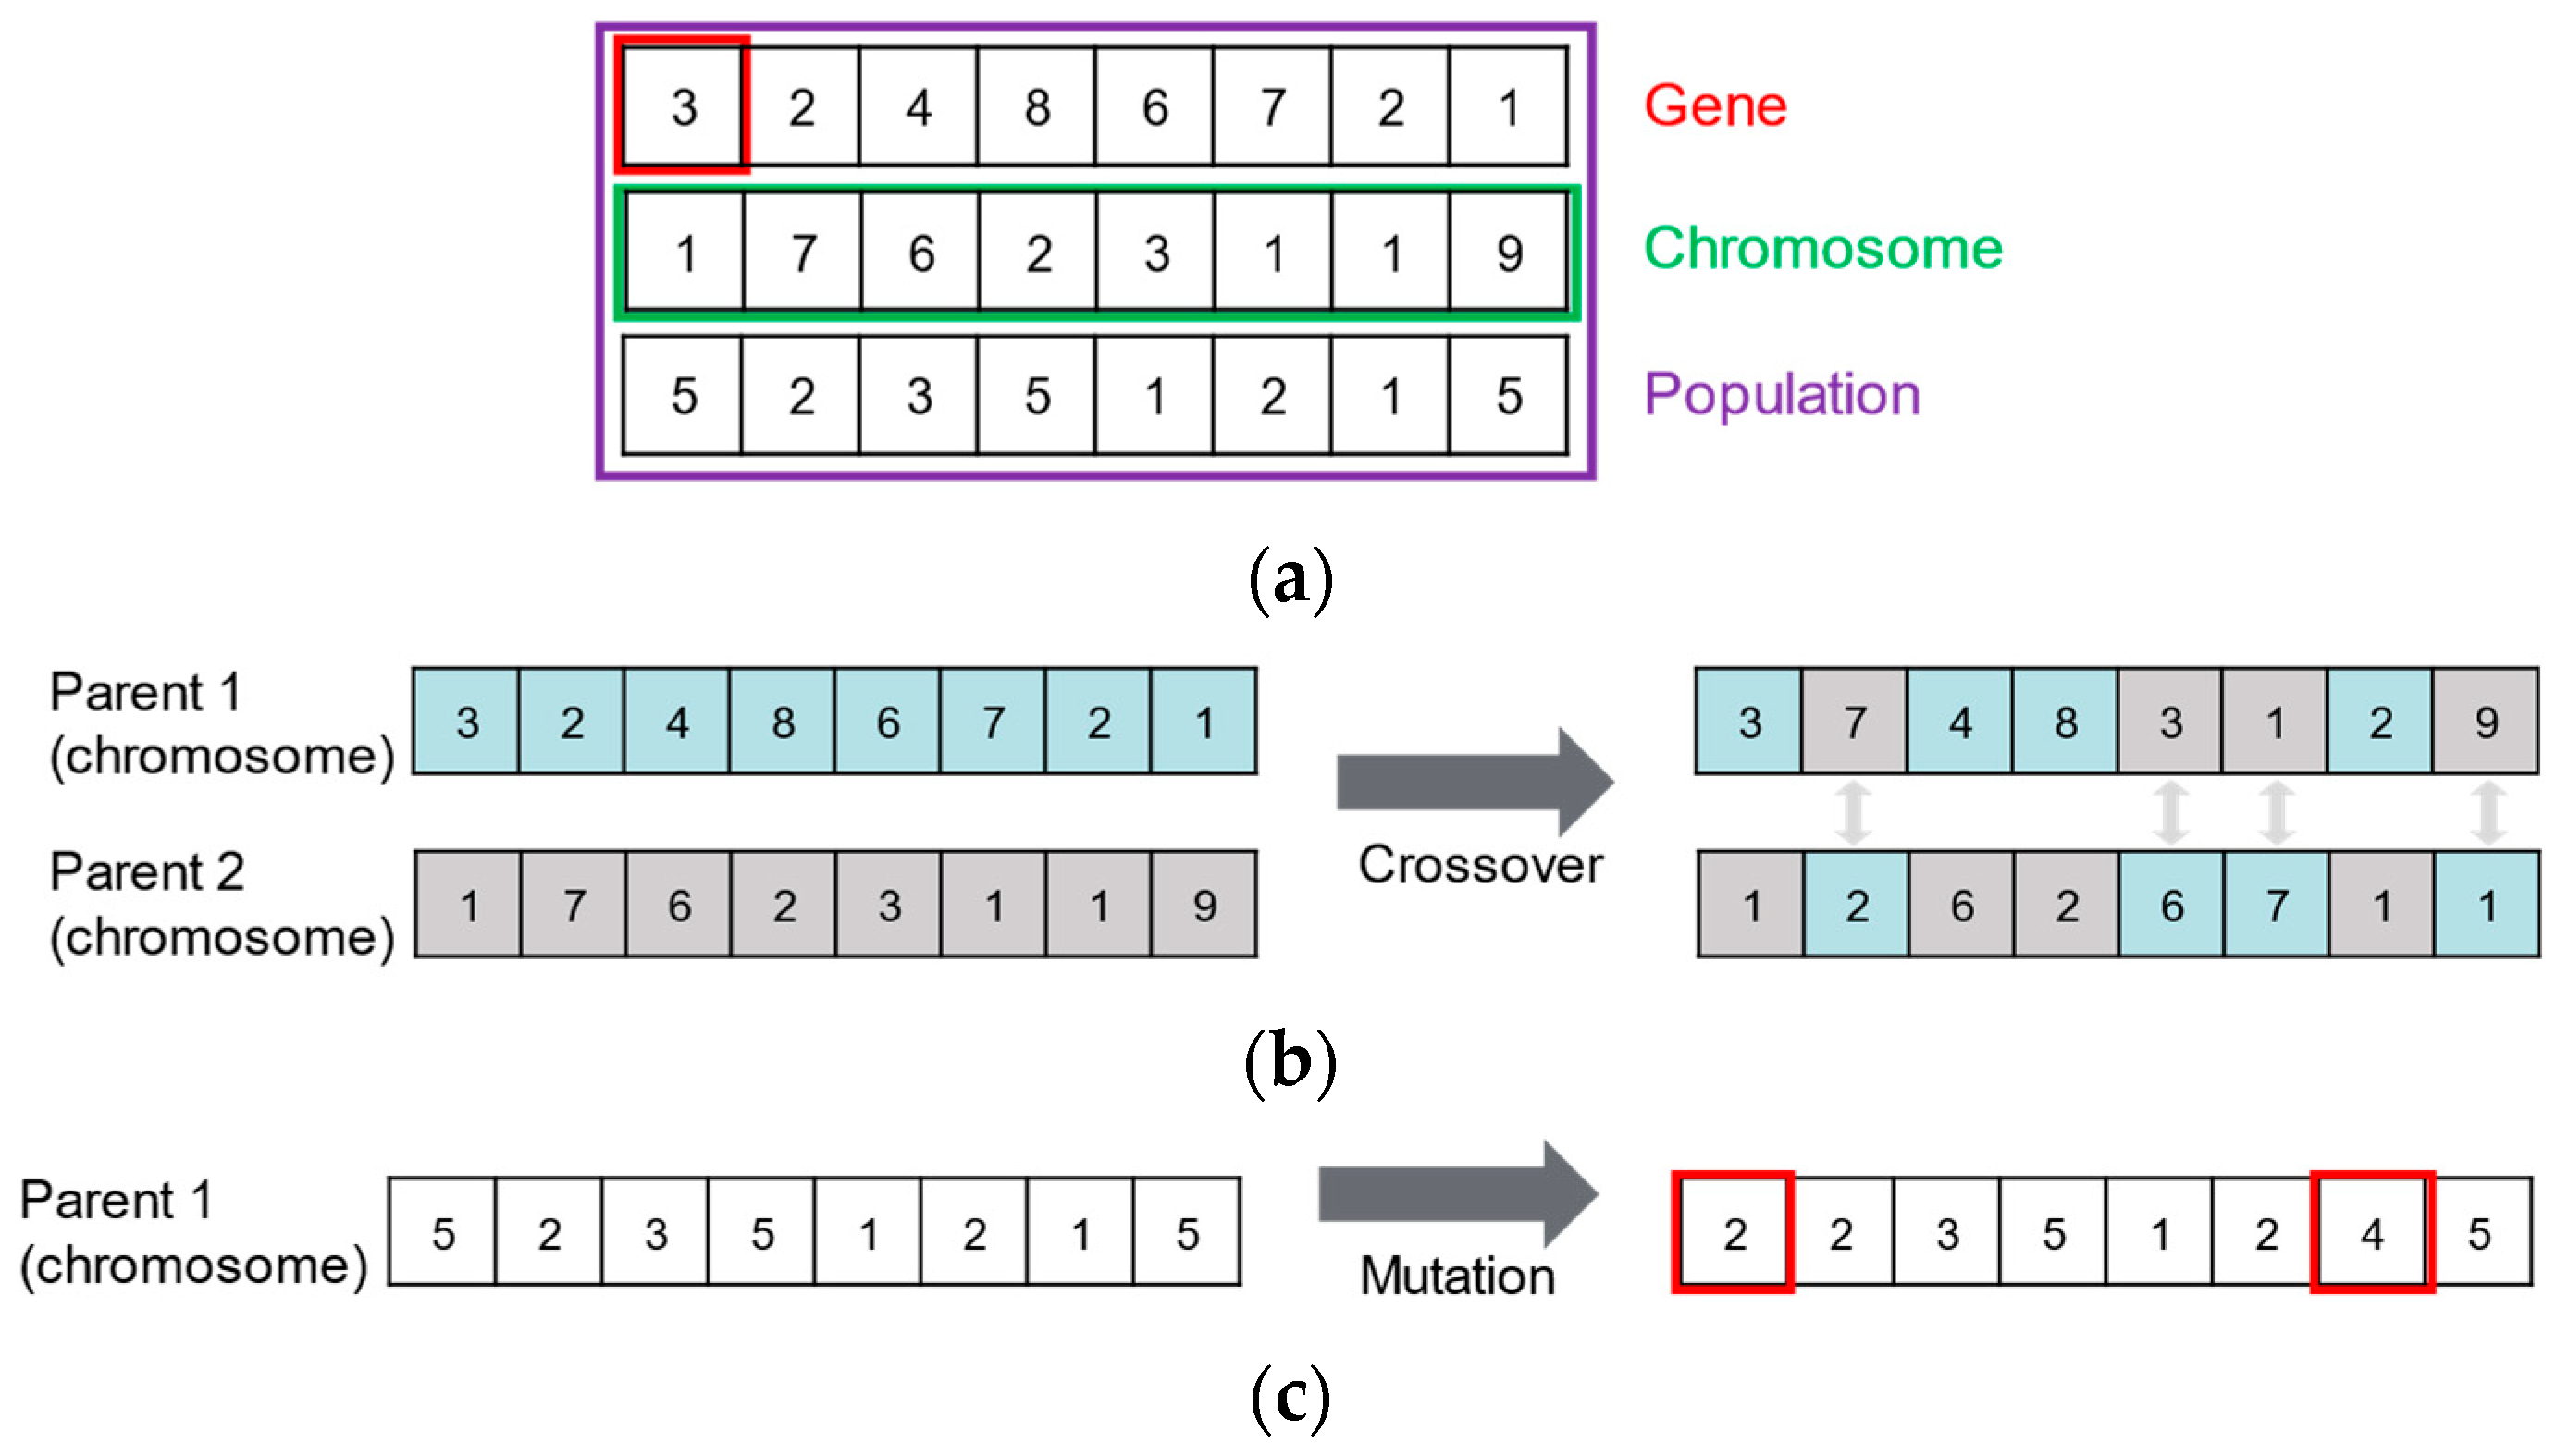
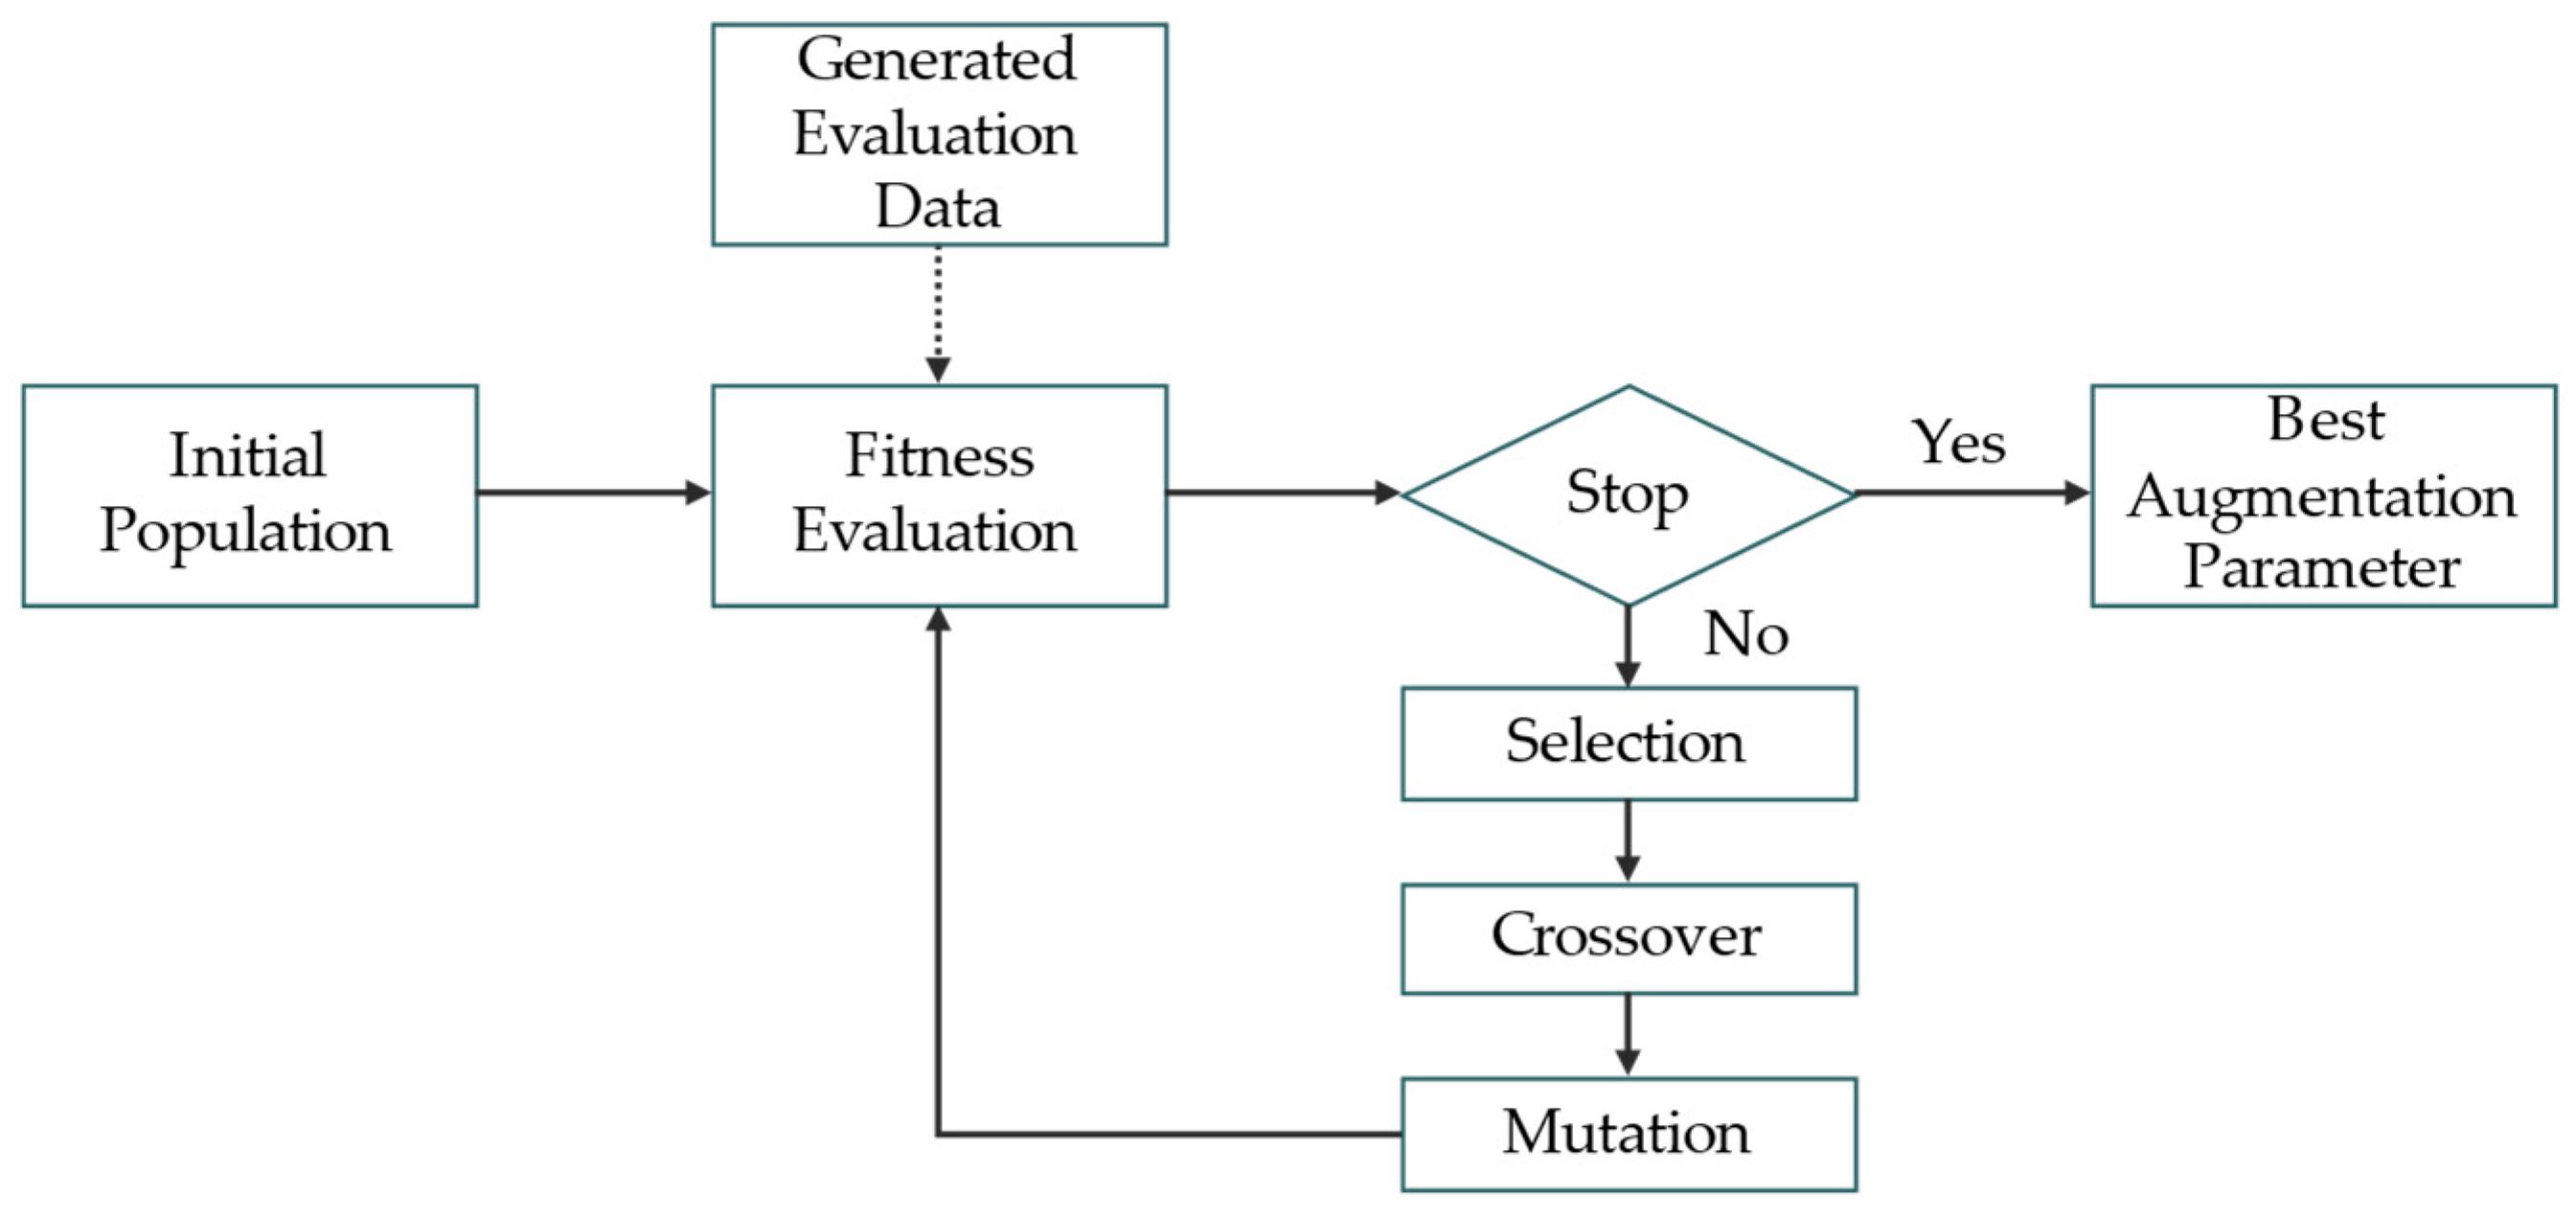
3.3.1. Data Augmentation Search for Base Model Training
| Algorithm 1. Pseudo-code of the GA | |
| Input: Objective function: , Population size: , Number of generations: | |
| Output: Best solution: | |
| Initialize: Initialized population: | |
| 1 | for |
| 2 | for each |
| 3 | -- evaluate fitness |
| 4 | |
| 5 | -- select top P chromosomes with highest fitness |
| 6 | |
| 7 | |
| 8 | |
3.3.2. Self-Training to Address Domain Shift
| Algorithm 2. SLOT-DAS with Self-Training for Domain Adaptation | |
| Input: Source data: , SLOT data: , Copy-and-paste data: , Unlabeled target-domain data: | |
| Output: Best augmentation parameter: , Trained target model: | |
| Initialize: Number of generations: , Initialized population: , Set of chromosomes: , Self-training iteration: , Confidence threshold: , Set of DD transformations: | |
| 1 | for |
| 2 | for each |
| 3 | |
| 4 | |
| 5 | -- early stop applied |
| 6 | -- using AP |
| 7 | |
| 8 | |
| 9 | |
| 10 | |
| 11 | |
| 12 | |
| 13 | |
| 14 | |
| 15 | |
| 16 | for |
| 17 | |
| 18 | for each |
| 19 | |
| 20 | |
| 21 | |
| 22 | |
| 23 | |
| 24 | |
| 25 | |
| 26 | |
4. Experiments
4.1. Data Collection and Datasets
4.2. Experimental Environment and Setup
4.2.1. Implementation Details
4.2.2. Evaluation Metric
4.3. Domain-Adaptive Pig Detection Results
4.3.1. Data Augmentation Search Results
4.3.2. Self-Training Results
5. Ablation Studies
5.1. Effect of Entropy-Based SLOT Data Selection
5.2. Initial Model Performance Based on the Number of SLOT Data Samples
5.3. Early Stopping in Data Augmentation Search
5.4. Effect of Key Framesz in Self-Training
5.5. Performance Analysis of Image Transformation Techniques
6. Discussion
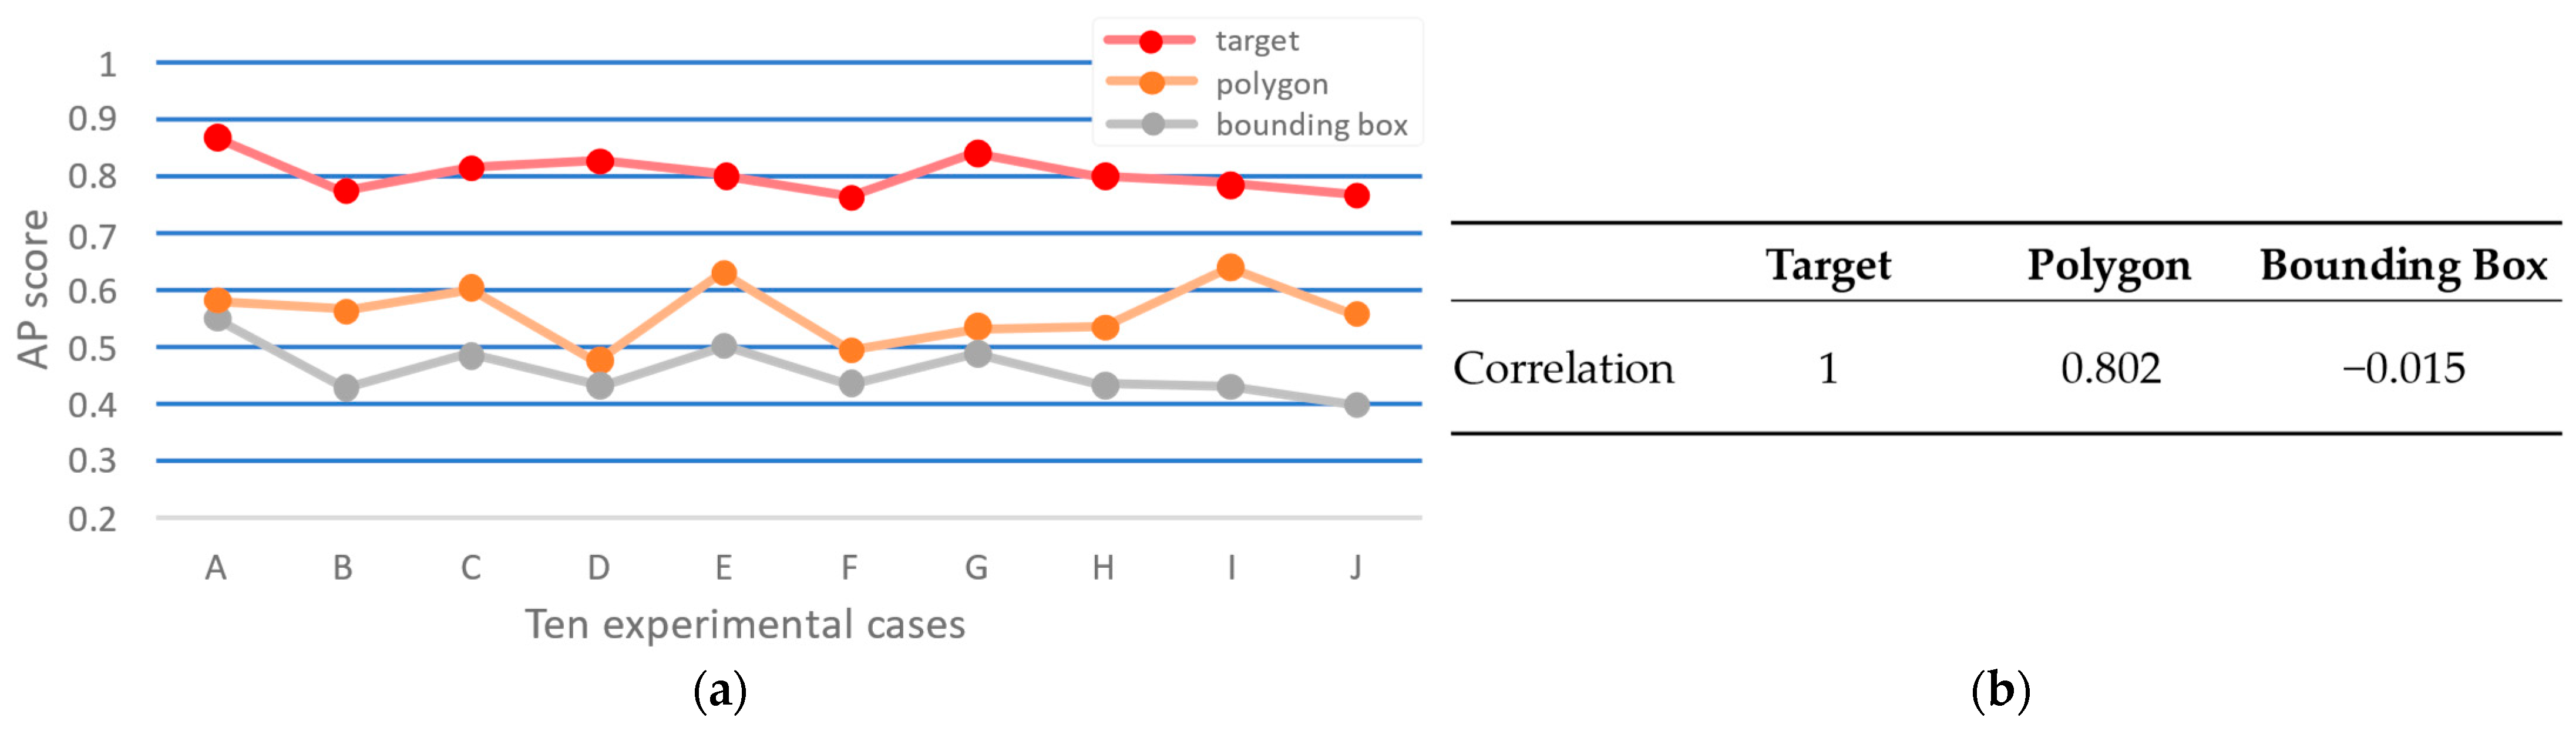
6.1. Correlation Between Entropy and the Number of Objects
6.2. Data Augmentation Search Evaluation Data Generation Method
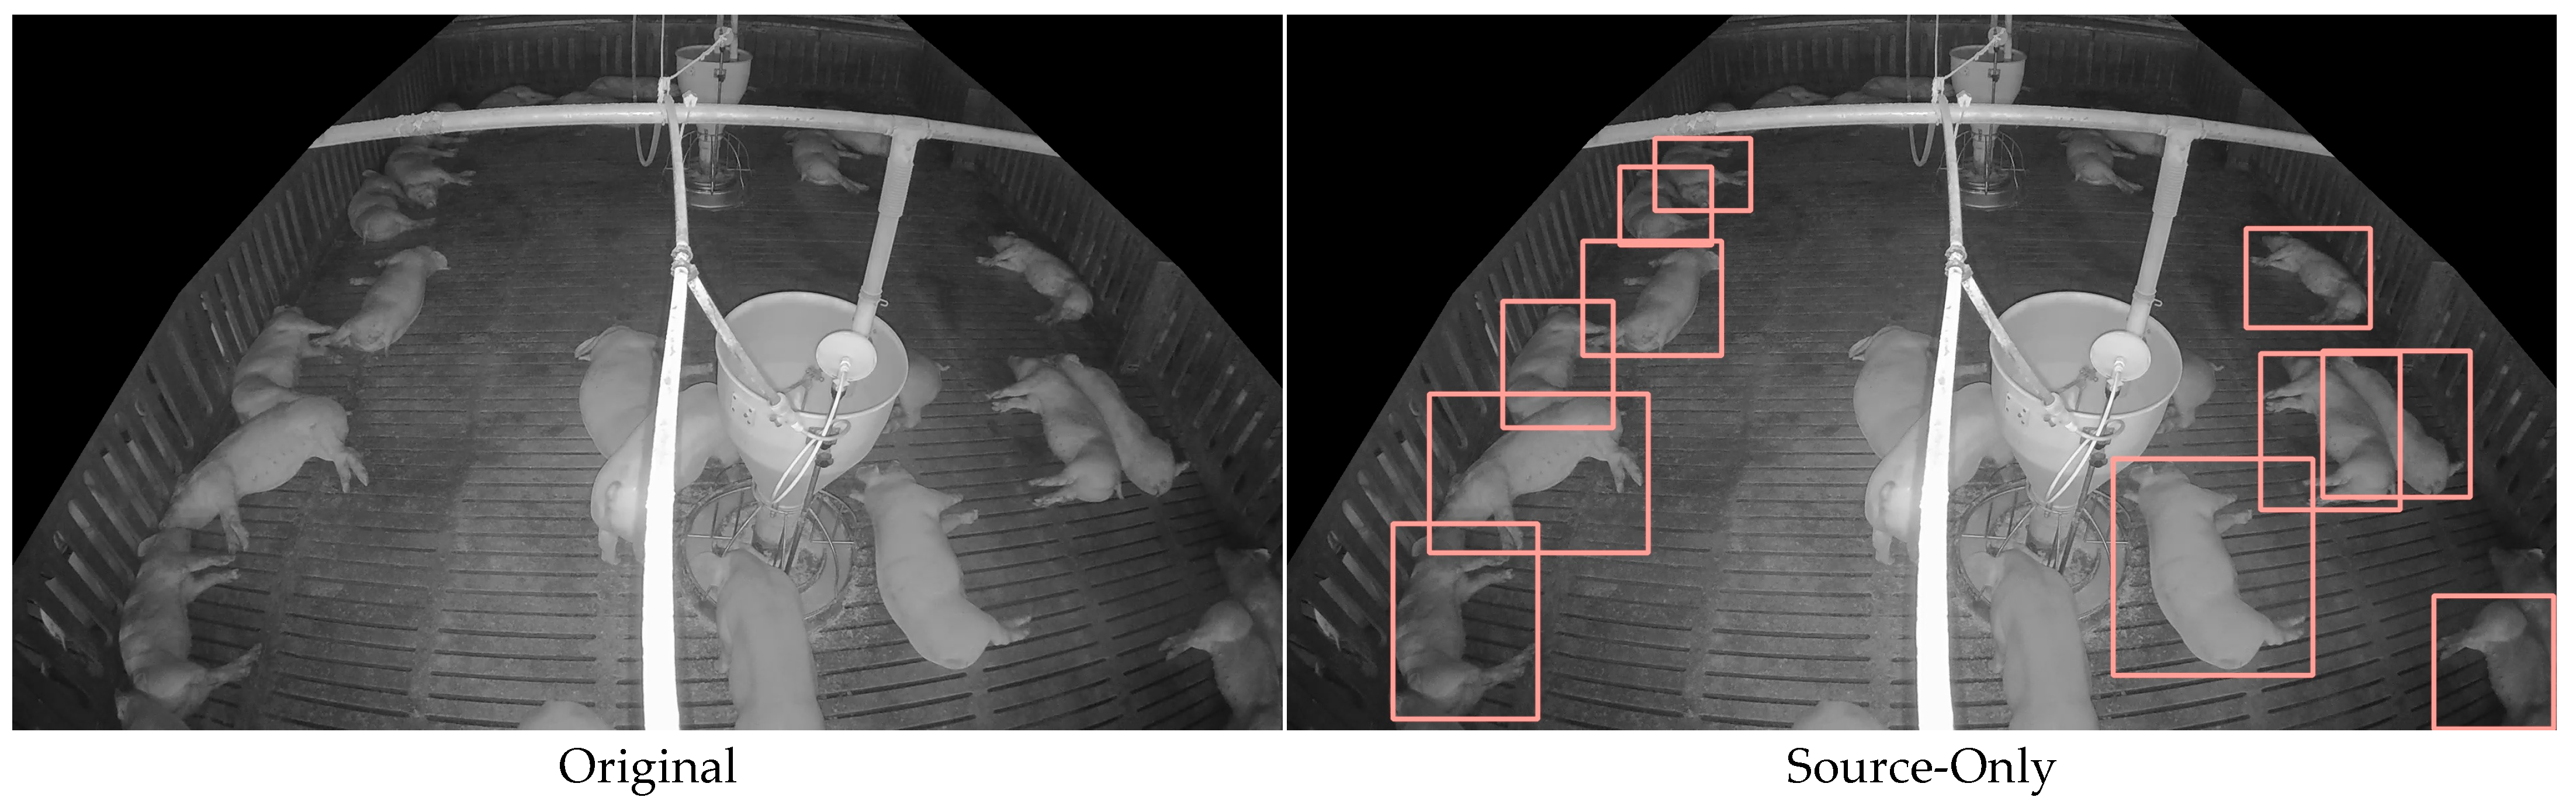
6.3. Comparison of Detection Results
6.4. Sensitivity and Robustness Analysis of the Confidence Threshold
6.5. Validation and Generalizability Across Models and Scenarios
7. Limitations and Future Work
8. Conclusions
Author Contributions
Funding
Institutional Review Board Statement
Informed Consent Statement
Data Availability Statement
Conflicts of Interest
Appendix A. Performance Verification with YOLOv5

| Augmentation Parameter | YOLOv5 | YOLOv8 |
|---|---|---|
| 24 | 48 | |
| 4 | 0 | |
| 2 | 1 | |
| 0 | 5 | |
| 1 | 8 | |
| 0 | 0 | |
| 1 | 1 | |
| 1 | 1 | |
| AP (%) | 56.46 | 48.30 |
| Epochs | Model | Params (M) | FLOPs (G) | Training Duration (hours) | Method | AP (%) |
|---|---|---|---|---|---|---|
| 150 | YOLOv5 | 20.86 | 47.87 | 5.35 | Oracle | 93.07 |
| Source-Only | 59.02 | |||||
| SLOT | 86.15 | |||||
| DAS | 88.80 | |||||
| YOLOv6 | 18.51 | 45.20 | 8.50 | Oracle | 88.01 | |
| Source-Only | 61.67 | |||||
| SLOT | 81.99 | |||||
| DAS | 88.55 | |||||
| YOLOv7 | 36.91 | 104.50 | 10.94 | Oracle | 89.69 | |
| Source-Only | 53.52 | |||||
| SLOT | 87.83 | |||||
| DAS | 89.14 |
| Model | Epoch | Self-Training | DD | ||||||||
|---|---|---|---|---|---|---|---|---|---|---|---|
| AP0.01 | AP0.05 | AP0.1 | AP0.3 | AP0.5 | AP0.01 | AP0.05 | AP0.1 | AP0.3 | AP0.5 | ||
| YOLOv5 | 150 | 88.80 (DAS) | |||||||||
| 155 | 90.64 | 90.20 | 89.85 | 89.12 | 88.67 | 91.70 | 91.46 | 91.28 | 90.65 | 90.17 | |
| 160 | 91.44 | 90.89 | 90.27 | 89.05 | 88.25 | 92.40 | 92.18 | 91.76 | 90.95 | 90.22 | |
| 165 | 91.93 | 91.27 | 90.58 | 88.95 | 87.93 | 92.18 | 92.52 | 91.98 | 91.08 | 90.20 | |
| 170 | 92.09 | 91.47 | 90.75 | 88.90 | 87.71 | 91.42 | 92.46 | 92.07 | 91.26 | 90.25 | |
| 175 | 92.16 | 91.60 | 90.85 | 88.86 | 87.53 | 90.27 | 92.31 | 92.07 | 91.41 | 90.26 | |
| YOLOv6 | 150 | 88.55 (DAS) | |||||||||
| 155 | 89.00 | 89.02 | 89.03 | 89.03 | 89.03 | 89.05 | 89.03 | 89.04 | 89.04 | 89.04 | |
| 160 | 89.23 | 89.22 | 89.31 | 89.26 | 89.26 | 89.27 | 89.26 | 89.22 | 89.22 | 89.22 | |
| 165 | 89.27 | 89.32 | 89.41 | 89.32 | 89.32 | 89.34 | 89.28 | 89.33 | 89.33 | 89.33 | |
| 170 | 89.34 | 89.37 | 89.45 | 89.35 | 89.35 | 89.41 | 89.33 | 89.40 | 89.40 | 89.40 | |
| 175 | 89.35 | 89.40 | 89.47 | 89.40 | 89.40 | 89.45 | 89.38 | 89.44 | 89.44 | 89.44 | |
| YOLOv7 | 150 | 89.14 (DAS) | |||||||||
| 155 | 89.96 | 89.91 | 89.74 | 89.86 | 89.71 | 90.93 | 90.75 | 90.82 | 90.66 | 90.51 | |
| 160 | 90.04 | 90.03 | 89.98 | 89.95 | 89.93 | 91.68 | 91.66 | 91.56 | 91.46 | 91.45 | |
| 165 | 90.15 | 90.22 | 90.07 | 90.04 | 90.06 | 92.01 | 92.01 | 92.03 | 91.80 | 91.81 | |
| 170 | 90.20 | 90.29 | 90.12 | 90.12 | 90.19 | 92.28 | 92.22 | 92.21 | 91.96 | 91.89 | |
| 175 | 90.26 | 90.44 | 90.13 | 90.18 | 90.29 | 92.42 | 92.57 | 92.40 | 91.97 | 91.89 | |
References
- OECD FAO Agricultural Outlook 2022–2031. Available online: https://reliefweb.int/report/world/oecd-fao-agricultural-outlook-2022-2031 (accessed on 11 March 2025).
- Savian, M.; Penha, C.; Holden, M. Evaluating Environmental, Economic, and Social Aspects of an Intensive Pig Production Farm in the South of Brazil: A Case Study. Int. J. Life Cycle Assess. 2023, 28, 1544–1560. [Google Scholar] [CrossRef]
- Li, Y.; Fu, C.; Yang, H.; Li, H.; Zhang, R.; Zhang, Y.; Wang, Z. Design of a Closed Piggery Environmental Monitoring and Control System Based on a Track Inspection Robot. Agriculture 2023, 13, 1501. [Google Scholar] [CrossRef]
- Pandey, S.; Kalwa, U.; Kong, T.; Guo, B.; Gauger, C.; Peters, J.; Yoon, J. Behavioral Monitoring Tool for Pig Farmers: Ear Tag Sensors, Machine Intelligence, and Technology Adoption Roadmap. Animals 2021, 11, 2665. [Google Scholar] [CrossRef] [PubMed]
- Tran, D.; Thanh, D. Pig Health Abnormality Detection Based on Behavior Patterns in Activity Periods Using Deep Learning. Int. J. Adv. Comput. Sci. Appl. 2023, 14, 603–610. [Google Scholar] [CrossRef]
- Hakansson, F.; Jensen, B. Automatic Monitoring and Detection of Tail Biting Behavior in Groups of Pigs Using Video Based Deep Learning Methods. Front. Vet. Sci. 2023, 9, 1099347. [Google Scholar] [CrossRef] [PubMed]
- Chung, Y.; Oh, S.; Lee, J.; Park, D.; Chang, H.; Kim, S. Automatic Detection and Recognition of Pig Wasting Diseases Using Sound Data in Audio Surveillance Systems. Sensors 2013, 13, 12929–12942. [Google Scholar] [CrossRef]
- Ojukwu, C.; Feng, Y.; Jia, G.; Zhao, H.; Tan, H. Development of a Computer Vision System to Detect Inactivity in Group-Housed Pigs. Int. J. Agric. Biol. Eng. 2020, 13, 42–46. [Google Scholar]
- Ahrendt, P.; Gregersen, T.; Karstoft, H. Development of a Real-Time Computer Vision System for Tracking Loose-Housed Pigs. Comput. Electron. Agric. 2011, 76, 169–174. [Google Scholar] [CrossRef]
- Kashiha, A.; Bahr, C.; Ott, S.; Moons, H.; Niewold, A.; Tuyttens, F.; Berckmans, D. Automatic Monitoring of Pig Locomotion Using Image Analysis. Livest. Sci. 2014, 159, 141–148. [Google Scholar] [CrossRef]
- Nasirahmadi, A.; Richter, U.; Hensel, O.; Edwards, S.; Sturm, B. Using Machine Vision for Investigation of Changes in Pig Group Lying Patterns. Comput. Electron. Agric. 2015, 119, 184–190. [Google Scholar] [CrossRef]
- Kashiha, M.; Bahr, C.; Haredasht, A.; Ott, S.; Moons, P.; Niewold, A.; Ödberg, O.; Berckmans, D. The Automatic Monitoring of Pigs Water Use by Cameras. Comput. Electron. Agric. 2013, 90, 164–169. [Google Scholar] [CrossRef]
- Lowe, G. Distinctive Image Features from Scale-Invariant Keypoints. Int. J. Comput. Vis. 2004, 60, 91–110. [Google Scholar] [CrossRef]
- Bay, H.; Ess, A.; Tuytelaars, T.; Van Gool, L. Speeded-Up Robust Features (SURF). Comput. Vis. Image Underst. 2008, 110, 346–359. [Google Scholar] [CrossRef]
- Calonder, M.; Lepetit, V.; Strecha, C.; Fua, P. Brief: Binary Robust Independent Elementary Features. In Proceedings of the European Conference on Computer Vision, Crete, Greece, 5–11 September 2010; pp. 778–792. [Google Scholar]
- O’Mahony, N.; Campbell, S.; Carvalho, A.; Harapanahalli, S.; Velasco-Hernandez, G.; Krpalkova, L.; Riordan, D.; Walsh, J. Deep Learning vs. Traditional Computer Vision. In Proceedings of the 2019 Computer Vision Conference, Las Vegas, NV, USA, 25–26 April 2019; pp. 128–144. [Google Scholar]
- Gorczyca, T.; Milan, M.; Maia, C.; Gebremedhin, G. Machine Learning Algorithms to Predict Core, Skin, and Hair-Coat Temperatures of Piglets. Comput. Electron. Agric. 2018, 151, 286–294. [Google Scholar] [CrossRef]
- Janiesch, C.; Zschech, P.; Heinrich, K. Machine Learning and Deep Learning. Electron. Mark. 2021, 31, 685–695. [Google Scholar] [CrossRef]
- Krizhevsky, A.; Sutskever, I.; Hinton, E. Imagenet Classification with Deep Convolutional Neural Networks. In Proceedings of the Advances in Neural Information Processing Systems, Lake Tahoe, AL, USA, 3–6 December 2012; pp. 1097–1105. [Google Scholar]
- Redmon, J.; Divvala, S.; Girshick, R.; Farhadi, A. You Only Look Once: Unified, Real-Time Object Detection. In Proceedings of the IEEE Conference on Computer Vision and Pattern Recognition, Las Vegas, NV, USA, 27–30 June 2016; pp. 779–788. [Google Scholar]
- Ren, S.; He, K.; Girshick, R.; Sun, J. Faster R-CNN: Towards Real-Time Object Detection with Region Proposal Networks. In Proceedings of the Advances in Neural Information Processing Systems, Montreal, QC, Canada, 7–12 December 2015; pp. 91–99. [Google Scholar]
- Ju, M.; Choi, Y.; Seo, J.; Sa, J.; Lee, S.; Chung, Y.; Park, D. A Kinect-Based Segmentation of Touching-Pigs for Real-Time Monitoring. Sensors 2018, 18, 1746. [Google Scholar] [CrossRef]
- Yang, Q.; Xiao, D.; Lin, S. Feeding Behavior Recognition for Group-Housed Pigs with the Faster R-CNN. Comput. Electron. Agric. 2018, 155, 453–460. [Google Scholar] [CrossRef]
- Hansen, F.; Smith, L.; Smith, N.; Salter, G.; Baxter, M.; Farish, M.; Grieve, B. Towards on-Farm Pig Face Recognition Using Convolutional Neural Networks. Comput. Ind. 2018, 98, 145–152. [Google Scholar] [CrossRef]
- Yang, Q.; Chen, M.; Xiao, D.; Huang, S.; Hui, X. Long-Term Video Activity Monitoring and Anomaly Alerting of Group-Housed Pigs. Comput. Electron. Agric. 2024, 224, 109205. [Google Scholar] [CrossRef]
- Hnewa, M.; Radha, H. Multiscale Domain Adaptive Yolo for Cross-Domain Object Detection. In Proceedings of the 2021 IEEE International Conference on Image Processing, Anchorage, AK, USA, 19–22 September 2021; pp. 3323–3327. [Google Scholar]
- Hsu, K.; Yao, H.; Tsai, H.; Hung, C.; Tseng, Y.; Singh, M.; Yang, H. Progressive Domain Adaptation for Object Detection. In Proceedings of the IEEE Winter Conference on Applications of Computer Vision, Snowmass Village, CO, USA, 1–7 October 2020; pp. 749–757. [Google Scholar]
- Guan, H.; Liu, M. Domain Adaptation for Medical Image Analysis: A Survey. IEEE Trans. Biomed. Eng. 2021, 69, 1173–1185. [Google Scholar] [CrossRef]
- Kuznetsova, A.; Rom, H.; Alldrin, N.; Uijlings, J.; Krasin, I.; Pont-Tuset, J.; Kamali, S.; Popov, S.; Malloci, M.; Kolesnikov, A.; et al. The Open Images Dataset v4: Unified Image Classification, Object Detection, and Visual Relationship Detection at Scale. Int. J. Comput. Vis. 2020, 128, 1956–1981. [Google Scholar] [CrossRef]
- Vandeghen, R.; Louppe, G.; Van, M. Adaptive Self-Training for Object Detection. In Proceedings of the IEEE/CVF International Conference on Computer Vision, Paris, France, 2–3 October 2023; pp. 914–923. [Google Scholar]
- Yang, J.; Shi, S.; Wang, Z.; Li, H.; Qi, X. ST3D: Self-Training for Unsupervised Domain Adaptation on 3D Object Detection. In Proceedings of the IEEE/CVF Conference on Computer Vision and Pattern Recognition, Nashville, TN, USA, 20–25 June 2021; pp. 10368–10378. [Google Scholar]
- Chen, Y.; Sui, Y.; Shayilan, A. Constructing a High-Performance Self-Training Model Based on Support Vector Classifiers to Detect Gold Mineralization-Related Geochemical Anomalies for Gold Exploration Targeting. Ore Geol. Rev. 2023, 153, 105265. [Google Scholar] [CrossRef]
- Xie, Q.; Luong, M.; Hovy, H.; Le, V. Self-Training with Noisy Student Improves ImageNet Classification. In Proceedings of the 2020 IEEE/CVF Conference on Computer Vision and Pattern Recognition, Seattle, WA, USA, 13–19 June 2020; pp. 10684–10695. [Google Scholar]
- Wutke, M.; Schmitt, O.; Traulsen, I.; Gültas, M. Investigation of Pig Activity Based on Video Data and Semi-Supervised Neural Networks. AgriEngineering 2020, 2, 581–595. [Google Scholar] [CrossRef]
- Chen, J.; Morota, G.; Lee, K.; Zhang, Z.; Cheng, H. VTag: A Semi-Supervised Pipeline for Tracking Pig Activity with a Single Top-View Camera. J. Anim. Sci. 2022, 100, skac147. [Google Scholar] [CrossRef] [PubMed]
- Huang, E.; He, Z.; Mao, A.; Ceballos, M.; Parsons, T.; Liu, K. A Semi-Supervised Generative Adversarial Network for Amodal Instance Segmentation of Piglets in Farrowing Pens. Comput. Electron. Agric. 2023, 209, 107839. [Google Scholar] [CrossRef]
- Dalal, N.; Triggs, B. Histograms of Oriented Gradients for Human Detection. In Proceedings of the Computer Society Conference on Computer Vision and Pattern Recognition, San Diego, CA, USA, 25–25 June 2005; pp. 886–893. [Google Scholar]
- LeCun, Y.; Bottou, L.; Bengio, Y.; Haffner, P. Gradient-Based Learning Applied to Document Recognition. Proc. IEEE 1998, 86, 2278–2324. [Google Scholar] [CrossRef]
- Girshick, R. Fast R-CNN. In Proceedings of the IEEE International Conference on Computer Vision, Santiago, Chile, 7–13 December 2015; pp. 1440–1448. [Google Scholar]
- Liu, W.; Anguelov, D.; Erhan, D.; Szegedy, C.; Reed, S.; Fu, Y.; Berg, C. Ssd: Single Shot Multibox Detector. In Proceedings of the European Conference on Computer Vision, Amsterdam, The Netherlands, 11–14 October 2016; pp. 21–37. [Google Scholar]
- Redmon, J.; Farhadi, A. YOLO9000: Better, Faster, Stronger. In Proceedings of the 2017 IEEE Conference on Computer Vision and Pattern Recognition, Honolulu, HI, USA, 21–26 July 2017; pp. 7263–7271. [Google Scholar]
- Redmon, J.; Farhadi, A. YOLOv3: An Incremental Improvement. arXiv 2018, arXiv:1804.02767. [Google Scholar]
- Bochkovskiy, A.; Wang, Y.; Liao, M. YOLOv4: Optimal Speed and Accuracy of Object Detection. arXiv 2020, arXiv:2004.10934. [Google Scholar]
- YOLOv5 by Ultralytics. Available online: https://github.com/ultralytics/yolov5 (accessed on 11 March 2025).
- Li, C.; Li, L.; Jiang, H.; Weng, K.; Geng, Y.; Li, L.; Ke, Z.; Li, Q.; Cheng, M.; Nie, W.; et al. YOLOv6: A Single-Stage Object Detection Framework for Industrial Applications. arXiv 2022, arXiv:2209.02976. [Google Scholar]
- Wang, Y.; Bochkovskiy, A.; Liao, M. YOLOv7: Trainable Bag-of-Freebies Sets New State-of-the-Art for Real-Time Object Detectors. In Proceedings of the IEEE/CVF Conference on Computer Vision and Pattern Recognition, Vancouver, BC, Canada, 18–22 June 2023; pp. 7464–7475. [Google Scholar]
- YOLOv8 by Ultralytics. Available online: https://github.com/open-mmlab/mmyolo/tree/main/configs/yolov8 (accessed on 11 March 2025).
- Wang, Y.; Yeh, H.; Liao, M. Yolov9: Learning What You Want to Learn Using Programmable Gradient Information. In Proceedings of the European Conference on Computer Vision, Milan, Italy, 29 September–4 October 2024; pp. 1–21. [Google Scholar]
- Wang, A.; Chen, H.; Liu, L.; Chen, K.; Lin, Z.; Han, J.; Ding, G. YOLOv10: Real-Time End-to-End Object Detection. arXiv 2024, arXiv:2405.14458. [Google Scholar]
- Khanam, R.; Hussain, M. YOLOv11: An Overview of the Key Architectural Enhancements. arXiv 2024, arXiv:2410.17725. [Google Scholar]
- Verma, P.; Singh, N.; Pantola, D.; Cheng, X. Neural Network Developments: A Detailed Survey from Static to Dynamic Models. Computers and Electrical Engineering. Comput. Electr. Eng. 2024, 120, 109710. [Google Scholar] [CrossRef]
- Psota, T.; Mittek, M.; Pérez, C.; Schmidt, T.; Mote, B. Multi-Pig Part Detection and Association with a Fully-Convolutional Network. Sensors 2019, 19, 852. [Google Scholar] [CrossRef] [PubMed]
- Riekert, M.; Klein, A.; Adrion, F.; Hoffmann, C.; Gallmann, E. Automatically Detecting Pig Position and Posture by 2D Camera Imaging and Deep Learning. Comput. Electron. Agric. 2020, 174, 105391. [Google Scholar] [CrossRef]
- Zhang, C.; Li, S.; Li, Z.; Wu, N.; Miao, Q.; Li, S. Crowd-Sware Black Pig Detection for Low Illumination. In Proceedings of the 6th International Conference on Video and Image Processing, Shanghai, China, 23–26 December 2022; pp. 42–48. [Google Scholar]
- Liu, D.; Parmiggiani, A.; Psota, E.; Fitzgerald, R.; Norton, T. Where’s Your Head At? Detecting the Orientation and Position of Pigs with Rotated Bounding Boxes. Comput. Electron. Agric. 2023, 212, 108099. [Google Scholar] [CrossRef]
- Mattina, M.; Benzinou, A.; Nasreddine, K.; Richard, F. An Efficient Anchor-Free Method for Pig Detection. IET Image Process. 2023, 17, 613–626. [Google Scholar] [CrossRef]
- Lai, J.; Liang, Y.; Kuang, Y.; Xie, Z.; He, H.; Zhuo, Y.; Huang, Z.; Zhu, S.; Huang, Z. IO-YOLOv5: Improved Pig Detection under Various Illuminations and Heavy Occlusion. Agriculture 2023, 13, 1349. [Google Scholar] [CrossRef]
- Wutke, M.; Lensches, C.; Hartmann, U.; Traulsen, I. Towards Automatic Farrowing Monitoring—A Noisy Student Approach for Improving Detection Performance of Newborn Piglets. PLoS ONE 2024, 19, e0310818. [Google Scholar] [CrossRef]
- Wang, Z.; Zhuang, Y.; Xu, L.; Jiang, J.; Zhang, Z.; Wang, Y.; Yu, P.; Fu, Y.; Xu, H.; Zhao, W.; et al. Fopic: Few-Shot Learning for Pig Detection Using Improved Yolov7 and Cyclegan. 2025. Available online: http://ssrn.com/abstract=5101613 (accessed on 11 March 2025).
- Shi, Z.; Li, B.; Zhang, X.; Wang, C.; Zhou, D.; Zhang, G. Using Floor Cooling as an Approach to Improve the Thermal Environment in the Sleep Area in an Open Pig House. Biosyst. Eng. 2006, 93, 359–364. [Google Scholar] [CrossRef]
- Gao, Z.; Lu, G.; Lyu, C.; Yan, P. Key-Frame Selection for Automatic Summarization of Surveillance Videos: A Method of Multiple Change-Point Detection. Mach. Vis. Appl. 2018, 29, 1101–1117. [Google Scholar] [CrossRef]
- Sivanandam, S.; Deepa, S. Introduction to Genetic Algorithms; Springer: Berlin/Heidelberg, Germany, 2008. [Google Scholar]
- Chen, Y.; Li, Y.; Kong, T.; Qi, L.; Chu, R.; Li, L.; Jia, J. Scale-Aware Automatic Augmentation for Object Detection. In Proceedings of the 2021 IEEE/CVF Conference on Computer Vision and Pattern Recognition, Nashville, TN, USA, 20–25 June 2021; pp. 9558–9567. [Google Scholar]
- Lee, K.; Lee, S.; Kim, H. Bounding-Box Object Augmentation with Random Transformations for Automated Defect Detection in Residential Building Façades. Autom. Constr. 2022, 135, 104138. [Google Scholar] [CrossRef]
- Ghiasi, G.; Cui, Y.; Srinivas, A.; Qian, R.; Lin, Y.; Cubuk, D.; Le, V.; Zoph, B. Simple Copy-Paste is a Strong Data Augmentation Method for Instance Segmentation. In Proceedings of the IEEE/CVF Conference on Computer Vision and Pattern Recognition, Nashville, TN, USA, 20–25 June 2021; pp. 2918–2928. [Google Scholar]
- Prechelt, L. Early Stopping—But When? In Neural Networks: Tricks of the Trade; Springer: Berlin/Heidelberg, Germany, 2002; pp. 55–69. [Google Scholar]
- Lee, D. Pseudo-Label: The Simple and Efficient Semi-Supervised Learning Method for Deep Neural Networks. In Proceedings of the Workshop on Challenges in Representation Learning, ICML, Atlanta, GA, USA, 16–21 June 2013; p. 896. [Google Scholar]
- Ganin, Y.; Ustinova, E.; Ajakan, H.; Germain, P.; Larochelle, H.; Laviolette, F.; Marchand, M.; Lempitsky, V. Domain-Adversarial Training of Neural Networks. J. Mach. Learn. Res. 2016, 17, 1–35. [Google Scholar]
- Radosavovic, I.; Dollár, P.; Girshick, R.; Gkioxari, G.; He, K. Data Distillation: Towards Omni-Supervised Learning. In Proceedings of the IEEE Conference on Computer Vision and Pattern Recognition, Salt Lake City, UT, USA, 18–23 June 2018; pp. 4119–4128. [Google Scholar]
- VS, V.; Oza, P.; Patel, M. Towards Online Domain Adaptive Object Detection. In Proceedings of the IEEE/CVF Winter Conference on Applications of Computer Vision, Waikoloa, HI, USA, 2–7 January 2023; pp. 478–488. [Google Scholar]
- Hao, Y.; Forest, F.; Fink, O. Simplifying Source-Dree Domain Adaptation for Object Detection: Effective Self-Training Strategies and Performance Insights. In Proceedings of the European Conference on Computer Vision, Milan, Italy, 29 September–4 October 2024; pp. 196–213. [Google Scholar]
- Cao, S.; Joshi, D.; Gui, L.; Wang, Y. Contrastive Mean Teacher for Domain Adaptive Object Detectors. In Proceedings of the IEEE Conference on Computer Vision and Pattern Recognition, Vancouver, BC, Canada, 17–24 June 2023; pp. 23839–23848. [Google Scholar]
- Belal, A.; Meethal, A.; Romero, P.; Pedersoli, M.; Granger, E. Multi-Source Domain Adaptation for Object Detection with Prototype-Based Mean Teacher. In Proceedings of the Winter Conference on Applications of Computer Vision, Waikoloa, HI, USA, 4–8 January 2024; pp. 1277–1286. [Google Scholar]
- Zhou, H.; Jiang, F.; Lu, H. SSDA-YOLO: Semi-Supervised Domain Adaptive YOLO for Cross-Domain Object Detection. Comput. Vis. Image Underst. 2023, 229, 103649. [Google Scholar] [CrossRef]
- AI Hub Dataset. Available online: http://aihub.or.kr/ (accessed on 11 March 2025).
- Kawulok, M.; Maćkowski, M. YOLO-Type Neural Networks in the Process of Adapting Mathematical Graphs to the Needs of the Blind. Appl. Sci. 2024, 14, 11829. [Google Scholar] [CrossRef]
- Pan, W.; Yang, Z. A Lightweight Enhanced YOLOv8 Algorithm for Detecting Small Objects in UAV Aerial Photography. Vis. Comput. 2025. [Google Scholar] [CrossRef]
- Pereira, G. Fall Detection for Industrial Setups Using YOLOv8 Variants. arXiv 2024, arXiv:2408.04605. [Google Scholar]
- Barlybayev, A.; Amangeldy, N.; Kurmetbek, B.; Krak, I.; Razakhova, B.; Tursynova, N. Personal Protective Equipment Detection Using YOLOv8 Architecture on Object Detection Benchmark Datasets: A Comparative Study. Cogent Eng. 2024, 11, 2333209. [Google Scholar] [CrossRef]
- Tian, Y.; Ye, Q.; Doermann, D. YOLOv12: Attention-Centric Real-Time Object Detectors. arXiv 2025, arXiv:2502.12524. [Google Scholar]
- Son, S.; Ahn, H.; Baek, H.; Yu, S.; Suh, Y.; Lee, S.; Chung, Y.; Park, D. StaticPigDet: Accuracy Improvement of Static Camera-Based Pig Monitoring Using Background and Facility Information. Sensors 2022, 22, 8315. [Google Scholar] [CrossRef]
- Seo, J.; Son, S.; Yu, S.; Baek, H.; Chung, Y. Depth-Oriented Gray Image for Unseen Pig Detection in Real Time. Appl. Sci. 2025, 15, 988. [Google Scholar] [CrossRef]


| Training Method | Model | Domain Shift Result | Domain Shift Adaptation | Labeled Target Data Utilization | Reference |
|---|---|---|---|---|---|
| Supervised | Fully Convolutional Network | ✔ | ✘ | ✘ | Psota et al., 2019 [52] |
| Supervised | Faster R-CNN | ✔ | ✘ | ✘ | Riekert et al., 2020 [53] |
| Supervised | YOLOv4 | ✔ | ✔ | ✘ | Zhang et al., 2022 [54] |
| Supervised | YOLOv5 | ✔ | ✘ | ✘ | Liu et al., 2023 [55] |
| Supervised | Anchor-Free Center-Based (AFCB) | ✔ | ✔ | ✘ | Mattina et al., 2023 [56] |
| Supervised | IO-YOLOv5 | ✔ | ✔ | ✘ | Lai et al., 2023 [57] |
| Semi-supervised | YOLOv8 | ✔ | ✔ | ✘ | Wutke et al., 2024 [58] |
| Semi-supervised | YOLOv7 + Cycle GAN | ✔ | ✔ | ✔ | Wang et al., 2025 [59] |
| Semi-supervised | YOLOv8 | ✔ | ✔ | ✔ | Proposed |
| Augmentation Parameter | Definition |
|---|---|
| Number of augmented images | |
| Probability of zoom-in | |
| Magnitude of zoom-in | |
| Probability of zoom-out | |
| Magnitude of zoom-out | |
(0: original, 1: translateX, 2: translateY, 3: rotate, 4: shear, 5: flipH, 6: flipV) | Image transformation flag |
| Probability of image transformation | |
| Magnitude of image transformation |
| Name | Domain | Number of Pigs | Resolution | Camera Angle | Train/ Test | Label Availability | Frames | Example Image |
|---|---|---|---|---|---|---|---|---|
| Hamyang | Source | 21 | 1200 × 600 | Top-View | Train | Yes | 342 |  |
| Jochiwon | Source | 23 | 512 × 512 | Top-View | Train | Yes | 917 |  |
| Chungbuk | Source | 5 or 9 | 1200 × 600 | Top-View | Train | Yes | 1182 | 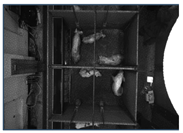 |
| AI Hub [75] | Source | Variable | 1920 × 1080 | Top-View | Train | Yes | 3520 | 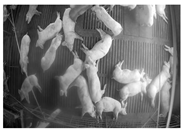 |
| Hadong | Target | Variable | 1920 × 1080 | Tilted-View | Train | Yes | 1 (SLOT) | 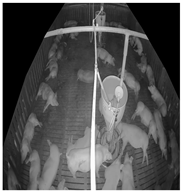 |
| Train | No | 3999 | ||||||
| Test | Yes | 1024 |
| Augmentation Parameter | Range |
|---|---|
| 10–500 | |
| 0–0.5 [0, 0.1, 0.2, 0.3, 0.4, 0.5] | |
| 1.2–1.9 [1.2, 1.3, 1.4, 1.5, 1.6, 1.7, 1.8, 1.9] | |
| 0–0.5 [0, 0.1, 0.2, 0.3, 0.4, 0.5] | |
| 0.2–0.9 [0.2, 0.3, 0.4, 0.5, 0.6, 0.7, 0.8, 0.9] | |
[0: original, 1: translateX, 2: translateY, 3: rotate, 4: shear, 5: flipH, 6: flipV] | 0–6 [0, 1, 2, 3, 4, 5, 6] |
| 0.1–1 [0.1, 0.2, 0.3, 0.4, 0.5, 0.6, 0.7, 0.8, 0.9, 1.0] | |
| 1–8 [1, 2, 3, 4, 5, 6, 7, 8] |
| Augmentation Parameter | TOP1 | TOP2 | TOP59 | TOP60 |
|---|---|---|---|---|
| 48 | 140 | 337 | 388 | |
| 0 | 5 | 3 | 4 | |
| 1 | 2 | 1 | 7 | |
| 5 | 4 | 1 | 1 | |
| 8 | 8 | 7 | 9 | |
| 0 | 3 | 6 | 3 | |
| 1 | 6 | 8 | 7 | |
| 1 | 2 | 1 | 9 | |
| AP (%) | 48.30 | 45.37 | 30.94 | 18.63 |
| Model | Params (M) | FLOPs (G) | Training Duration (hours) | Method | Number of Target Labels | AP (%) |
|---|---|---|---|---|---|---|
| YOLOv6 | 18.51 | 45.20 | 8.50 | Oracle | 4000 | 88.01 |
| Source-Only | 0 | 61.67 | ||||
| SLOT | 1 | 81.99 | ||||
| DAS | 1 (SLOT) + 48 (augmented) | 89.67 | ||||
| YOLOv7 | 36.91 | 104.50 | 10.94 | Oracle | 4000 | 89.69 |
| Source-Only | 0 | 53.52 | ||||
| SLOT | 1 | 87.83 | ||||
| DAS | 1 (SLOT) + 48 (augmented) | 89.60 | ||||
| YOLOv8 | 25.90 | 79.32 | 7.12 | Oracle | 4000 | 95.15 |
| Source-Only | 0 | 36.86 | ||||
| SLOT | 1 | 80.25 | ||||
| DAS | 1 (SLOT) + 48 (augmented) | 85.27 |
| Model | Epoch | Self-Training | DD | ||||||||
|---|---|---|---|---|---|---|---|---|---|---|---|
| AP0.01 | AP0.05 | AP0.1 | AP0.3 | AP0.5 | AP0.01 | AP0.05 | AP0.1 | AP0.3 | AP0.5 | ||
| YOLOv6 | 150 | 89.67 (DAS) | |||||||||
| 155 | 90.09 | 90.06 | 90.06 | 90.08 | 90.06 | 90.04 | 90.09 | 90.06 | 90.06 | 90.06 | |
| 160 | 90.39 | 90.40 | 90.40 | 90.38 | 90.40 | 90.40 | 90.38 | 90.39 | 90.40 | 90.40 | |
| 165 | 90.43 | 90.48 | 90.48 | 90.44 | 90.48 | 90.45 | 90.44 | 90.46 | 90.48 | 90.48 | |
| 170 | 90.48 | 90.49 | 90.49 | 90.48 | 90.49 | 90.49 | 90.49 | 90.49 | 90.49 | 90.49 | |
| 175 | 90.50 | 90.57 | 90.57 | 90.54 | 90.57 | 90.57 | 90.52 | 90.53 | 90.57 | 90.57 | |
| YOLOv7 | 150 | 89.60 (DAS) | |||||||||
| 155 | 90.16 | 90.10 | 90.06 | 90.12 | 90.23 | 91.25 | 91.16 | 91.12 | 91.17 | 91.26 | |
| 160 | 90.38 | 90.34 | 90.22 | 90.35 | 90.49 | 91.87 | 91.74 | 91.75 | 92.02 | 91.87 | |
| 165 | 90.48 | 90.44 | 90.49 | 90.48 | 90.72 | 92.50 | 92.30 | 92.26 | 92.62 | 92.42 | |
| 170 | 90.48 | 90.69 | 90.53 | 90.67 | 90.85 | 92.80 | 92.83 | 92.55 | 93.21 | 92.86 | |
| 175 | 90.63 | 90.70 | 90.64 | 90.72 | 90.98 | 93.11 | 93.31 | 93.00 | 93.70 | 93.25 | |
| YOLOv8 | 150 | 85.27 (DAS) | |||||||||
| 155 | 87.28 | 86.54 | 86.38 | 85.94 | 85.42 | 87.80 | 87.50 | 87.39 | 86.93 | 86.32 | |
| 160 | 88.29 | 87.29 | 86.87 | 86.16 | 85.37 | 89.86 | 88.43 | 88.17 | 87.36 | 86.38 | |
| 165 | 89.53 | 87.81 | 87.35 | 86.22 | 85.38 | 90.62 | 89.04 | 88.52 | 87.52 | 86.43 | |
| 170 | 90.03 | 88.23 | 87.70 | 86.30 | 85.36 | 90.45 | 89.48 | 88.63 | 87.63 | 86.47 | |
| 175 | 90.07 | 88.52 | 87.95 | 86.37 | 85.39 | 89.85 | 89.48 | 88.73 | 87.64 | 86.46 | |
| SLOT | DAS | DD | Super-Low Threshold | AP (%) |
|---|---|---|---|---|
| 36.86 | ||||
| ✔ | 80.25 | |||
| ✔ | ✔ | 85.27 | ||
| ✔ | ✔ | ✔ | 86.47 | |
| ✔ | ✔ | ✔ | ✔ | 90.62 |
| Method | YOLOv6 | YOLOv7 | YOLOv8 |
|---|---|---|---|
| Naive Self-Training [67] | 80.56 | 64.59 | 62.04 |
| DD [69] | 79.30 | 75.98 | 65.29 |
| Proposed System | 90.57 | 93.11 | 90.62 |
| Camera Angle (Source → Target) | Source-Only | SLOT | DAS | Proposed System |
|---|---|---|---|---|
| Top-View → Tilted-View | 36.86 | 80.25 | 85.27 | 90.62 |
| Tilted-View → Top-View | 69.91 | 83.80 | 86.90 | 90.16 |
| Method | Entropy | AP (%) |
|---|---|---|
| Highest Entropy | 0.822795 | 85.27 |
| Lowest Entropy | 0.797567 | 80.43 |
| Number of SLOT Data Samples | AP (%) |
|---|---|
| 0 (Source-Only) | 36.86 |
| 1 | 85.81 |
| 5 | 88.62 |
| 10 | 92.48 |
| 100 | 93.67 |
| 1000 | 95.26 |
| 4000 | 95.78 |
| Early Stop | Total Epochs | Operating Time (hours) | AP (%) | ||
|---|---|---|---|---|---|
| 3 | 60 | 1800 | 103 | 77.35 | |
| ✔ | 1595 | 86 | 85.27 |
| APep | Key Frame Selection Algorithm | |
|---|---|---|
| ✔ | ||
| AP150 | 85.27 | |
| AP155 | 88.04 | 87.80 |
| AP160 | 89.95 | 89.86 |
| AP165 | 90.29 | 90.62 |
| AP170 | 90.01 | 90.45 |
| AP175 | 89.53 | 89.85 |
| Proposed Method | Perspective Transformation [81] | DOG [82] | AP |
|---|---|---|---|
| ✔ | 90.62 | ||
| ✔ | ✔ | 90.73 | |
| ✔ | ✔ | ✔ | 79.82 |
| Entropy Group Category | High-Entropy Group Average Number of Objects | Low-Entropy Group Average Number of Objects |
|---|---|---|
| A (10 frames) | 26.5 | 19.7 |
| B (100 frames) | 26.34 | 20.16 |
| C (1000 frames) | 24.28 | 20.76 |
| Epoch | AP0.001 | AP0.005 | AP0.01 | AP0.05 | AP0.1 | AP0.3 | AP0.5 |
|---|---|---|---|---|---|---|---|
| 155 | 88.38 | 88.02 | 87.80 | 87.50 | 87.39 | 86.93 | 86.32 |
| 160 | 90.47 | 90.16 | 89.86 | 88.43 | 88.17 | 87.36 | 86.38 |
| 165 | 90.55 | 90.86 | 90.62 | 89.04 | 88.52 | 87.52 | 86.43 |
| 170 | 89.73 | 90.41 | 90.45 | 89.48 | 88.63 | 87.63 | 86.47 |
| 175 | 88.68 | 89.51 | 89.85 | 89.48 | 88.73 | 87.64 | 86.46 |
| 180 | 87.77 | 88.51 | 89.09 | 89.22 | 88.76 | 87.58 | 86.43 |
| 185 | 87.06 | 87.61 | 88.32 | 88.90 | 88.76 | 87.47 | 86.37 |
| 190 | 86.43 | 86.85 | 87.59 | 88.44 | 88.74 | 87.40 | 86.31 |
| 195 | 85.91 | 86.26 | 86.95 | 87.94 | 88.52 | 87.33 | 86.21 |
| 200 | 85.44 | 85.79 | 86.36 | 87.34 | 88.26 | 87.20 | 86.15 |
Disclaimer/Publisher’s Note: The statements, opinions and data contained in all publications are solely those of the individual author(s) and contributor(s) and not of MDPI and/or the editor(s). MDPI and/or the editor(s) disclaim responsibility for any injury to people or property resulting from any ideas, methods, instructions or products referred to in the content. |
© 2025 by the authors. Licensee MDPI, Basel, Switzerland. This article is an open access article distributed under the terms and conditions of the Creative Commons Attribution (CC BY) license (https://creativecommons.org/licenses/by/4.0/).
Share and Cite
Lee, J.; Chae, H.; Son, S.; Seo, J.; Suh, Y.; Lee, J.; Chung, Y.; Park, D. Sustainable Self-Training Pig Detection System with Augmented Single Labeled Target Data for Solving Domain Shift Problem. Sensors 2025, 25, 3406. https://doi.org/10.3390/s25113406
Lee J, Chae H, Son S, Seo J, Suh Y, Lee J, Chung Y, Park D. Sustainable Self-Training Pig Detection System with Augmented Single Labeled Target Data for Solving Domain Shift Problem. Sensors. 2025; 25(11):3406. https://doi.org/10.3390/s25113406
Chicago/Turabian StyleLee, Junhee, Heechan Chae, Seungwook Son, Jongwoong Seo, Yooil Suh, Jonguk Lee, Yongwha Chung, and Daihee Park. 2025. "Sustainable Self-Training Pig Detection System with Augmented Single Labeled Target Data for Solving Domain Shift Problem" Sensors 25, no. 11: 3406. https://doi.org/10.3390/s25113406
APA StyleLee, J., Chae, H., Son, S., Seo, J., Suh, Y., Lee, J., Chung, Y., & Park, D. (2025). Sustainable Self-Training Pig Detection System with Augmented Single Labeled Target Data for Solving Domain Shift Problem. Sensors, 25(11), 3406. https://doi.org/10.3390/s25113406