

QRS Detector Performance Evaluation Aware of Temporal Accuracy and Presence of Noise


Abstract
1. Introduction
2. Related Work
- BW noise: Se = 95% for WQRS and +P = 62% for WQRS for SNR = −12 dB,
- MA noise: Se = 83% for Hamilton and +P = 38% for WQRS for SNR = −12 dB,
- and EM noise: Se = 65% for Hamilton and +P = 30% for WQRS for SNR = −12 dB.
3. Materials and Methods
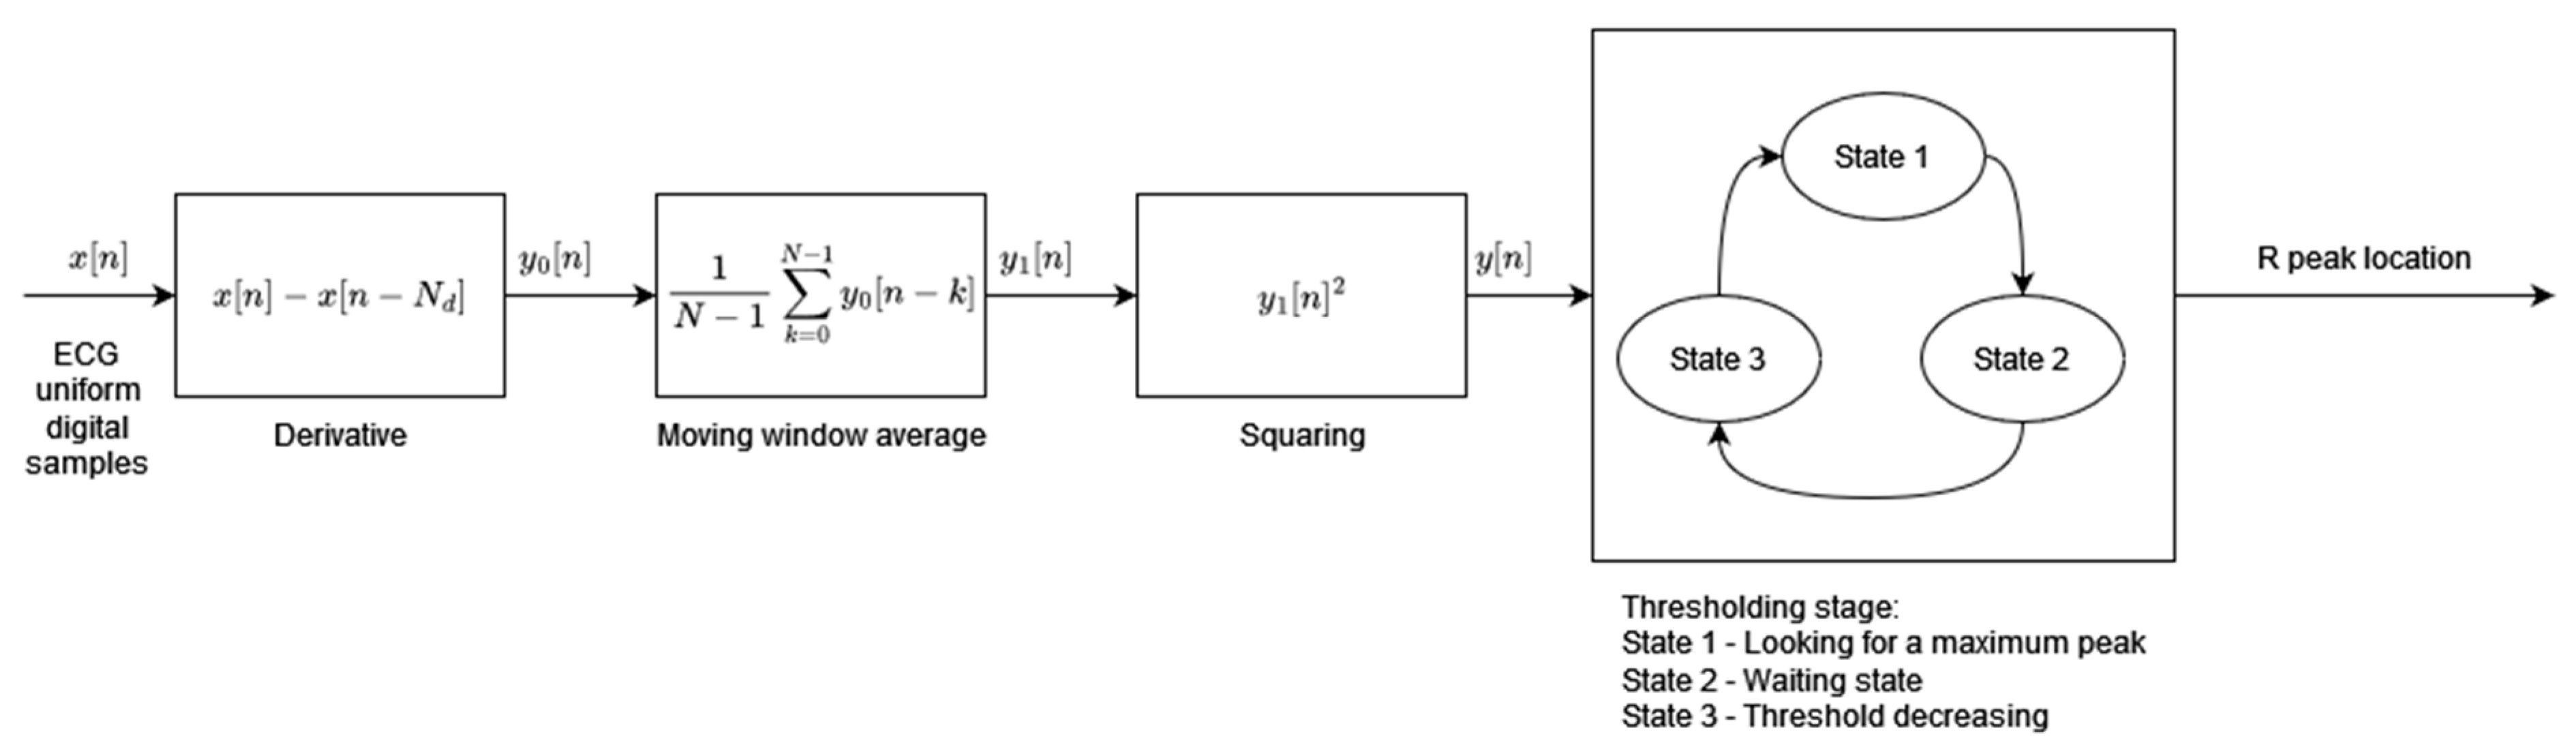
3.1. Algorithm 1
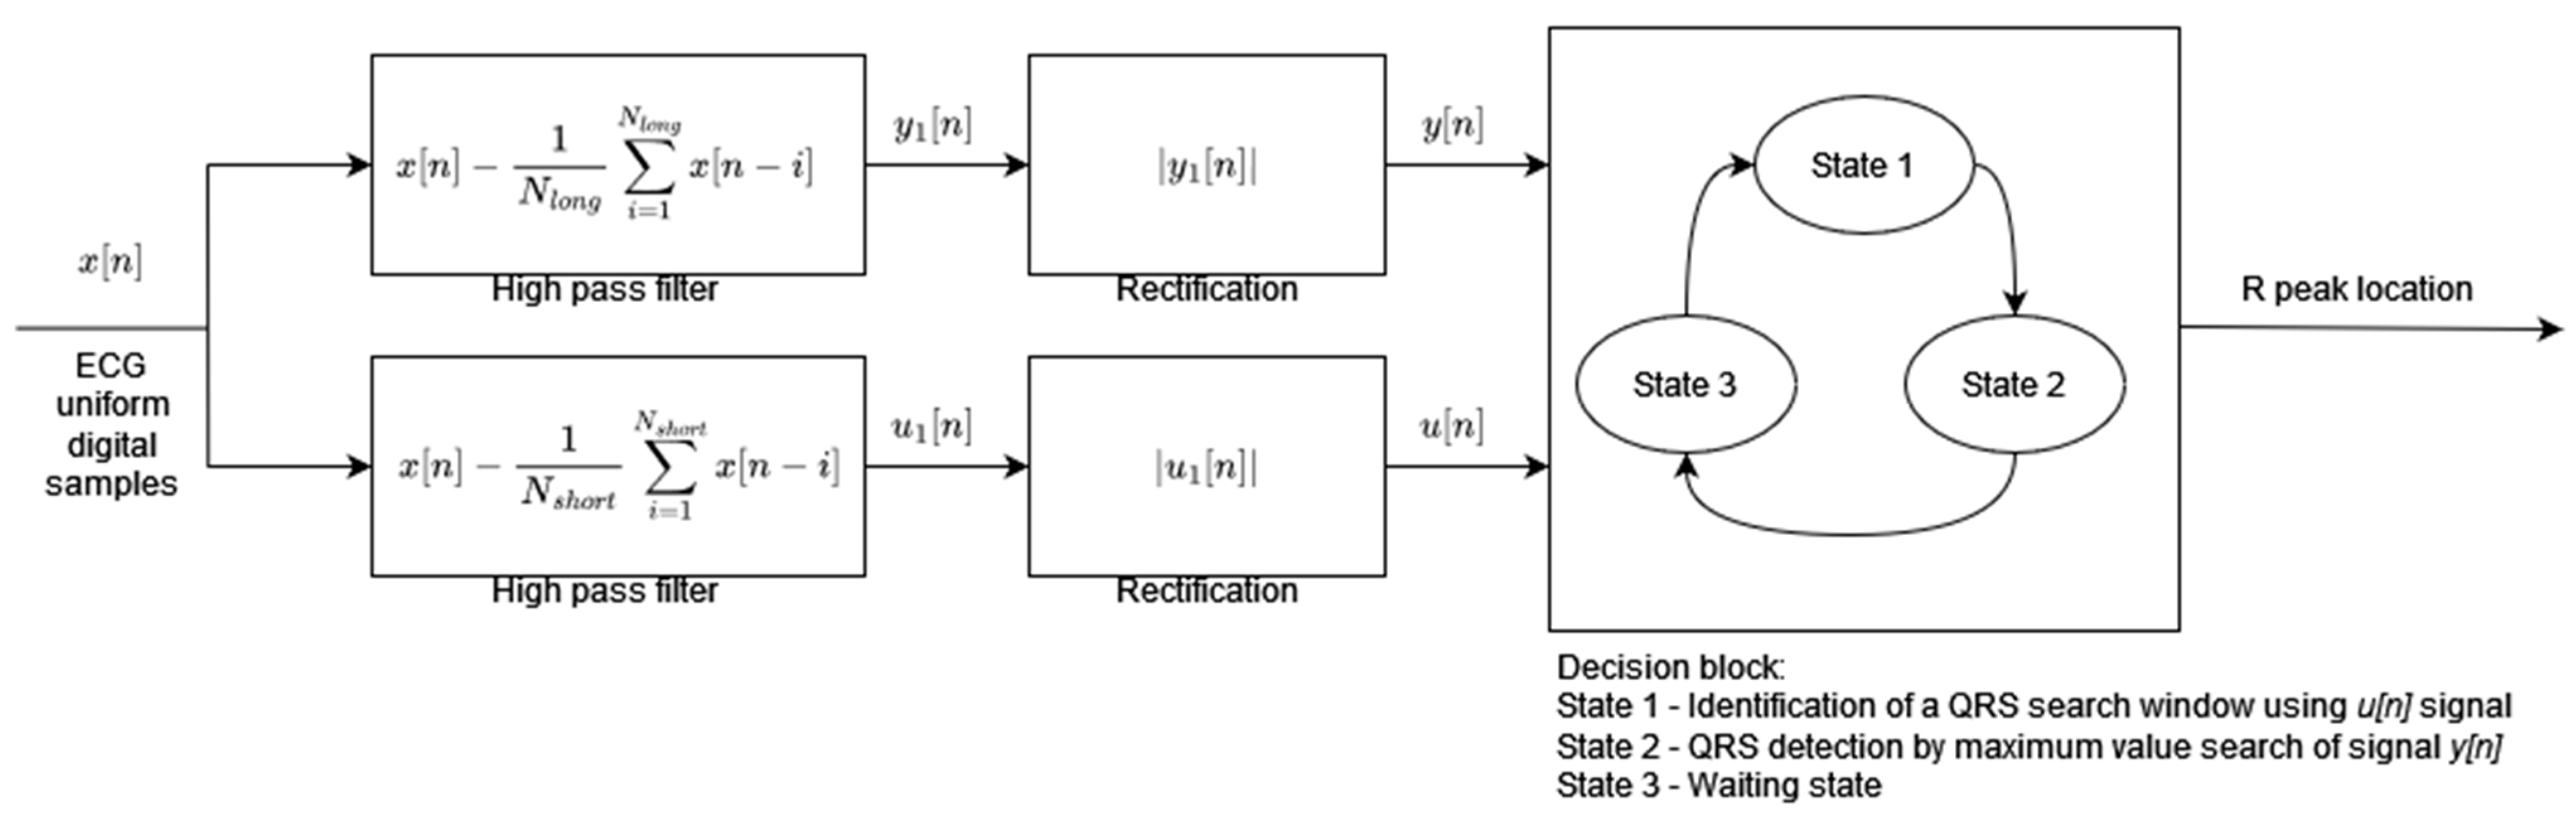
3.2. Algorithm 2
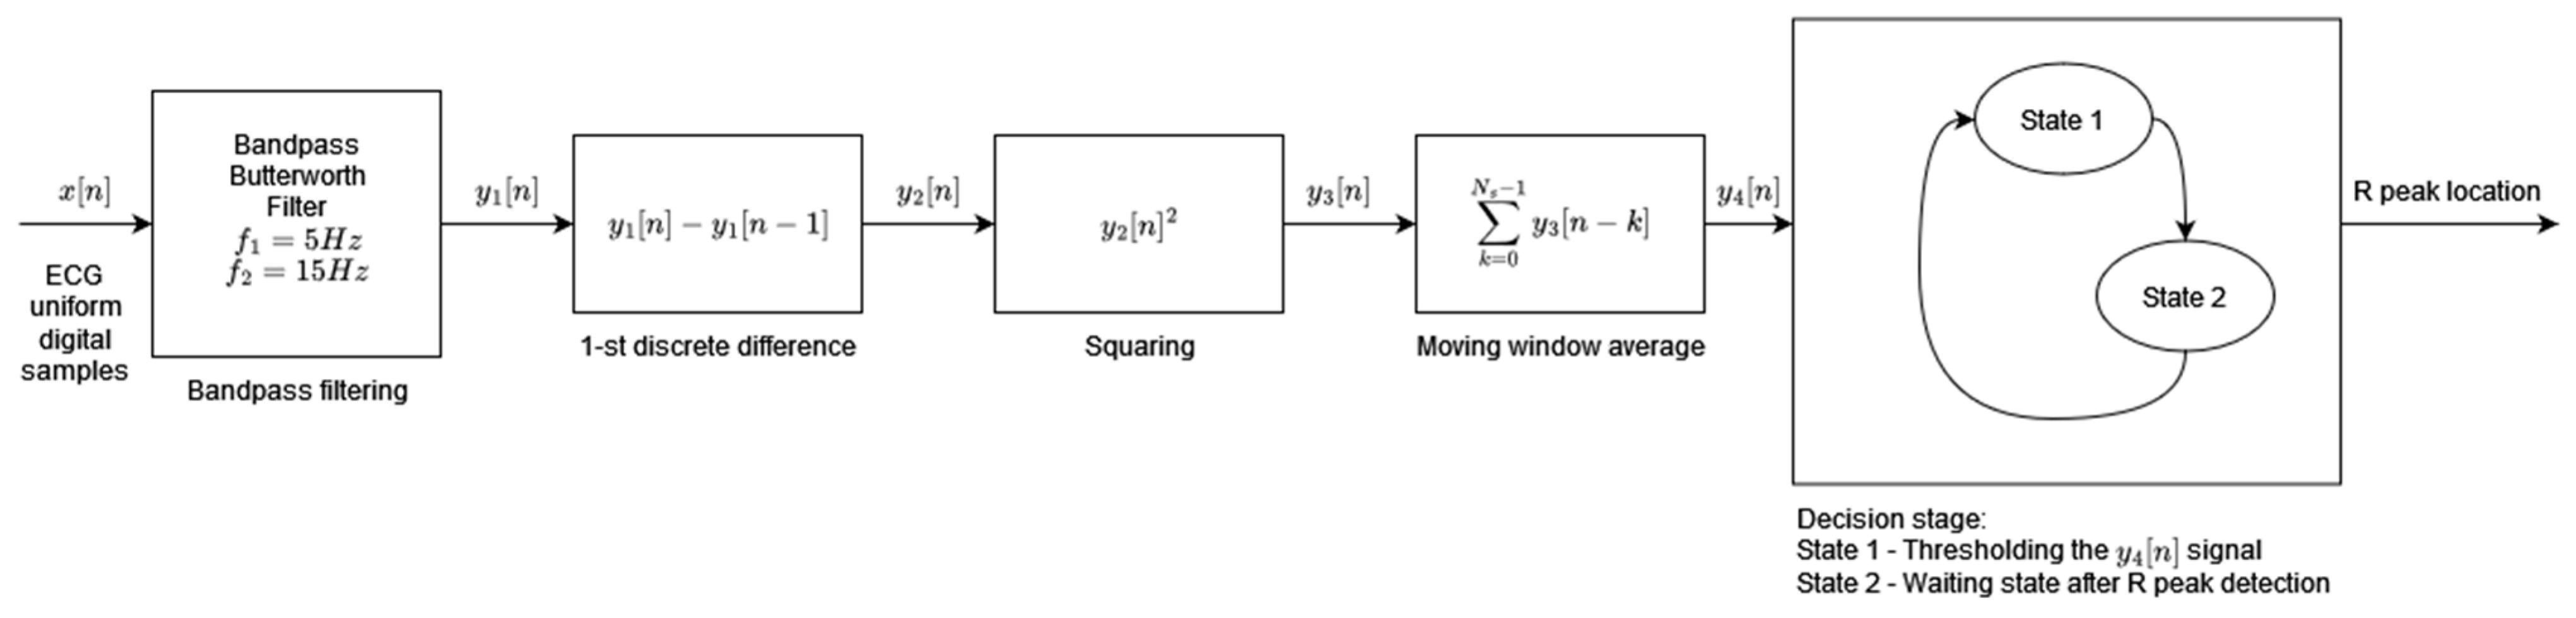
3.3. Algorithm 3
3.4. Algorithm 4
3.5. ECG Database and Test Dataset
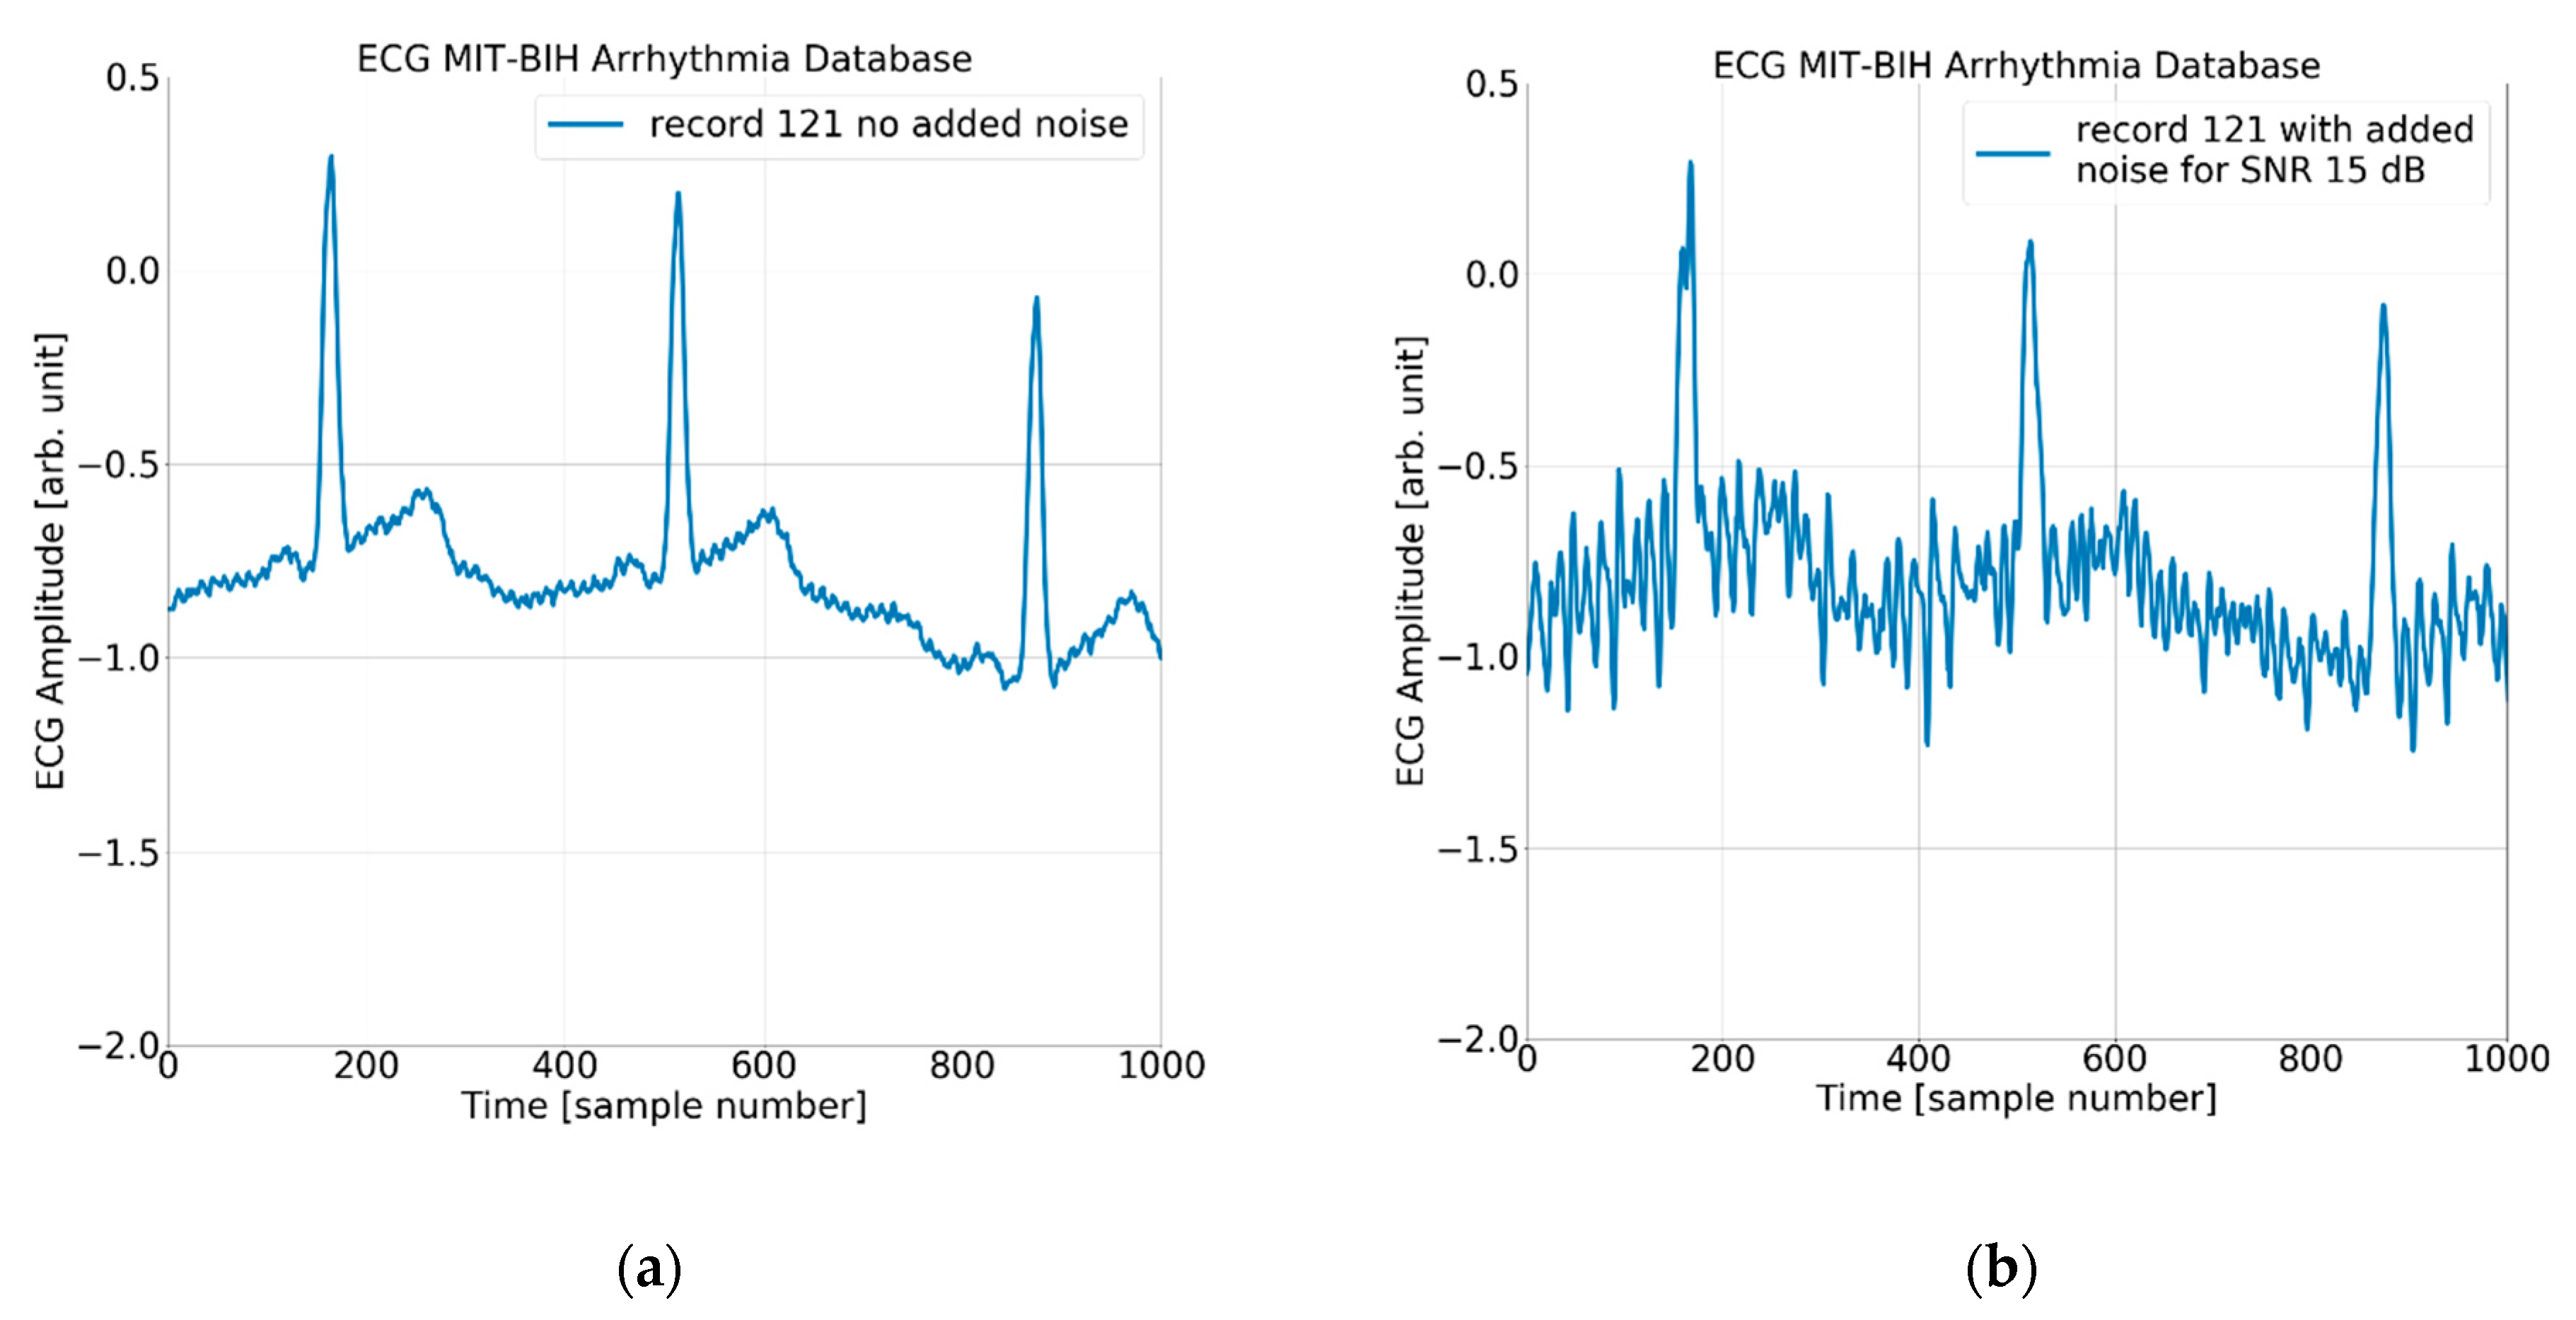
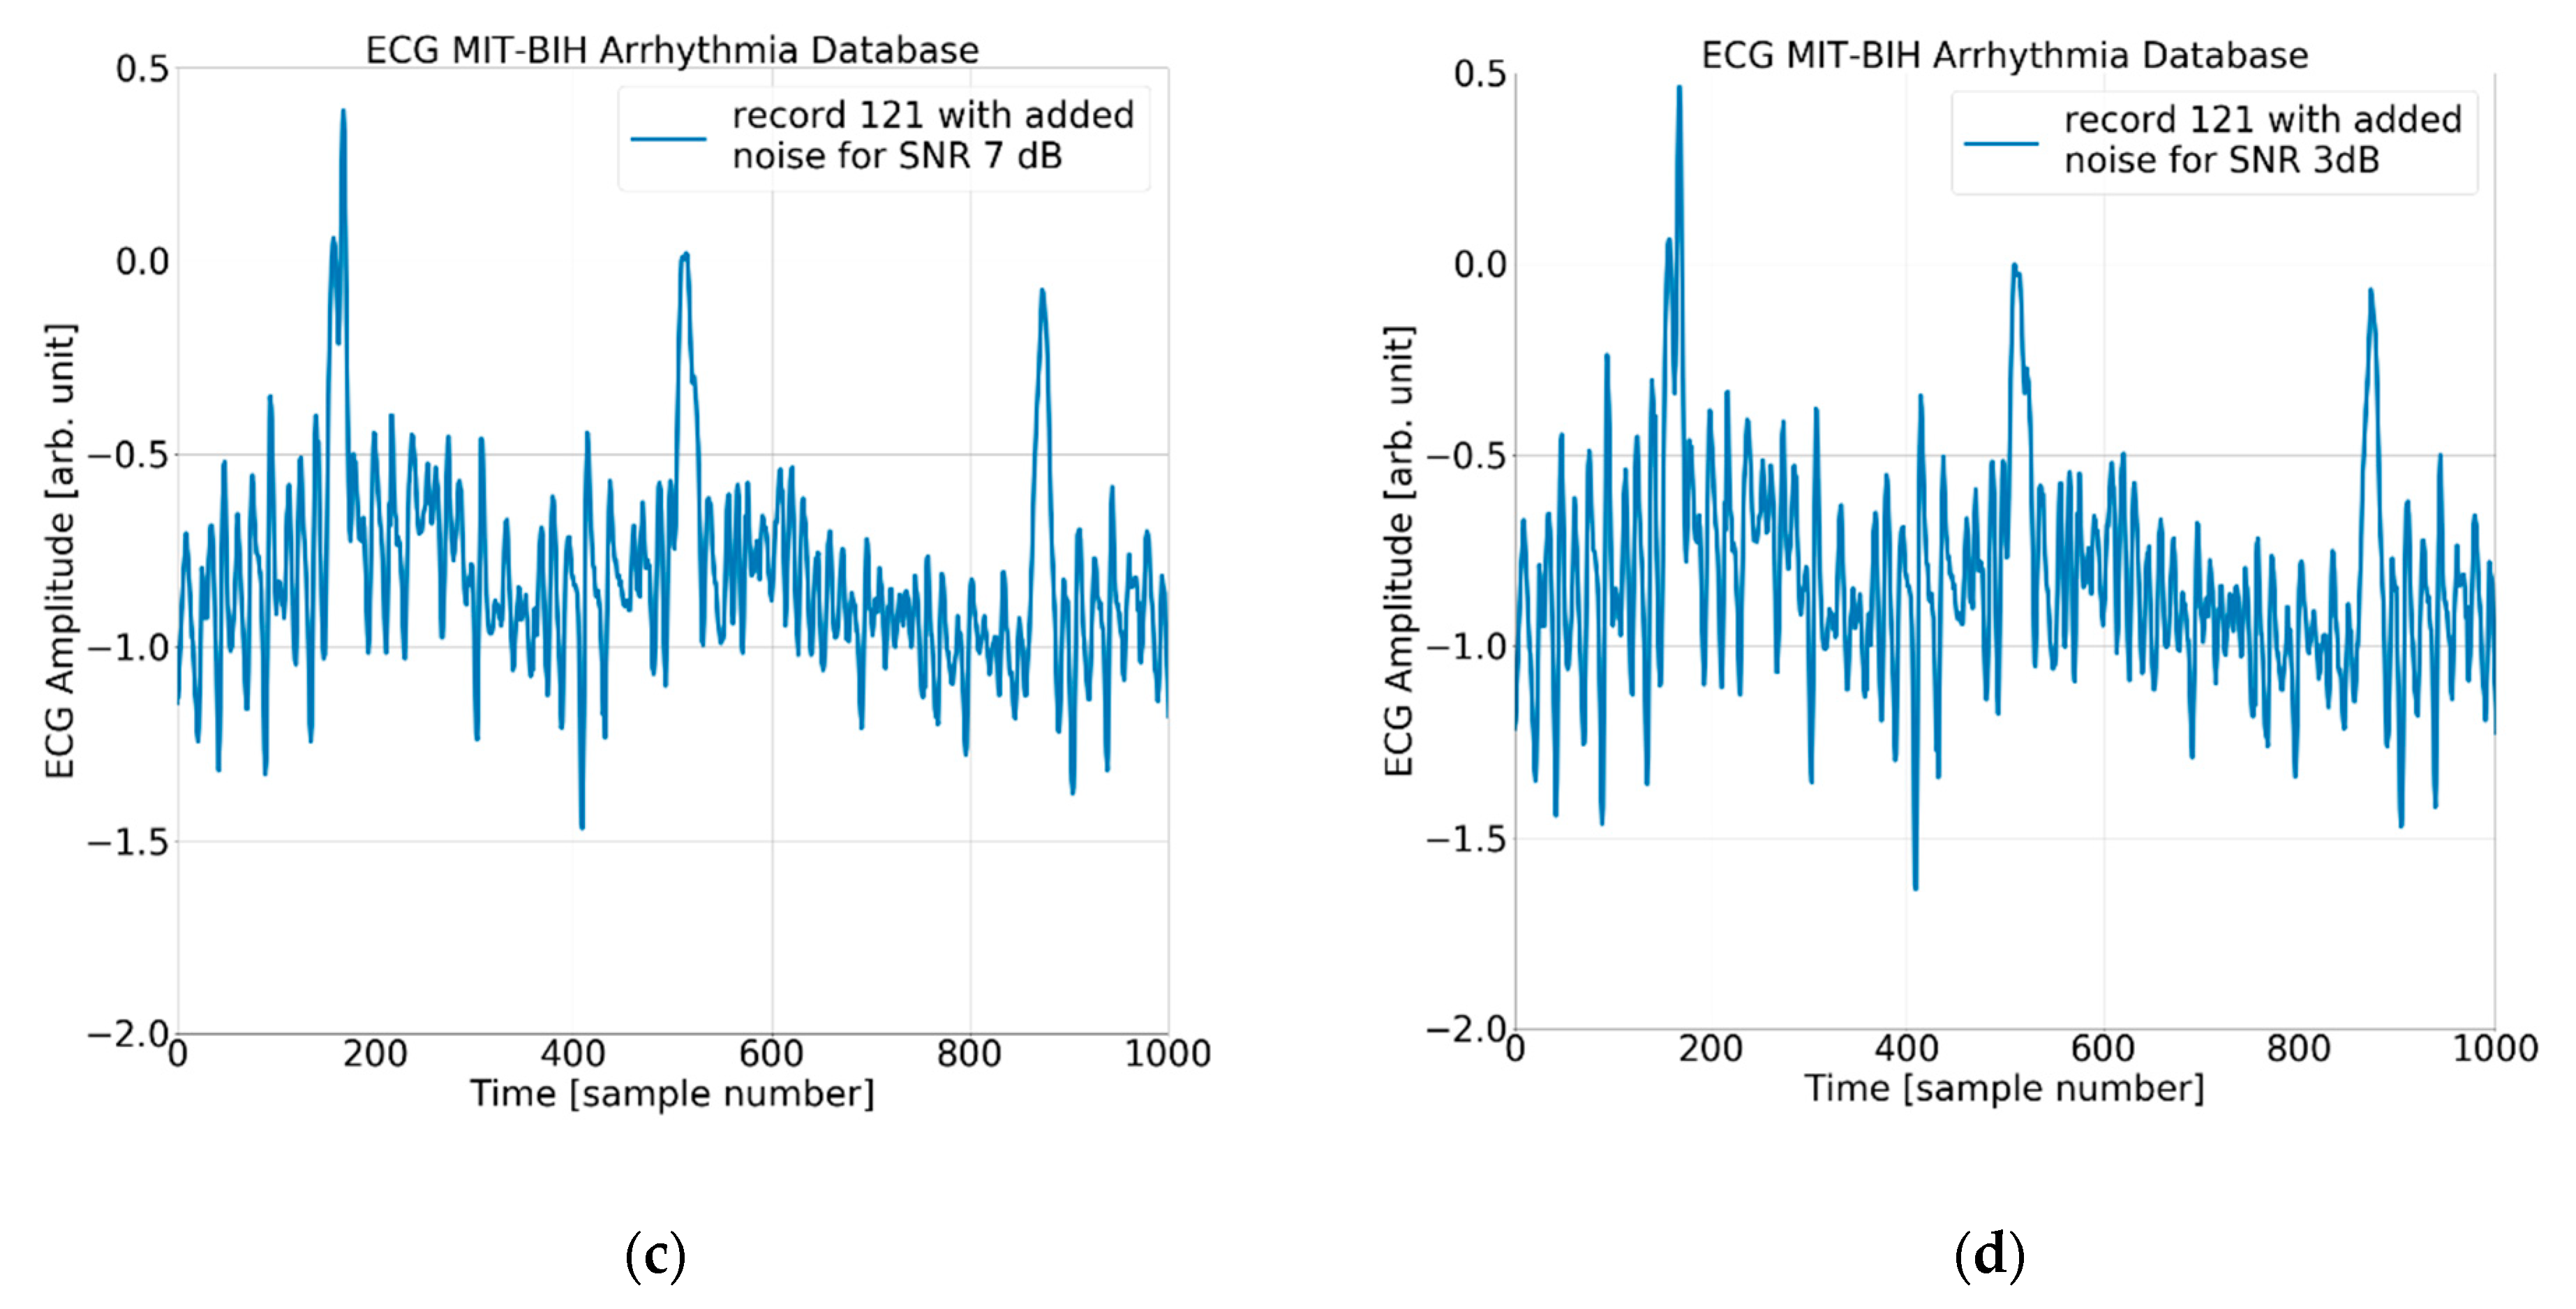
Noise Pattern and Noisy Test Signals
4. Results
4.1. Statistics of the QRS Detectors’ Performance
4.2. Plots of the Detectors’ Performance
5. Discussion
5.1. Influence of Noise
- Algorithm 1—83.72% and 82.12%,
- Algorithm 2—90.68% and 89.18%,
- Algorithm 3—77.12% and 71.74%,
- and Algorithm 4—62.03% and 70.43%; there is no deterioration, but an improvement of 8.4% with added noise.
5.2. Influence of Detector Time Tolerance DTT
- Algorithm 1—27.54% and 99.25%,
- Algorithm 2—65.75% and 99.71%,
- Algorithm 3—8.26% and 94.80%,
- and Algorithm 4—14.30% and 99.46%.
- Algorithm 1 for QRS morphologies N, L, R, P, and A, with the exception of DTT 8.33 ms (three samples), reveals TP/TB of more than 90%. For QRS morphology type V, the TP/TB results are below 90% for all DTT ≤ 125 ms (45 samples). For DTT 8.33 ms (three samples), for all QRS morphologies, the TP/TB results are below 30%.
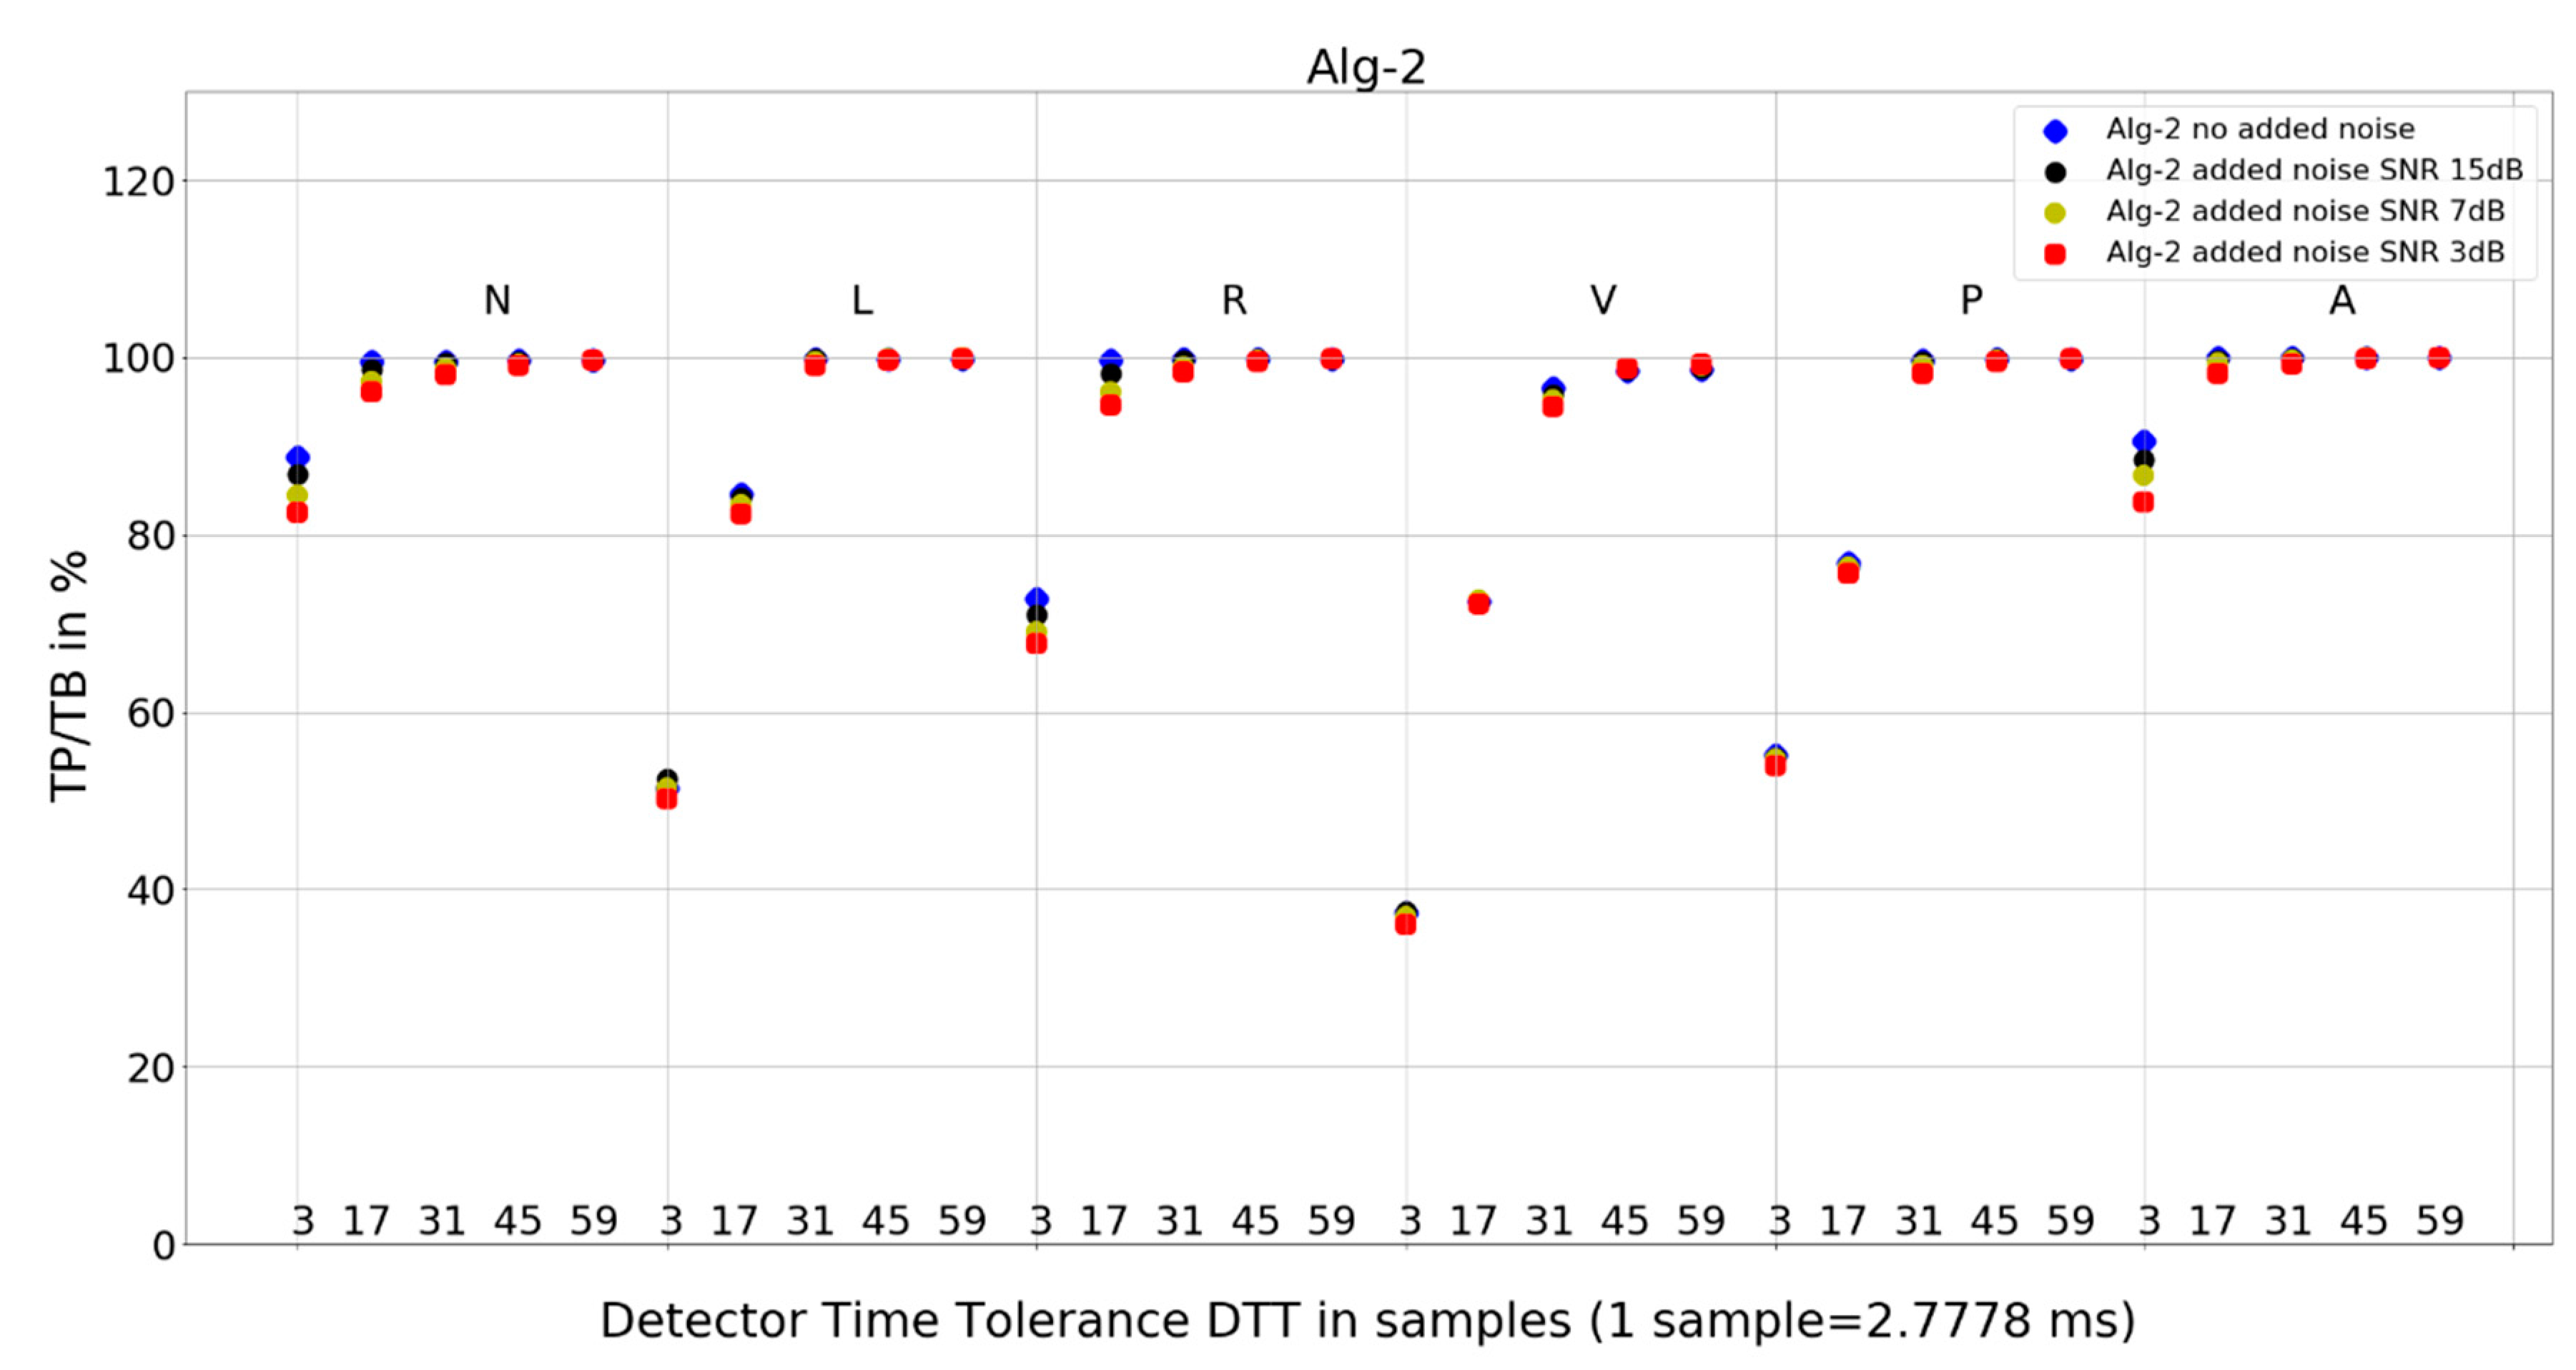
- Algorithm 2 results of TP/TB for all DTT and for QRS morphology N and A are above 80%. For L-, R-, V- and P-type QRS morphologies, the TP/TB results are above 90% for DTT > 86.11 ms (31 samples).
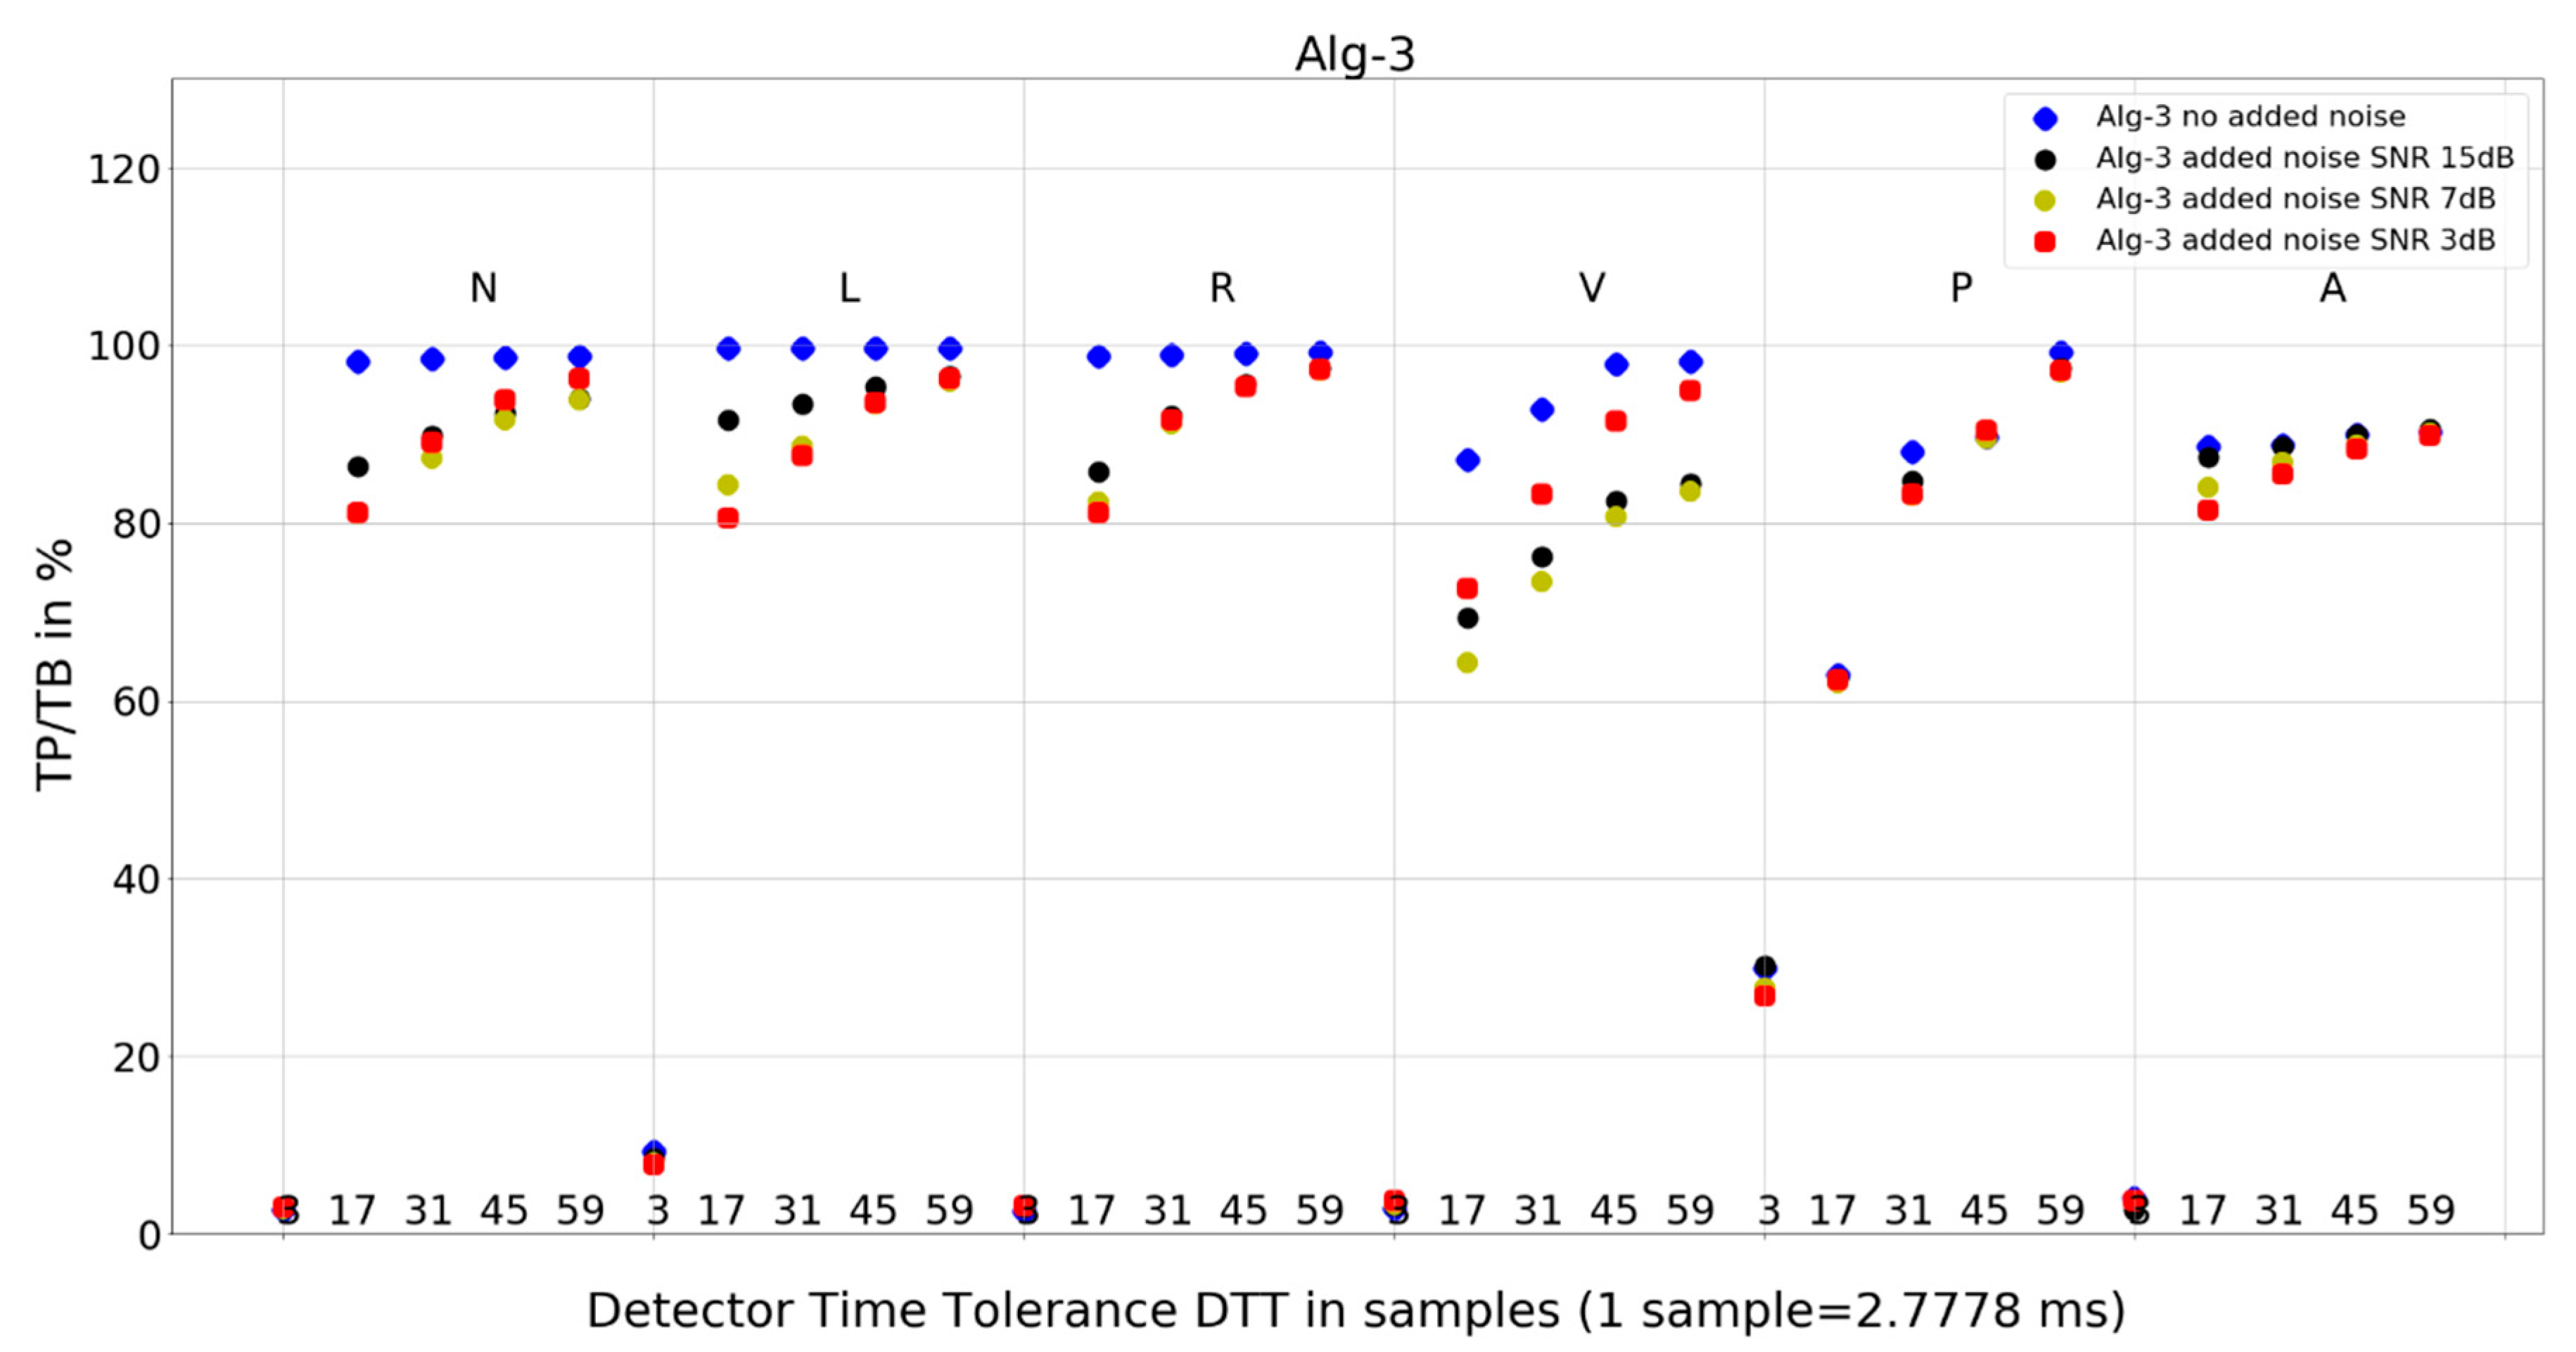
- Algorithm 3 TP/TB results for DTT 8.33 ms and for all QRS morphologies are below 30%, and for other higher DTT values, there is a clear deterioration of TP/TB results with decreasing DTT. For all QRS morphologies TP/TB is above 90% only for DTT 125 ms and 163.89 ms (45 and 59 samples).
- Algorithm 4 TP/TB results for all QRS morphologies are above 90% only for DTT 125 ms and 163.89 ms (45 and 59 samples). Results for other values of DTT clearly deteriorate well below 80% with decreasing DTT value.
5.3. Influence of QRS Morphology
- Algorithm 1 from 76.92% for V to 92.52% for P,
- Algorithm 2 from 80.51% for V to 97.24% for A,
- Algorithm 3 from 67.29% for V to 76.47% for L,
- and Algorithm 4 from 65.38% for L to 72.28% for N.
- Algorithm 1 for N, R, and A—similar locations; for L, V, and P, each type—different locations,
- Algorithm 2 for N, R, and A—similar locations; for L, V, and P—similar locations,
- Algorithm 3 for N, L, and R—similar locations; for V, P, and A, each type—different locations,
- and Algorithm 4 for N, R, and A—similar locations; for L, V, and P—similar locations.
5.4. Comparison of the Algorithms Studied
5.5. Limitations of the Study and Future Research
6. Conclusions
- accuracy (i.e., TP/TB),
- precision of detection point location, i.e., TP/TB dependence on the DTT,
- sensitivity to noise,
- and sensitivity to QRS morphology.
Author Contributions
Funding
Institutional Review Board Statement
Informed Consent Statement
Data Availability Statement
Conflicts of Interest
References
- Gutiérrez-Rivas, R.; Garcia, J.J.; Marnane, W.P.; Hernández, A. Novel real-time low-complexity QRS complex detector based on adaptive thresholding. IEEE Sens. J. 2015, 15, 6036–6043. [Google Scholar] [CrossRef]
- Reklewski, W.; Heryan, K.; Miśkowicz, M.; Augustyniak, P. Real time ECG R-peak detection by extremum sampling. In Proceedings of the 2020 IEEE 6th International Conference on Event-Based Control, Communication, and Signal Processing (EBCCSP), Krakow, Poland, 23–25 September 2020; pp. 1–7. [Google Scholar]
- Ravanshad, N.; Rezaee-Dehsorkh, H.; Lotfi, R.; Lian, Y. A level-crossing based QRS-detection algorithm for wearable ECG sensors. IEEE J. Biomed. Health Inform. 2013, 18, 183–192. [Google Scholar] [CrossRef]
- Pan, J.; Tompkins, W.J. A real-time QRS detection algorithm. IEEE Trans. Biomed. Eng. 1985, 3, 230–236. [Google Scholar] [CrossRef]
- Moody, G.B.; Mark, R.G. The MIT-BIH arrhythmia database on CD-ROM and software for use with it. IEEE Comput. Cardiol. Proceed. 1990, 2, 185–188. [Google Scholar]
- Moody, G.; Muldrow, W.; Mark, R. The MIT-BIH noise stress test database. Comput. Cardiol. 1984, 11, 381–384. [Google Scholar]
- Carbone, P.; Narduzzi, C.; Petri, D. Dither signal effects on the resolution of nonlinear quantizers. IEEE Trans. Instrum. Meas. 1994, 43, 139–145. [Google Scholar] [CrossRef]
- Gray, R.M.; Stockham, T.G. Dithered quantizers. IEEE Trans. Inf. Theory 1993, 39, 805–812. [Google Scholar] [CrossRef]
- Kohler, B.U.; Hennig, C.; Orglmeister, R. The principles of software QRS detection. IEEE Eng. Med. Biol. Mag. 2002, 21, 42–57. [Google Scholar] [CrossRef] [PubMed]
- Heryan, K.; Reklewski, W.; Szaflarski, A.; Ordowski, M.; Augustyniak, P.; Miśkowicz, M. Sensitivity of QRS Detection Accuracy to Detector Temporal Resolution. In Proceedings of the 2021 IEEE Computing in Cardiology (CinC), Brno, Czech Republic, 13–15 September 2021; Volume 48, pp. 1–4. [Google Scholar]
- Tripathi, P.M.; Kumar, A.; Komaragiri, R.; Kumar, M. A review on computational methods for denoising and detecting ECG signals to detect cardiovascular diseases. Arch. Comput. Methods Eng. 2022, 29, 1875–1914. [Google Scholar] [CrossRef]
- Fariha MA, Z.; Ikeura, R.; Hayakawa, S.; Tsutsumi, S. Analysis of Pan-Tompkins algorithm performance with noisy ECG signals. In Journal of Physics: Conference Series; IOP Publishing: Bristol, UK, 2020; Volume 1532, p. 012022. [Google Scholar]
- Mohd Apandi, Z.F.; Ikeura, R.; Hayakawa, S.; Tsutsumi, S. An analysis of the effects of noisy electrocardiogram signal on heartbeat detection performance. Bioengineering 2020, 7, 53. [Google Scholar] [CrossRef]
- Zong, W.; Moody, G.B.; Jiang, D. A robust open-source algorithm to detect onset and duration of QRS complexes. Comput. Cardiol. 2003, 30, 737–740. [Google Scholar]
- Hamilton, P. Open Source ECG Analysis. Comput. Cardiol. 2002, 1, 101–104. [Google Scholar]
- D’Aloia, M.; Longo, A.; Rizzi, M. Noisy ECG signal analysis for automatic peak detection. Information 2019, 10, 35. [Google Scholar] [CrossRef]
- Gradl, S.; Leutheuser, H.; Elgendi, M.; Lang, N.; Eskofier, B.M. Temporal correction of detected R-peaks in ECG signals: A crucial step to improve QRS detection algorithms. In Proceedings of the 2015 37th Annual International Conference of the IEEE Engineering in Medicine and Biology Society (EMBC), Milan, Italy, 25–29 August 2015; pp. 522–525. [Google Scholar]
- Nallathambi, G.; Prıncipe, J.C. Integrate and fire pulse train automaton for QRS detection. IEEE Trans. Biomed. Eng. 2014, 61, 317–326. [Google Scholar] [CrossRef] [PubMed]
- Kohler, B.U.; Hennig, C.; Orglmeister, R. QRS Detection Using Zero Crossing Counts. Progress Biomed. Res. 2003, 8, 138–145. [Google Scholar]
- Elgendi, M. Fast QRS detection with an optimized knowledge-based method: Evaluation on 11 standard ECG databases. PLoS ONE 2013, 8, e73557. [Google Scholar] [CrossRef]
- Porr, B.; Macfarlane, P.W. A new QRS detector stress test combining temporal jitter and accuracy (JA) reveals significant performance differences amongst popular detectors. bioRxiv 2023, 722397. [Google Scholar] [CrossRef]
- Gusev, M.; Domazet, E. Optimizing the impact of resampling on QRS detection. In Communications in Computer and Information Science, Proceedings of the ICT Innovations 2018, Engineering and Life Sciences: 10th International Conference, ICT Innovations 2018, Ohrid, Macedonia, 17–19 September 2018; Springer International Publishing: Berlin/Heidelberg, Germany, 2018; pp. 107–119. [Google Scholar]
- Hamilton, P.S.; Tompkins, W.J. Quantitative investigation of QRS detection rules using the MIT/BIH arrhythmia database. IEEE Trans. Biomed. Eng. 1986, 12, 1157–1165. [Google Scholar] [CrossRef]
- Vollmer, M. Noise resistance of several top-scored heart beat detectors. In Proceedings of the 2017 Computing in Cardiology (CinC), Rennes, France, 24–27 September 2017; IEEE: Piscataway, NJ, USA; pp. 1–4. [Google Scholar]
- Liu, F.; Liu, C.; Jiang, X.; Zhang, Z.; Zhang, Y.; Li, J.; Wei, S. Performance analysis of ten common QRS detectors on different ECG application cases. J. Healthc. Eng. 2018, 2018, 9050812. [Google Scholar] [CrossRef]
- Gabbouj, M.; Kiranyaz, S.; Malik, J.; Zahid, M.U.; Ince, T.; Chowdhury, M.E.; Khandakar, A.; Tahir, A. Robust peak detection for holter ECGs by self-organized operational neural networks. In IEEE Transactions on Neural Networks and Learning Systems; IEEE: Piscataway, NJ, USA, 2022. [Google Scholar]
- Revanth, N.; Bennet, M.A. Detection of QRS Complexes in ECG Signal. In Proceedings of the 2023 IEEE International Conference on Integrated Circuits and Communication Systems (ICICACS), Raichur, India, 24–25 February 2023; IEEE: Piscataway, NJ, USA; pp. 1–5. [Google Scholar]
- Koka, T.; Muma, M. Fast and Sample Accurate R-Peak Detection for Noisy ECG Using Visibility Graphs. In Proceedings of the 2022 44th Annual International Conference of the IEEE Engineering in Medicine & Biology Society (EMBC), Glasgow, UK, 11–15 July 2022; IEEE: Piscataway, NJ, USA; pp. 121–126. [Google Scholar]
- Howell, L.; Porr, B. High precision ECG Database with Annotated R Peaks, Recorded and Filmed Under Realistic Conditions. 2018. [Google Scholar] [CrossRef]
- Kalidas, V.; Tamil, L. Real-time QRS detector using Stationary Wavelet Transform for Automated ECG Analysis. In Proceedings of the 2017 IEEE 17th International Conference on Bioinformatics and Bioengineering (BIBE), Washington, DC, USA, 23–25 October 2017; pp. 457–461. [Google Scholar]
- Emrich, J.; Koka, T.; Wirth, S.; Muma, M. Accelerated Sample-Accurate R-Peak Detectors Based on Visibility Graphs. In Proceedings of the 2023 31st European Signal Processing Conference (EUSIPCO), Helsinki, Finland, 4–8 September 2023; IEEE: Piscataway, NJ, USA; pp. 1090–1094. [Google Scholar]
- Chatterjee, S.; Thakur, R.S.; Yadav, R.N.; Gupta, L.; Raghuvanshi, D.K. Review of noise removal techniques in ECG signals. IET Signal Process. 2020, 14, 569–590. [Google Scholar] [CrossRef]
- Miskowicz, M. Reducing communication by event-triggered sampling. In Event-based Control and Signal Processing; CRC Press: Boca Raton, FL, USA, 2016; pp. 37–58. [Google Scholar]
- Porr, B.; Howell, L.; Stournaras, J.; Nir, Y. Popular ECG R peak detectors written in python, (1.3.3); Zenodo: Geneva, Switzerland, 2023. [Google Scholar] [CrossRef]
- Goldberger, A.; Amaral, L.A.; Glass, L.; Hausdorff, J.M.; Ivanov, P.C.; Mark, R.G.; Mietus, J.E.; Moody, G.B.; Peng, C.-K.; Stanley, H.E. PhysioBank, PhysioToolkit, and PhysioNet: Components of a new research resource for complex physiologic signals. Circulation 2000, 101, e215–e220. [Google Scholar] [CrossRef] [PubMed]
- Pohlmann, K.C. Principles of Digital Audio; McGraw-Hill Professional: New York, NY, USA, 2000. [Google Scholar]


| Algorithm Detector Temporal Tolerance [ms] (Samples) | Algorithm 1 | Algorithm 2 | Algorithm 3 | Algorithm 4 | ||||
|---|---|---|---|---|---|---|---|---|
| Mean | Std | Mean | Std | Mean | Std | Mean | Std | |
| 8.33 (3) | 27.54 | 21.93 | 65.75 | 19.74 | 8.26 | 9.52 | 14.30 | 6.36 |
| 47.22 (17) | 92.53 | 9.27 | 87.77 | 11.16 | 80.66 | 11.68 | 52.85 | 14.17 |
| 86.11 (31) | 96.79 | 4.44 | 98.66 | 1.62 | 88.43 | 6.25 | 74.93 | 8.83 |
| 125.00 (45) | 98.89 | 1.02 | 99.55 | 0.44 | 92.22 | 4.72 | 98.52 | 1.33 |
| 163.89 (59) | 99.25 | 0.89 | 99.71 | 0.36 | 94.80 | 4.45 | 99.46 | 0.55 |
| Algorithm Beat Type | Algorithm 1 | Algorithm 2 | Algorithm 3 | Algorithm 4 | ||||
|---|---|---|---|---|---|---|---|---|
| Mean | Std | Mean | Std | Mean | Std | Mean | Std | |
| N | 82.71 | 32.34 | 96.30 | 5.66 | 74.12 | 36.91 | 72.28 | 30.12 |
| L | 82.47 | 31.34 | 86.86 | 19.30 | 76.47 | 35.31 | 65.38 | 36.50 |
| R | 80.96 | 36.85 | 93.22 | 11.94 | 75.52 | 37.60 | 71.27 | 30.76 |
| V | 76.92 | 26.34 | 80.51 | 24.54 | 67.29 | 34.08 | 66.36 | 34.20 |
| P | 92.52 | 10.41 | 85.94 | 18.55 | 72.68 | 25.64 | 66.49 | 33.43 |
| A | 82.42 | 35.74 | 97.24 | 5.22 | 71.17 | 34.75 | 66.30 | 35.91 |
| Algorithm Added Noise Level | Algorithm 1 | Algorithm 2 | Algorithm 3 | Algorithm 4 | ||||
|---|---|---|---|---|---|---|---|---|
| Mean | Std | Mean | Std | Mean | Std | Mean | Std | |
| No noise added | 83.72 | 30.88 | 90.68 | 16.80 | 77.12 | 35.90 | 62.03 | 36.60 |
| SNR 15 dB | 83.38 | 30.48 | 90.34 | 16.78 | 72.16 | 33.62 | 69.27 | 32.71 |
| SNR 7 dB | 82.78 | 30.08 | 89.86 | 16.93 | 70.47 | 33.00 | 70.43 | 31.67 |
| SNR 3 dB | 82.12 | 29.71 | 89.18 | 17.20 | 71.74 | 33.50 | 70.32 | 31.60 |
| MIT-BIH Arrhythmia Database, Normal—N-Type Beats | No Noise Added | SNR = 15 dB | SNR = 7 dB | SNR = 3 dB | SNR = 15 dB vs. No Noise Added | SNR = 7 dB vs. No Noise Added | SNR = 3 dB vs. No Noise Added | |
|---|---|---|---|---|---|---|---|---|
| Record | TB | TP | TP | TP | TP | |||
| 100 | 2239 | 1337 | 1176 | 1143 | 1123 | −161 | −194 | −214 |
| 101 | 1860 | 1860 | 1853 | 1806 | 1766 | −7 | −54 | −94 |
| 102 | 99 | 99 | 92 | 86 | 80 | −7 | −13 | −19 |
| 103 | 2082 | 114 | 261 | 334 | 374 | 147 | 220 | 260 |
| 104 | 163 | 1 | 1 | 4 | 6 | 0 | 3 | 5 |
| 105 | 2526 | 2383 | 2305 | 2203 | 2128 | −78 | −180 | −255 |
| 106 | 1507 | 47 | 122 | 158 | 182 | 75 | 111 | 135 |
| 108 | 1739 | 660 | 552 | 518 | 512 | −108 | −142 | −148 |
| 112 | 2537 | 0 | 93 | 126 | 137 | 93 | 126 | 137 |
| 113 | 1789 | 0 | 29 | 117 | 148 | 29 | 117 | 148 |
| 114 | 1820 | 521 | 456 | 440 | 421 | −65 | −81 | −100 |
| 115 | 1953 | 0 | 9 | 32 | 55 | 9 | 32 | 55 |
| 116 | 2302 | 1 | 51 | 139 | 178 | 50 | 138 | 177 |
| 117 | 1534 | 619 | 565 | 520 | 489 | −54 | −99 | −130 |
| 119 | 1543 | 12 | 278 | 330 | 360 | 266 | 318 | 348 |
| 121 | 1861 | 1165 | 894 | 760 | 679 | −271 | −405 | −486 |
| 122 | 2476 | 254 | 664 | 751 | 777 | 410 | 497 | 523 |
| 123 | 1515 | 3 | 77 | 59 | 79 | 74 | 56 | 76 |
| 200 | 1743 | 1 | 10 | 34 | 61 | 9 | 33 | 60 |
| 201 | 1625 | 16 | 66 | 100 | 137 | 50 | 84 | 121 |
| 202 | 2061 | 3 | 91 | 136 | 156 | 88 | 133 | 153 |
| 203 | 2529 | 280 | 320 | 360 | 371 | 40 | 80 | 91 |
| 205 | 2571 | 1394 | 1346 | 1290 | 1263 | −48 | −104 | −131 |
| 208 | 1586 | 164 | 288 | 360 | 386 | 124 | 196 | 222 |
| 209 | 2621 | 1 | 1 | 4 | 10 | 0 | 3 | 9 |
| 210 | 2423 | 16 | 101 | 186 | 234 | 85 | 170 | 218 |
| 212 | 923 | 6 | 28 | 55 | 78 | 22 | 49 | 72 |
| 213 | 2641 | 8 | 33 | 101 | 149 | 25 | 93 | 141 |
| 215 | 3195 | 2 | 3 | 3 | 4 | 1 | 1 | 2 |
| 217 | 244 | 0 | 2 | 8 | 11 | 2 | 8 | 11 |
| 219 | 2082 | 8 | 111 | 210 | 250 | 103 | 202 | 242 |
| 220 | 1954 | 2 | 7 | 36 | 44 | 5 | 34 | 42 |
| 221 | 2031 | 0 | 12 | 39 | 80 | 12 | 39 | 80 |
| 222 | 2062 | 814 | 841 | 832 | 822 | 27 | 18 | 8 |
| 223 | 2029 | 0 | 9 | 40 | 77 | 9 | 40 | 77 |
| 228 | 1688 | 1204 | 1094 | 1015 | 972 | −110 | −189 | −232 |
| 230 | 2255 | 0 | 0 | 2 | 3 | 0 | 2 | 3 |
| 231 | 314 | 265 | 219 | 226 | 229 | −46 | −39 | −36 |
| 233 | 2230 | 191 | 346 | 431 | 470 | 155 | 240 | 279 |
| 234 | 2700 | 11 | 215 | 344 | 413 | 204 | 333 | 402 |
| TOTAL | 75,052 | 13,462 | 14,621 | 15,338 | 15,714 | 1159 | 1876 | 2252 |
| MIT-BIH Arrhythmia Database, Normal—N-Type Beats | No Noise Added | SNR = 15 dB | SNR = 7 dB | SNR = 3 dB | SNR = 15 dB vs. No Noise Added | SNR = 7 dB vs. No Noise Added | SNR = 3 dB vs. No Noise Added | |
|---|---|---|---|---|---|---|---|---|
| Record | TB | TP | TP | TP | TP | |||
| 100 | 2239 | 2238 | 2238 | 2232 | 2224 | 0 | −6 | −14 |
| 101 | 1860 | 1860 | 1856 | 1820 | 1797 | −4 | −40 | −63 |
| 102 | 99 | 99 | 98 | 95 | 92 | −1 | −4 | −7 |
| 103 | 2082 | 2082 | 2082 | 2081 | 2077 | 0 | −1 | −5 |
| 104 | 163 | 163 | 163 | 163 | 161 | 0 | 0 | −2 |
| 105 | 2526 | 2508 | 2510 | 2502 | 2477 | 2 | −6 | −31 |
| 106 | 1507 | 1504 | 1467 | 1425 | 1398 | −37 | −79 | −106 |
| 108 | 1739 | 1666 | 1527 | 1459 | 1459 | −139 | −207 | −207 |
| 112 | 2537 | 2536 | 2487 | 2343 | 2220 | −49 | −193 | −316 |
| 113 | 1789 | 1788 | 1779 | 1770 | 1752 | −9 | −18 | −36 |
| 114 | 1820 | 1778 | 1721 | 1659 | 1606 | −57 | −119 | −172 |
| 115 | 1953 | 1952 | 1952 | 1930 | 1920 | 0 | −22 | −32 |
| 116 | 2302 | 2284 | 2280 | 2262 | 2232 | −4 | −22 | −52 |
| 117 | 1534 | 1534 | 1437 | 1360 | 1319 | −97 | −174 | −215 |
| 119 | 1543 | 1543 | 1490 | 1454 | 1428 | −53 | −89 | −115 |
| 121 | 1861 | 1860 | 1694 | 1532 | 1403 | −166 | −328 | −457 |
| 122 | 2476 | 2476 | 2471 | 2434 | 2376 | −5 | −42 | −100 |
| 123 | 1515 | 1515 | 1462 | 1447 | 1437 | −53 | −68 | −78 |
| 200 | 1743 | 1740 | 1738 | 1730 | 1725 | −2 | −10 | −15 |
| 201 | 1625 | 1610 | 1595 | 1588 | 1586 | −15 | −22 | −24 |
| 202 | 2061 | 2061 | 2037 | 2028 | 2021 | −24 | −33 | −40 |
| 203 | 2529 | 2471 | 2455 | 2409 | 2382 | −16 | −62 | −89 |
| 205 | 2571 | 2570 | 2570 | 2568 | 2563 | 0 | −2 | −7 |
| 208 | 1586 | 1579 | 1576 | 1572 | 1565 | −3 | −7 | −14 |
| 209 | 2621 | 2621 | 2621 | 2621 | 2621 | 0 | 0 | 0 |
| 210 | 2423 | 2421 | 2417 | 2415 | 2405 | −4 | −6 | −16 |
| 212 | 923 | 922 | 922 | 922 | 922 | 0 | 0 | 0 |
| 213 | 2641 | 2640 | 2640 | 2637 | 2637 | 0 | −3 | −3 |
| 215 | 3195 | 3194 | 3194 | 3194 | 3194 | 0 | 0 | 0 |
| 217 | 244 | 244 | 244 | 243 | 239 | 0 | −1 | −5 |
| 219 | 2082 | 2082 | 2069 | 2039 | 2032 | −13 | −43 | −50 |
| 220 | 1954 | 1954 | 1954 | 1951 | 1929 | 0 | −3 | −25 |
| 221 | 2031 | 2031 | 2028 | 2020 | 2011 | −3 | −11 | −20 |
| 222 | 2062 | 2048 | 2022 | 1983 | 1962 | −26 | −65 | −86 |
| 223 | 2029 | 2029 | 2027 | 2019 | 2005 | −2 | −10 | −24 |
| 228 | 1688 | 1643 | 1557 | 1508 | 1481 | −86 | −135 | −162 |
| 230 | 2255 | 2255 | 2255 | 2254 | 2253 | 0 | −1 | −2 |
| 231 | 314 | 289 | 255 | 260 | 264 | −34 | −29 | −25 |
| 233 | 2230 | 2228 | 2229 | 2226 | 2217 | 1 | −2 | −11 |
| 234 | 2700 | 2697 | 2699 | 2699 | 2699 | 2 | 2 | 2 |
| TOTAL | 75,052 | 74,715 | 73,818 | 72,854 | 72,091 | −897 | −1861 | −2624 |
| MIT-BIH Arrhythmia Database, Normal—N-Type Beats | No Noise Added | SNR = 15 dB | SNR = 7 d | SNR = 3 dB | SNR = 15 dB vs. No Noise Added | SNR = 7 dB vs. No Noise Added | SNR = 3 dB vs. No Noise Added | |
|---|---|---|---|---|---|---|---|---|
| Record | TB | TP | TP | TP | TP | |||
| 100 | 2239 | 2236 | 2235 | 2229 | 2198 | −1 | −7 | −38 |
| 101 | 1860 | 1856 | 1855 | 1856 | 1849 | −1 | 0 | −7 |
| 102 | 99 | 92 | 84 | 75 | 67 | −8 | −17 | −25 |
| 103 | 2082 | 2080 | 2080 | 2079 | 2077 | 0 | −1 | −3 |
| 104 | 163 | 163 | 163 | 161 | 158 | 0 | −2 | −5 |
| 105 | 2526 | 2465 | 2444 | 2362 | 2267 | −21 | −103 | −198 |
| 106 | 1507 | 1489 | 1489 | 1478 | 1471 | 0 | −11 | −18 |
| 108 | 1739 | 705 | 652 | 641 | 644 | −53 | −64 | −61 |
| 112 | 2537 | 1637 | 1458 | 1266 | 1150 | −179 | −371 | −487 |
| 113 | 1789 | 1787 | 1788 | 1788 | 1788 | 1 | 1 | 1 |
| 114 | 1820 | 521 | 505 | 475 | 455 | −16 | −46 | −66 |
| 115 | 1953 | 1948 | 1947 | 1934 | 1916 | −1 | −14 | −32 |
| 116 | 2302 | 2268 | 2222 | 2128 | 2048 | −46 | −140 | −220 |
| 117 | 1534 | 1002 | 852 | 753 | 710 | −150 | −249 | −292 |
| 119 | 1543 | 1542 | 1530 | 1455 | 1398 | −12 | −87 | −144 |
| 121 | 1861 | 1609 | 1151 | 1002 | 903 | −458 | −607 | −706 |
| 122 | 2476 | 2475 | 2316 | 2130 | 2014 | −159 | −345 | −461 |
| 123 | 1515 | 1513 | 1494 | 1431 | 1362 | −19 | −82 | −151 |
| 200 | 1743 | 1623 | 1575 | 1509 | 1446 | −48 | −114 | −177 |
| 201 | 1625 | 1622 | 1622 | 1603 | 1575 | 0 | −19 | −47 |
| 202 | 2061 | 2061 | 2058 | 2038 | 1991 | −3 | −23 | −70 |
| 203 | 2529 | 1810 | 1618 | 1497 | 1390 | −192 | −313 | −420 |
| 205 | 2571 | 2567 | 2567 | 2549 | 2518 | 0 | −18 | −49 |
| 208 | 1586 | 1569 | 1568 | 1557 | 1529 | −1 | −12 | −40 |
| 209 | 2621 | 2616 | 2616 | 2604 | 2586 | 0 | −12 | −30 |
| 210 | 2423 | 2417 | 2408 | 2355 | 2292 | −9 | −62 | −125 |
| 212 | 923 | 922 | 922 | 921 | 920 | 0 | −1 | −2 |
| 213 | 2641 | 2637 | 2637 | 2616 | 2575 | 0 | −21 | −62 |
| 215 | 3195 | 1997 | 1960 | 1915 | 1901 | −37 | −82 | −96 |
| 217 | 244 | 238 | 231 | 223 | 216 | −7 | −15 | −22 |
| 219 | 2082 | 2077 | 2069 | 1992 | 1936 | −8 | −85 | −141 |
| 220 | 1954 | 1939 | 1884 | 1852 | 1799 | −55 | −87 | −140 |
| 221 | 2031 | 2030 | 2031 | 2020 | 2000 | 1 | −10 | −30 |
| 222 | 2062 | 2049 | 2037 | 2012 | 1964 | −12 | −37 | −85 |
| 223 | 2029 | 1910 | 1873 | 1785 | 1709 | −37 | −125 | −201 |
| 228 | 1688 | 1675 | 1672 | 1616 | 1560 | −3 | −59 | −115 |
| 230 | 2255 | 215 | 301 | 371 | 411 | 86 | 156 | 196 |
| 231 | 314 | 314 | 314 | 314 | 314 | 0 | 0 | 0 |
| 233 | 2230 | 2223 | 2210 | 2135 | 2083 | −13 | −88 | −140 |
| 234 | 2700 | 2696 | 2697 | 2696 | 2684 | 1 | 0 | −12 |
| TOTAL | 75,052 | 66,595 | 65,135 | 63,423 | 61,874 | −1460 | −3172 | −4721 |
| MIT-BIH Arrhythmia Database, Normal—N-Type Beats | No Noise Added | SNR = 15 dB | SNR = 7 dB | SNR = 3 dB | SNR = 15 dB vs. No Noise Added | SNR = 7 dB vs. No Noise Added | SNR = 3 dB vs. No Noise Added | |
|---|---|---|---|---|---|---|---|---|
| Record | TB | TP | TP | TP | TP | |||
| 100 | 2239 | 2236 | 2235 | 2232 | 2214 | −1 | −4 | −22 |
| 101 | 1860 | 1856 | 1855 | 1856 | 1852 | −1 | 0 | −4 |
| 102 | 99 | 95 | 92 | 90 | 82 | −3 | −5 | −13 |
| 103 | 2082 | 2080 | 2080 | 2080 | 2079 | 0 | 0 | −1 |
| 104 | 163 | 163 | 163 | 163 | 162 | 0 | 0 | −1 |
| 105 | 2526 | 2484 | 2479 | 2427 | 2378 | −5 | −57 | −106 |
| 106 | 1507 | 1490 | 1492 | 1486 | 1485 | 2 | −4 | −5 |
| 108 | 1739 | 1610 | 1574 | 1556 | 1547 | −36 | −54 | −63 |
| 112 | 2537 | 2536 | 2432 | 2270 | 2177 | −104 | −266 | −359 |
| 113 | 1789 | 1787 | 1788 | 1788 | 1788 | 1 | 1 | 1 |
| 114 | 1820 | 1817 | 1811 | 1769 | 1723 | −6 | −48 | −94 |
| 115 | 1953 | 1950 | 1950 | 1948 | 1938 | 0 | −2 | −12 |
| 116 | 2302 | 2275 | 2268 | 2228 | 2195 | −7 | −47 | −80 |
| 117 | 1534 | 1534 | 1446 | 1381 | 1328 | −88 | −153 | −206 |
| 119 | 1543 | 1542 | 1533 | 1480 | 1434 | −9 | −62 | −108 |
| 121 | 1861 | 1860 | 1682 | 1579 | 1485 | −178 | −281 | −375 |
| 122 | 2476 | 2475 | 2424 | 2339 | 2289 | −51 | −136 | −186 |
| 123 | 1515 | 1513 | 1513 | 1491 | 1462 | 0 | −22 | −51 |
| 200 | 1743 | 1741 | 1739 | 1729 | 1716 | −2 | −12 | −25 |
| 201 | 1625 | 1623 | 1623 | 1615 | 1604 | 0 | −8 | −19 |
| 202 | 2061 | 2061 | 2061 | 2049 | 2027 | 0 | −12 | −34 |
| 203 | 2529 | 2449 | 2344 | 2262 | 2188 | −105 | −187 | −261 |
| 205 | 2571 | 2567 | 2567 | 2552 | 2525 | 0 | −15 | −42 |
| 208 | 1586 | 1569 | 1568 | 1563 | 1548 | −1 | −6 | −21 |
| 209 | 2621 | 2620 | 2619 | 2618 | 2617 | −1 | −2 | −3 |
| 210 | 2423 | 2418 | 2415 | 2394 | 2365 | −3 | −24 | −53 |
| 212 | 923 | 922 | 922 | 921 | 921 | 0 | −1 | −1 |
| 213 | 2641 | 2638 | 2639 | 2634 | 2608 | 1 | −4 | −30 |
| 215 | 3195 | 3194 | 3194 | 3191 | 3187 | 0 | −3 | −7 |
| 217 | 244 | 244 | 243 | 242 | 240 | −1 | −2 | −4 |
| 219 | 2082 | 2079 | 2077 | 2044 | 2007 | −2 | −35 | −72 |
| 220 | 1954 | 1953 | 1951 | 1948 | 1939 | −2 | −5 | −14 |
| 221 | 2031 | 2030 | 2031 | 2027 | 2015 | 1 | −3 | −15 |
| 222 | 2062 | 2055 | 2044 | 2021 | 1983 | −11 | −34 | −72 |
| 223 | 2029 | 2028 | 2024 | 1999 | 1967 | −4 | −29 | −61 |
| 228 | 1688 | 1677 | 1677 | 1635 | 1605 | 0 | −42 | −72 |
| 230 | 2255 | 2252 | 2252 | 2252 | 2252 | 0 | 0 | 0 |
| 231 | 314 | 314 | 314 | 314 | 314 | 0 | 0 | 0 |
| 233 | 2230 | 2224 | 2224 | 2190 | 2162 | 0 | −34 | −62 |
| 234 | 2700 | 2696 | 2697 | 2698 | 2689 | 1 | 2 | −7 |
| TOTAL | 75,052 | 74,657 | 74,042 | 73,061 | 72,097 | −615 | −1596 | −2560 |
| MIT-BIH Arrhythmia Database, Normal—N-Type Beats | No Noise Added | SNR = 15 dB | SNR = 7 dB | SNR = 3 dB | SNR = 15 dB vs. No Noise Added | SNR = 7 dB vs. No Noise Added | SNR = 3 dB vs. No Noise Added | |
|---|---|---|---|---|---|---|---|---|
| Record | TB | TP | TP | TP | TP | |||
| 100 | 2239 | 202 | 197 | 168 | 156 | −5 | −34 | −46 |
| 101 | 1860 | 16 | 32 | 32 | 36 | 16 | 16 | 20 |
| 102 | 99 | 0 | 0 | 1 | 1 | 0 | 1 | 1 |
| 103 | 2082 | 2 | 3 | 2 | 1 | 1 | 0 | −1 |
| 104 | 163 | 8 | 9 | 12 | 8 | 1 | 4 | 0 |
| 105 | 2526 | 35 | 37 | 45 | 56 | 2 | 10 | 21 |
| 106 | 1507 | 0 | 1 | 0 | 2 | 1 | 0 | 2 |
| 108 | 1739 | 2 | 6 | 17 | 28 | 4 | 15 | 26 |
| 112 | 2537 | 58 | 165 | 208 | 239 | 107 | 150 | 181 |
| 113 | 1789 | 0 | 0 | 0 | 0 | 0 | 0 | 0 |
| 114 | 1820 | 244 | 224 | 228 | 211 | −20 | −16 | −33 |
| 115 | 1953 | 0 | 0 | 0 | 1 | 0 | 0 | 1 |
| 116 | 2302 | 0 | 2 | 3 | 8 | 2 | 3 | 8 |
| 117 | 1534 | 679 | 530 | 490 | 488 | −149 | −189 | −191 |
| 119 | 1543 | 0 | 0 | 1 | 1 | 0 | 1 | 1 |
| 121 | 1861 | 0 | 32 | 66 | 89 | 32 | 66 | 89 |
| 122 | 2476 | 0 | 1 | 7 | 11 | 1 | 7 | 11 |
| 123 | 1515 | 0 | 0 | 0 | 0 | 0 | 0 | 0 |
| 200 | 1743 | 0 | 0 | 0 | 10 | 0 | 0 | 10 |
| 201 | 1625 | 0 | 2 | 4 | 5 | 2 | 4 | 5 |
| 202 | 2061 | 0 | 1 | 3 | 2 | 1 | 3 | 2 |
| 203 | 2529 | 39 | 62 | 82 | 101 | 23 | 43 | 62 |
| 205 | 2571 | 29 | 37 | 42 | 47 | 8 | 13 | 18 |
| 208 | 1586 | 89 | 90 | 79 | 80 | 1 | −10 | −9 |
| 209 | 2621 | 2 | 1 | 5 | 7 | −1 | 3 | 5 |
| 210 | 2423 | 0 | 7 | 12 | 15 | 7 | 12 | 15 |
| 212 | 923 | 0 | 0 | 1 | 1 | 0 | 1 | 1 |
| 213 | 2641 | 0 | 0 | 2 | 1 | 0 | 2 | 1 |
| 215 | 3195 | 1 | 4 | 12 | 17 | 3 | 11 | 16 |
| 217 | 244 | 0 | 0 | 0 | 1 | 0 | 0 | 1 |
| 219 | 2082 | 2 | 2 | 2 | 4 | 0 | 0 | 2 |
| 220 | 1954 | 0 | 1 | 1 | 1 | 1 | 1 | 1 |
| 221 | 2031 | 0 | 1 | 2 | 4 | 1 | 2 | 4 |
| 222 | 2062 | 630 | 662 | 607 | 587 | 32 | −23 | −43 |
| 223 | 2029 | 0 | 1 | 6 | 6 | 1 | 6 | 6 |
| 228 | 1688 | 6 | 20 | 27 | 32 | 14 | 21 | 26 |
| 230 | 2255 | 0 | 0 | 0 | 1 | 0 | 0 | 1 |
| 231 | 314 | 0 | 0 | 0 | 0 | 0 | 0 | 0 |
| 233 | 2230 | 0 | 0 | 2 | 2 | 0 | 2 | 2 |
| 234 | 2700 | 0 | 0 | 0 | 1 | 0 | 0 | 1 |
| TOTAL | 75,052 | 2044 | 2130 | 2169 | 2261 | 86 | 125 | 217 |
| MIT-BIH Arrhythmia Database, Normal—N-TYPE beats | No Noise Added | SNR = 15 dB | SNR = 7 dB | SNR = 3 dB | SNR = 15 dB vs. No Noise Added | SNR = 7 dB vs. No Noise Added | SNR = 3 dB vs. No Noise Added | |
|---|---|---|---|---|---|---|---|---|
| Record | TB | TP | TP | TP | TP | |||
| 100 | 2239 | 2239 | 2104 | 1906 | 1829 | −135 | −333 | −410 |
| 101 | 1860 | 1853 | 1697 | 1530 | 1452 | −156 | −323 | −401 |
| 102 | 99 | 99 | 88 | 82 | 77 | −11 | −17 | −22 |
| 103 | 2082 | 2082 | 1954 | 1759 | 1690 | −128 | −323 | −392 |
| 104 | 163 | 159 | 156 | 146 | 138 | −3 | −13 | −21 |
| 105 | 2526 | 2440 | 2166 | 1999 | 1987 | −274 | −441 | −453 |
| 106 | 1507 | 1500 | 1331 | 1227 | 1202 | −169 | −273 | −298 |
| 108 | 1739 | 1570 | 1256 | 1149 | 1160 | −314 | −421 | −410 |
| 112 | 2537 | 2534 | 2101 | 2079 | 2014 | −433 | −455 | −520 |
| 113 | 1789 | 1789 | 1684 | 1556 | 1539 | −105 | −233 | −250 |
| 114 | 1820 | 1393 | 1432 | 1356 | 1277 | 39 | −37 | −116 |
| 115 | 1953 | 1953 | 1618 | 1535 | 1545 | −335 | −418 | −408 |
| 116 | 2302 | 2277 | 1859 | 1884 | 1950 | −418 | −393 | −327 |
| 117 | 1534 | 1532 | 1236 | 1208 | 1242 | −296 | −324 | −290 |
| 119 | 1543 | 1543 | 1168 | 1194 | 1225 | −375 | −349 | −318 |
| 121 | 1861 | 1857 | 1436 | 1375 | 1345 | −421 | −482 | −512 |
| 122 | 2476 | 2474 | 1948 | 1991 | 2012 | −526 | −483 | −462 |
| 123 | 1515 | 1515 | 1158 | 1147 | 1164 | −357 | −368 | −351 |
| 200 | 1743 | 1711 | 0 | 0 | 1408 | −1711 | −1711 | −303 |
| 201 | 1625 | 1621 | 1609 | 1497 | 1406 | −12 | −124 | −215 |
| 202 | 2061 | 2058 | 1974 | 1799 | 1723 | −84 | −259 | −335 |
| 203 | 2529 | 2453 | 2236 | 2078 | 2042 | −217 | −375 | −411 |
| 205 | 2571 | 2567 | 2456 | 2239 | 2174 | −111 | −328 | −393 |
| 208 | 1586 | 1559 | 1429 | 1325 | 1307 | −130 | −234 | −252 |
| 209 | 2621 | 2607 | 2562 | 2389 | 2329 | −45 | −218 | −278 |
| 210 | 2423 | 2393 | 2350 | 2164 | 2004 | −43 | −229 | −389 |
| 212 | 923 | 916 | 862 | 799 | 746 | −54 | −117 | −170 |
| 213 | 2641 | 2632 | 2346 | 2221 | 2208 | −286 | −411 | −424 |
| 215 | 3195 | 3187 | 3156 | 3003 | 2916 | −31 | −184 | −271 |
| 217 | 244 | 244 | 217 | 198 | 199 | −27 | −46 | −45 |
| 219 | 2082 | 2082 | 1724 | 1671 | 1659 | −358 | −411 | −423 |
| 220 | 1954 | 1953 | 1642 | 1534 | 1537 | −311 | −419 | −416 |
| 221 | 2031 | 2027 | 1955 | 1754 | 1726 | −72 | −273 | −301 |
| 222 | 2062 | 1665 | 1712 | 1613 | 1530 | 47 | −52 | −135 |
| 223 | 2029 | 2028 | 1740 | 1670 | 1619 | −288 | −358 | −409 |
| 228 | 1688 | 1649 | 1540 | 1381 | 1336 | −109 | −268 | −313 |
| 230 | 2255 | 2245 | 2089 | 1904 | 1831 | −156 | −341 | −414 |
| 231 | 314 | 314 | 296 | 254 | 246 | −18 | −60 | −68 |
| 233 | 2230 | 2228 | 1980 | 1836 | 1839 | −248 | −392 | −389 |
| 234 | 2700 | 2699 | 2540 | 2346 | 2251 | −159 | −353 | −448 |
| TOTAL | 75,052 | 73,647 | 64,807 | 60,798 | 60,884 | −8840 | −12,849 | −12,763 |
| MIT-BIH Arrhythmia Database, Normal—N-Type Beats | No Noise Added | SNR = 15 dB | SNR = 7 dB | SNR = 3 dB | SNR = 15 dB vs. No Noise Added | SNR = 7 dB vs. No Noise Added | SNR = 3 dB vs. No Noise Added | |
|---|---|---|---|---|---|---|---|---|
| Record | TB | TP | TP | TP | TP | |||
| 100 | 2239 | 376 | 522 | 608 | 616 | 146 | 232 | 240 |
| 101 | 1860 | 303 | 434 | 500 | 516 | 131 | 197 | 213 |
| 102 | 99 | 16 | 31 | 23 | 21 | 15 | 7 | 5 |
| 103 | 2082 | 197 | 301 | 411 | 448 | 104 | 214 | 251 |
| 104 | 163 | 18 | 23 | 29 | 29 | 5 | 11 | 11 |
| 105 | 2526 | 2178 | 2021 | 1778 | 1626 | −157 | −400 | −552 |
| 106 | 1507 | 396 | 432 | 476 | 480 | 36 | 80 | 84 |
| 108 | 1739 | 96 | 209 | 232 | 223 | 113 | 136 | 127 |
| 112 | 2537 | 7 | 155 | 131 | 105 | 148 | 124 | 98 |
| 113 | 1789 | 199 | 289 | 370 | 415 | 90 | 171 | 216 |
| 114 | 1820 | 71 | 138 | 137 | 132 | 67 | 66 | 61 |
| 115 | 1953 | 4 | 84 | 157 | 196 | 80 | 153 | 192 |
| 116 | 2302 | 64 | 337 | 365 | 385 | 273 | 301 | 321 |
| 117 | 1534 | 142 | 308 | 313 | 292 | 166 | 171 | 150 |
| 119 | 1543 | 756 | 796 | 667 | 588 | 40 | −89 | −168 |
| 121 | 1861 | 663 | 467 | 153 | 87 | −196 | −510 | −576 |
| 122 | 2476 | 2123 | 1734 | 1383 | 1141 | −389 | −740 | −982 |
| 123 | 1515 | 7 | 74 | 147 | 153 | 67 | 140 | 146 |
| 200 | 1743 | 1 | 20 | 52 | 70 | 19 | 51 | 69 |
| 201 | 1625 | 27 | 117 | 185 | 228 | 90 | 158 | 201 |
| 202 | 2061 | 11 | 48 | 127 | 204 | 37 | 116 | 193 |
| 203 | 2529 | 114 | 210 | 221 | 227 | 96 | 107 | 113 |
| 205 | 2571 | 561 | 741 | 788 | 730 | 180 | 227 | 169 |
| 208 | 1586 | 314 | 440 | 441 | 408 | 126 | 127 | 94 |
| 209 | 2621 | 71 | 186 | 304 | 355 | 115 | 233 | 284 |
| 210 | 2423 | 54 | 329 | 400 | 464 | 275 | 346 | 410 |
| 212 | 923 | 514 | 511 | 499 | 490 | −3 | −15 | −24 |
| 213 | 2641 | 772 | 1714 | 1635 | 1392 | 942 | 863 | 620 |
| 215 | 3195 | 3 | 24 | 90 | 129 | 21 | 87 | 126 |
| 217 | 244 | 0 | 14 | 19 | 22 | 14 | 19 | 22 |
| 219 | 2082 | 75 | 466 | 563 | 537 | 391 | 488 | 462 |
| 220 | 1954 | 7 | 74 | 161 | 196 | 67 | 154 | 189 |
| 221 | 2031 | 45 | 200 | 312 | 355 | 155 | 267 | 310 |
| 222 | 2062 | 543 | 607 | 600 | 593 | 64 | 57 | 50 |
| 223 | 2029 | 10 | 73 | 107 | 97 | 63 | 97 | 87 |
| 228 | 1688 | 336 | 543 | 504 | 504 | 207 | 168 | 168 |
| 230 | 2255 | 0 | 2 | 11 | 28 | 2 | 11 | 28 |
| 231 | 314 | 106 | 111 | 116 | 126 | 5 | 10 | 20 |
| 233 | 2230 | 14 | 209 | 321 | 337 | 195 | 307 | 323 |
| 234 | 2700 | 706 | 872 | 953 | 997 | 166 | 247 | 291 |
| TOTAL | 75,052 | 11,900 | 15,866 | 16,289 | 15,942 | 3966 | 4389 | 4042 |
| MIT-BIH Arrhythmia Database, Normal—N-Type Beats | No Noise Added | SNR = 15 dB | SNR = 7 dB | SNR = 3 dB | SNR = 15 dB vs. No Noise Added | SNR = 7 dB vs. No Noise Added | SNR = 3 dB vs. No Noise Added | |
|---|---|---|---|---|---|---|---|---|
| Record | TB | TP | TP | TP | TP | |||
| 100 | 2239 | 1920 | 1889 | 1909 | 1851 | −31 | −11 | −69 |
| 101 | 1860 | 1332 | 1359 | 1381 | 1361 | 27 | 49 | 29 |
| 102 | 99 | 20 | 45 | 37 | 36 | 25 | 17 | 16 |
| 103 | 2082 | 1339 | 1480 | 1554 | 1602 | 141 | 215 | 263 |
| 104 | 163 | 58 | 85 | 96 | 93 | 27 | 38 | 35 |
| 105 | 2526 | 2372 | 2281 | 2093 | 2001 | −91 | −279 | −371 |
| 106 | 1507 | 1500 | 1473 | 1438 | 1399 | −27 | −62 | −101 |
| 108 | 1739 | 457 | 891 | 929 | 933 | 434 | 472 | 476 |
| 112 | 2537 | 1117 | 1503 | 1545 | 1462 | 386 | 428 | 345 |
| 113 | 1789 | 645 | 958 | 1107 | 1185 | 313 | 462 | 540 |
| 114 | 1820 | 579 | 873 | 920 | 923 | 294 | 341 | 344 |
| 115 | 1953 | 393 | 768 | 956 | 1017 | 375 | 563 | 624 |
| 116 | 2302 | 1388 | 1745 | 1744 | 1721 | 357 | 356 | 333 |
| 117 | 1534 | 409 | 857 | 907 | 905 | 448 | 498 | 496 |
| 119 | 1543 | 1508 | 1408 | 1266 | 1211 | −100 | −242 | −297 |
| 121 | 1861 | 1036 | 1123 | 979 | 873 | 87 | −57 | −163 |
| 122 | 2476 | 2459 | 2205 | 2038 | 1958 | −254 | −421 | −501 |
| 123 | 1515 | 313 | 736 | 864 | 859 | 423 | 551 | 546 |
| 200 | 1743 | 678 | 952 | 1040 | 1074 | 274 | 362 | 396 |
| 201 | 1625 | 964 | 1131 | 1184 | 1183 | 167 | 220 | 219 |
| 202 | 2061 | 895 | 1216 | 1333 | 1353 | 321 | 438 | 458 |
| 203 | 2529 | 1277 | 1649 | 1668 | 1692 | 372 | 391 | 415 |
| 205 | 2571 | 2018 | 2159 | 2137 | 2087 | 141 | 119 | 69 |
| 208 | 1586 | 1127 | 1271 | 1267 | 1216 | 144 | 140 | 89 |
| 209 | 2621 | 957 | 1354 | 1582 | 1656 | 397 | 625 | 699 |
| 210 | 2423 | 1026 | 1515 | 1622 | 1649 | 489 | 596 | 623 |
| 212 | 923 | 856 | 842 | 848 | 829 | −14 | −8 | −27 |
| 213 | 2641 | 1558 | 2161 | 2180 | 2083 | 603 | 622 | 525 |
| 215 | 3195 | 922 | 1300 | 1521 | 1651 | 378 | 599 | 729 |
| 217 | 244 | 55 | 135 | 145 | 149 | 80 | 90 | 94 |
| 219 | 2082 | 726 | 1442 | 1536 | 1503 | 716 | 810 | 777 |
| 220 | 1954 | 1106 | 1277 | 1351 | 1372 | 171 | 245 | 266 |
| 221 | 2031 | 739 | 1235 | 1379 | 1438 | 496 | 640 | 699 |
| 222 | 2062 | 1870 | 1840 | 1795 | 1754 | −30 | −75 | −116 |
| 223 | 2029 | 1220 | 1368 | 1359 | 1350 | 148 | 139 | 130 |
| 228 | 1688 | 1375 | 1406 | 1285 | 1242 | 31 | −90 | −133 |
| 230 | 2255 | 722 | 813 | 928 | 1009 | 91 | 206 | 287 |
| 231 | 314 | 291 | 278 | 278 | 283 | −13 | −13 | −8 |
| 233 | 2230 | 1190 | 1458 | 1504 | 1483 | 268 | 314 | 293 |
| 234 | 2700 | 1943 | 2209 | 2270 | 2254 | 266 | 327 | 311 |
| TOTAL | 75,052 | 42,360 | 50,690 | 51,975 | 51,700 | 8330 | 9615 | 9340 |
Disclaimer/Publisher’s Note: The statements, opinions and data contained in all publications are solely those of the individual author(s) and contributor(s) and not of MDPI and/or the editor(s). MDPI and/or the editor(s) disclaim responsibility for any injury to people or property resulting from any ideas, methods, instructions or products referred to in the content. |
© 2024 by the authors. Licensee MDPI, Basel, Switzerland. This article is an open access article distributed under the terms and conditions of the Creative Commons Attribution (CC BY) license (https://creativecommons.org/licenses/by/4.0/).
Share and Cite
Reklewski, W.; Miśkowicz, M.; Augustyniak, P. QRS Detector Performance Evaluation Aware of Temporal Accuracy and Presence of Noise. Sensors 2024, 24, 1698. https://doi.org/10.3390/s24051698
Reklewski W, Miśkowicz M, Augustyniak P. QRS Detector Performance Evaluation Aware of Temporal Accuracy and Presence of Noise. Sensors. 2024; 24(5):1698. https://doi.org/10.3390/s24051698
Chicago/Turabian StyleReklewski, Wojciech, Marek Miśkowicz, and Piotr Augustyniak. 2024. "QRS Detector Performance Evaluation Aware of Temporal Accuracy and Presence of Noise" Sensors 24, no. 5: 1698. https://doi.org/10.3390/s24051698
APA StyleReklewski, W., Miśkowicz, M., & Augustyniak, P. (2024). QRS Detector Performance Evaluation Aware of Temporal Accuracy and Presence of Noise. Sensors, 24(5), 1698. https://doi.org/10.3390/s24051698