Article

Determination of N-Acetyl-L-cysteine Ethyl Ester (NACET) by Sequential Injection Analysis

1
Department of Analytical Chemistry, Faculty of Chemistry and Technology, University of Split, Ruđera Boškovića 35, 21000 Split, Croatia
2
Department of Chemistry, Faculty of Science and Education, University of Mostar, Matice hrvatske bb, 88000 Mostar, Bosnia and Herzegovina
3
Institute of Toxicology, Core Unit Proteomics, Hannover Medical School, Carl-Neuberg-Str. 1, 30625 Hannover, Germany
4
Faculty of Chemistry and Pharmacy, Sofia University “St. Kl. Ohridski”, 1 James Bourchier Blvd., 1164 Sofia, Bulgaria
5
School of Chemistry, The University of Melbourne, Melbourne, VIC 3010, Australia
6
Department of Chemical Engineering, The University of Melbourne, Melbourne, VIC 3010, Australia
*
Authors to whom correspondence should be addressed.
Sensors 2024, 24(2), 312; https://doi.org/10.3390/s24020312
Submission received: 26 November 2023 / Revised: 25 December 2023 / Accepted: 30 December 2023 / Published: 5 January 2024
(This article belongs to the Section Chemical Sensors)

Abstract

:
New sequential injection analysis (SIA) methods with optical sensing for the determination of N-acetyl-L-cysteine ethyl ester (NACET) have been developed and optimized. NACET is a potential drug and antioxidant with advantageous pharmacokinetics. The methods involve the reduction of Cu(II) in its complexes with neocuproine (NCN), bicinchoninic acid (BCA), and bathocuproine disulfonic acid (BCS) to the corresponding chromophoric Cu(I) complexes by the analyte. The absorbance of the Cu(I) complexes with NCN, BCA, and BCS was measured at their maximum absorbance wavelengths of 458, 562, and 483 nm, respectively. The sensing manifold parameters and experimental conditions were optimized for each of the Cu(II) complexes used. Under optimal conditions, the corresponding linear calibration ranges, limits of detection, and sampling rates were 8.0 × 10⁻⁶–2.0 × 10⁻⁴ mol L−1, 5.5 × 10⁻⁶ mol L−1, and 60 h−1 for NCN; 6.0 × 10⁻⁶–1.0 × 10⁻⁴ mol L−1, 5.2 × 10⁻⁶ mol L−1, and 60 h−1 for BCA; and 4.0 × 10⁻⁶–1.0 × 10⁻⁴ mol L−1, 2.6 × 10⁻⁶ mol L−1, and 78 h−1 for BCS. The Cu(II)-BCS complex was found to be best performing in terms of sensitivity and sampling rate. Usual excipients in pharmaceutical preparations did not interfere with NACET analysis.

1. Introduction

N-acetyl-L-cysteine ethyl ester (NACET, Figure 1) is a lipophilic and charge-free congener of N-acetyl-L-cysteine (NAC, Figure 1) with improved pharmacological properties, e.g., antioxidant properties in reducing oxidative stress. The esterification of the carboxyl group of NAC increases its lipophilicity, thus improving its pharmacokinetics. NACET has the potential to substitute NAC as a mucolytic agent but also as an antioxidant, a source of glutathione (GSH), and a paracetamol antidote [1,2].
It has been reported recently that NAC does not act as a GSH enhancer in human endothelial cells in a dose-dependent manner; furthermore, treatment with NACET has an evident ceiling effect [3]. The levels reached by intracellular GSH after treatments with NACET resulted in a balance between the induction of its synthesis (by increased cysteine) and enzyme inhibition (by increased intracellular NAC) [3]. These findings show that NACET is a promising potential drug, and there is a clear need for fast and reliable online methods for its determination in pharmaceutical formulations as part of the quality control step of the corresponding manufacturing processes. However, there are only a few published methods for its determination. These methods include high-performance liquid chromatography (HPLC) [4], kinetic spectrophotometry [5], and flow injection analysis (FIA) with spectrophotometric detection [6], with only the last method allowing online NACET determination. Both spectrophotometric methods mentioned above are based on the reduction of Cu(II) complexes with neocuproine (NCN), bicinchoninic acid (BCA), or bathocuproine disulfonic acid (BCS) (Figure 1) to the corresponding Cu(I)-ligand complexes.
These redox reactions (Equations (1)–(3)) are fast, proceed in a broad pH range, and provide stable signals [5] and, therefore, are suitable for the online spectrophotometric determination of NACET:
2RSH + 2[Cu(NCN)2]2+ ⇄ RSSR + 2[Cu(NCN)2]+ + 2H+
2RSH + 2[Cu(BCA)2]22− ⇄ RSSR + 2[Cu(BCA)2]3− + 2H+
2RSH + 2[Cu(BCS)2]22− ⇄ RSSR + 2[Cu(BCS)2]3− + 2H+
where RSH represents NACET (a thiol compound).
Flow injection analysis (FIA) procedures allow automatic chemical analysis and significantly reduce sample volumes compared to batch methods. They have been used extensively in pharmaceutical analysis [7,8,9,10,11,12]. However, these procedures usually require relatively large volumes of reagents, which continuously flow through the corresponding manifolds, thus leading to waste generation and high cost of analysis, especially when expensive reagents are used. To overcome these limitations of FIA, Ruzicka and Marshall introduced sequential injection analysis (SIA) in 1990 as an alternative flow-through sample-handling and sensing technique which is economical with respect to both sample and reagent consumption in addition to allowing computer control of most manifold and operational parameters [13]. This flow technique has been successfully applied to the analysis of analytes of pharmaceutical interest [14,15,16,17]. Since the reagents for the spectrophotometric determination of NACET mentioned above (i.e., NCN, BCA, and BCS) are expensive (e.g., €146 per gram of BCS, Sigma-Aldrich, Burlington, MA, USA), SIA is expected to reduce significantly the cost of analysis compared to FIA. Therefore, this study aims to develop SIA methods with optical sensing for the determination of NACET based on the use of the color redox reactions involving the Cu(II) complexes with NCN, BCA, and BCS (Equations (1)–(3)) which will be applicable to the online determination of NACET as part of the quality control step of the manufacturing of its future pharmaceutical preparations. Since such pharmaceutical preparations are still not in production, the utility of the newly developed SIA methods was assessed on the basis of interferences of common excipients that might be present in future NACET pharmaceutical formulations.

2. Materials and Methods

2.1. Solution Preparation
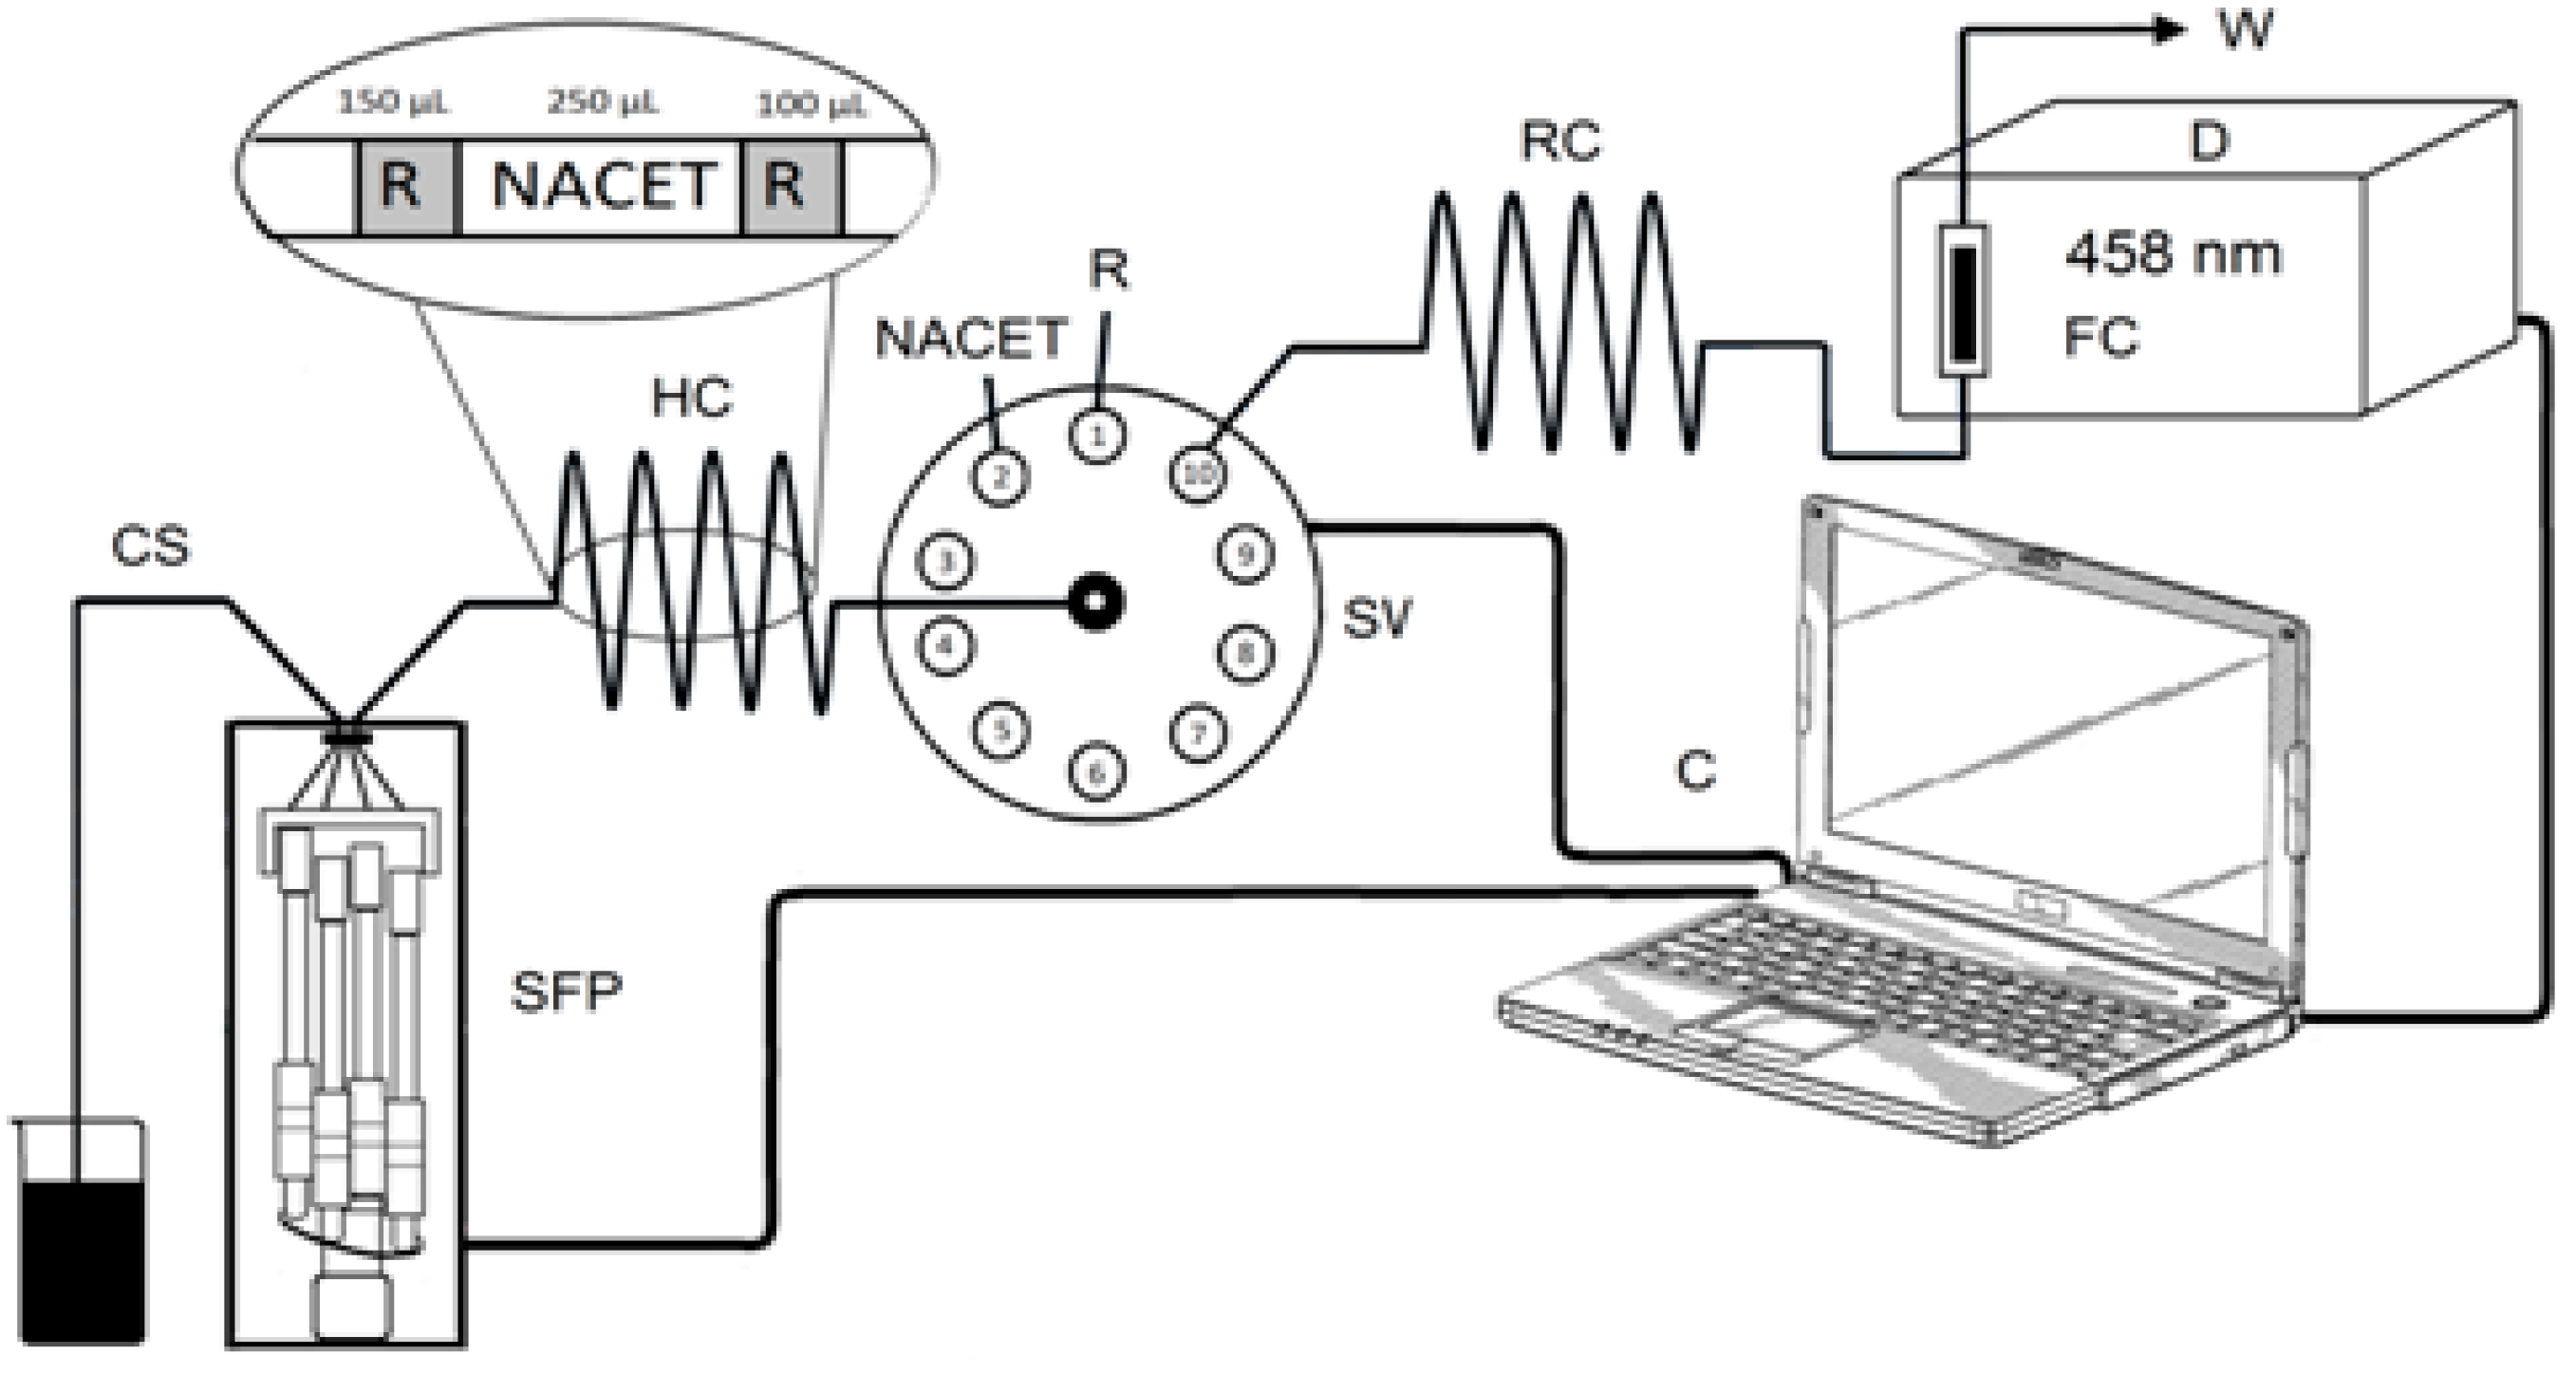
All chemicals were of analytical-reagent grade, and all the solutions were made in Milli-Q (Millipore, Burlington, VT, USA, resistance > 18 MΩ) deionized water.
The NACET (C7H13NO3S, MW 191.2, mp 44.1–44.5 °C) synthetic procedure, compound purification, and characterization by mass and infrared spectrometry, 1HNMR, and polarimetry were reported by Tsikas et al. [18].
A 1.0 × 10⁻² mol L−1 stock solution of NACET was prepared by dissolving 191.2 mg of NACET in a 100 mL Britton–Robinson buffer solution (pH = 2). The stock solution was found to be stable for one month when kept at 4 °C in a refrigerator. Working standard solutions were freshly prepared by appropriate dilution of the stock solution with different buffer solutions (Britton–Robinson buffer, phosphate buffer, and acetate buffer), the preparation of which is described elsewhere [5]. The desired pH of each working solution was adjusted by adding 2.0 mol L−1 sodium hydroxide solution.
A stock solution of 1.0 × 10⁻² mol L−1 of Cu(II) was prepared by dissolving 0.1248 g of CuSO4.5H2O in 50.0 mL deionized water.
Cu(II)-NCN reagent was prepared by dissolving 25.0 mg of CuSO4.5H2O and 50.0 mg of NCN in 250 mL of Britton–Robinson buffer solution (pH = 5).
A stock solution of BCA (4.0 × 10⁻³ mol L−1) was prepared by dissolving 77.6 mg of BCA disodium salt in 50 mL phosphate buffer solution (pH = 7). This solution (20 mL) was mixed with 4 mL of 1.0 × 10⁻² mol L−1 Cu(II) stock solution and diluted with phosphate buffer solution (pH 7) to 100 mL to obtain the Cu(II)-BCA reagent solution containing 4.0 × 10⁻⁴ mol L−1 Cu(II) and 8.0 × 10⁻⁴ mol L−1 BCA.
A BCS stock solution (2.0 × 10⁻³ mol L−1) was prepared by dissolving 58.2 mg of BCS disodium salt in 50.0 mL of deionized water. The Cu(II)-BCS reagent solution (100 mL) containing 4.0 × 10⁻⁴ mol L−1 Cu(II) and 8.0 × 10⁻⁴ mol L−1 BCS was prepared by mixing 4 mL of 1.0 × 10⁻² mol L−1 Cu(II) stock solution, 40 mL 2.0 × 10⁻³ mol L−1 BCS stock solution, and 56 mL of acetate buffer solution (pH = 5).
Solutions for the interference studies (0.2 mol L−1) which contained common ions (K+, Na+, NO3 and SO42−) and excipients in pharmaceutical preparations were prepared in deionized water by dissolving KNO3, Na2SO4, D-(+)-glucose, D-(−)-fructose, lactose, citric acid, L-(+)-tartaric acid, and boric acid, all purchased from Kemika (Zagreb, Croatia). The appropriate volumes of these solutions were added to appropriately buffered 4.0 × 10⁻⁵ mol L−1 NACET solutions to form final molar ratios of NACET: interferent of 1:5, 1:10, 1:50, 1:100, 1:250, and 1:500.

2.2. Apparatus

The SIA manifold (Figure 2) incorporated a syringe-free stepper-motor-driven pump (Cheminert® M50) linked to a programmable microstepping driver (Micro Lynx 4, Intelligent Motion Systems, Marlborough, MA, USA) and a 10-port selection valve (C25-3180EMH) with a multi-position actuator control module (EMHCA-CE), all purchased from VICI Valco Instruments (Houston, TX, USA) and controlled using M6-LHS software (Version 1.0.5e, VICI Valco Instruments). The absorbance of the Cu(I) complexes with NCN, BCA, and BCS was measured at 458, 562, and 483 nm, respectively, using a double-beam UV/Vis spectrophotometer equipped with a 1 cm flow-through cell of 80 μL volume (UV-1601, Shimadzu, Kyoto, Japan). The output signals with a data acquisition frequency of 1 Hz were recorded by interfacing the spectrophotometer with a computer running UVProbe software (Version 2.31, Shimadzu). The holding coil (HC, 120.0 cm) and the reaction coil (RC, 30.0 cm), as well as the rest of the manifold tubing (0.8 mm id), were made of polytetrafluoroethylene.

2.3. Analytical Procedure

Prior to each measurement, the holding and reaction coils were filled with carrier solution (deionized H2O) by selecting port 10 of the selection valve. A stable baseline was achieved by dispensing 3000 μL of carrier solution.
The optimized analytical steps for the determination of NACET with the newly developed SIA manifold are summarized in Table 1. A “sandwich” aspiration sequence was used, which involved aspiration of the sample/standard between two zones of the reagent. This configuration resembled the flow configuration in a FIA manifold developed previously by us [7].
The syringe-free pump sequentially loaded 150 µL of reagent, 250 µL of sample/standard, and an additional 100 µL of reagent into the holding coil (HC) at a flow rate of 3000 µL min−1, where they merged into a reaction zone.
By reversing the flow, the reaction zone was propelled through the reaction coil (RC) towards the spectrophotometric flow cell (FC) at the same flow rate of 3000 µL min−1. The passage of the colored product through the FC resulted in a transient absorbance peak, the height of which was the analytical signal, which was proportional to the concentration of NACET in the sample/standard. All measurements were performed in triplicate.

2.4. Optimization of the Design and Operational Parameters

The most important design and operational parameters were optimized using a univariate approach, and the corresponding initial values, optimal values, and studied ranges are summarized in Table 2, where the parameters optimized are listed in the order in which optimization was carried out. The NACET concentration in the optimization experiments was 4.0 × 10⁻⁵ mol L−1. The NACET concentration range of 1.0 × 10⁻⁵–1.0 × 10⁻⁴ mol L−1 corresponded to an absorbance range of up to 0.8 a.u. and, therefore, this range was considered to be optimal for reliable analysis.

3. Results and Discussion

In the color reactions used in this study (Equations (1)–(3)), NACET reduced the NCN, BCA, and BCS complexes with Cu(II) to the corresponding Cu(I) colored complexes with absorption maxima at 458 nm, 562, nm and 483 nm, respectively [6]. The optimal pH conditions for conducting these redox reactions were determined in a previous study [5] as 5.0, 7.0, and 5.0, respectively. Therefore, all three Cu(II)-ligand reagents were adjusted to their corresponding optimal pH values.

3.1. Method Optimization
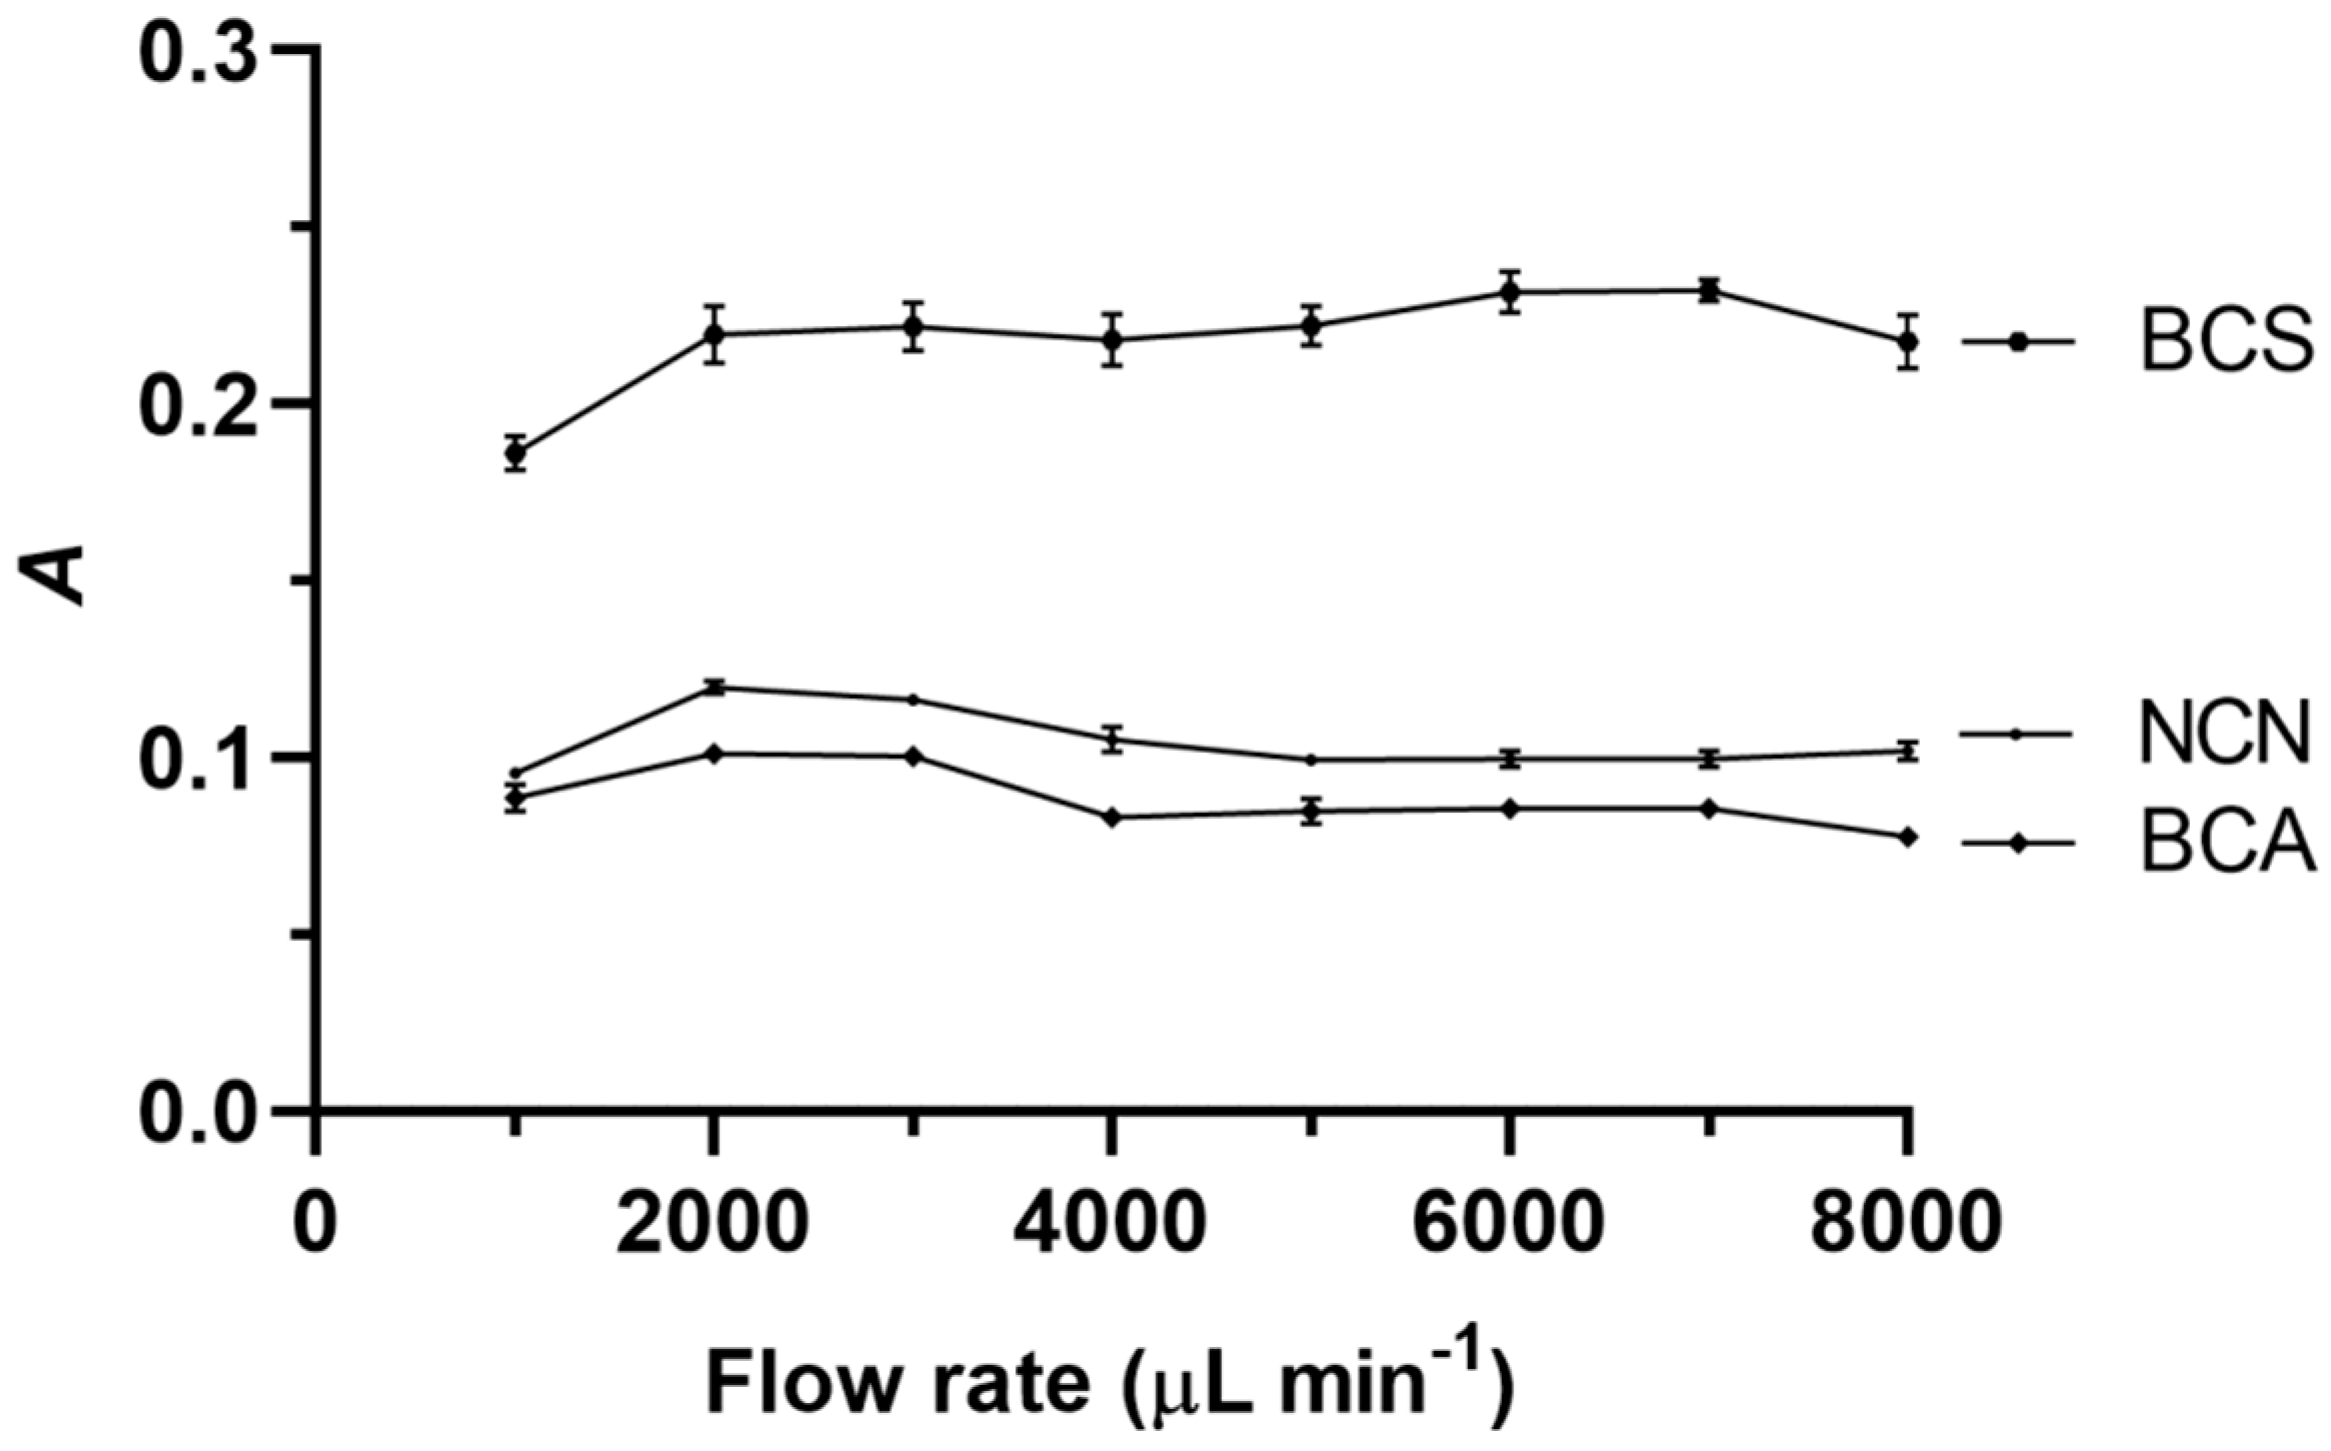
The optimization of all parameters was conducted with respect to the analytical signal (A), which was the absorbance peak maximum.

3.1.1. Flow Rate

The carrier stream flow rate for both aspiration of the standards and reagents and the propelling of the corresponding zones from the holding coil to the detector were maintained the same, and their effect on the analytical signal is illustrated in Figure 3. The flow rate effect for all three reagents was not significant. This can be explained by the mass transfer and kinetic effects, which influence the flow rate effect differently. The analytical signal should increase with the flow rate in the absence of a chemical reaction. However, if a chemical reaction is involved, an increase in the flow rate will reduce the amount of detectable product generated. Therefore, the results presented in Figure 3 suggest that these two processes balanced each other. The optimal flow rate values in the cases of both NCN and BCA were found to be the same, i.e., 3000 μL min−1, while the optimal value when BCS was used was determined as 6000 μL min−1.

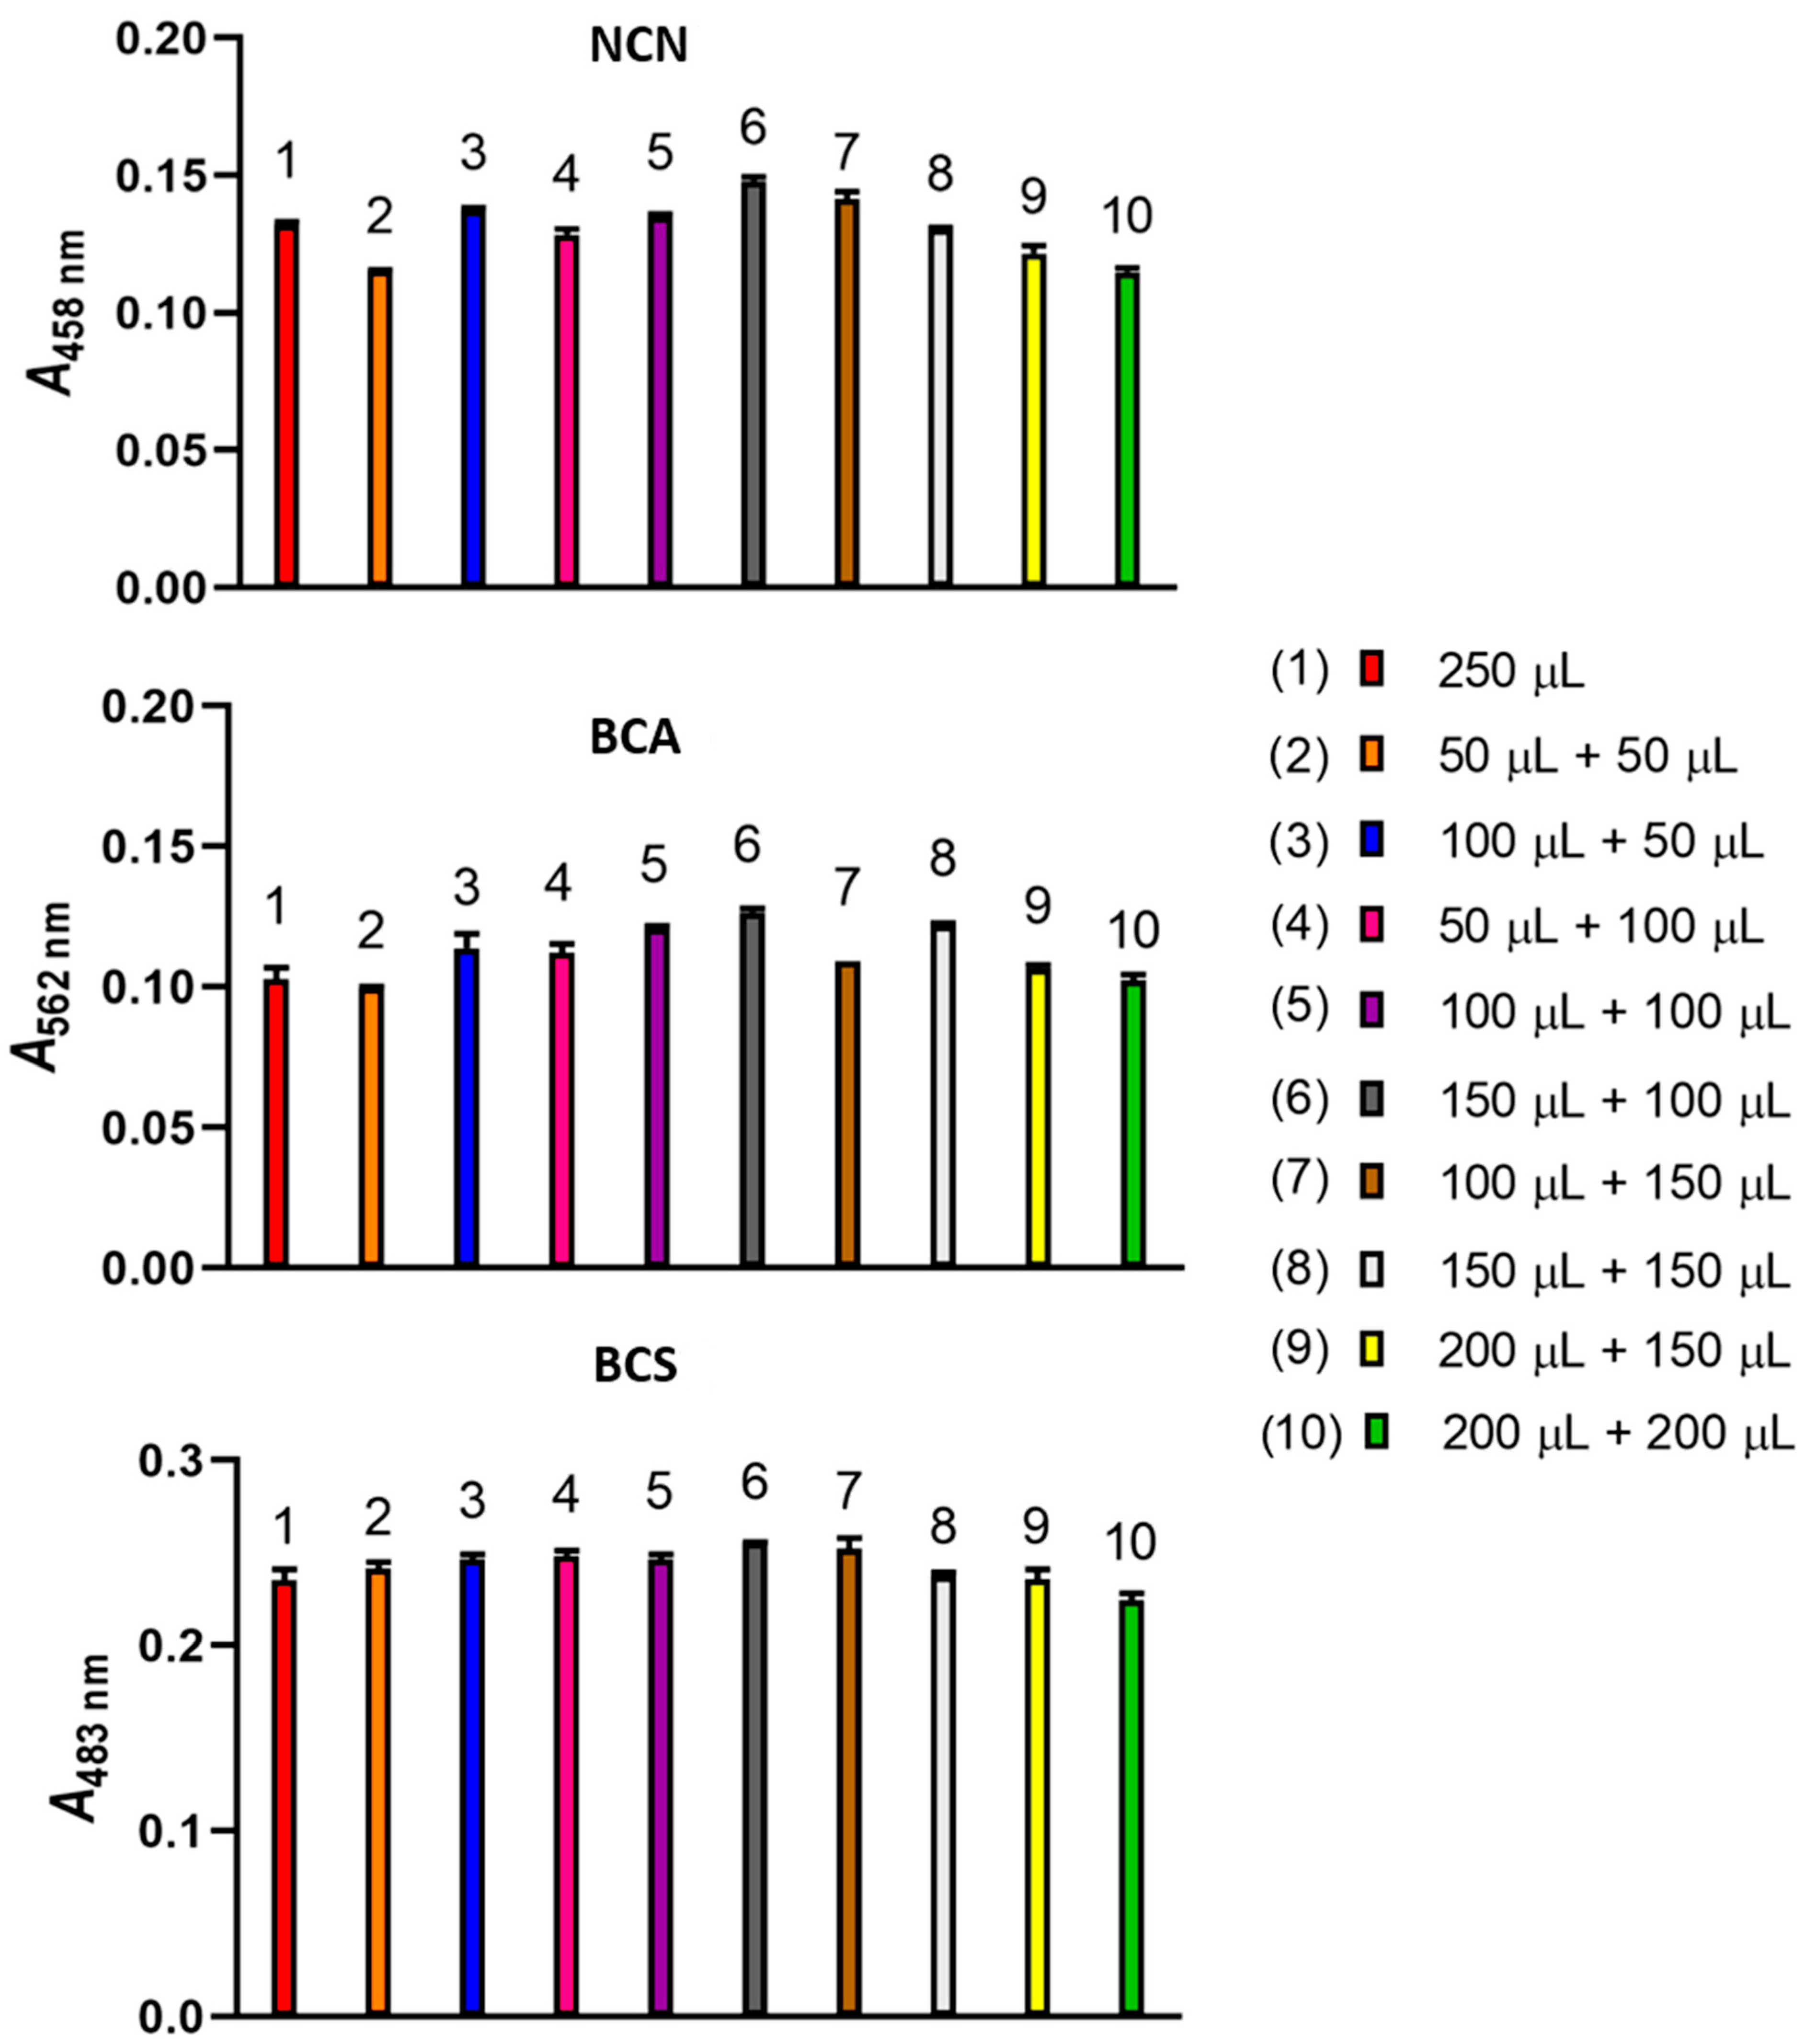
3.1.2. Aspiration Sequence and Reagent Volume

Initially, two different aspiration sequences of a NACET standard and Cu(II)-NCN reagent solutions, both 250 μL, were compared, i.e., 250 μL Cu(II)-NCN reagent solution followed by 250 μL NACET standard solution and 250 μL NACET standard solution followed by 250 μL Cu(II)-NCN reagent solution. The latter sequence produced a 10% increase in the analytical signal. Then, the analytical signals produced by a number of aspiration sequences involving sandwiching the NACET standard zone between two Cu(II)-NCN reagent zones were compared (Figure 4). The highest analytical signal was obtained in the aspiration sequence 150 μL Cu(II)-NCN reagent solution—250 μL NACET standard solution—100 μL Cu(II)-NCN reagent solution. Similar results were obtained when the Cu(II)-BCA and Cu(II)-BCS reagents were used (Figure 4). Therefore, this aspiration sequence was used in the subsequent experiments for all three reagents.

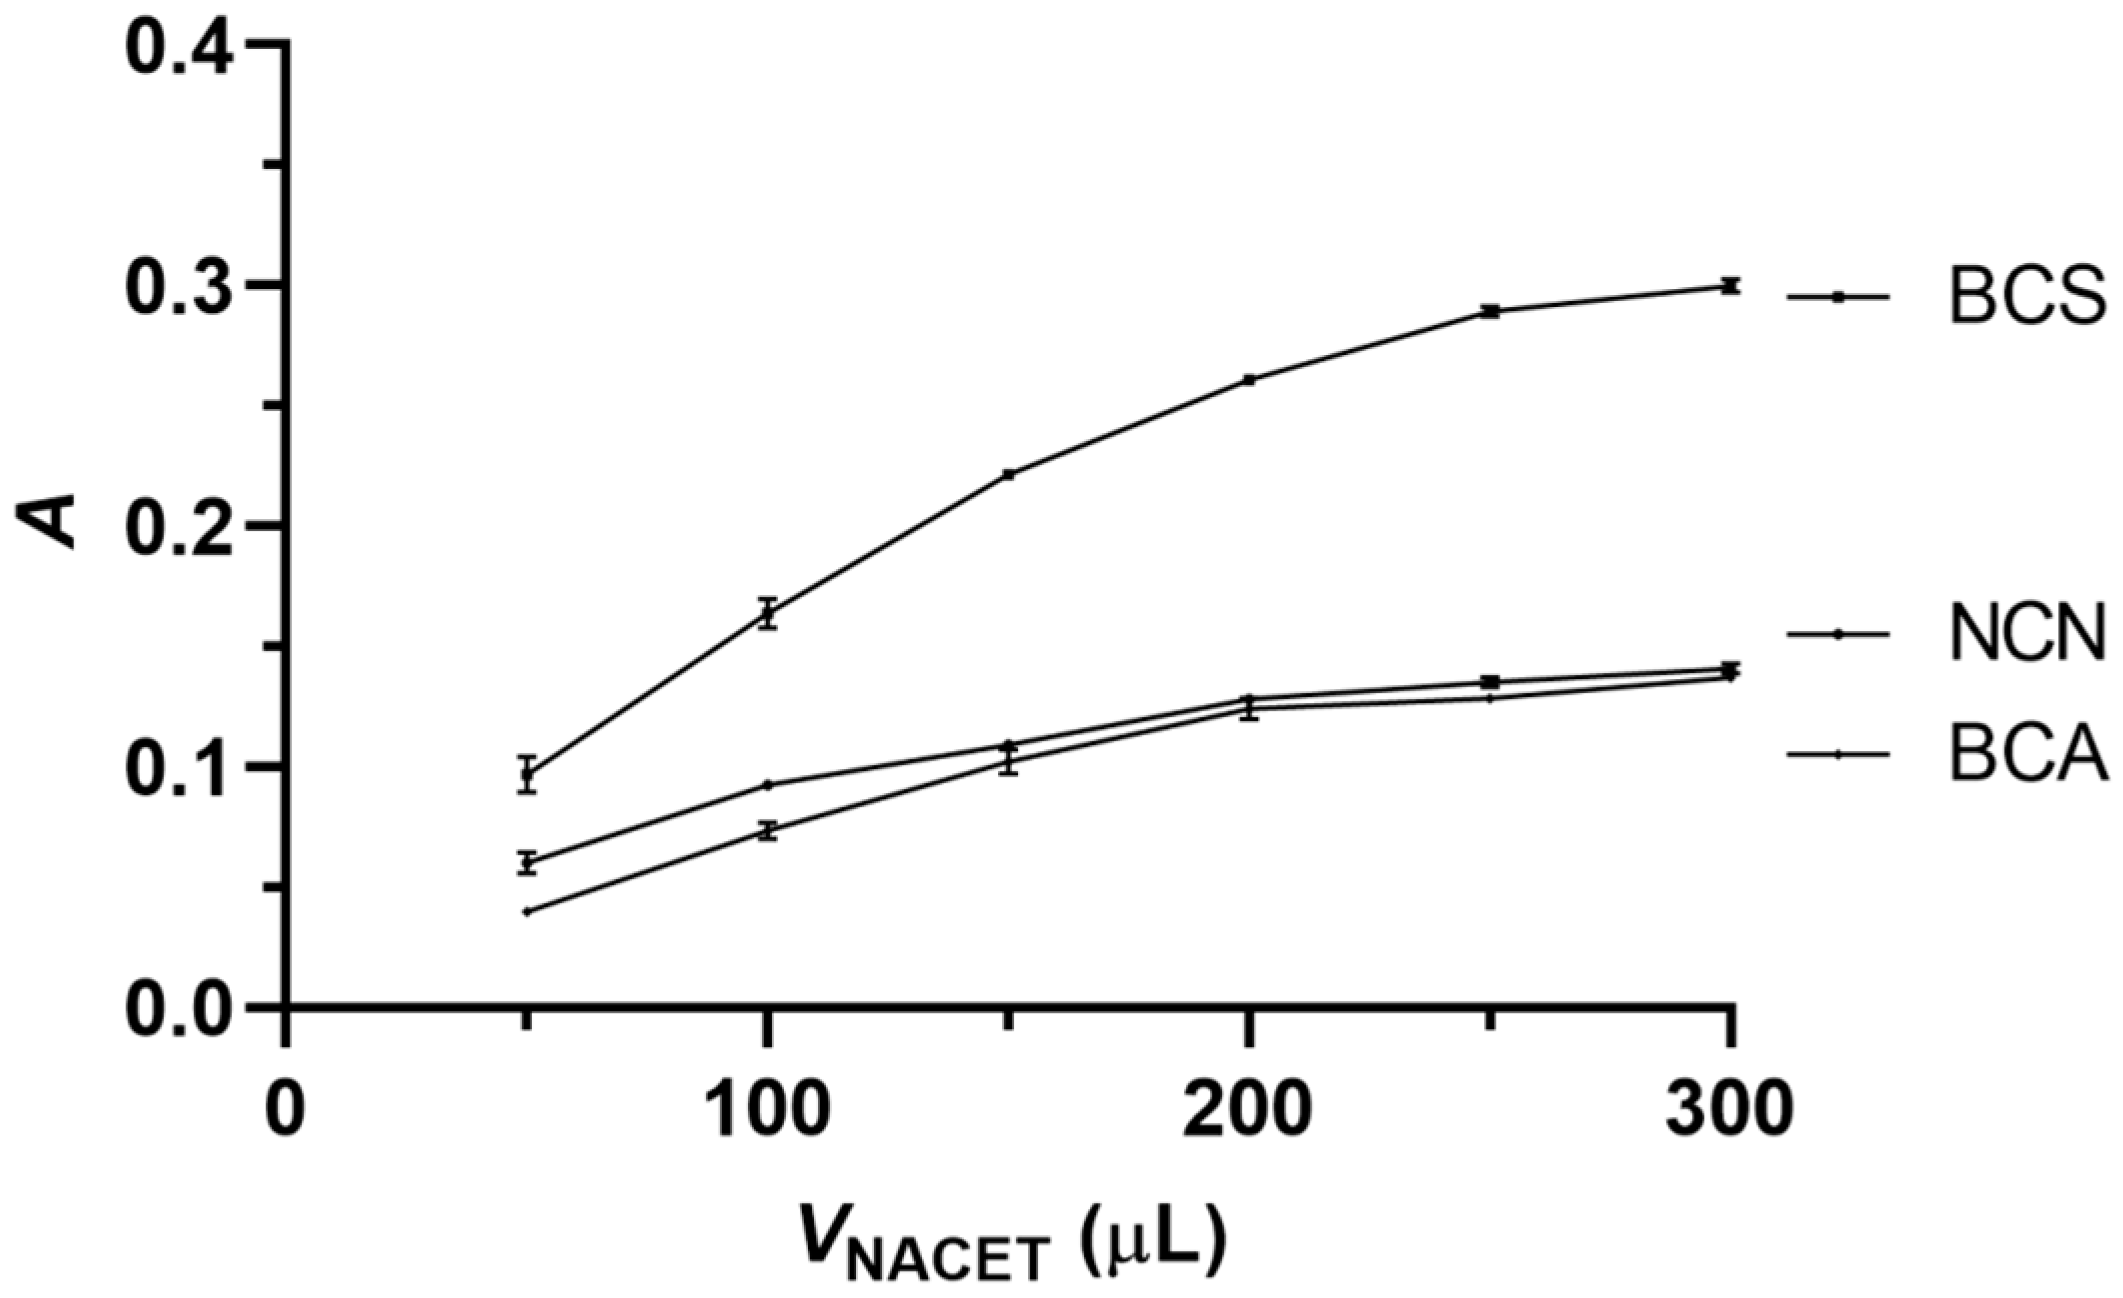
3.1.3. Sample Volume and Holding Coil Length

Figure 5 shows the effect of the NACET standard volume on the analytical signal. In the cases of all three reagents, the analytical signal increased initially with the volume of the NACET standard and then leveled off at 250 μL, which value was selected as the optimal sample/standard volume for all three reagents.
The effect of holding coils (Figure 2) of two different volumes (500 and 1000 μL) on the analytical signal was studied with all three reagents. There was no statistically significant difference in the results for these two volumes, and therefore, the shorter holding coil (i.e., 500 μL) was used in the subsequent experiments for all three reagents.

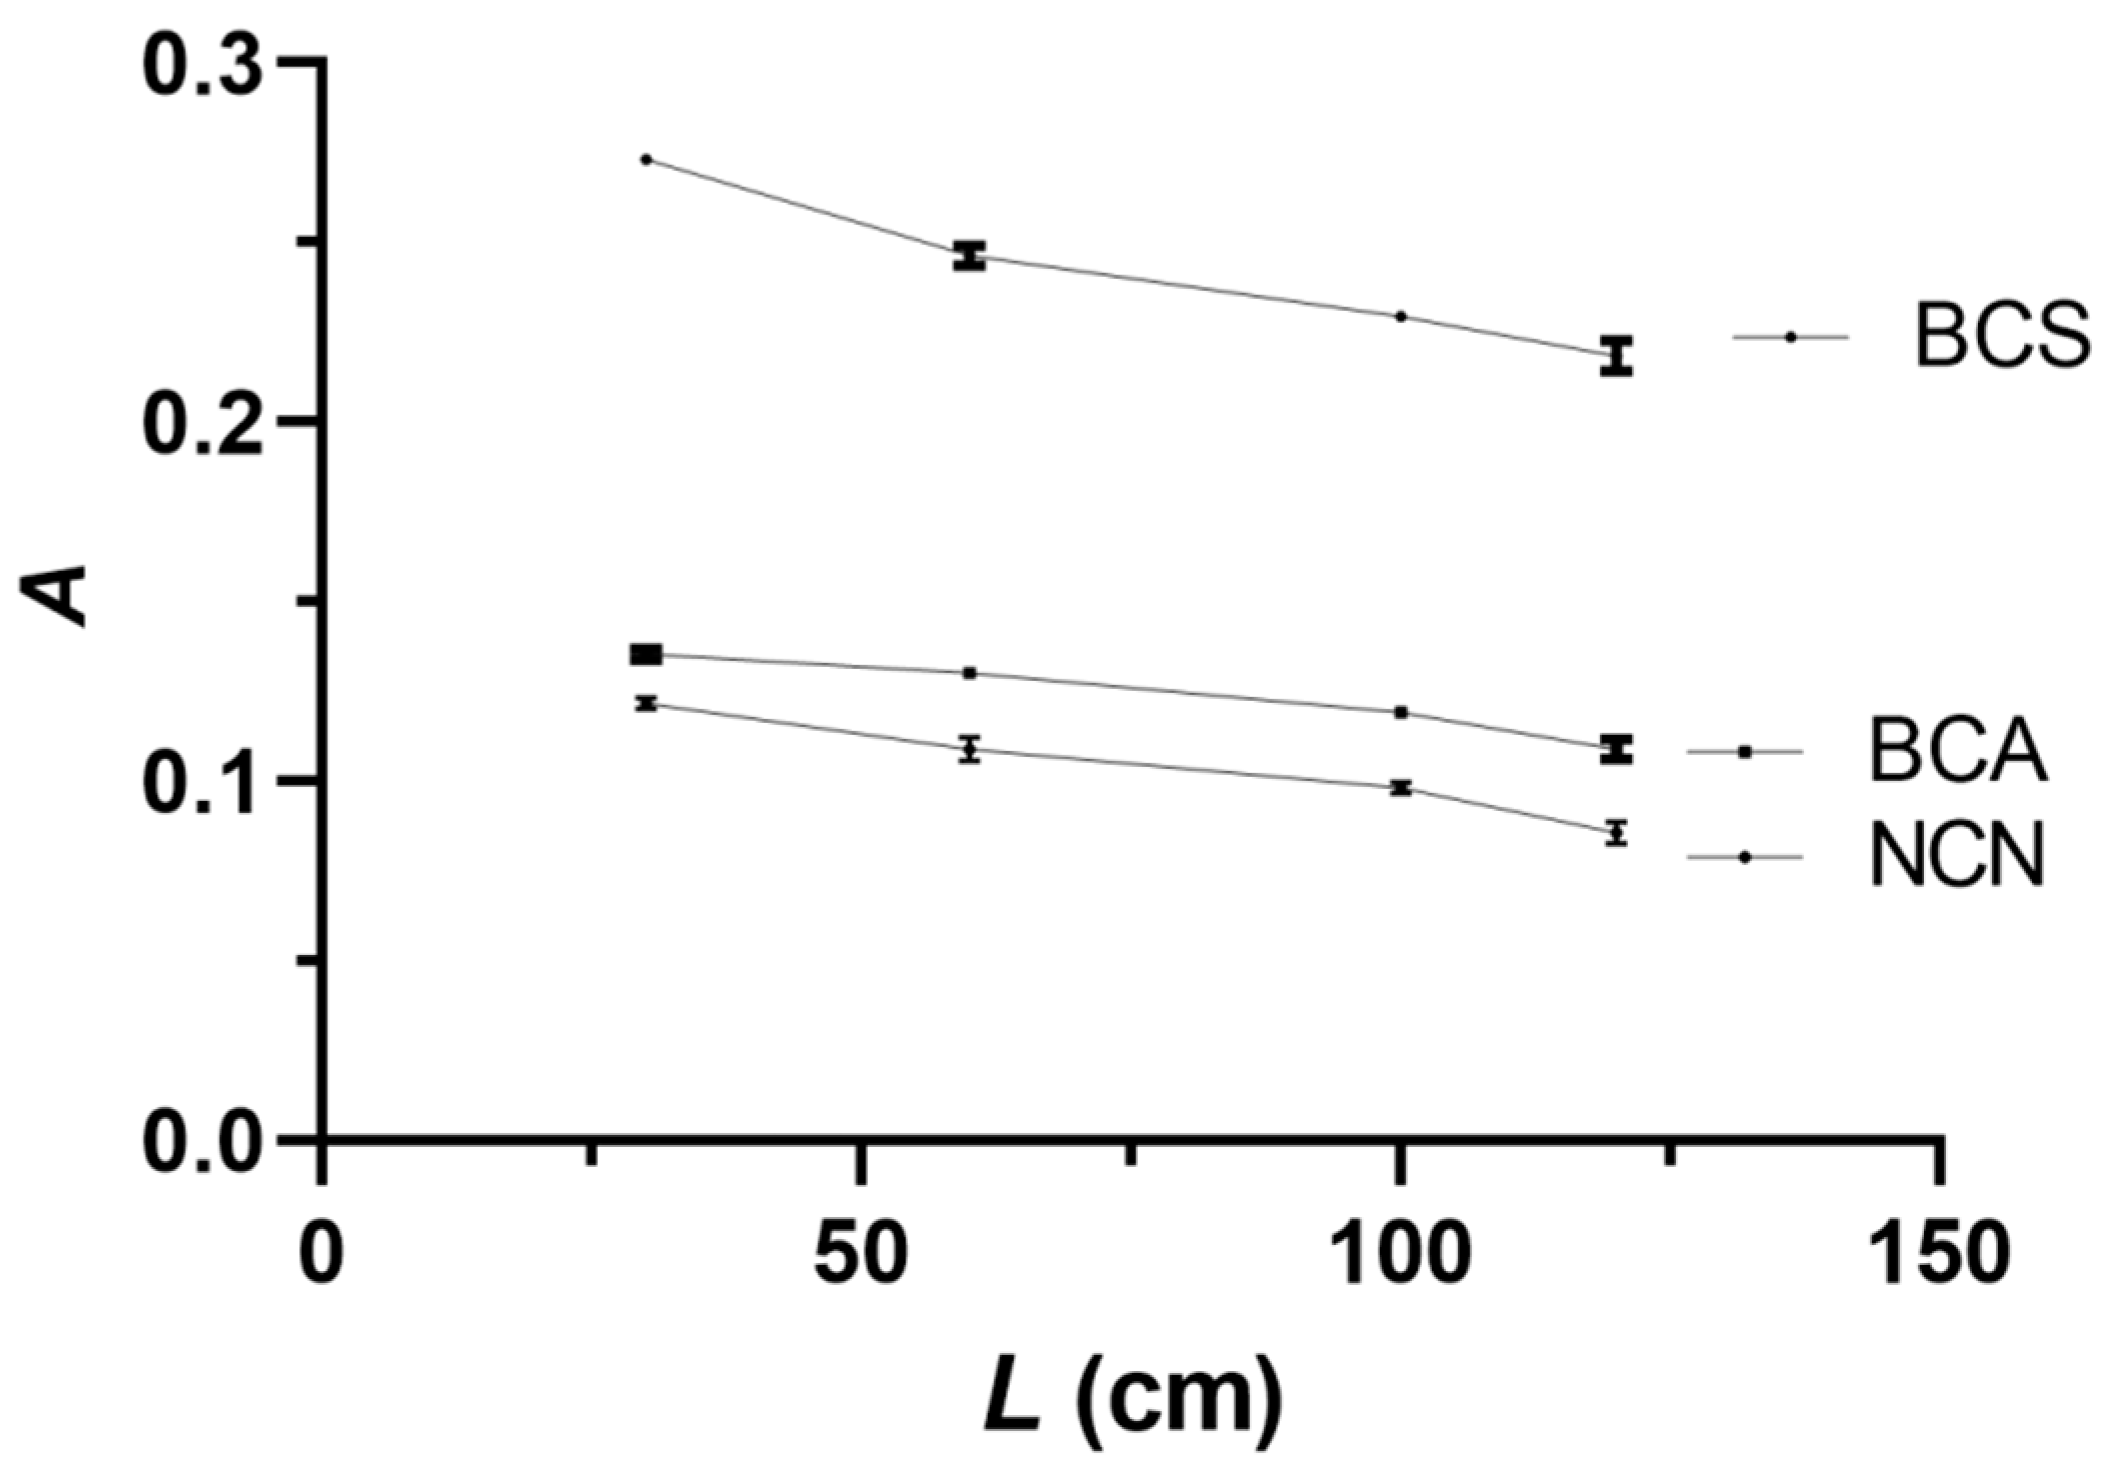
3.1.4. Reaction Coil

The influence of the reaction coil length (L) on the analytical signal was investigated in the range of 30–150 cm. Shorter than 30 cm reaction coils could not be used because of spatial constraints. The results, shown in Figure 6, indicate that for all three reagents, the highest analytical signal values were obtained with the shortest possible reaction coil of 30 cm, and this reaction coil value was selected as optimal.

3.1.5. Reagent Concentration

Calibration curves for the NACET were obtained by the method of Miller and Miller [19] for all three reagents by varying their concentrations in the range 1.0 × 10⁻⁴–1.0 × 10⁻³ mol L−1 in the cases of Cu(II)-NCN and Cu(II)-BCS. Due to its low water solubility, the effect of the Cu(II)-BCA reagent was studied only in the range 1.0 × 10⁻⁴–4.0 × 10⁻⁴ mol L−1. It was observed that for NACET concentrations lower than 8.0 × 10⁻⁶ mol L−1 in the case of Cu(II)-NCN, 6.0 × 10⁻⁶ mol L−1 in the case of Cu(II)-BCA and 4.0 × 10⁻⁶ mol L−1 in the case of Cu(II)-BCS the absorbance peaks were distorted (i.e., mostly double-humped peaks were obtained) and therefore results for lower NACET concentrations were not used in the calibration process. In all three cases, the calibration curve slope initially increased with the reagent concentration and started leveling off at 4.0 × 10⁻⁴ mol L−1, and this value was selected as the optimal reagent concentration for all three reagents.

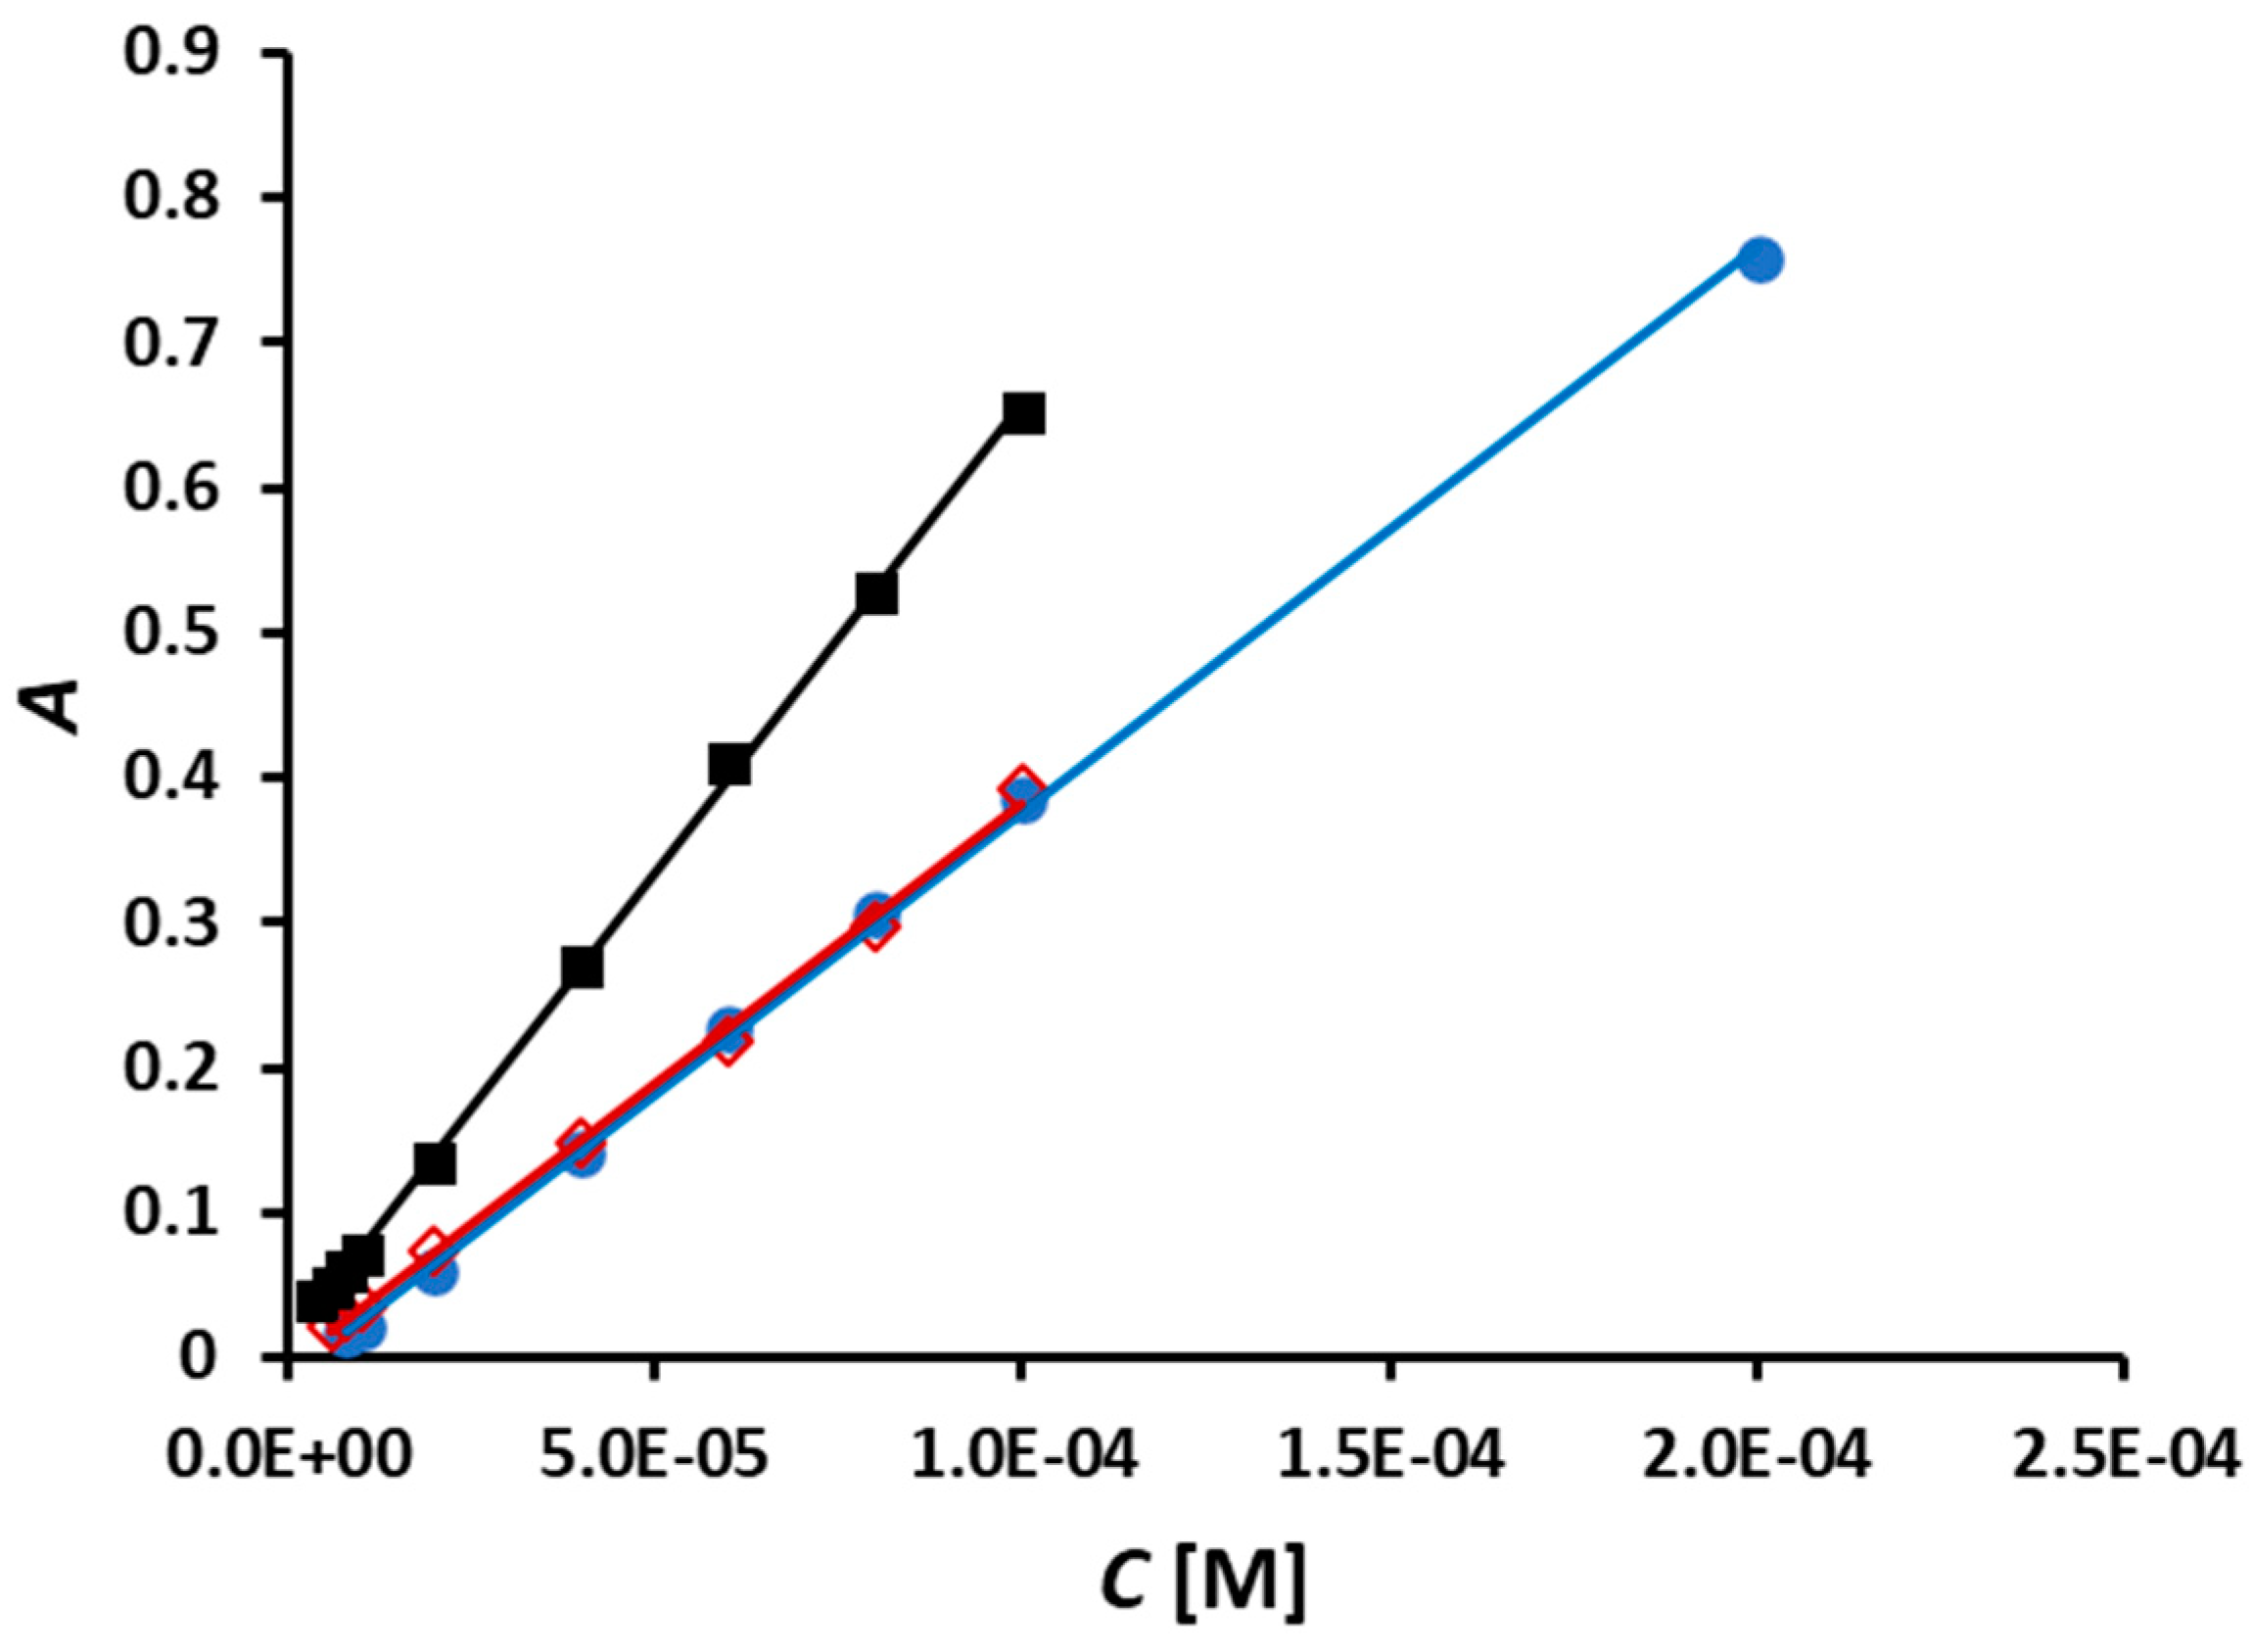
3.2. Analytical Figures of Merit

The methods involving the use of NCN-, BCA-, and BCS-based Cu(II) reagents were calibrated under optimal conditions (Figure 7).
The analytical figures of merit of these methods are listed in Table 3. As mentioned above, very low NACET concentrations and calibration blanks produced distorted peaks in the cases of all three reagents and, therefore, were not used in constructing the corresponding three calibration curves. For this reason, the limit of detection (LOD) values were calculated by the method of Miller and Miller [19], based on regression statistics, instead of using the conventional method based on the standard deviation of calibration blanks or the baseline. The slopes of the three calibration curves (Figure 7, Table 3) are consistent with the molar absorptivity values of the corresponding Cu(I) complexes (i.e., 7.9 × 10³ L mol−1 cm−1 for Cu(I)-NCN [20], 7.7 × 10³ L mol−1 cm−1 for Cu(I)-BCA [21], and 1.3 × 10⁴ L mol−1 cm−1 for Cu(I)-BCS [20]). The sampling rate at the optimal carrier stream flow rate (Table 2) was found to be 60 h−1 in the cases of the Cu(II)-NCN and Cu(II)-BCA reagents and 78 h−1 in the case of the Cu(II)-BCS reagent.
The LOD values calculated by the method of Miller and Miller [19] are generally higher than values calculated on the basis of the standard deviation of calibration blanks or the baseline. Therefore, while the RSD and sampling rate values of the newly developed SIA method were similar to those of the only other NACET method online (i.e., the FIA method [6]), the LOD values were approximately an order of magnitude higher. However, when the FIA data were processed by the method of Miller and Miller, the LOD values (i.e., 3.4 × 10⁻⁶, 2.9 × 10⁻⁶, and 2.9 × 10⁻⁶ mol L−1 for the methods based on the use of Cu(II)-NCN, Cu(II)-BCA, and Cu(II)-BCS, respectively) were found to be very similar to those of the SIA methods (Table 3). It should also be pointed out that the newly developed SIA method is expected to be used as a quality control tool in the manufacturing of NACET-based pharmaceutical preparations where very high sensitivity will not be required. An important advantage with respect to the SIA method is the fact that NACET analysis is approximately three times cheaper than analysis conducted by its FIA counterpart.

3.3. Interferences

The interference effect of common inorganic ions, included in KNO3 and Na2SO4, and common excipients, which can potentially be included in the pharmaceutical preparations incorporating NACET, was studied. The interferents were present in molar excesses of 5, 10, 50, 100, 250, and 500. Table 4 includes the highest NACET-to-interferent molar ratios where the absolute error in the determination of NACET was lower than 5%.
The results in Table 4 show that sugar excipients did not interfere up to 500 times molar excess. Similar results were obtained for boric acid, KNO3, and Na2SO4. As expected, interferences, consistent with the stability of the Cu(II) complexes with NCN (logβ2 = 11.7 [22]), BCA (logβ2 = 8.9 [23]) and BCS (logβ2 = 12.4 [24] where β2 is the overall stability constant) (Equations (1)–(3)) were observed with compounds capable of forming complexes with Cu(II), i.e., citric and tartaric acids. However, it should be pointed out that these interferences were negligible in the case of BCS.

4. Conclusions

Three SIA methods for the online determination of NACET utilizing the color reagents Cu(II)-NCN, Cu(II)-BCA, or Cu(II)-BCS were developed, optimized, and studied for possible interferences by common excipients. The LODs for these reagents were determined as 5.5 × 10⁻⁶, 5.2 × 10⁻⁶, and 2.6 × 10⁻⁶ mol L−1, respectively, while the corresponding sampling rates were 60, 60, and 78 h−1. On the basis of the results obtained, it was concluded that the method using the Cu(II)-BCS reagent provided the highest sensitivity and sampling rate. In addition, this method was practically immune to interferences by common excipients, expected to be present in future NACET pharmaceutical preparations. In comparison with the only other flow analysis method for NACET, which is based on flow injection analysis principles, the newly developed SIA method is significantly more economical with respect to reagent consumption, thus reducing the cost of analysis without compromising on sensitivity. It can be expected that the newly developed SIA methods, especially the one based on the use of the Cu(II)-BCS reagent, will play an important role in the quality control step of the manufacturing of NACET pharmaceutical preparations in the future.

Author Contributions

Conceptualization, L.K.-M. and T.K.; methodology, L.K.-M. and T.K.; validation, L.K.-M. and T.K.; formal analysis, L.K.-M., T.K. and S.D.K.; investigation, T.K.; resources, L.K.-M., T.G.S. and D.T.; data curation, L.K.-M., T.K. and S.D.K.; writing—original draft preparation, T.K.; writing—review and editing, L.K.-M., T.K., S.D.K., T.G.S. and D.T.; visualization, T.K.; supervision, L.K.-M.; project administration, L.K.-M.; funding acquisition, L.K.-M. and T.G.S. All authors have read and agreed to the published version of the manuscript.

Funding

This study has been financed by the European Union-NextGenerationEU through the National Recovery and Resilience Plan of the Republic of Bulgaria, Project No. BG-RRP-2.004-0008, and the Ministry of Science and Education of the Republic of Croatia.

Institutional Review Board Statement

Not applicable.

Informed Consent Statement

Not applicable.

Data Availability Statement

Data will be provided upon request.

Conflicts of Interest

The authors declare no conflicts of interest.

References

  1. Tsikas, D.; Schwedhelm, K.S.; Surdacki, A.; Giustarini, D.; Rossi, R.; Kukoc-Modun, L.; Kedia, G.; Ückert, S. S-Nitroso-N-acetyl-L-cysteine ethyl ester (SNACET) and N-acetyl-L-cysteine ethyl ester (NACET)–Cysteine-based drug candidates with unique pharmacological profiles for oral use as NO, H2S and GSH suppliers and as antioxidants: Results and overview. J. Pharm. Anal. 2018, 8, 1–9. [Google Scholar] [CrossRef] [PubMed]
  2. Tosi, G.M.; Giustarini, D.; Franci, L.; Minetti, A.; Imperatore, F.; Caldi, E.; Fiorenzani, P.; Aloisi, A.M.; Sparatore, A.; Rossi, R.; et al. Superior Properties of N-Acetylcysteine Ethyl Ester over N-Acetyl Cysteine to Prevent Retinal Pigment Epithelial Cells Oxidative Damage. Int. J. Mol. Sci. 2021, 22, 600. [Google Scholar] [CrossRef]
  3. Giustarini, D.; Galvagni, F.; Dalle Donne, I.; Milzani, A.; Severi, F.M.; Santucci, A.; Rossi, R. N-acetylcysteine ethyl ester as GSH enhancer in human primary endothelial cells: A comparative study with other drugs. Free Radic. Biol. Med. 2018, 126, 202–209. [Google Scholar] [CrossRef] [PubMed]
  4. Giustarini, D.; Milzani, A.; Dalle-Donne, I.; Tsikas, D.; Rossi, R. N-Acetylcysteine ethyl ester (NACET): A novel lipophilic cell-permeable cysteine derivative with an unusual pharmacokinetic feature and remarkable antioxidant potential. Biochem. Pharmacol. 2012, 84, 1522–1533. [Google Scholar] [CrossRef] [PubMed]
  5. Kukoc-Modun, L.; Tsikas, D.; Kraljević, T.; Biocic, M.; Radić, N. Kinetic Spectrophotometric Determination of N-Acetyl-L-cysteine Ethyl Ester (NACET) Generating Chromogenic Copper(I)Ln Complexes with Different Ligands. Croat. Chem. Acta 2017, 90, 263–271. [Google Scholar] [CrossRef]
  6. Kukoc-Modun, L.; Kraljević, T.; Tsikas, D.; Radić, N.; Modun, D. Determination of N-Acetyl-l-cysteine Ethyl Ester (NACET) by Flow Injection Analysis and Spectrophotometric Detection Using Different Thiol-Sensitive Ligands. Molecules 2021, 26, 6826. [Google Scholar] [CrossRef] [PubMed]
  7. Amir, R.; Hadi, H. Spectrophotometric Determination of Vitamin B1 in Dosage forms Using Drugs Compounds as Reagents by Normal and Reverse Flow Injection Methods. Curr. Pharm. Anal. 2022, 18, 218–227. [Google Scholar] [CrossRef]
  8. Khan, A.; Asghar, M.; Yaqoob, M. Determination of Nalbuphine Hydrochloride in Pharmaceutical Formulations Using Diperiodatoargentate(III)-Rhodamine-B Chemiluminescence System by Flow Injection Analysis. Anal. Sci. 2020, 36, 1223–1230. [Google Scholar] [CrossRef]
  9. Zhang, G.Q.; Li, Y.S.; Zhao, Y.; Luo, Y.X.; Gao, X.F. A rapid and automated flow injection spectrophotometric determination method for pioglitazone/metformin hydrochloride in pharmaceutical preparation and to confirmation of its reaction principle using PCX column. Microchem. J. 2020, 155, 104698. [Google Scholar] [CrossRef]
  10. Faria, L.V.; Lima, A.P.; Araújo, F.M.; Lisboa, T.P.; Matos, M.A.C.; Munoz, R.A.A.; Matos, R.C. High-throughput amperometric determination of tetracycline residues in milk and quality control of pharmaceutical formulations: Flow-injection versus batch-injection analysis. Anal. Methods 2019, 11, 5328–5336. [Google Scholar] [CrossRef]
  11. Al Samarrai, S.Y.; Abdoon, F.M.; Hashim, K.K. A simple method to determine tramadol using a coated-wire electrode as a detector in the flow injection analysis. Microchem. J. 2019, 146, 588–591. [Google Scholar] [CrossRef]
  12. Lima, A.B.; Ferreira, L.F.; Barbosa, S.L.; Gil, E.D.; da Silva, R.A.B.; dos Santos, W.T.P. Selective Determination of Verapamil in Pharmaceutics and Urine Using a Boron-doped Diamond Electrode Coupled to Flow Injection Analysis with Multiple-pulse Amperometric Detection. Electroanalysis 2018, 30, 1872–1877. [Google Scholar]
  13. Ruzicka, J.; Marshall, G.D. Sequential injection: A new concept for chemical sensors, process analysis and laboratory assays. Anal. Chim. Acta 1990, 237, 329–343. [Google Scholar] [CrossRef]
  14. Nesmerák, K.; Kroiherová, A.; Hranícek, J. Determination of chlorpromazine, levomepromazine, and promethazine by sequential injection analysis with VIS spectrometric or spectrofluorimetric detection. Monatshefte Fur Chem. 2022, 153, 781–787. [Google Scholar] [CrossRef]
  15. Oteef, M.D.Y.; Idris, A.M. Flow Injection Techniques for Tetracycline Quantification: A Review. Crit. Rev. Anal. Chem. 2023, 53, 396–414. [Google Scholar] [CrossRef] [PubMed]
  16. Zagatto, E.A.G.; Rocha, F.R.P. Large-scale flow analysis: From repetitive assays to expert analyzers. Talanta 2021, 233, 122479. [Google Scholar] [CrossRef]
  17. Cini, N.; Gölcü, A. Spectrophotometric Methodologies Applied for Determination of Pharmaceuticals. Curr. Anal. Chem. 2021, 17, 1141–1168. [Google Scholar] [CrossRef]
  18. Tsikas, D.; Dehnert, S.; Urban, K.; Surdacki, A.; Meyer, H.H. GC–MS analysis of S-nitrosothiols after conversion to S-nitroso-N-acetyl cysteine ethyl ester and in-injector nitrosation of ethyl acetate. J. Chromatogr. B 2009, 877, 3442–3455. [Google Scholar] [CrossRef]
  19. Miller, J.C.; Miller, J.N. Statistics and Chemometrics for Analytical Chemistry, 5th ed.; Pearson Education/Prentice Hall: Harlow, UK, 2005. [Google Scholar]
  20. Halko, R.; Prochazkova, S.; Okenicova, L.; Hutta, M.; Bozek, P. Determination of Copper in Human Urine by RP-LC After Pre-column Derivatization with Neocuproine and Use of Monolithic Column. Chromatographia 2014, 77, 1019–1025. [Google Scholar] [CrossRef]
  21. Brenner, A.J.; Harris, E.D. A Quantitative Test for Copper Using Bicinchoninic Acid. Anal. Biochem. 1995, 226, 80–84. [Google Scholar] [CrossRef]
  22. James, B.R.; Williams, R.J.P. 383. The oxidation–reduction potentials of some copper complexes. J. Chem. Soc. (Resumed) 1961, 2007–2019. [Google Scholar] [CrossRef]
  23. Chen, D.L.; Wang, X.Y.; He, Y.H.; Kai, T.H.; Li, Z.Q.; Xiang, J.; Jiang, D.L.; Zhou, F.M. Studies of Electrode Reactions and Coordination Geometries of Cu(I) and Cu(II) Complexes with Bicinchoninic Acid. Electroanalysis 2018, 30, 479–485. [Google Scholar] [CrossRef]
  24. Bagchi, P.; Morgan, M.T.; Bacsa, J.; Fahrni, C.J. Robust Affinity Standards for Cu(I) Biochemistry. J. Am. Chem. Soc. 2013, 135, 18549–18559. [Google Scholar] [CrossRef] [PubMed]
Figure 1. Structural formulas of N-acetyl-L-cysteine ethyl ester (NACET), N-acetyl-L-cysteine (NAC), neocuproine (NCN), bicinchoninic acid (BCA), and bathocuproine disulfonic acid (BCS).
Sensors 24 00312 g001
Figure 2. Schematic diagram of the SIA manifold: SFP–syringe-free pump (M50), SV—10-port selection valve, HC–holding coil, RC—reaction coil, CS—carrier stream (deionized H2O), R—reagent, NACET (N-acetyl-L-cysteine ethyl ester) solution, FC—flow cell, W—waste, C—computer. Inset: optimal aspiration sequence.
Sensors 24 00312 g002
Figure 3. Effect of the carrier stream flow rate on the analytical signal (A) when NCN, BCA, and BCS were used. Experimental conditions: aspiration sequence—reagent–standard; reagent volume—250 μL; sample (standard) volume—250 μL; holding coil volume—1000 μL; reaction coil length—70 cm; reagent concentration—4.0 × 10⁻⁴ mol L−1; and NACET concentration—4.0 × 10⁻⁵ mol L−1. Error bars are ± standard deviation (SD).
Sensors 24 00312 g003
Figure 4. Effect of the Cu(II)-NCN, Cu(II)-BCA, and Cu(II)-BCS reagent volumes and sequence of aspiration on the analytical signal. Experimental conditions, as in Figure 3, except for carrier flow rates of 3000, 3000, and 6000 μL min−1 when NCN, BCA, and BCS were used, respectively. Error bars are ±SD.
Sensors 24 00312 g004
Figure 5. Influence of the volume of the NACET standard on the analytical signal. Experimental conditions, as in Figure 4, except for the reagent volume of 250 μL and the aspiration sequence of 150 μL reagent solution—NACET standard solution—100 μL reagent solution. Error bars are ±SD.
Sensors 24 00312 g005
Figure 6. Effect of the reaction coil length (L) on the analytical signal. Experimental conditions as in Figure 5, except for NACET sample/standard volume of 250 μL. Error bars are ±SD.
Sensors 24 00312 g006
Figure 7. Calibration curves for the SIA determination of NACET obtained under optimal conditions (Table 2) with reagents Cu(II)-NCN (), Cu(II)-BCA (), and Cu(II)-BCS (■).
Sensors 24 00312 g007
Table 1. Optimized SIA procedure.
StepValve
Position
Operation Time (s) *Flow Rate
(μL min−1)
Volume (μL)Operation Description
1133000150Aspirating reagent to the holding coil
22–953000250Aspirating sample to the holding coil
3123000100Aspirating reagent to the holding coil
4NCN, BCA106030003000Propelling of the reaction mixture to the flow cell
4BCS103060003000
* Note: Volume and flow rate were assigned while the operation time was calculated.
Table 2. Initial values, studied ranges, and optimal values of the main design and operational parameters.
ParameterInitial ValuesStudied RangeOptimal Value
NCN MethodBCA MethodBCS Method
Carrier stream flow rate
(μL min−1)
1000–10,000 300030006000
Aspiration sequenceReagent–standard(1) Reagent–standard
(2) Standard–reagent
(3) Reagent–standard–reagent
333
Reagent volume (μL)25050–450250
(150 + 100)
250
(150 + 100)
250
(150 + 100)
Sample volume (μL)25050–450250250250
Holding coil volume (μL)1000500, 1000500500500
Reaction coil length (cm)7030–120 303030
Reagent concentration
(mol L−1)
4.0 × 10−41.0 × 10−4–1.0 × 10−34.0 × 10−44.0 × 10−44.0 × 10−4
Table 3. Analytical figures of merit.
Cu(II)-NCNCu(II)-BCACu(II)-BCS
Linear range (mol L−1)8 × 10⁻⁶–2 × 10−46 × 10−6 –1 × 10−44 × 10−6–1 × 10⁻⁴
Calibration equation
(A = aC + b)
a ± SD(3.893 ± 0.041) × 103(3.863 ± 0.070) × 103(6.477 ± 0.055) × 103
b ± SD(1.247 ± 0.369) × 10−2−(4.696 ± 3.689) × 10−2(9.562 ± 2.737) × 10−3
LOD (mol L−1)5.5 × 10-65.2 × 10−62.6 × 10⁻⁶
RSD at 8 × 10⁻⁶ and
4 × 10⁻⁵ mol L−1 (%)
1.6/1.71.2/2.50.7/0.9
Sampling rate (h−1)606078
Table 4. Interference effects in the methods for the determination of NACET using NCN, BCA, and BCS.
InterferentNACET *: Interferent
(Molar Ratio)
NCNBCABCS
Glucose 1:5001:5001:500
Fructose 1:5001:5001:500
Lactose1:5001:5001:500
Citric acid1:101:51:250
Tartaric acid 1:101:51:500
Boric acid1:5001:5001:500
Na2SO41:5001:5001:500
KNO31:5001:5001:500
* [NACET] = 4 × 10⁻⁵ mol L−1.
Disclaimer/Publisher’s Note: The statements, opinions and data contained in all publications are solely those of the individual author(s) and contributor(s) and not of MDPI and/or the editor(s). MDPI and/or the editor(s) disclaim responsibility for any injury to people or property resulting from any ideas, methods, instructions or products referred to in the content.

