

Visualizing the Landscape of Home IoT Research: A Bibliometric Analysis Using VOSviewer


Abstract
1. Introduction
- (1)
- Providing an overview of the scientific literature concerning the home IoT sector.
- (2)
- Considering the authorship, citations, and geography when analyzing contributions.
- (3)
- Analyzing collaborations to identify influential organizations and authors.
- (4)
- Identifying yearly trends in the home IoT field and evaluating their development.
2. Literature Review
2.1. Home IoT
2.2. Bibliometric Analysis Regarding IoT Applications
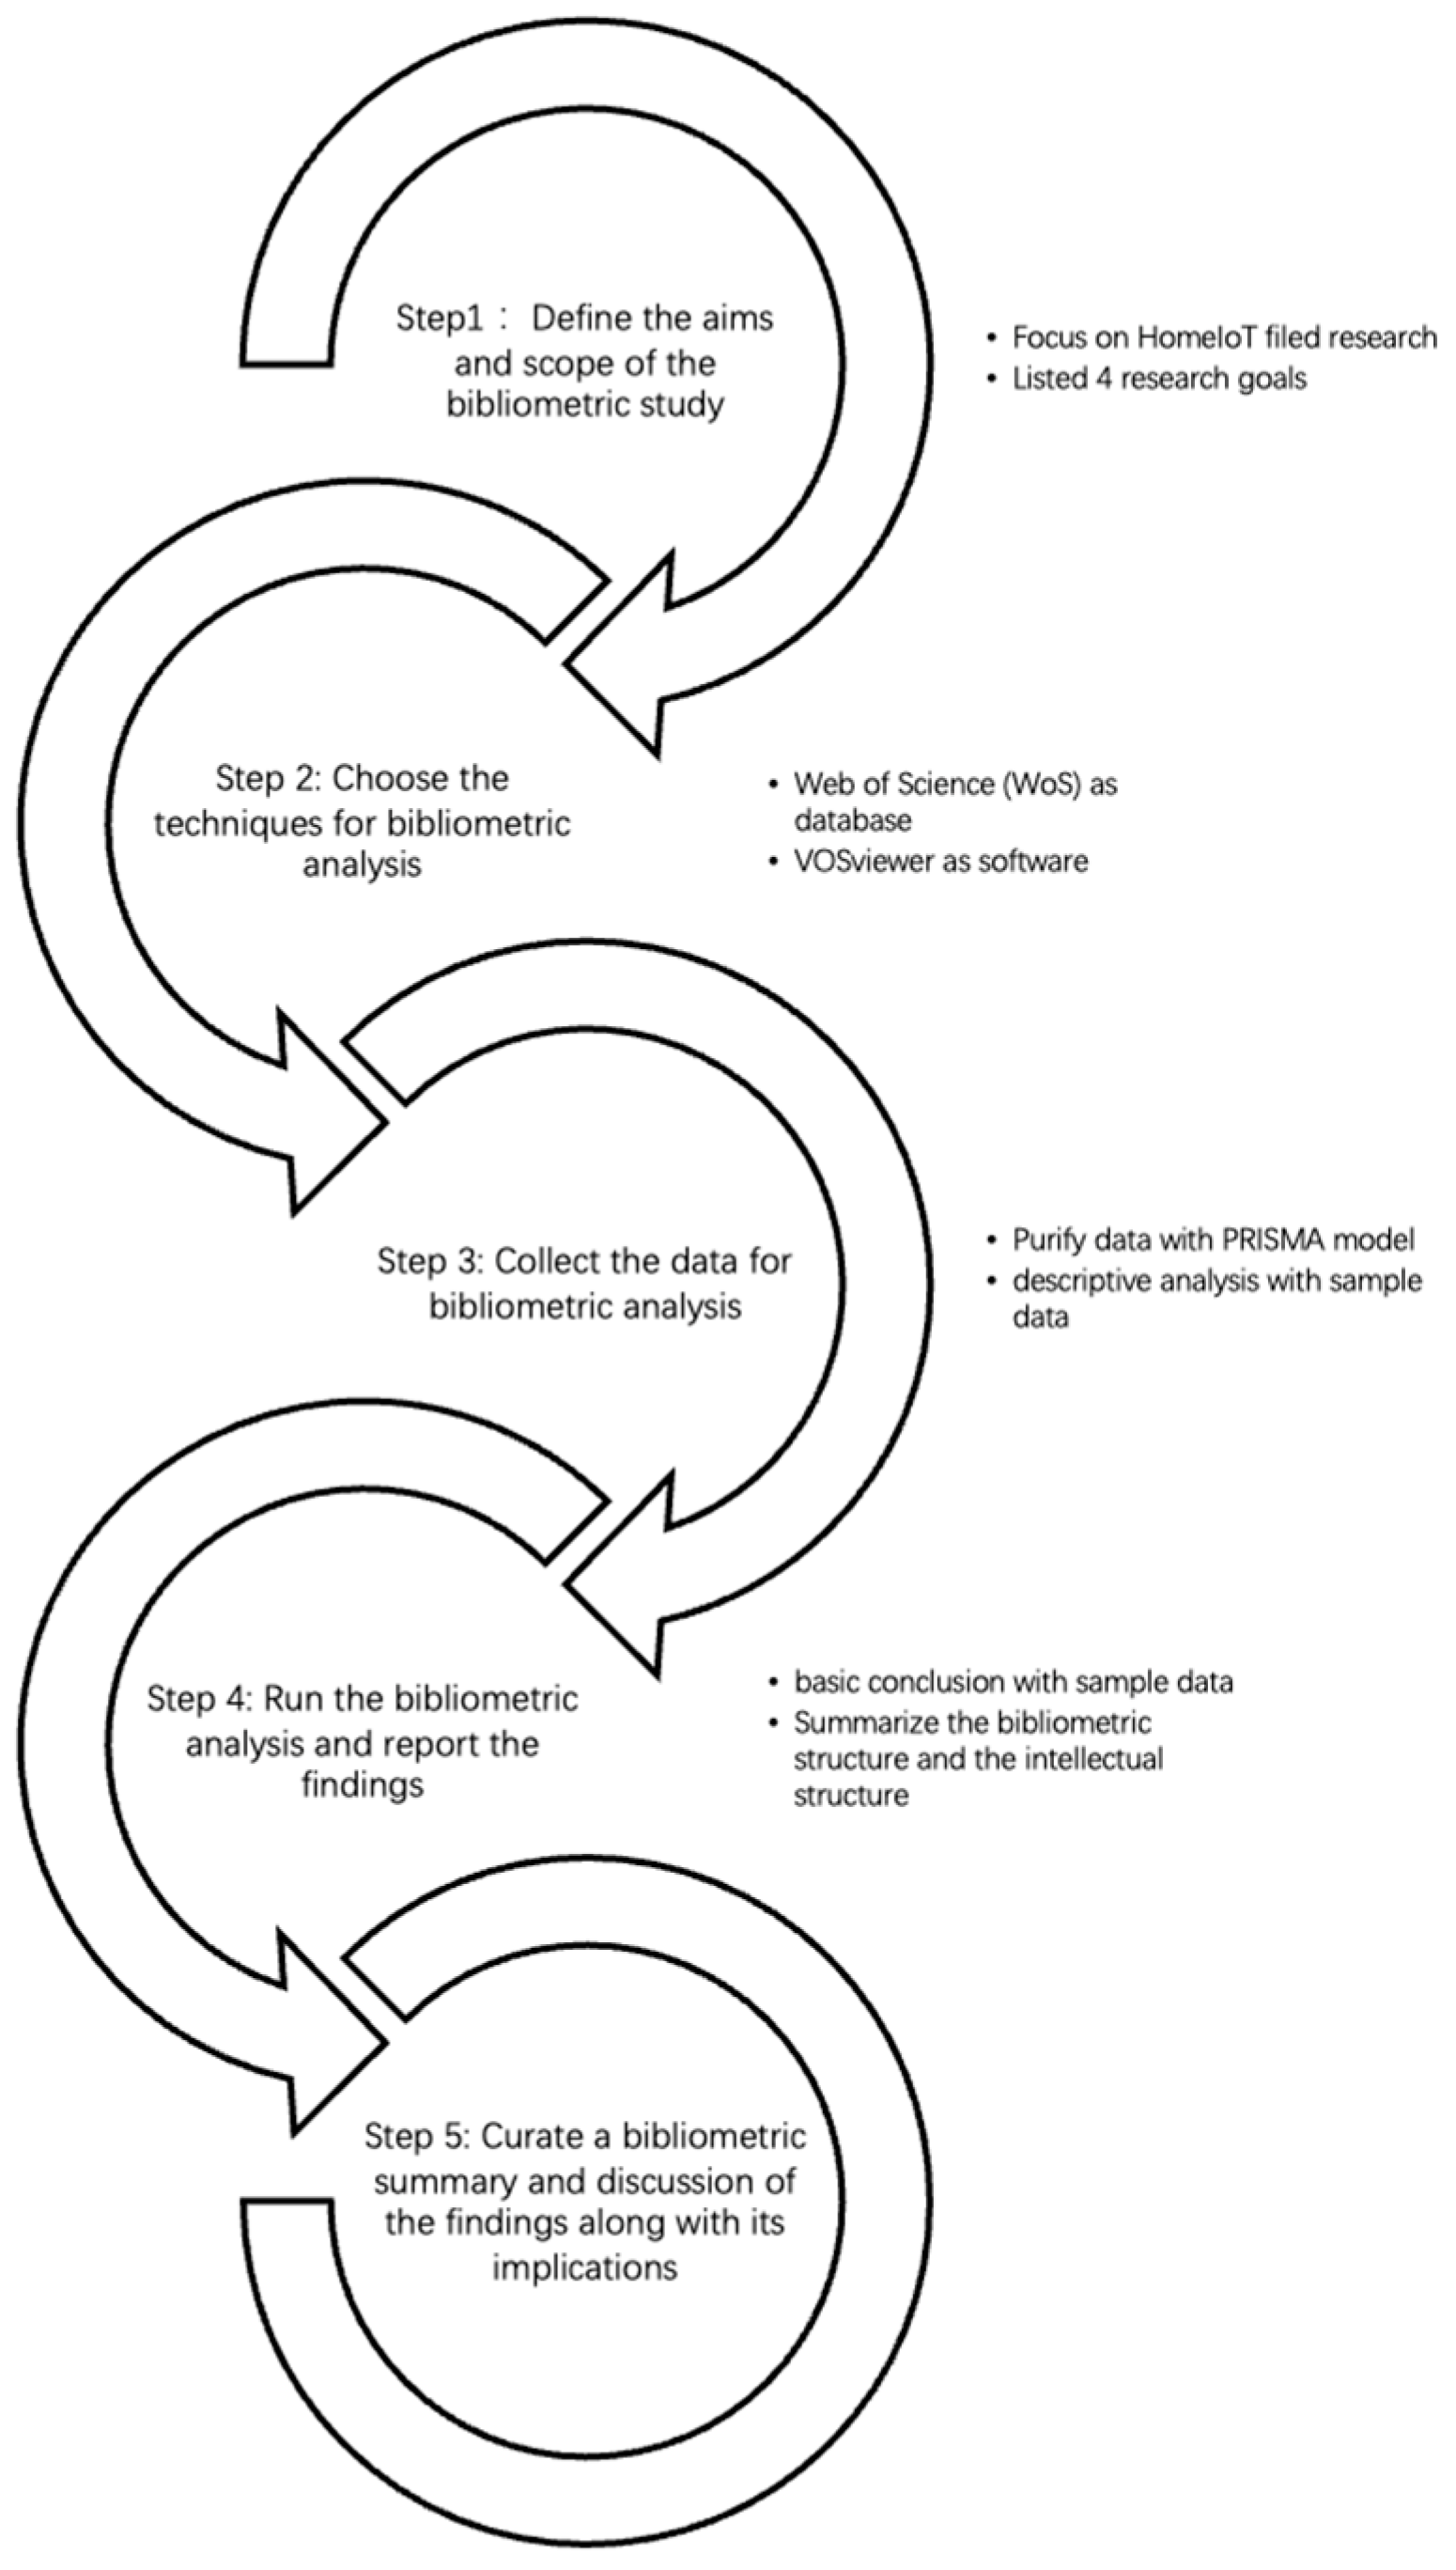
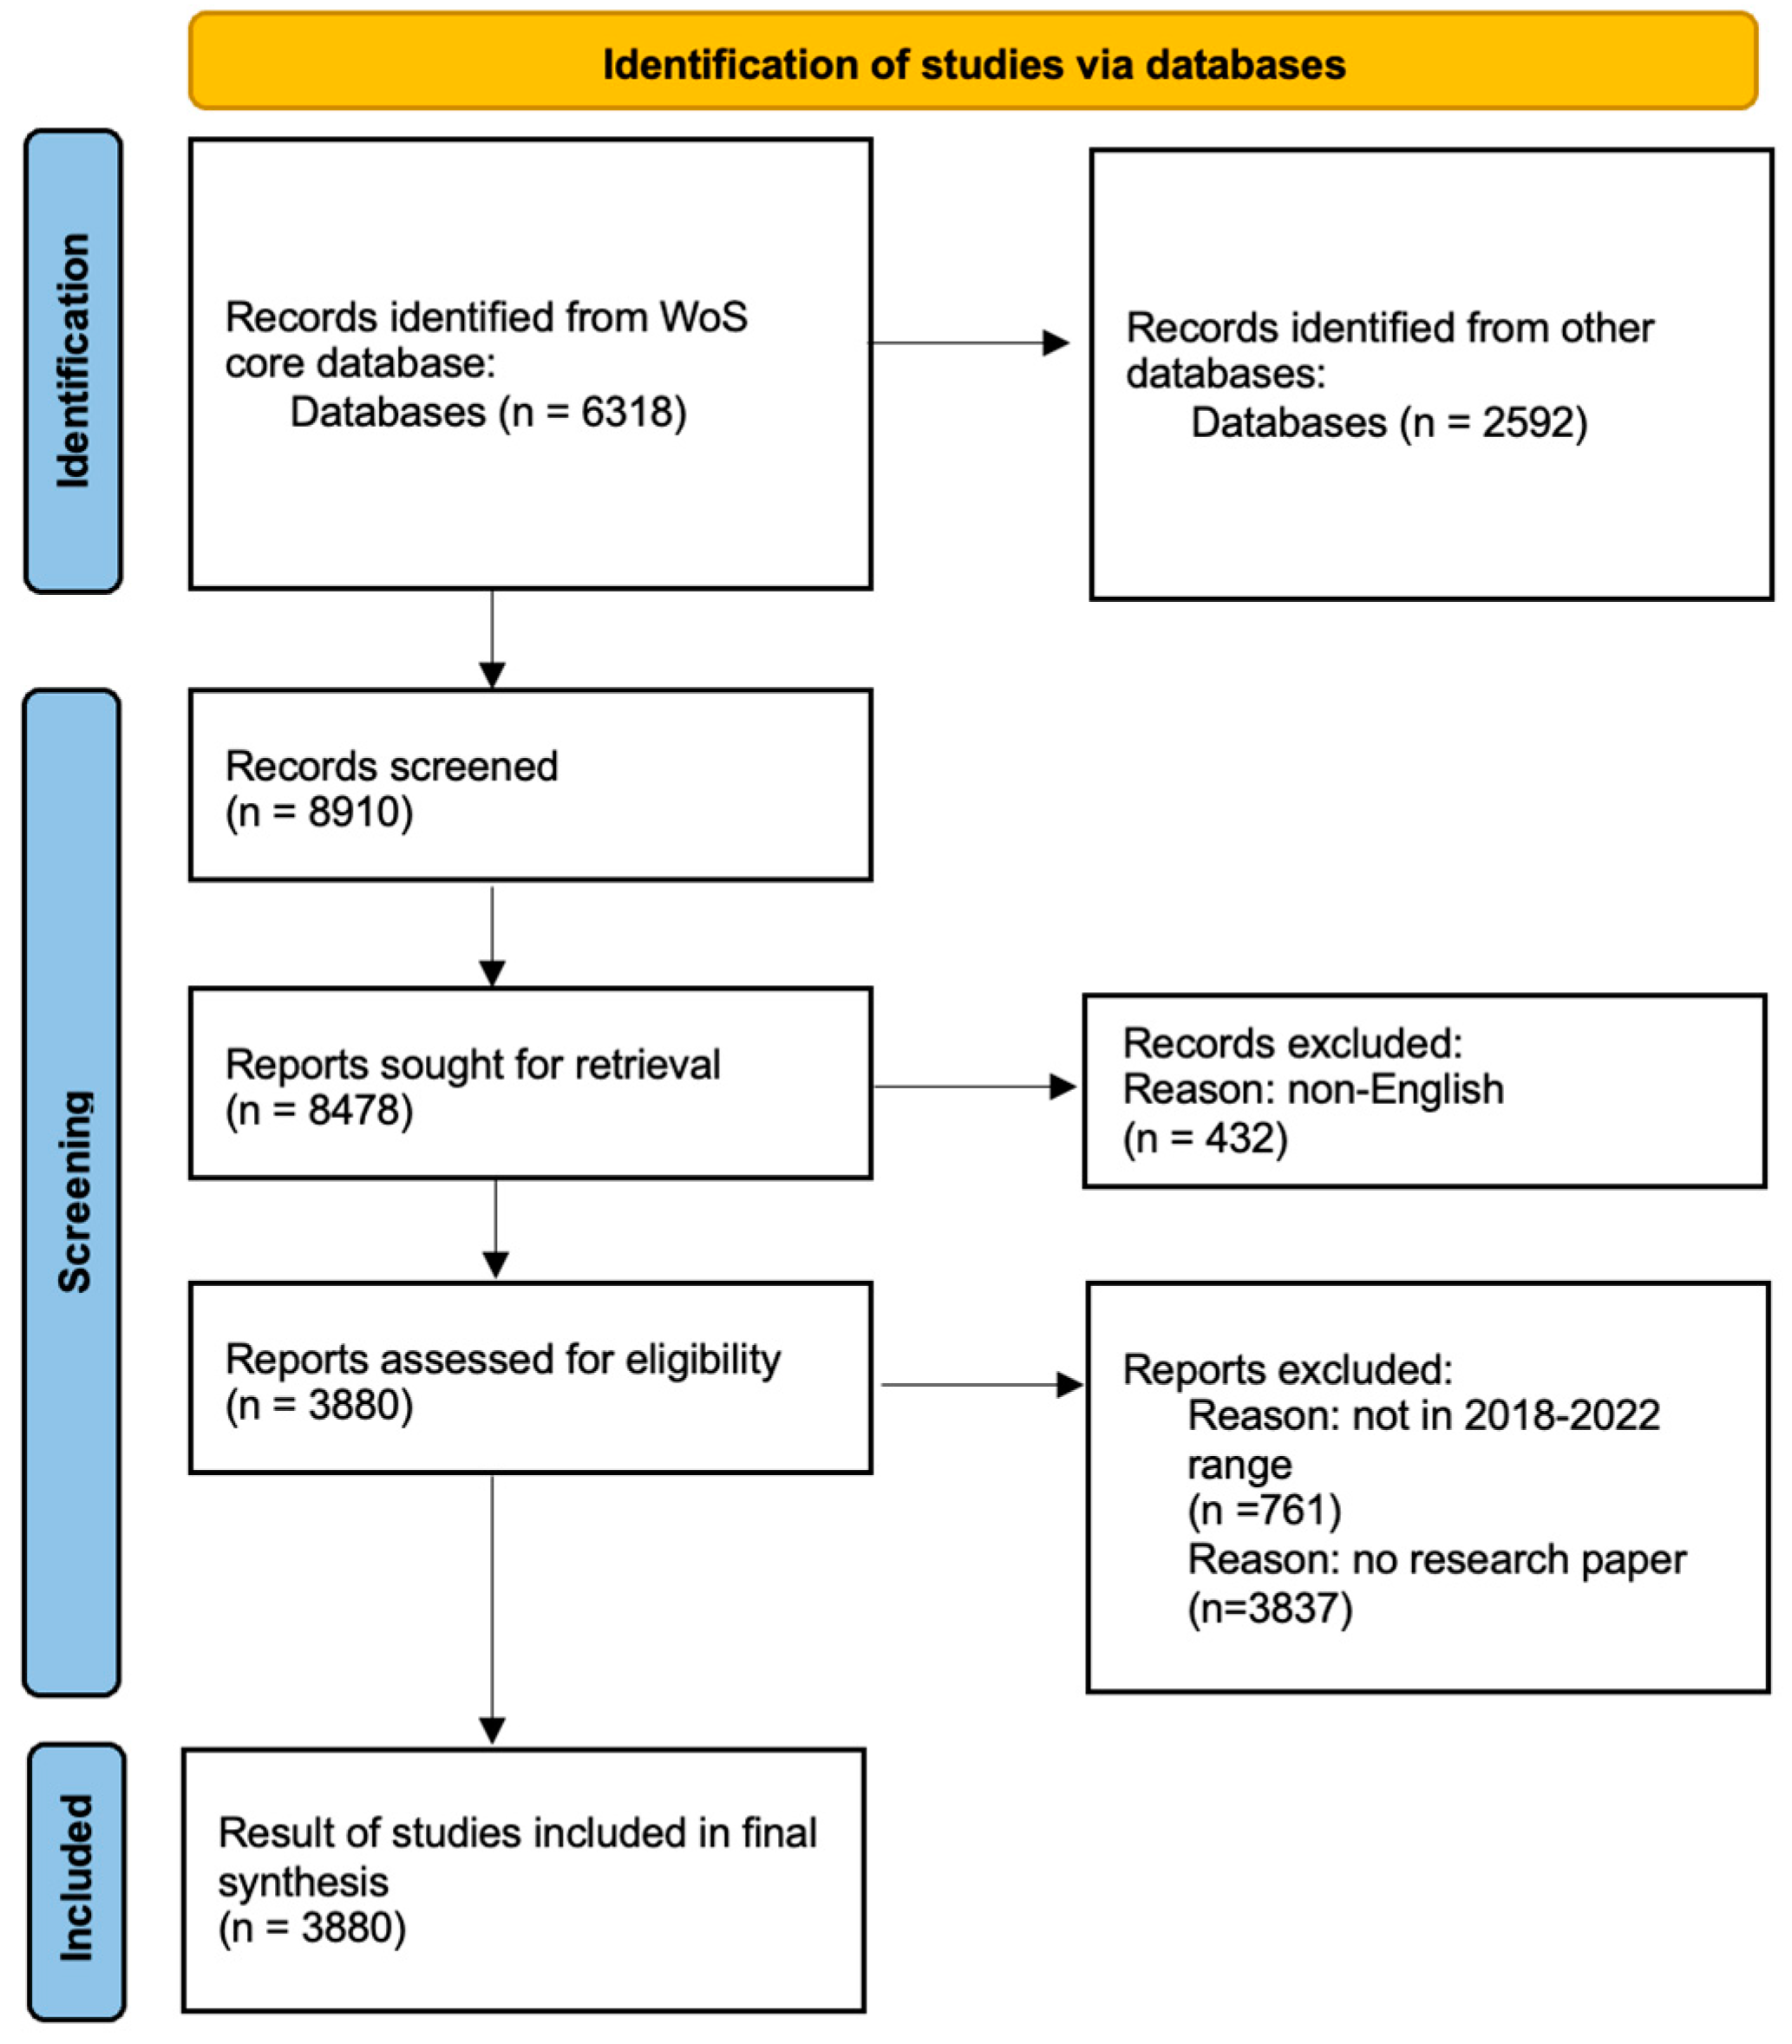
3. Materials and Methods
3.1. Materials
3.2. Method and Software
4. Results
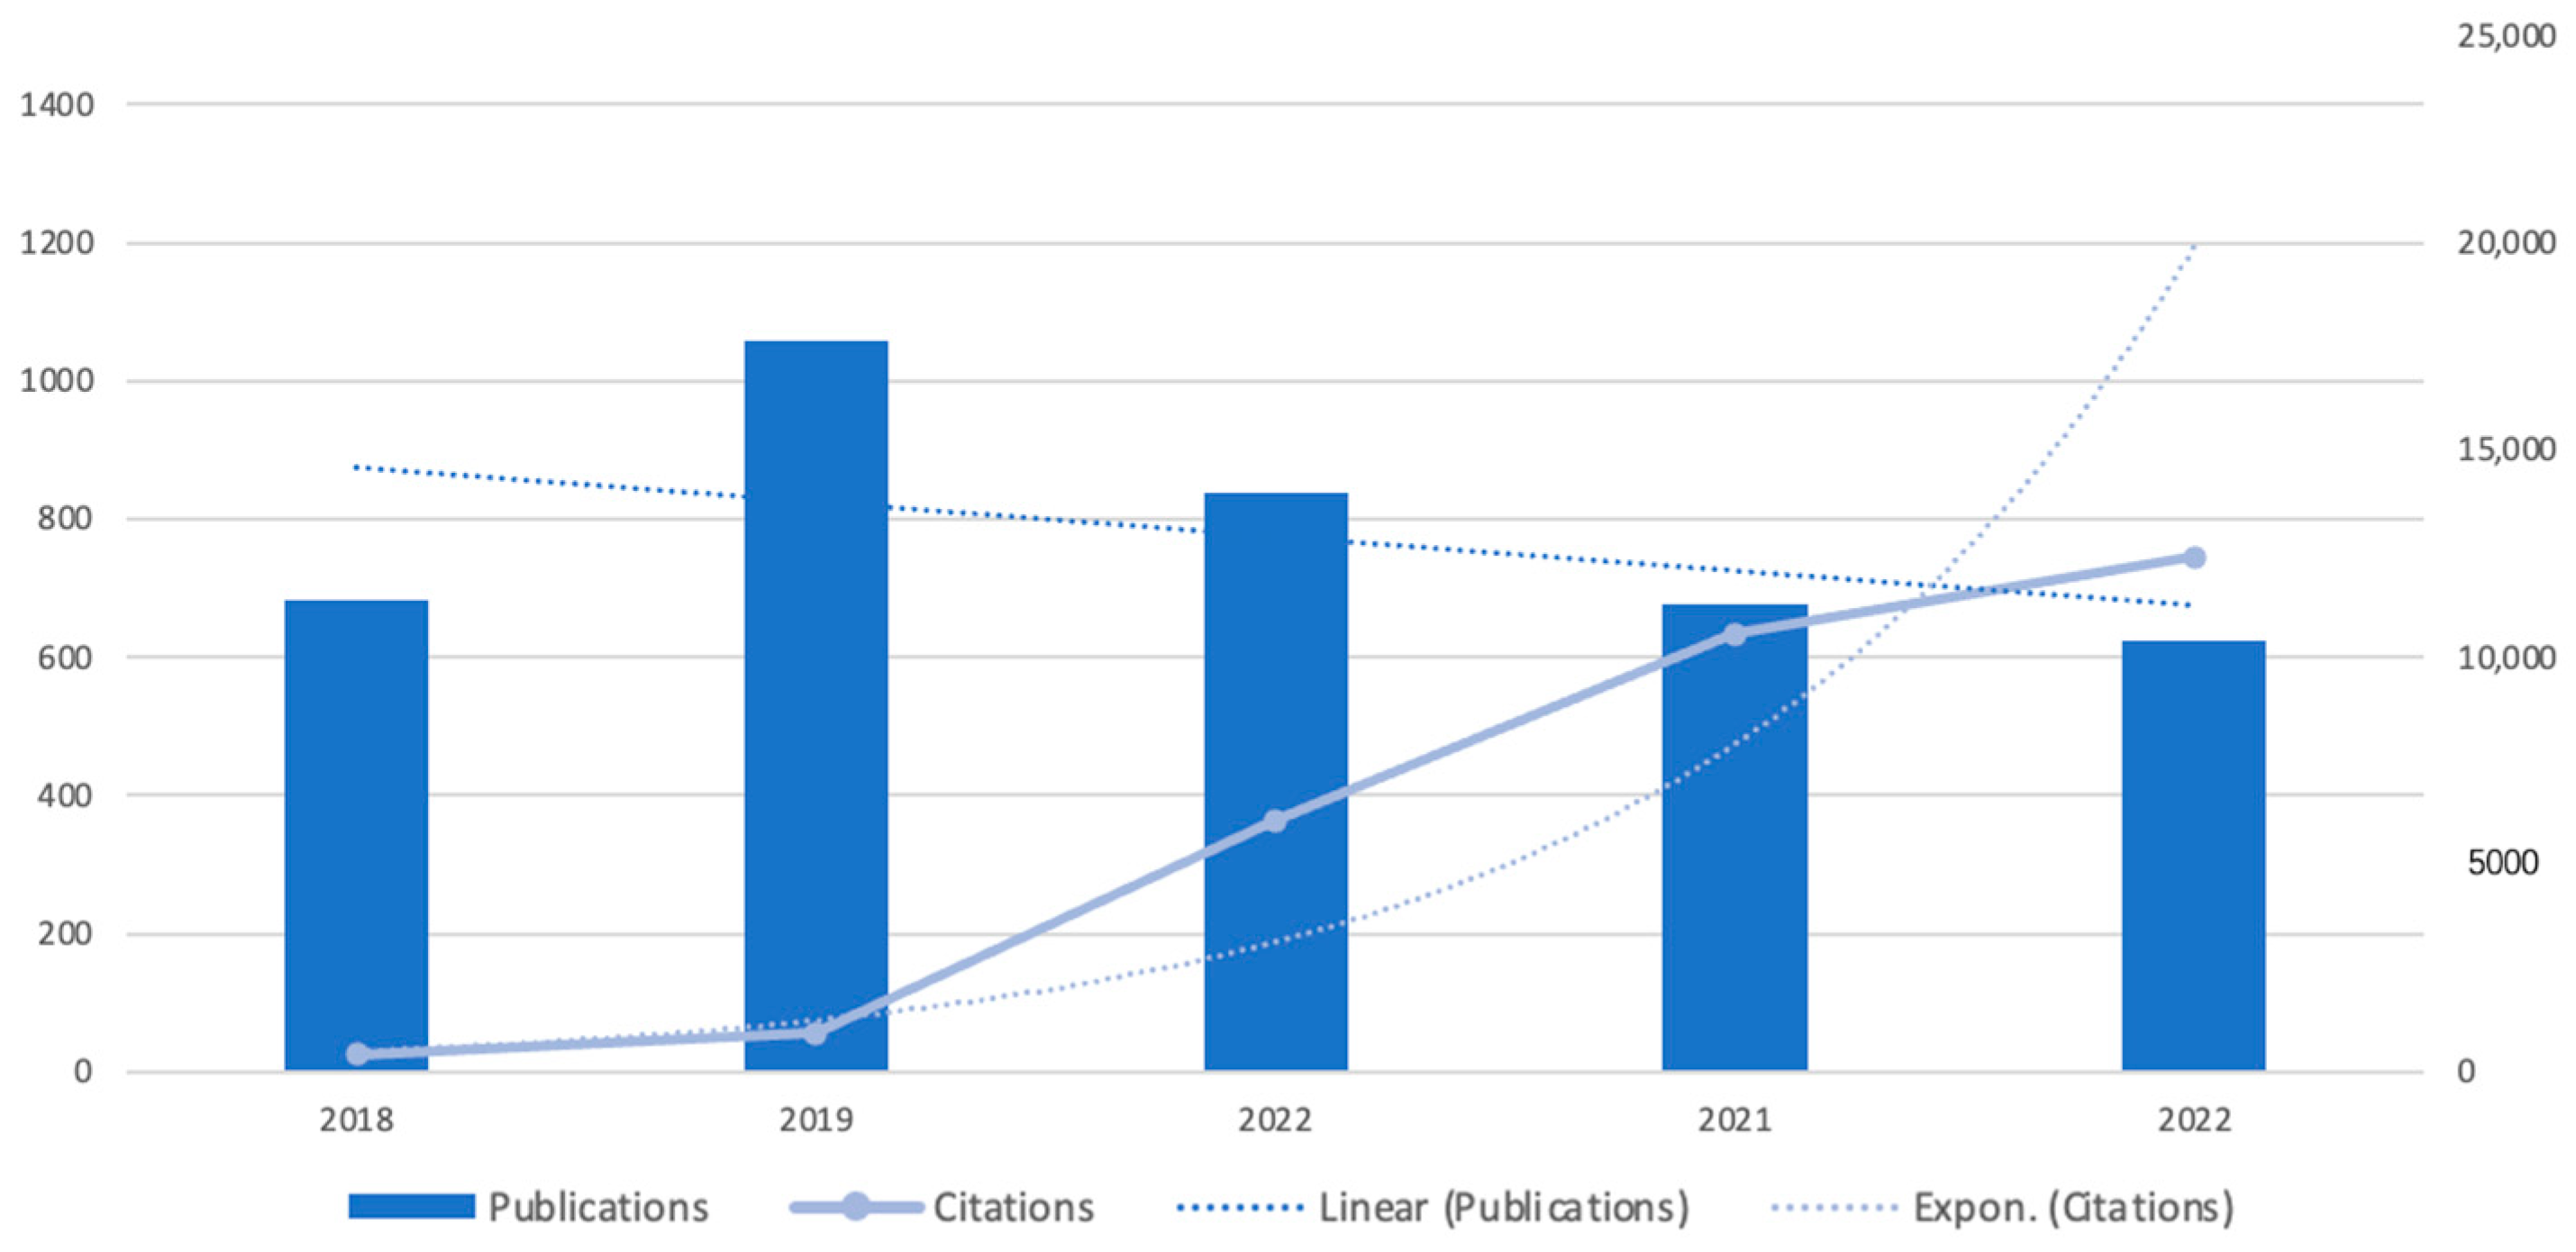
4.1. Publication Performance
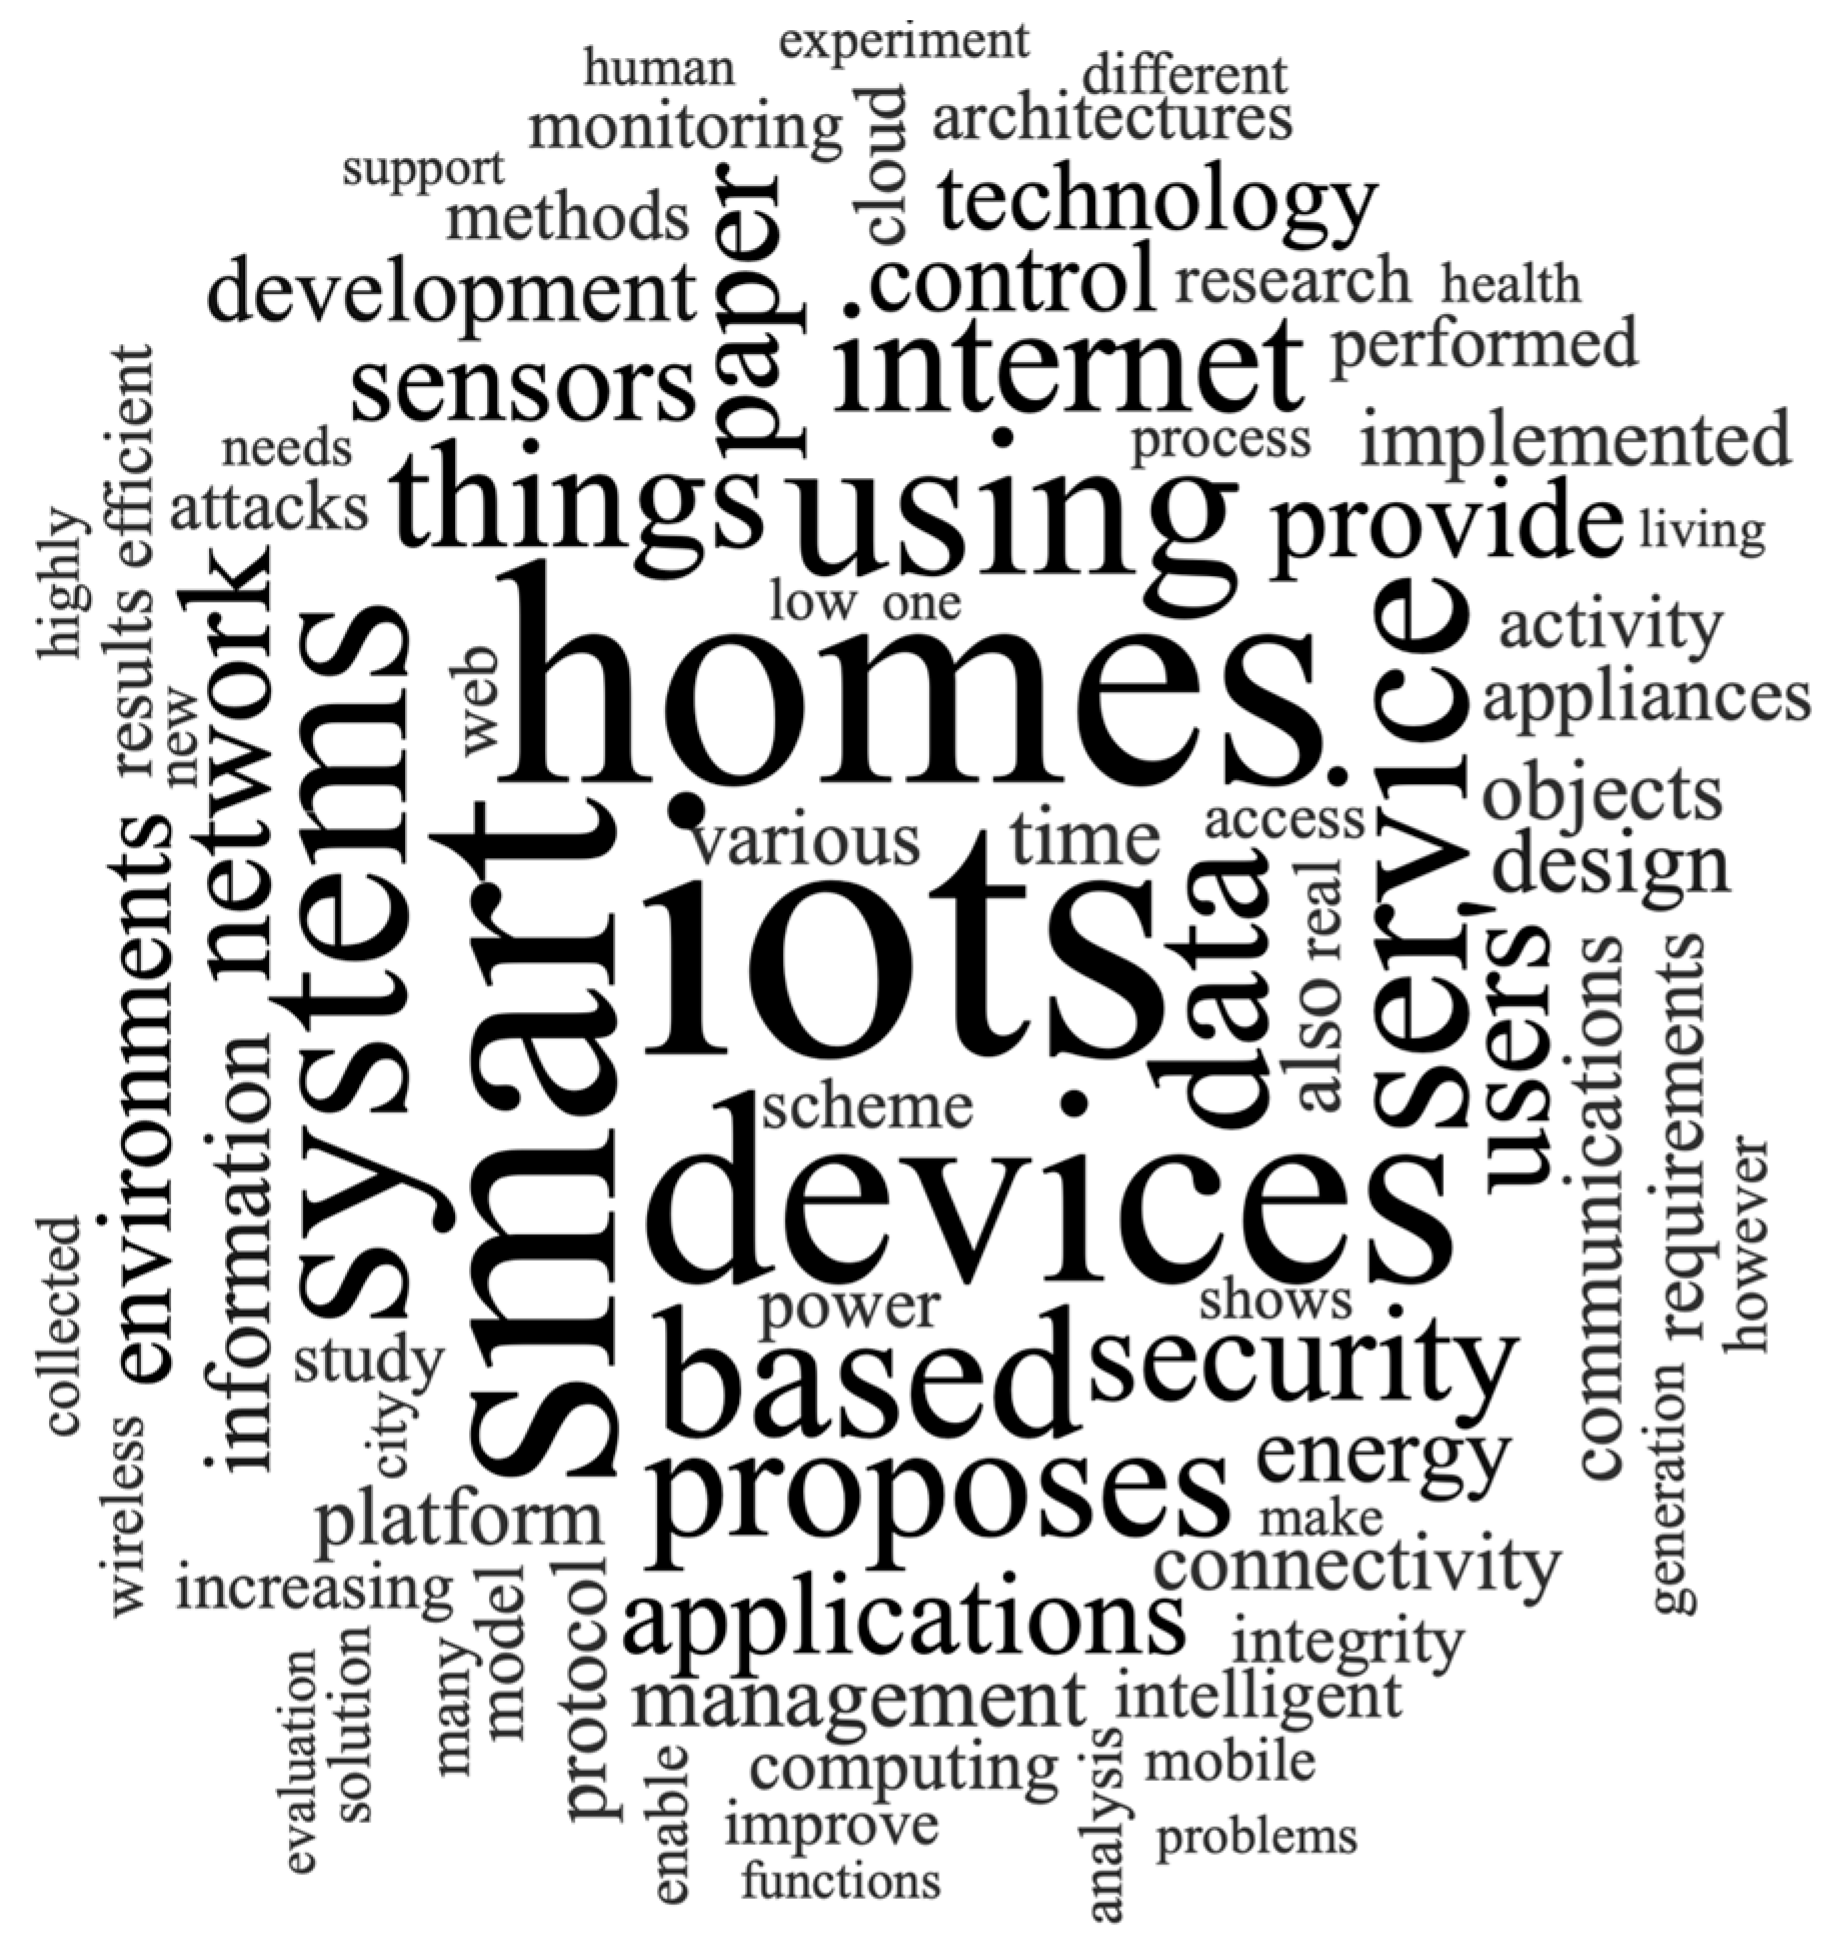
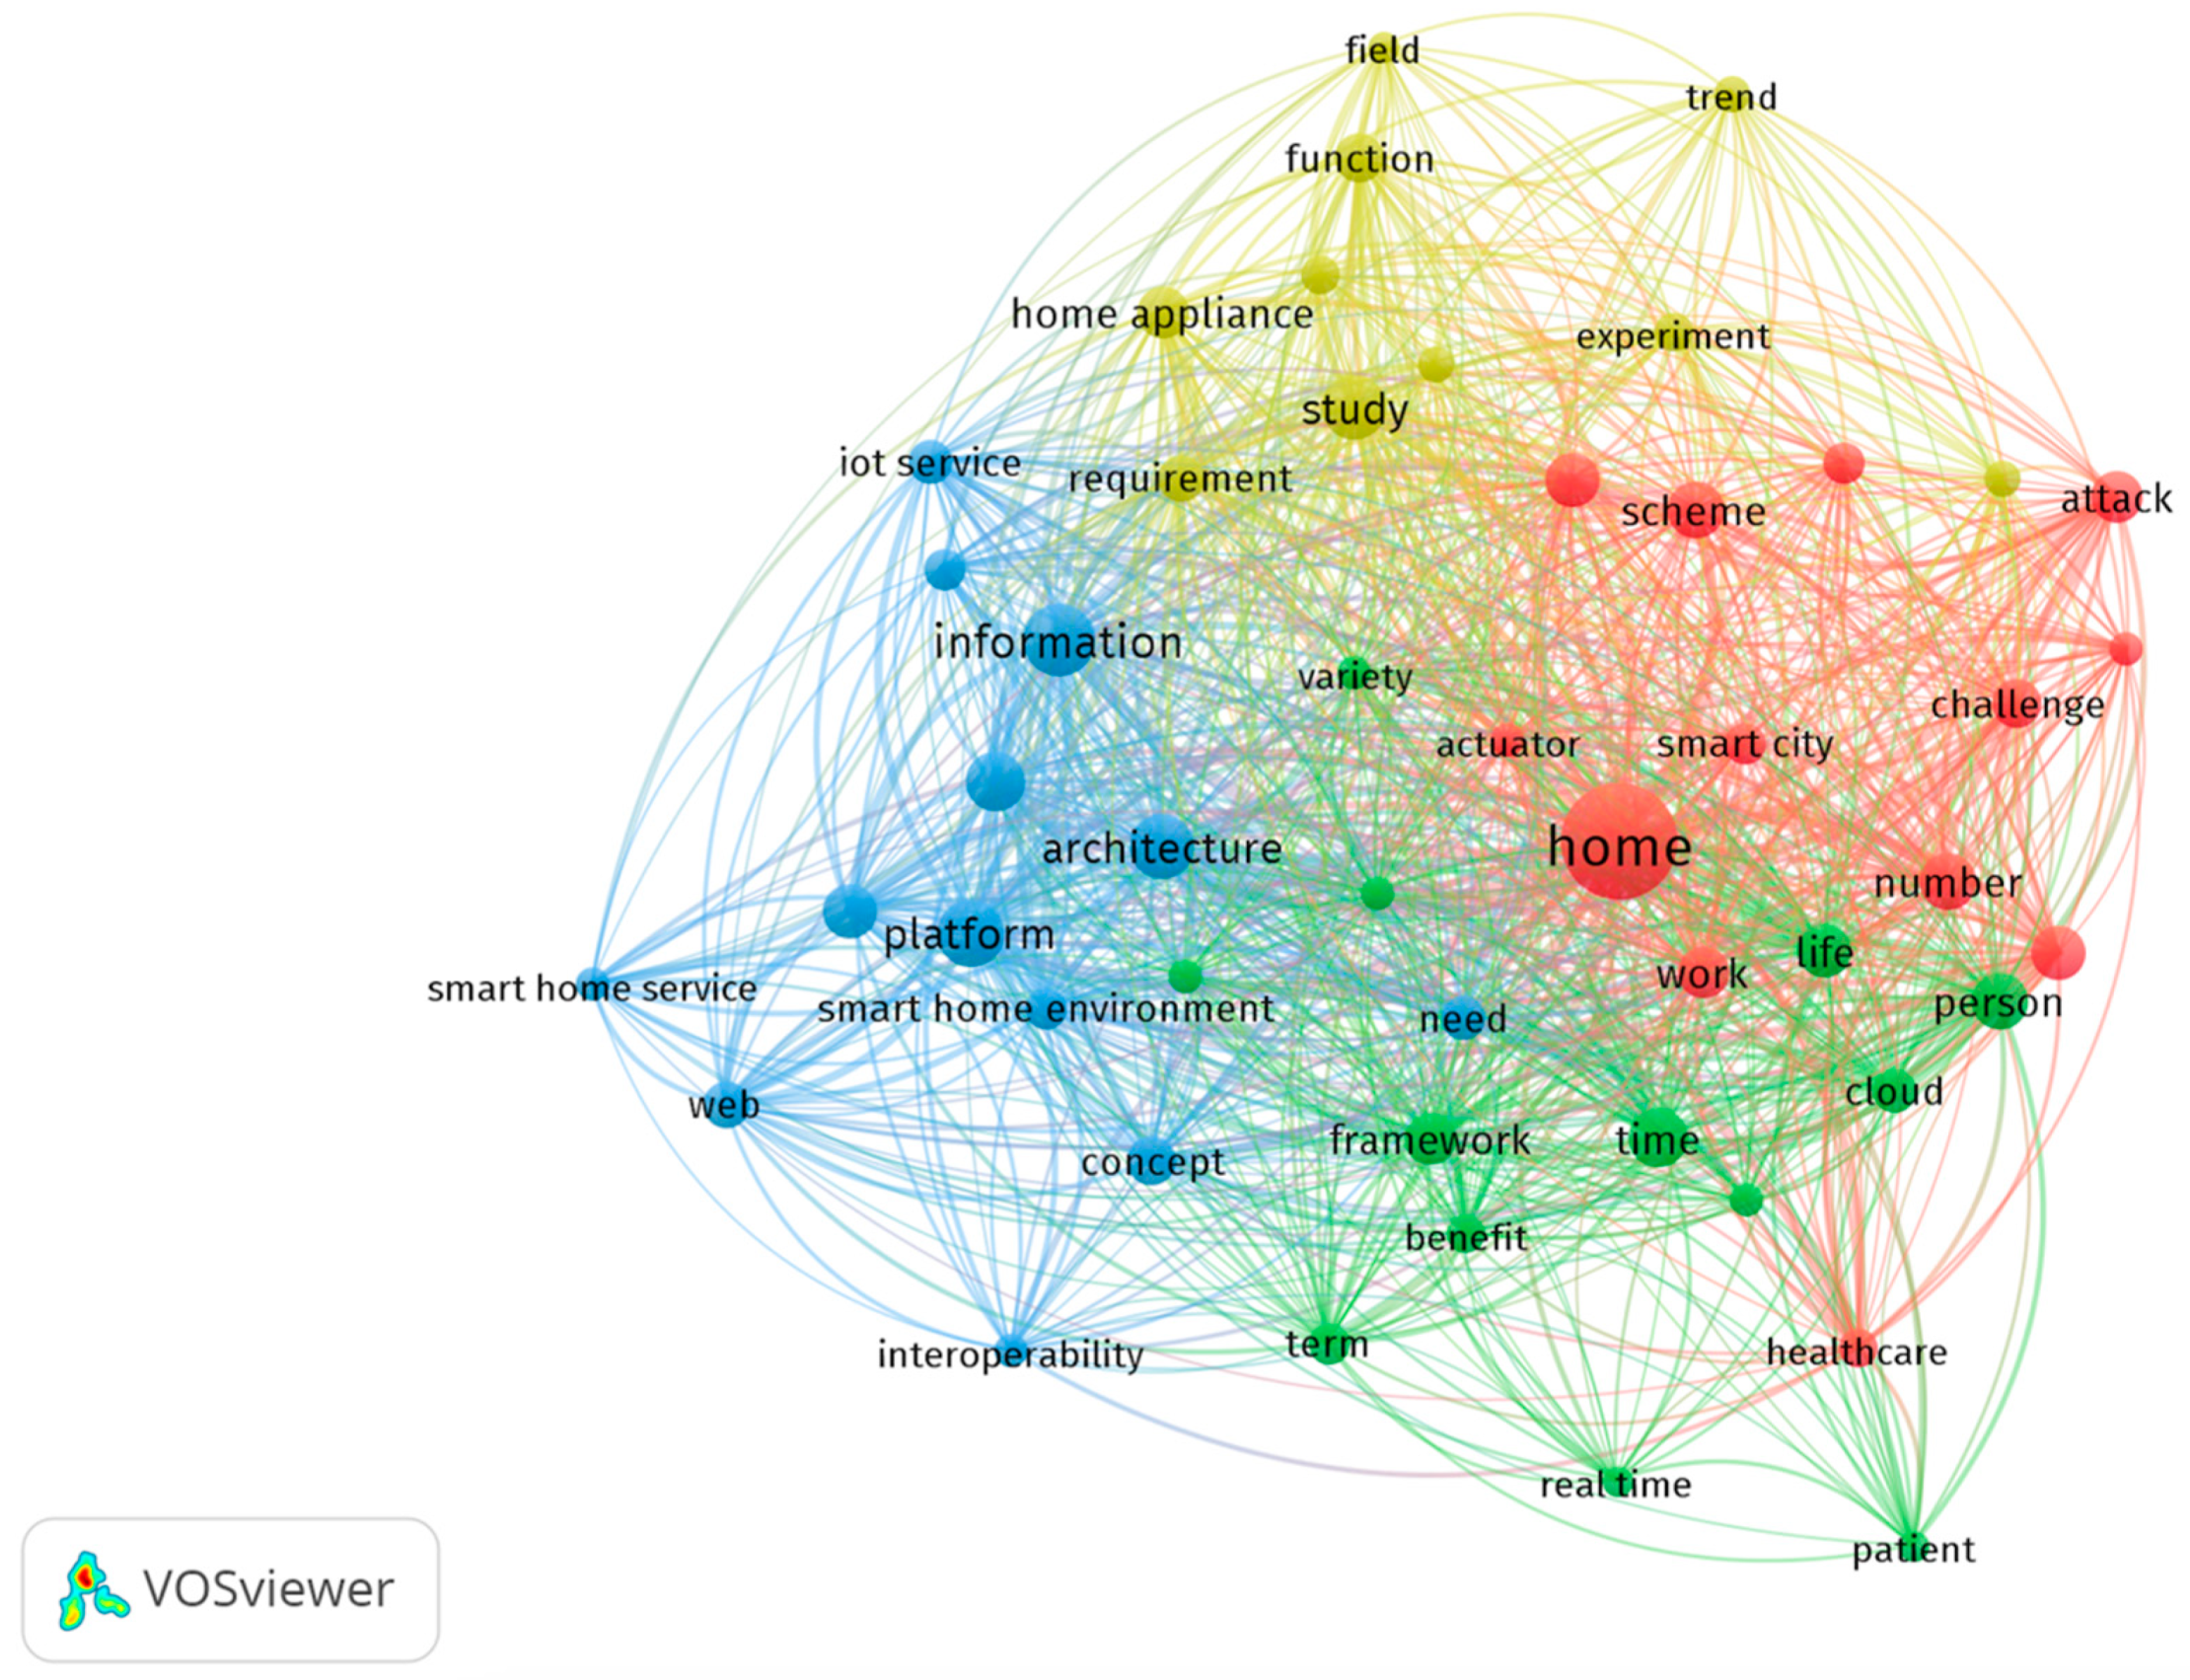
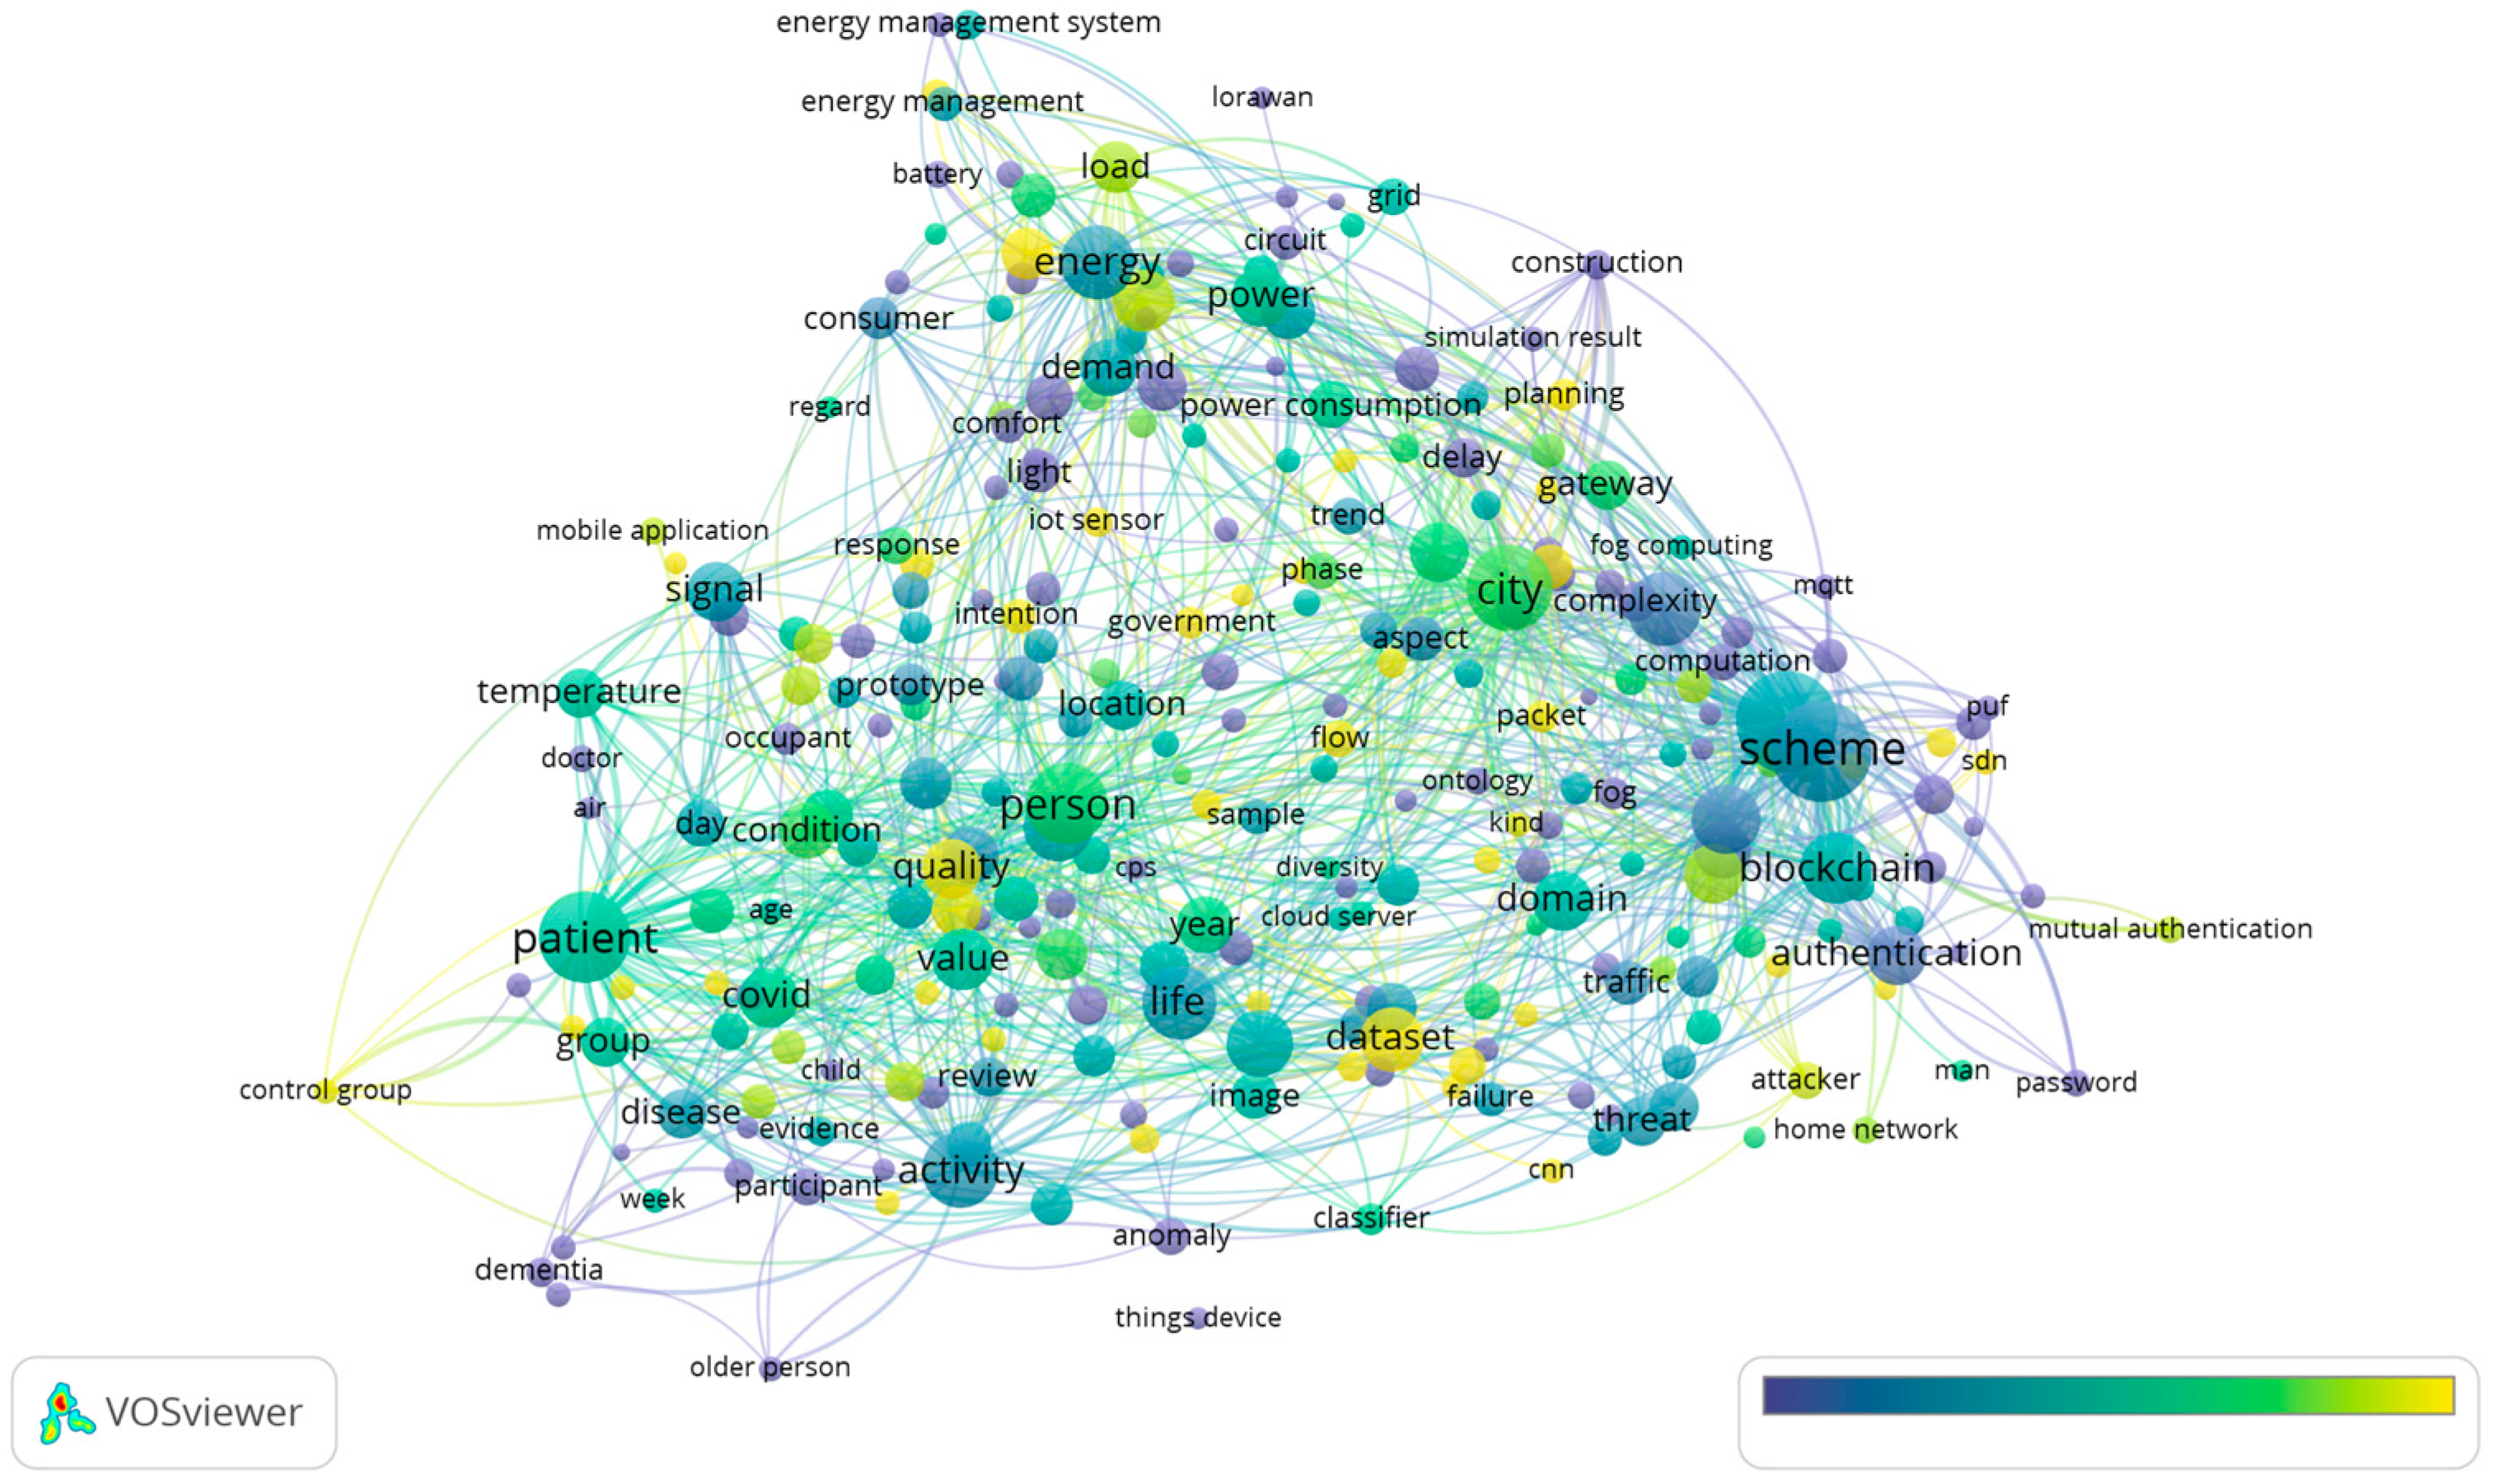
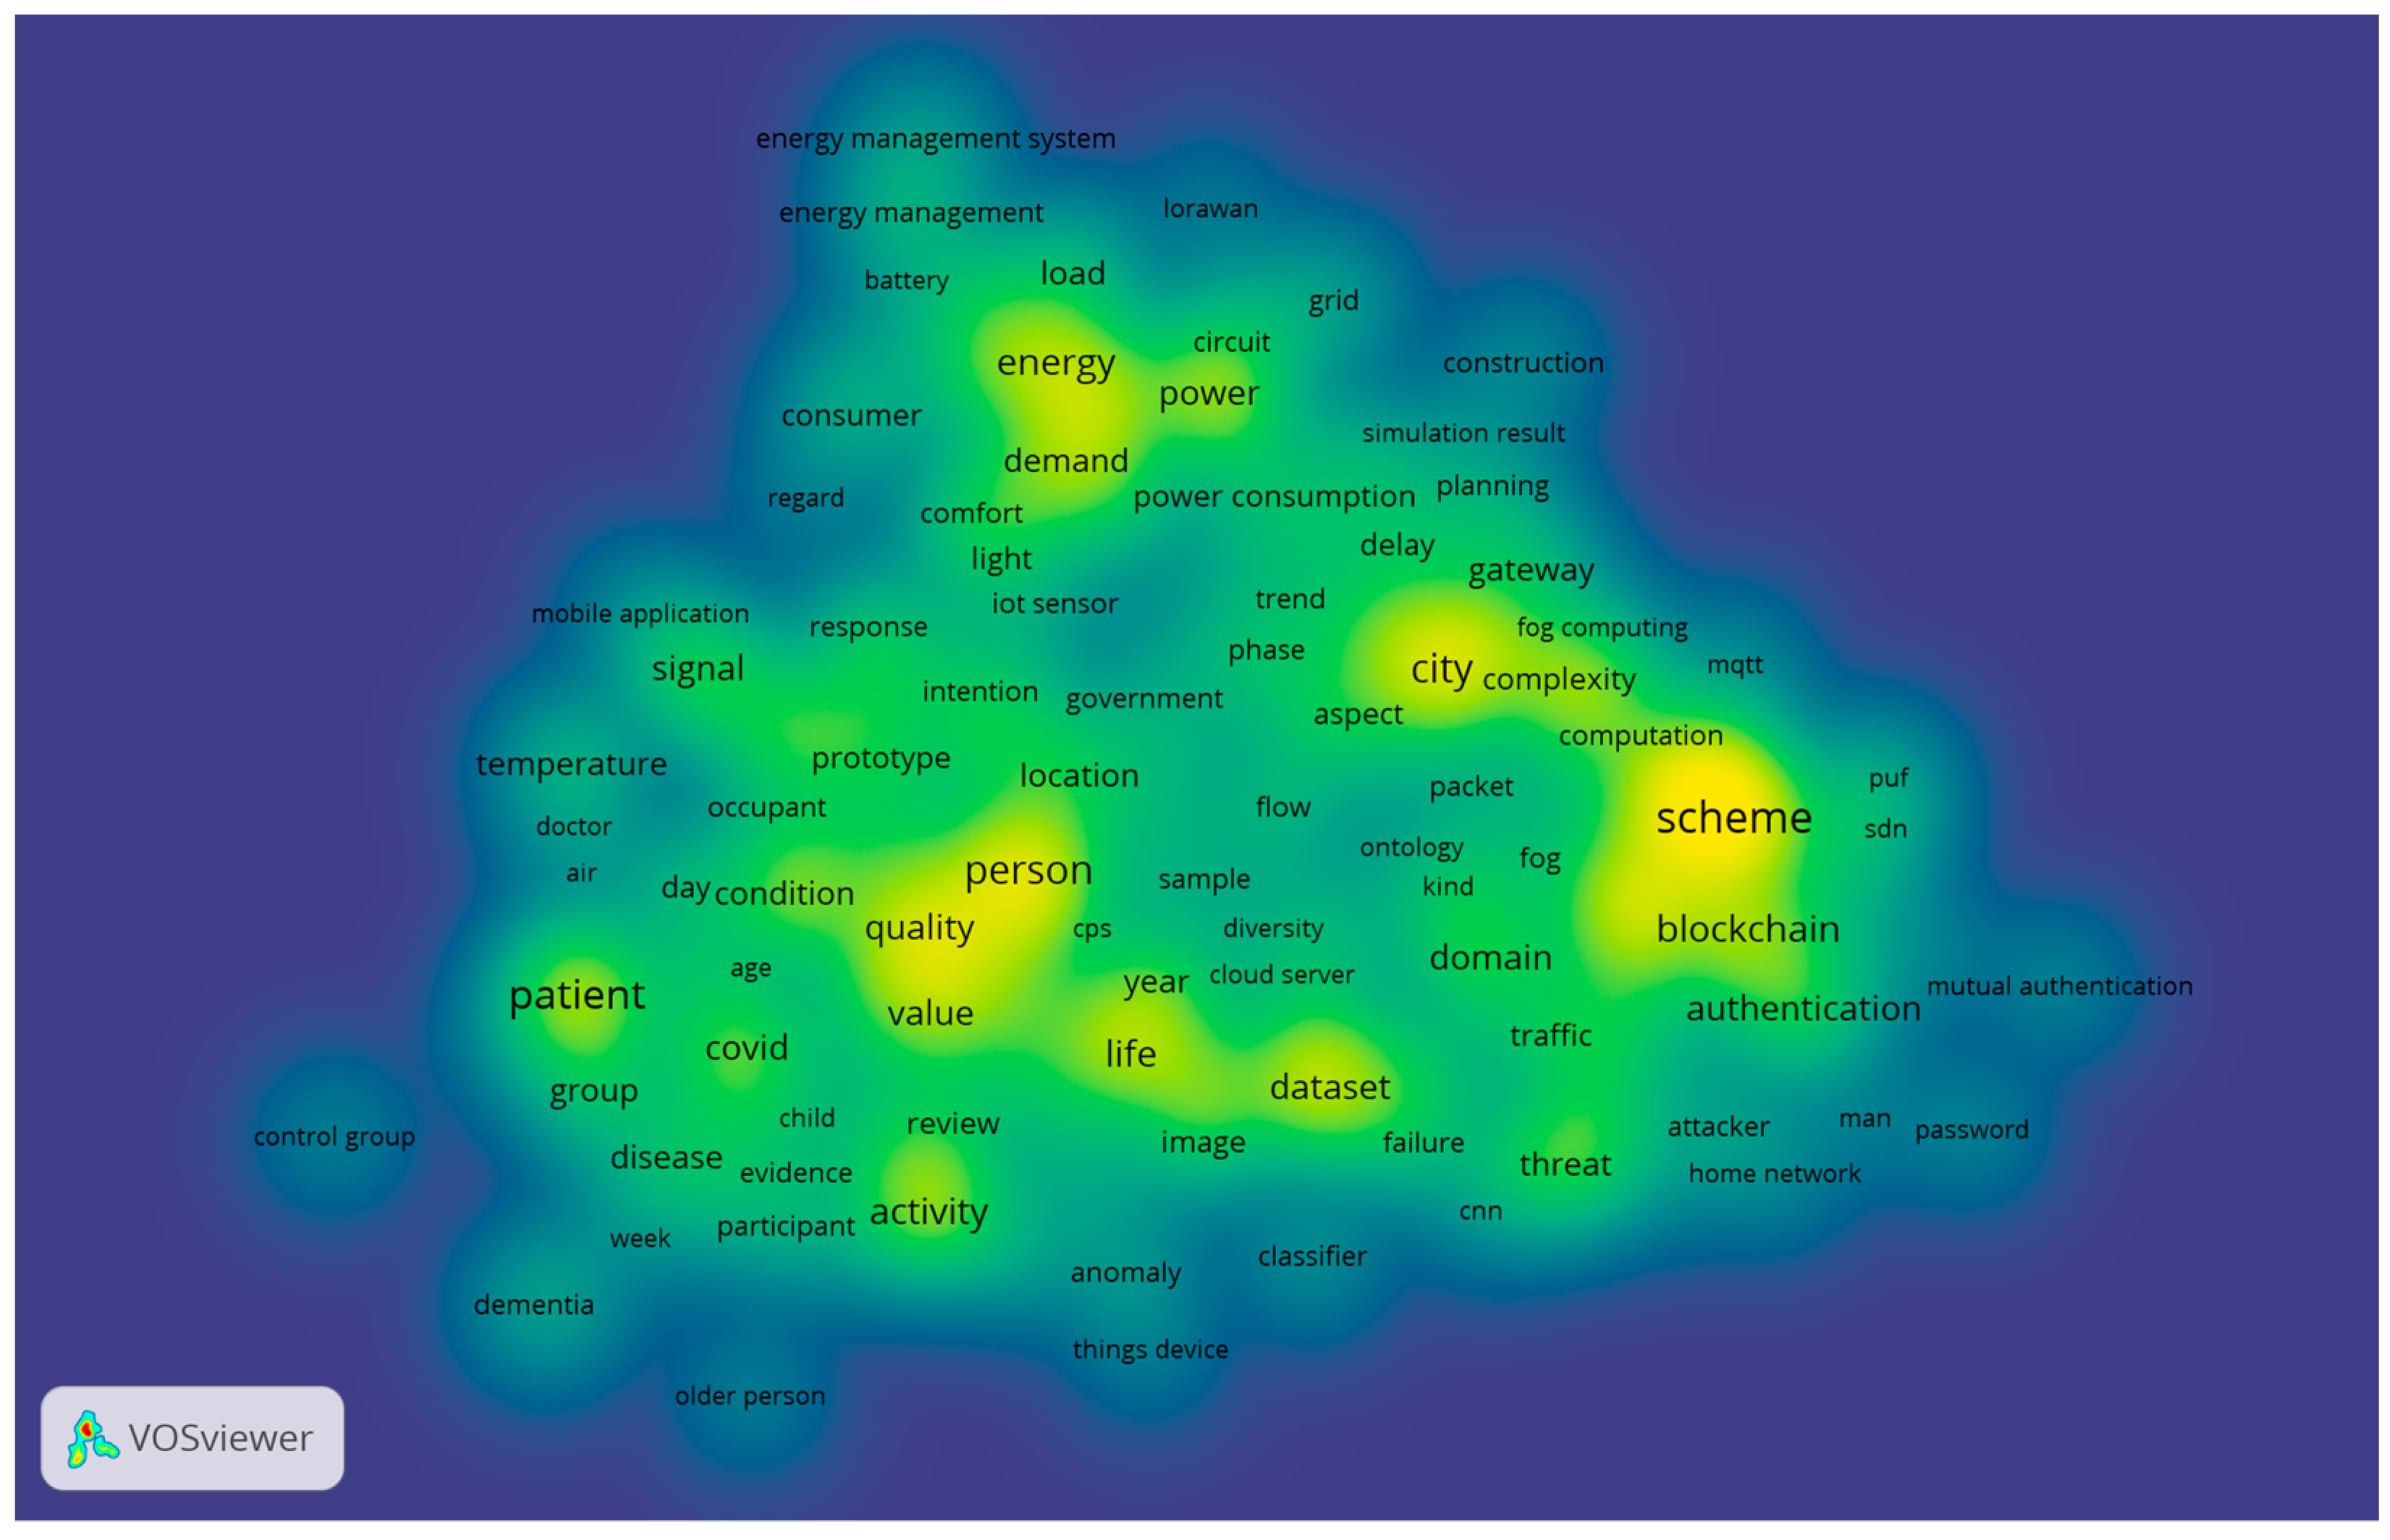
4.2. Keywords
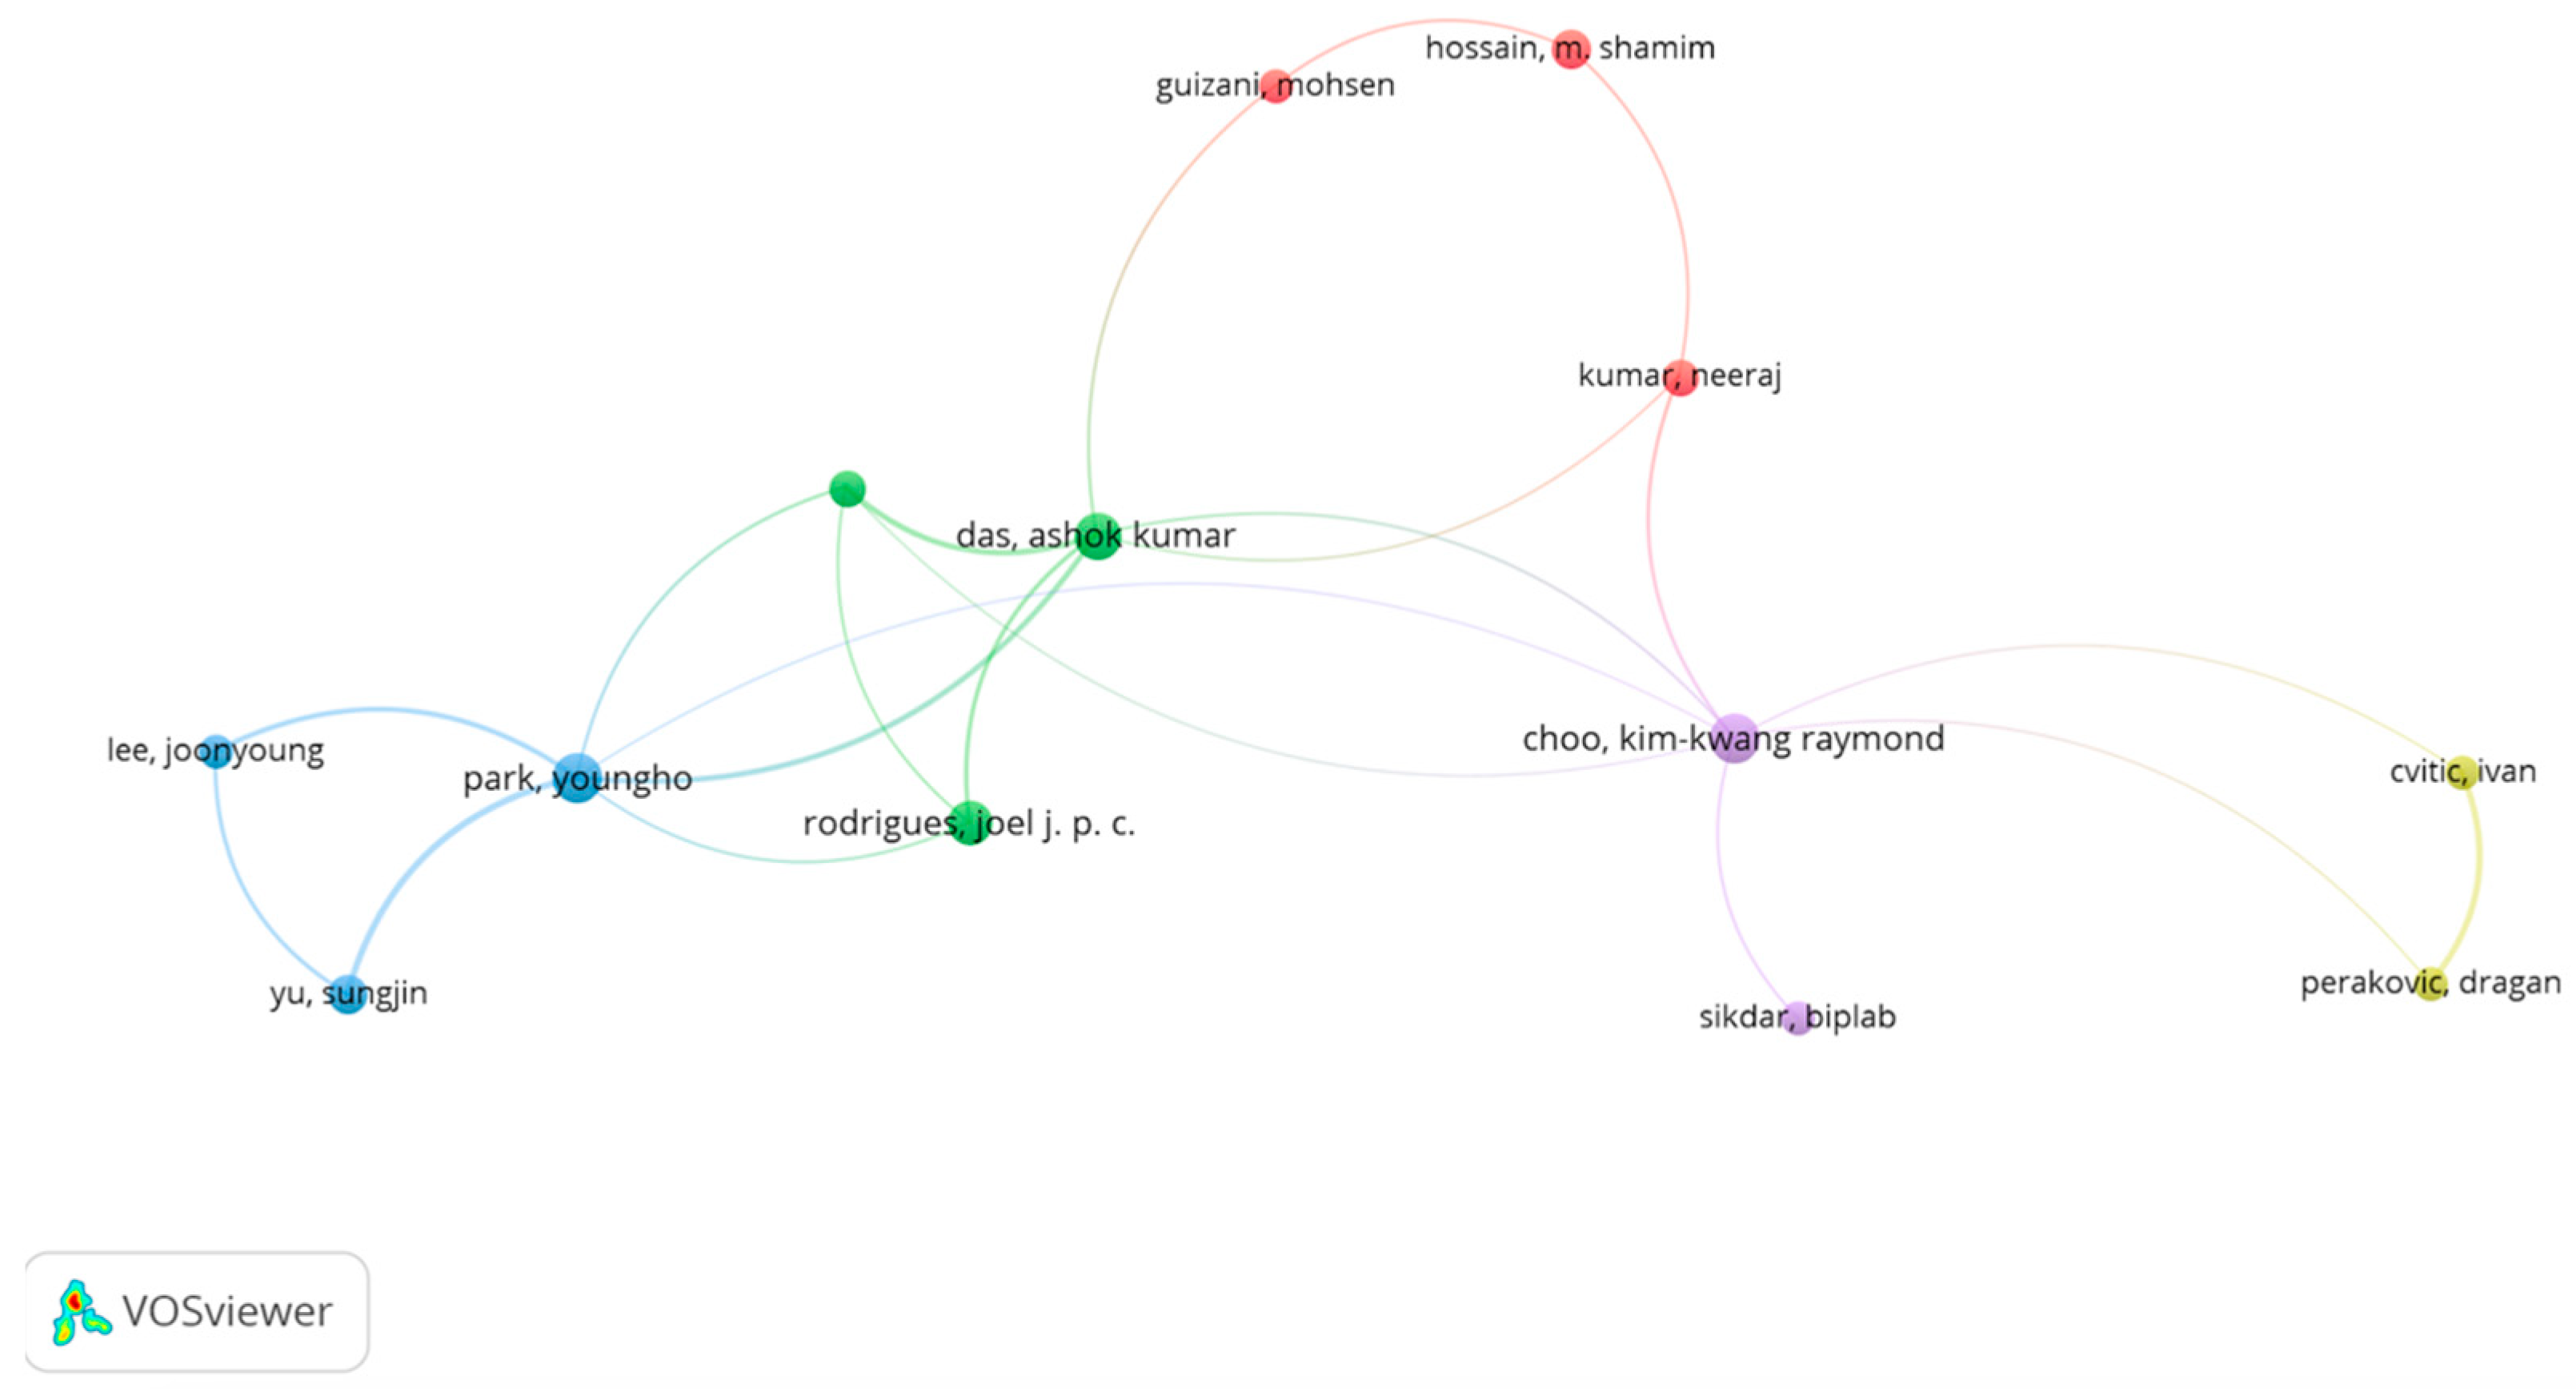
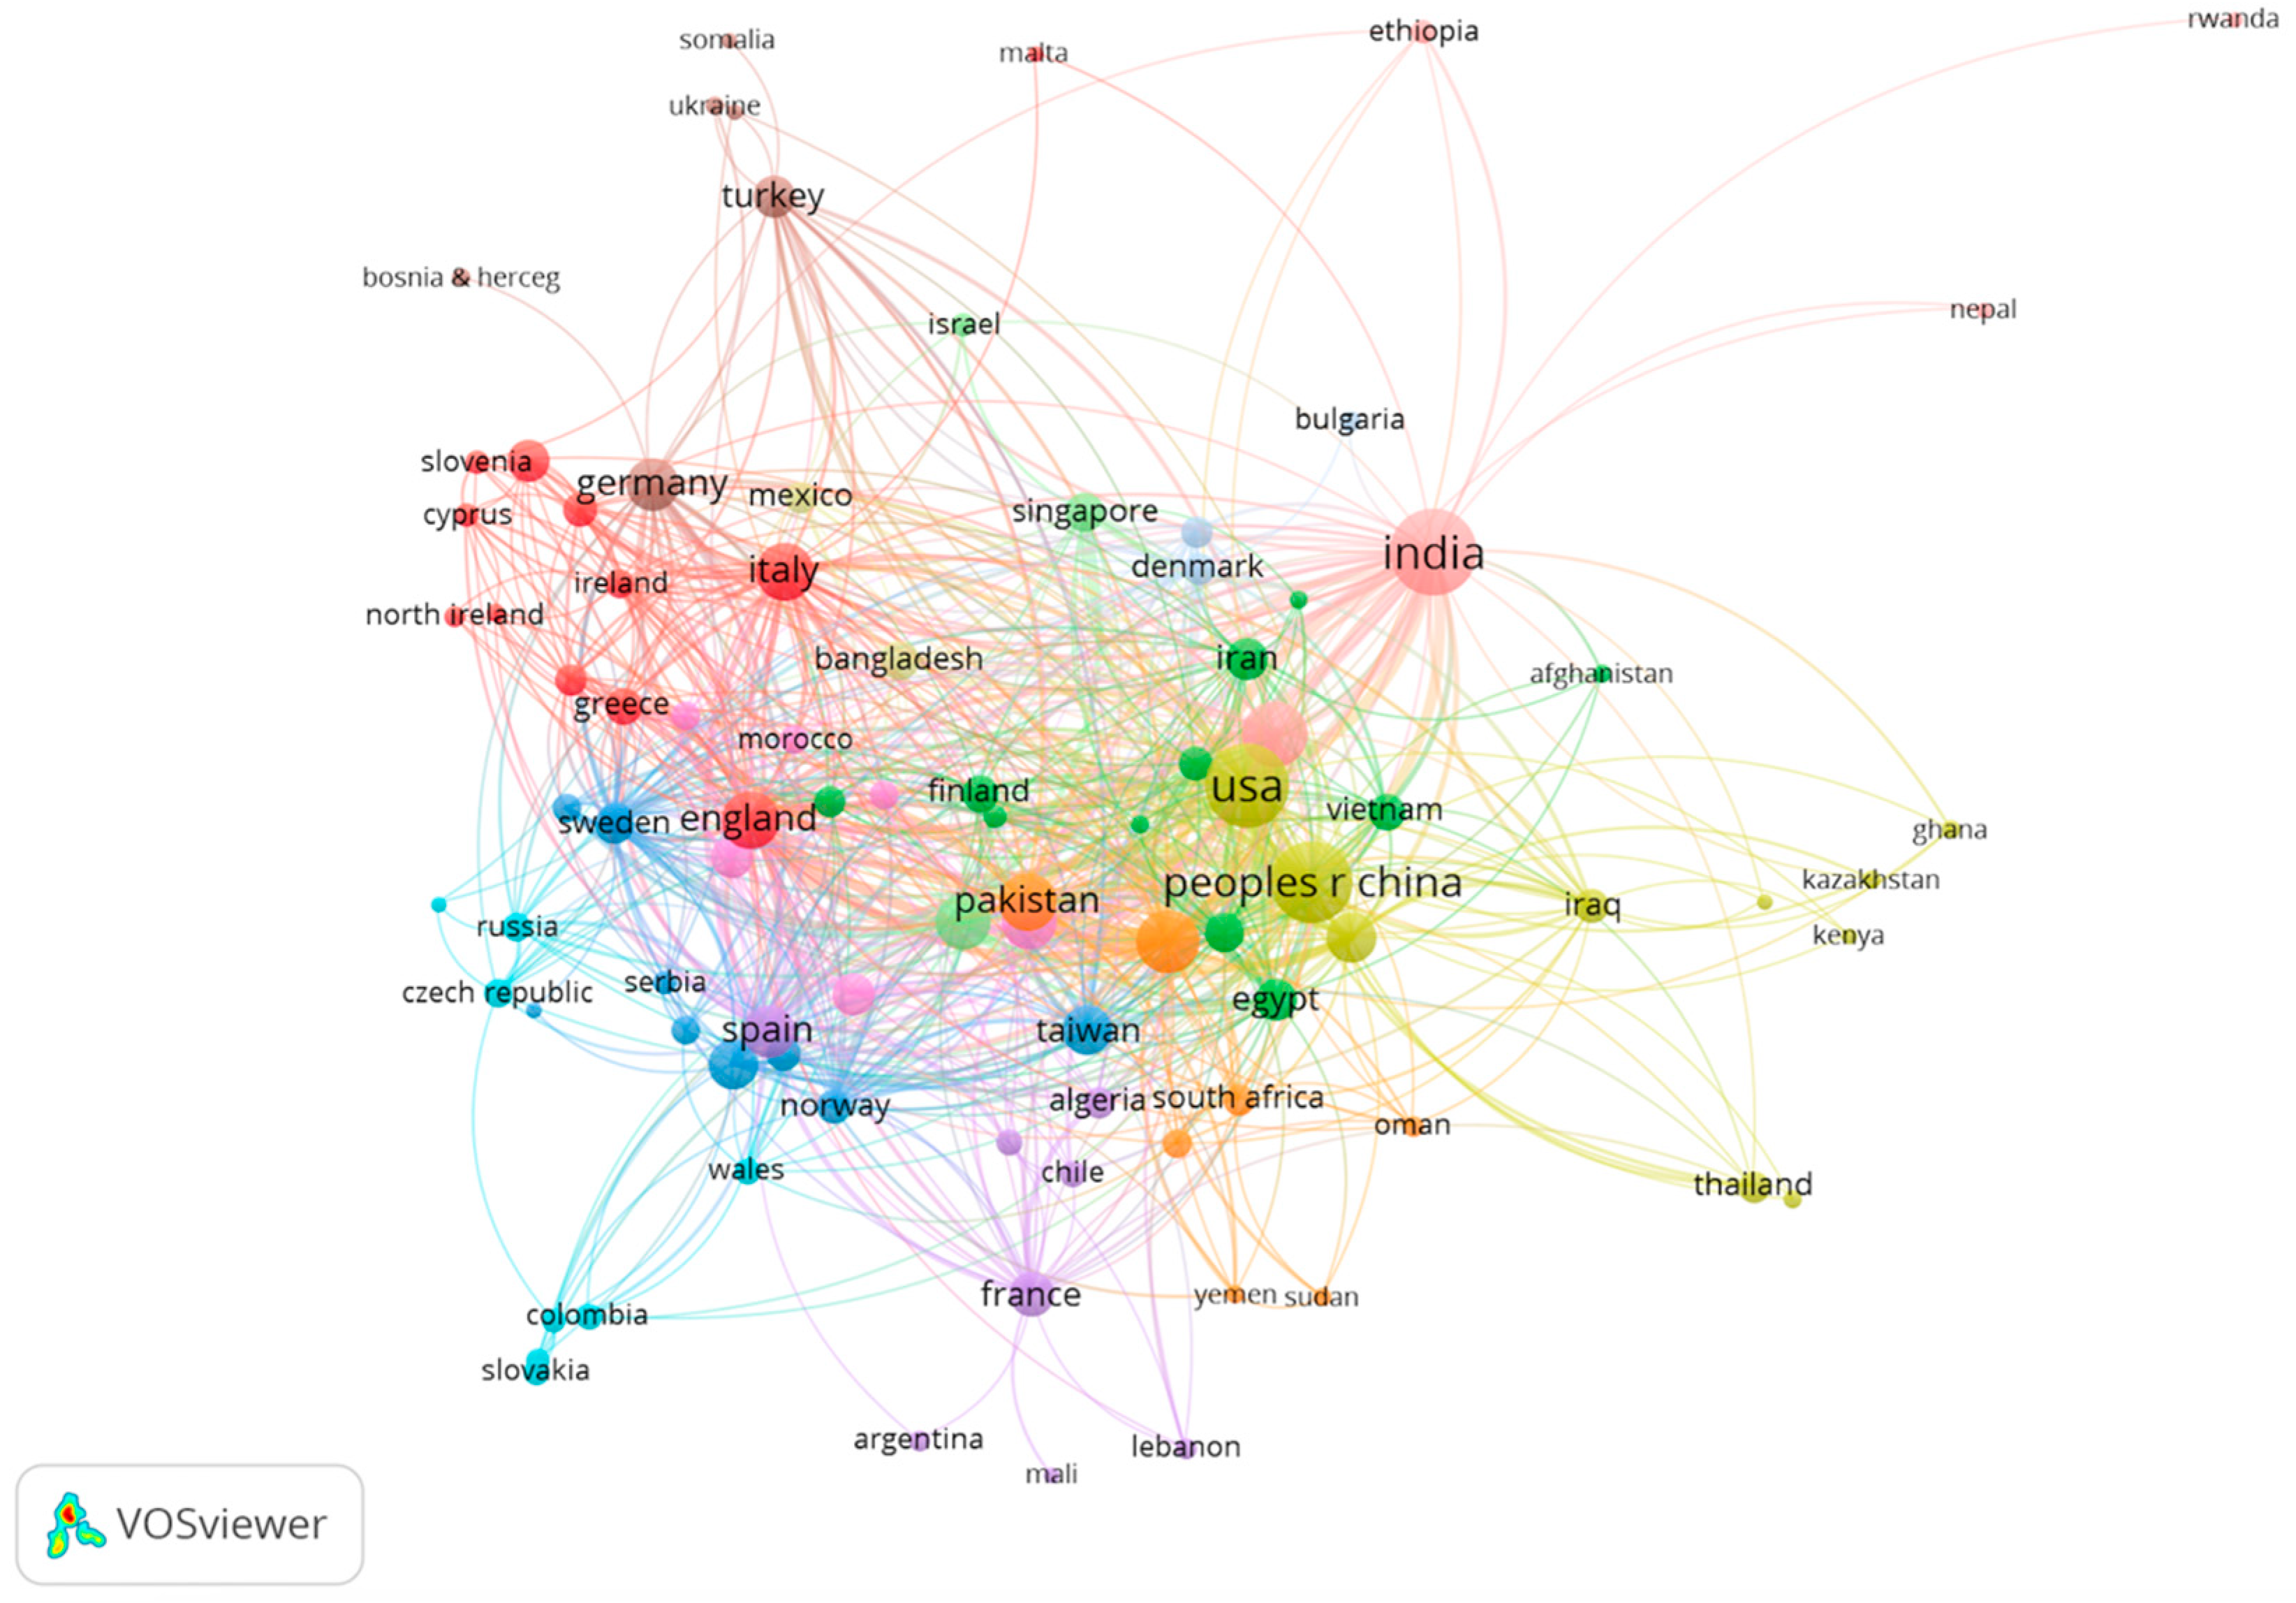
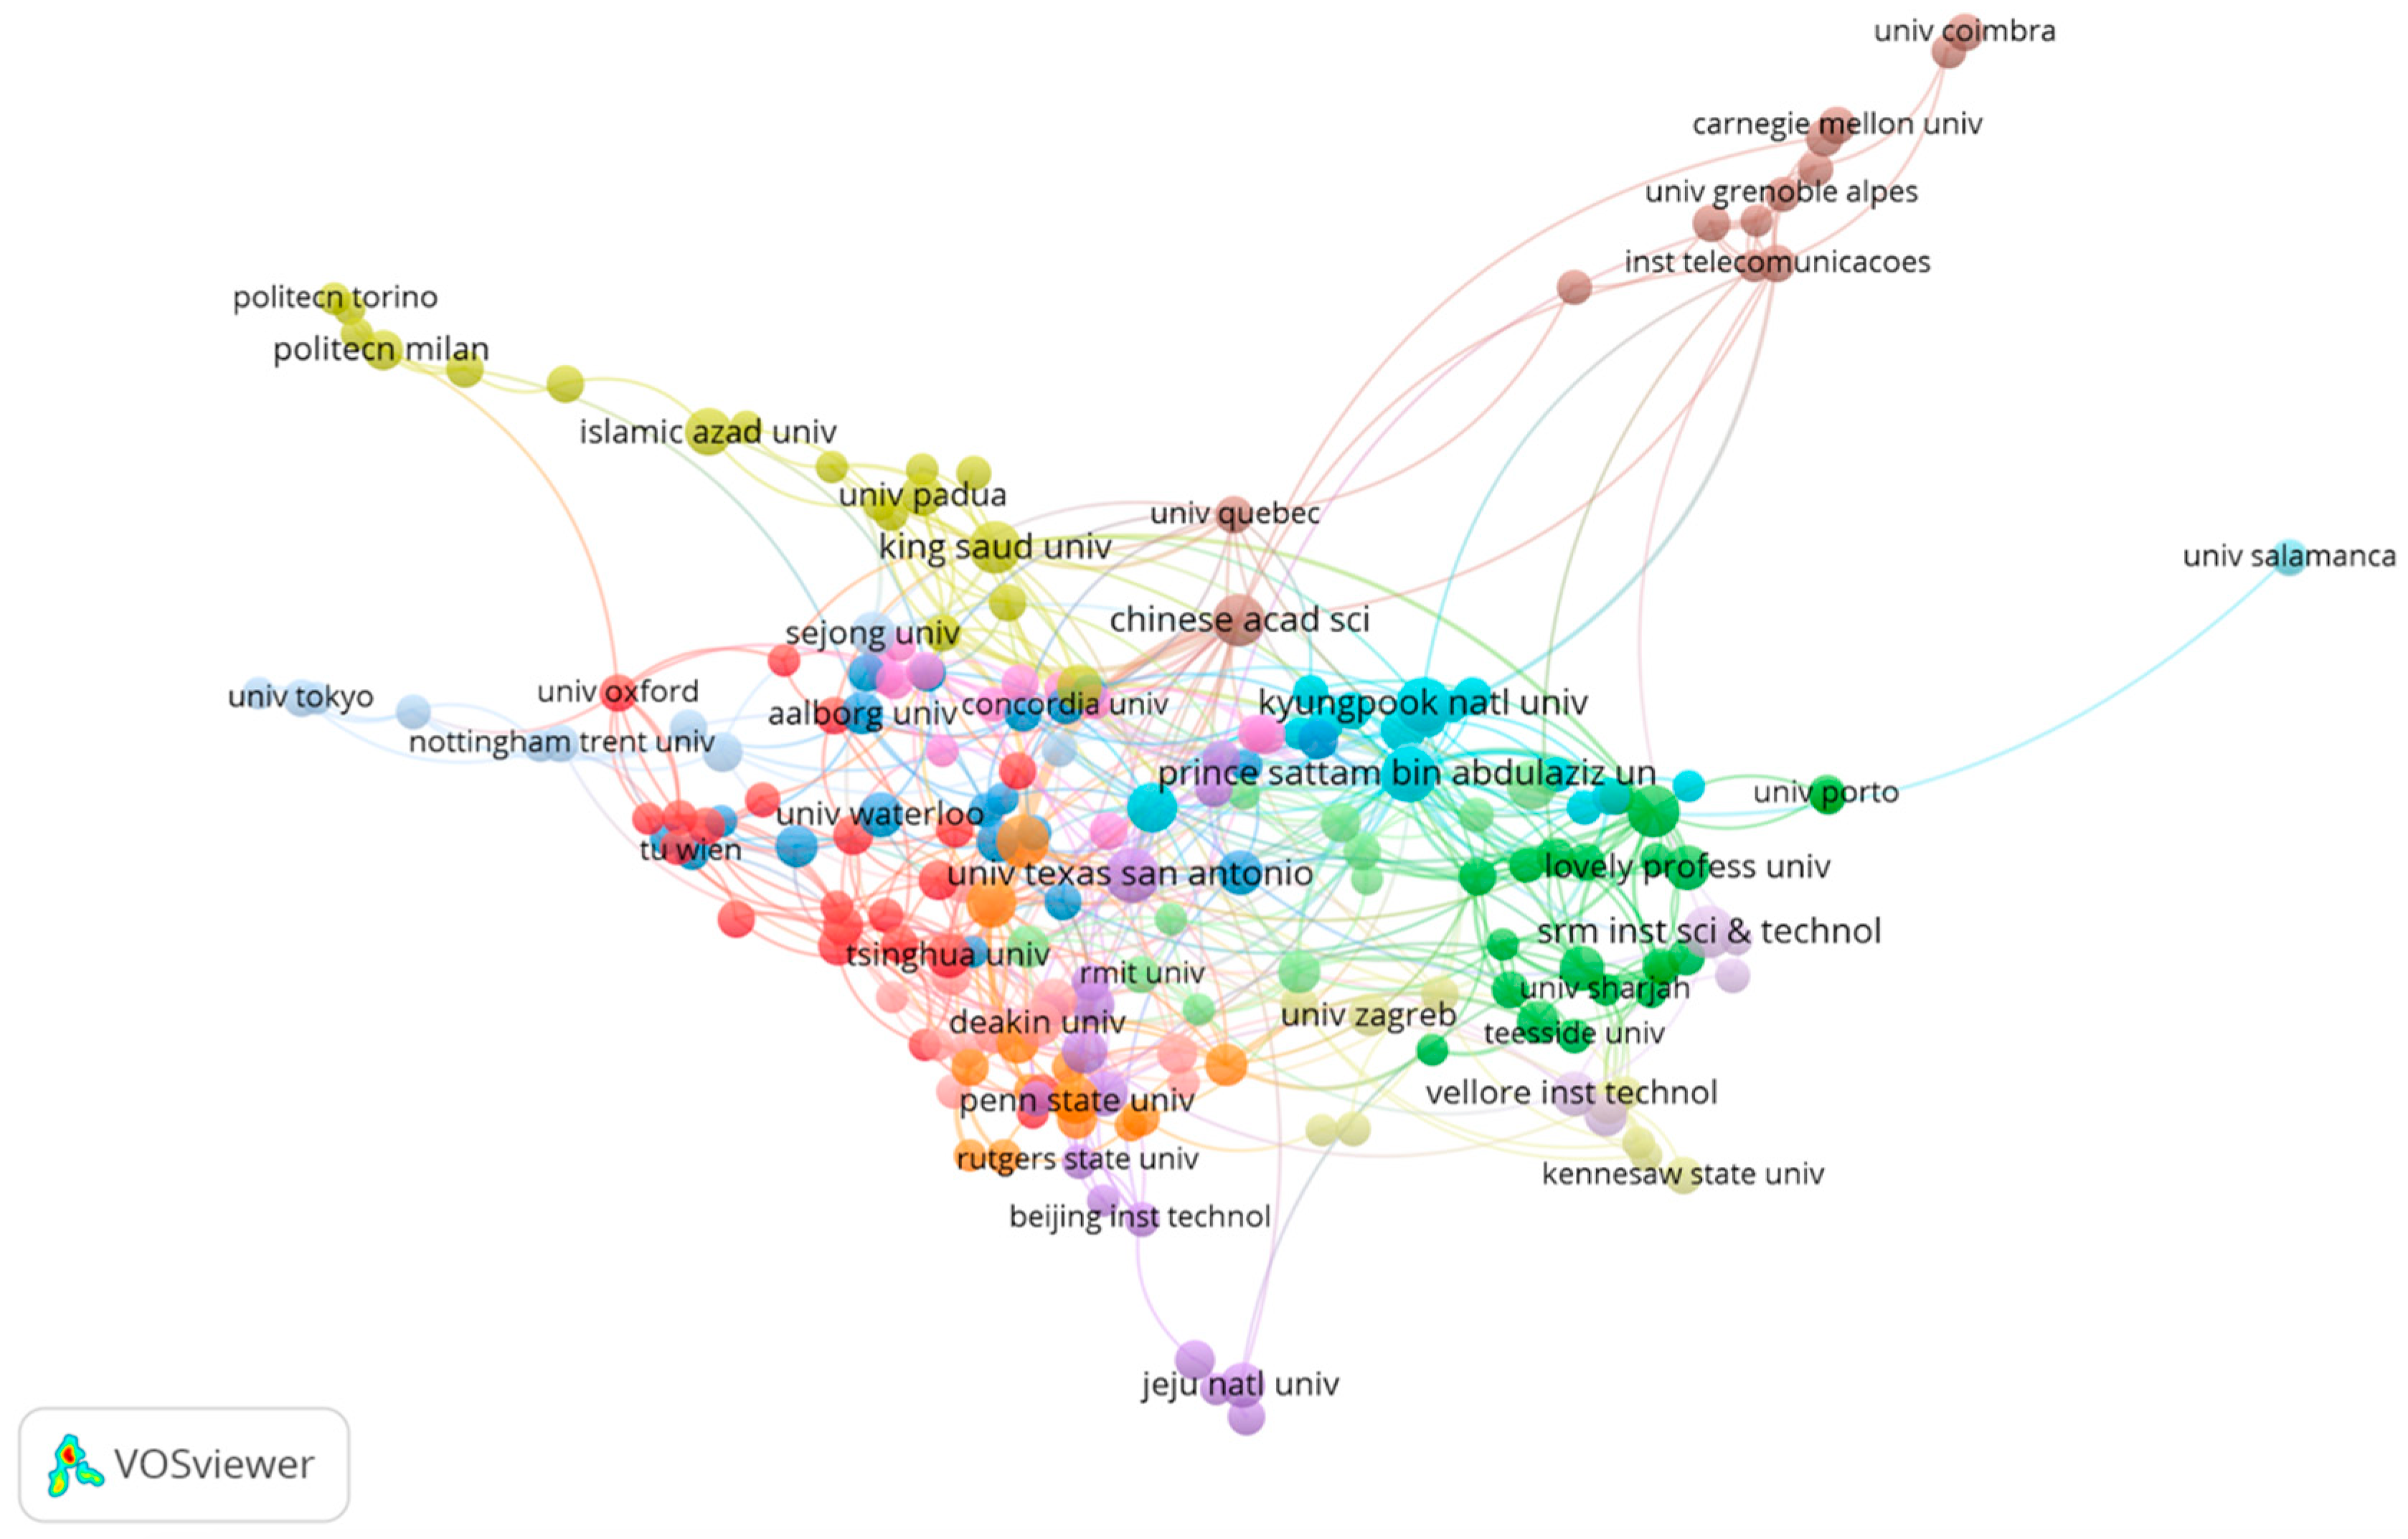
4.3. Co-Authorship Analysis
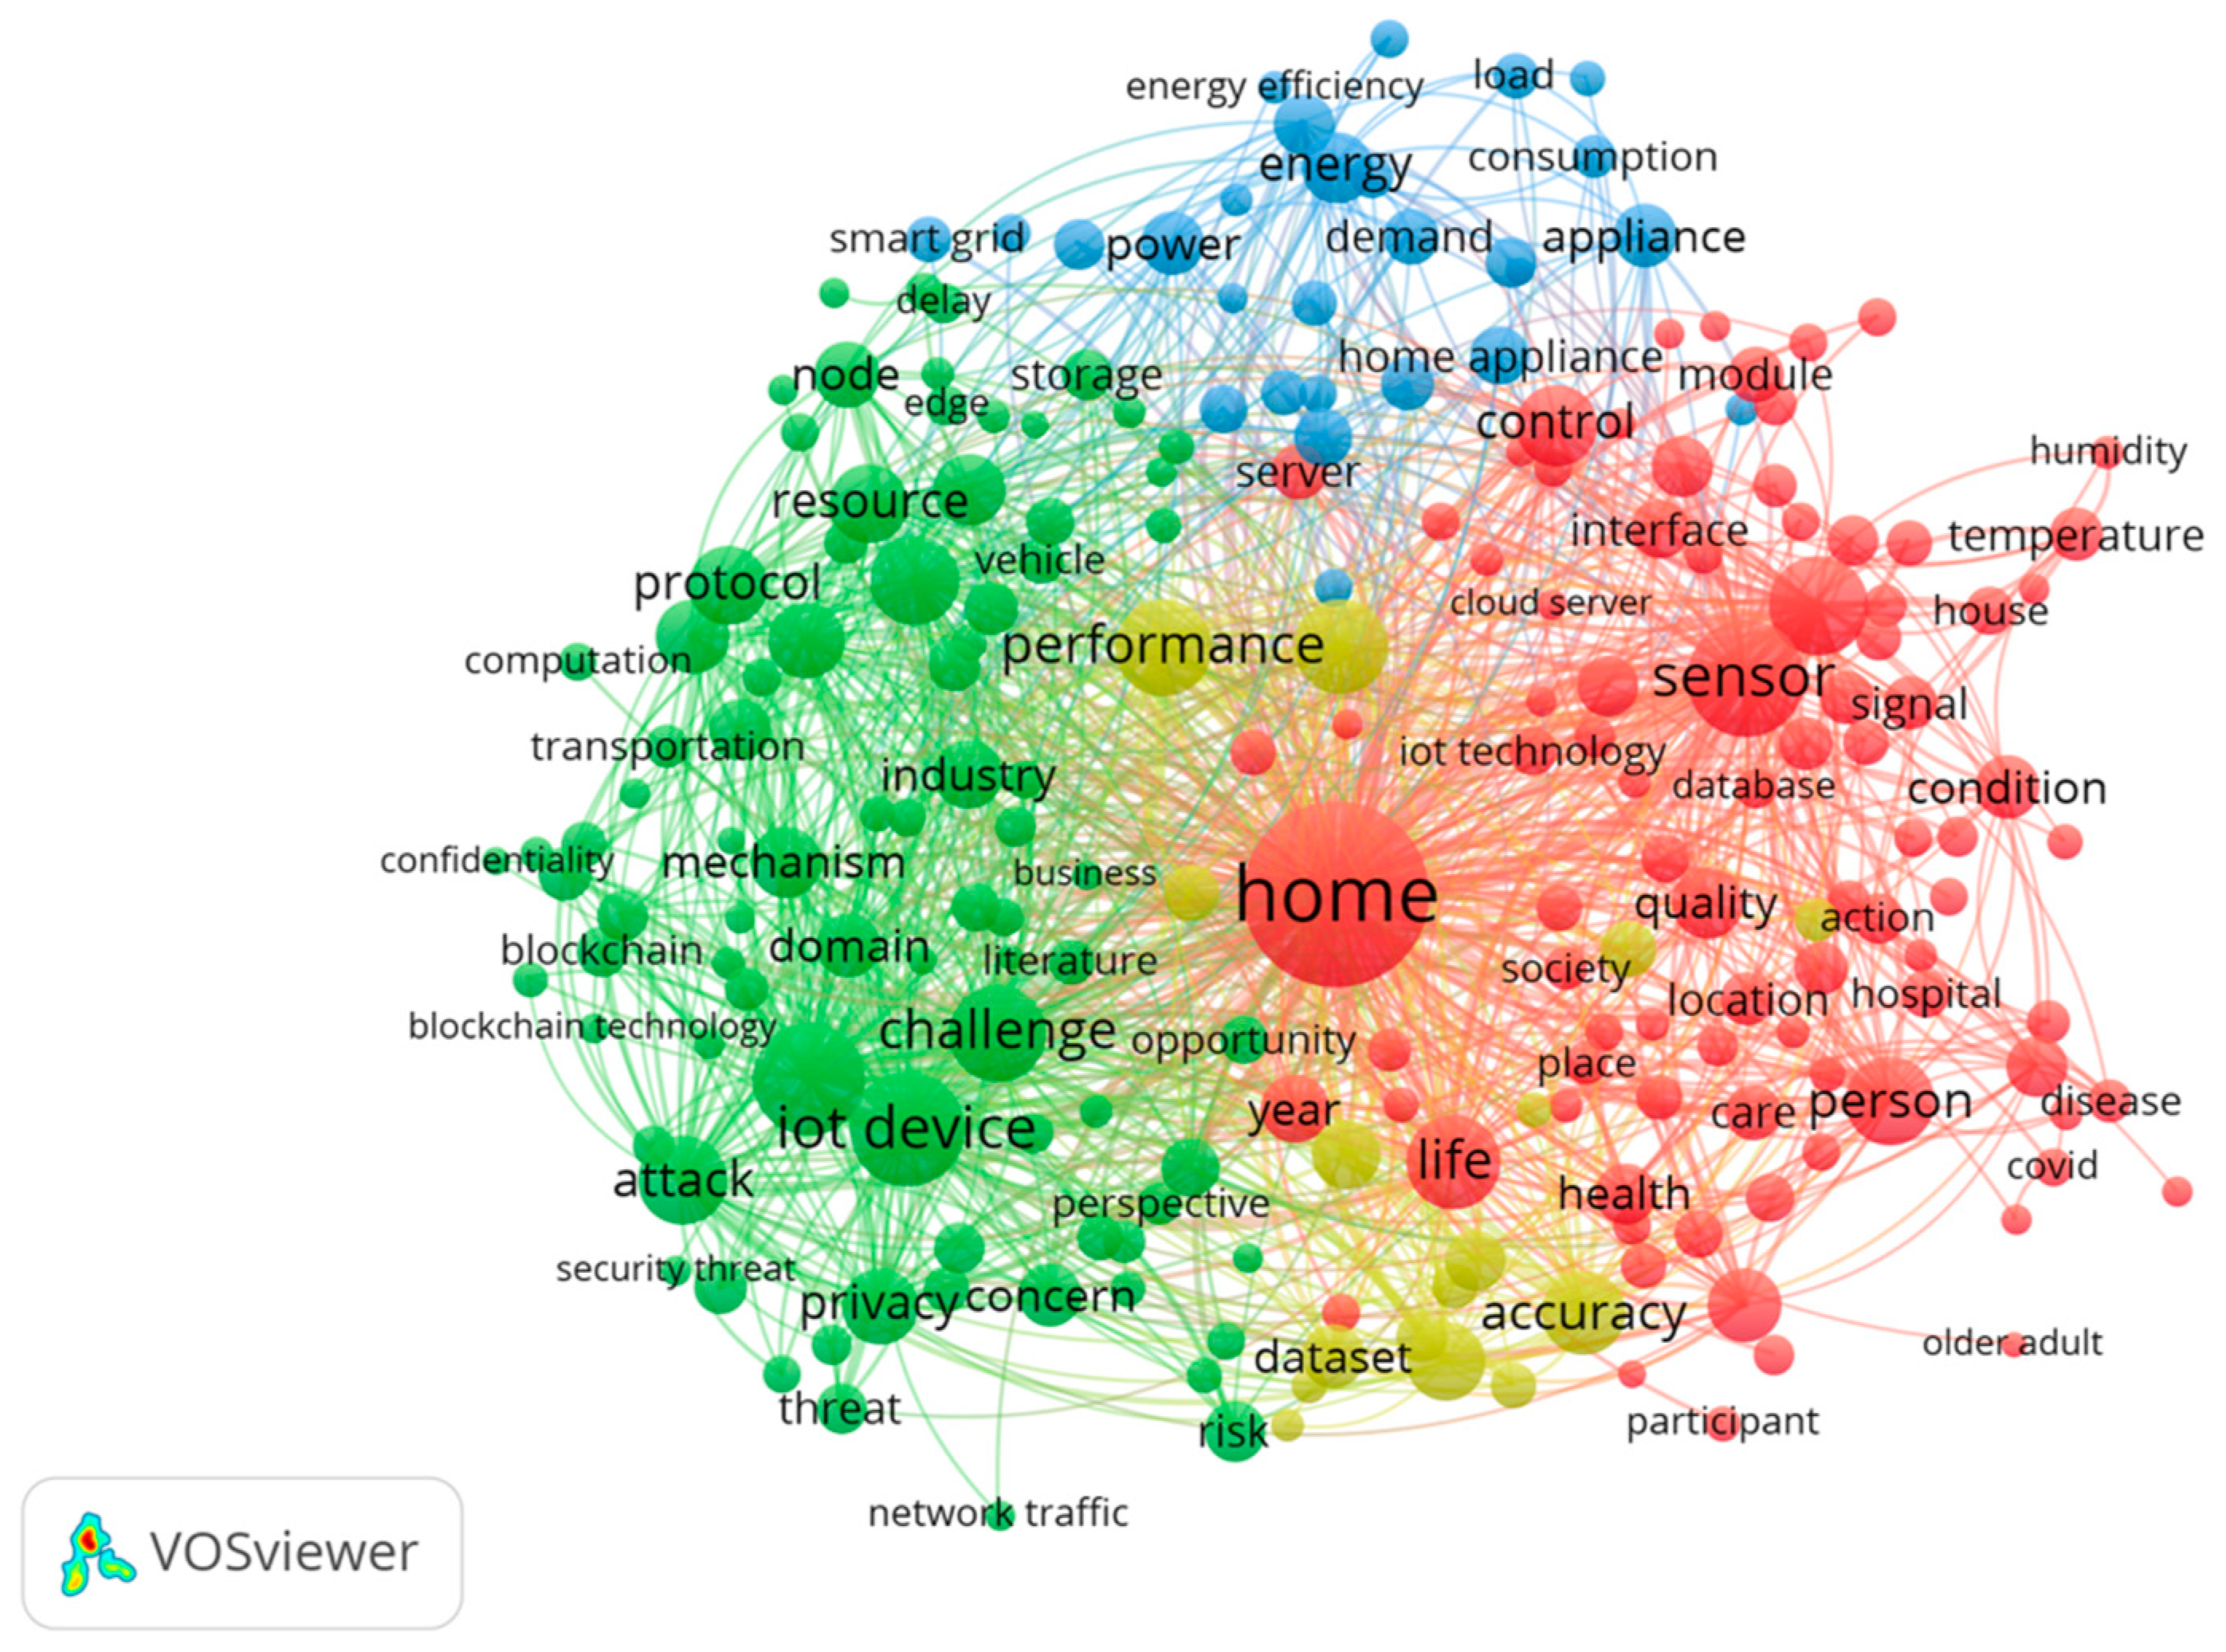
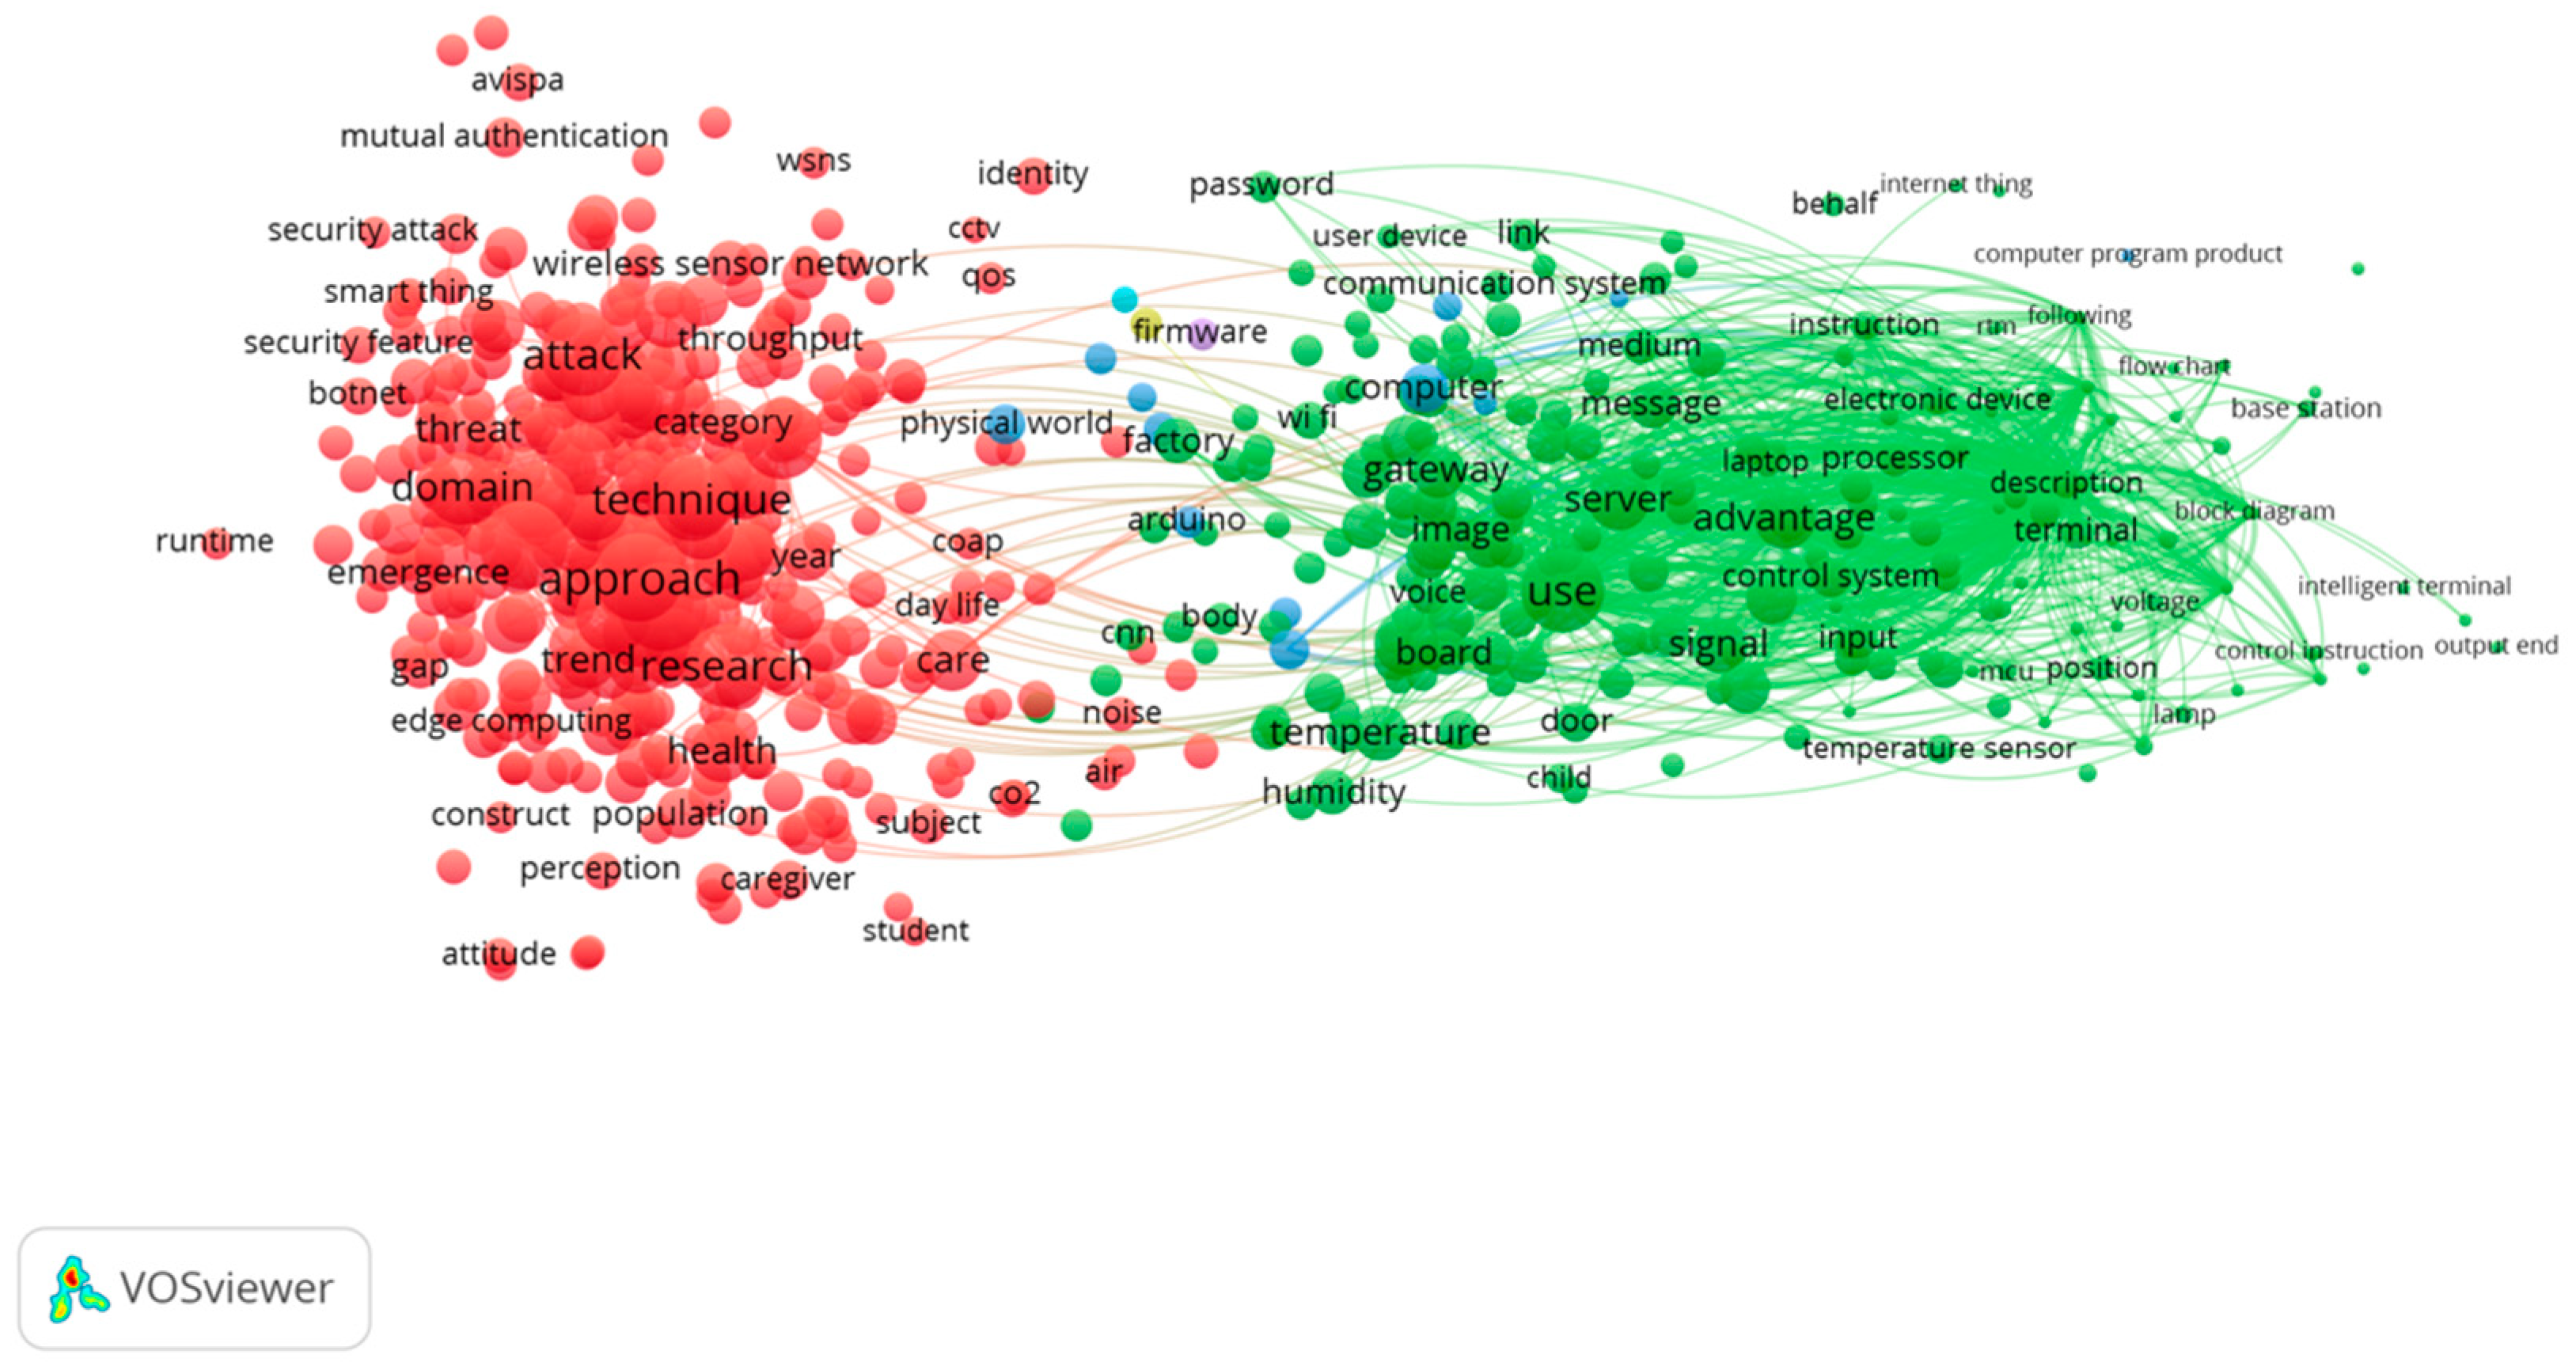
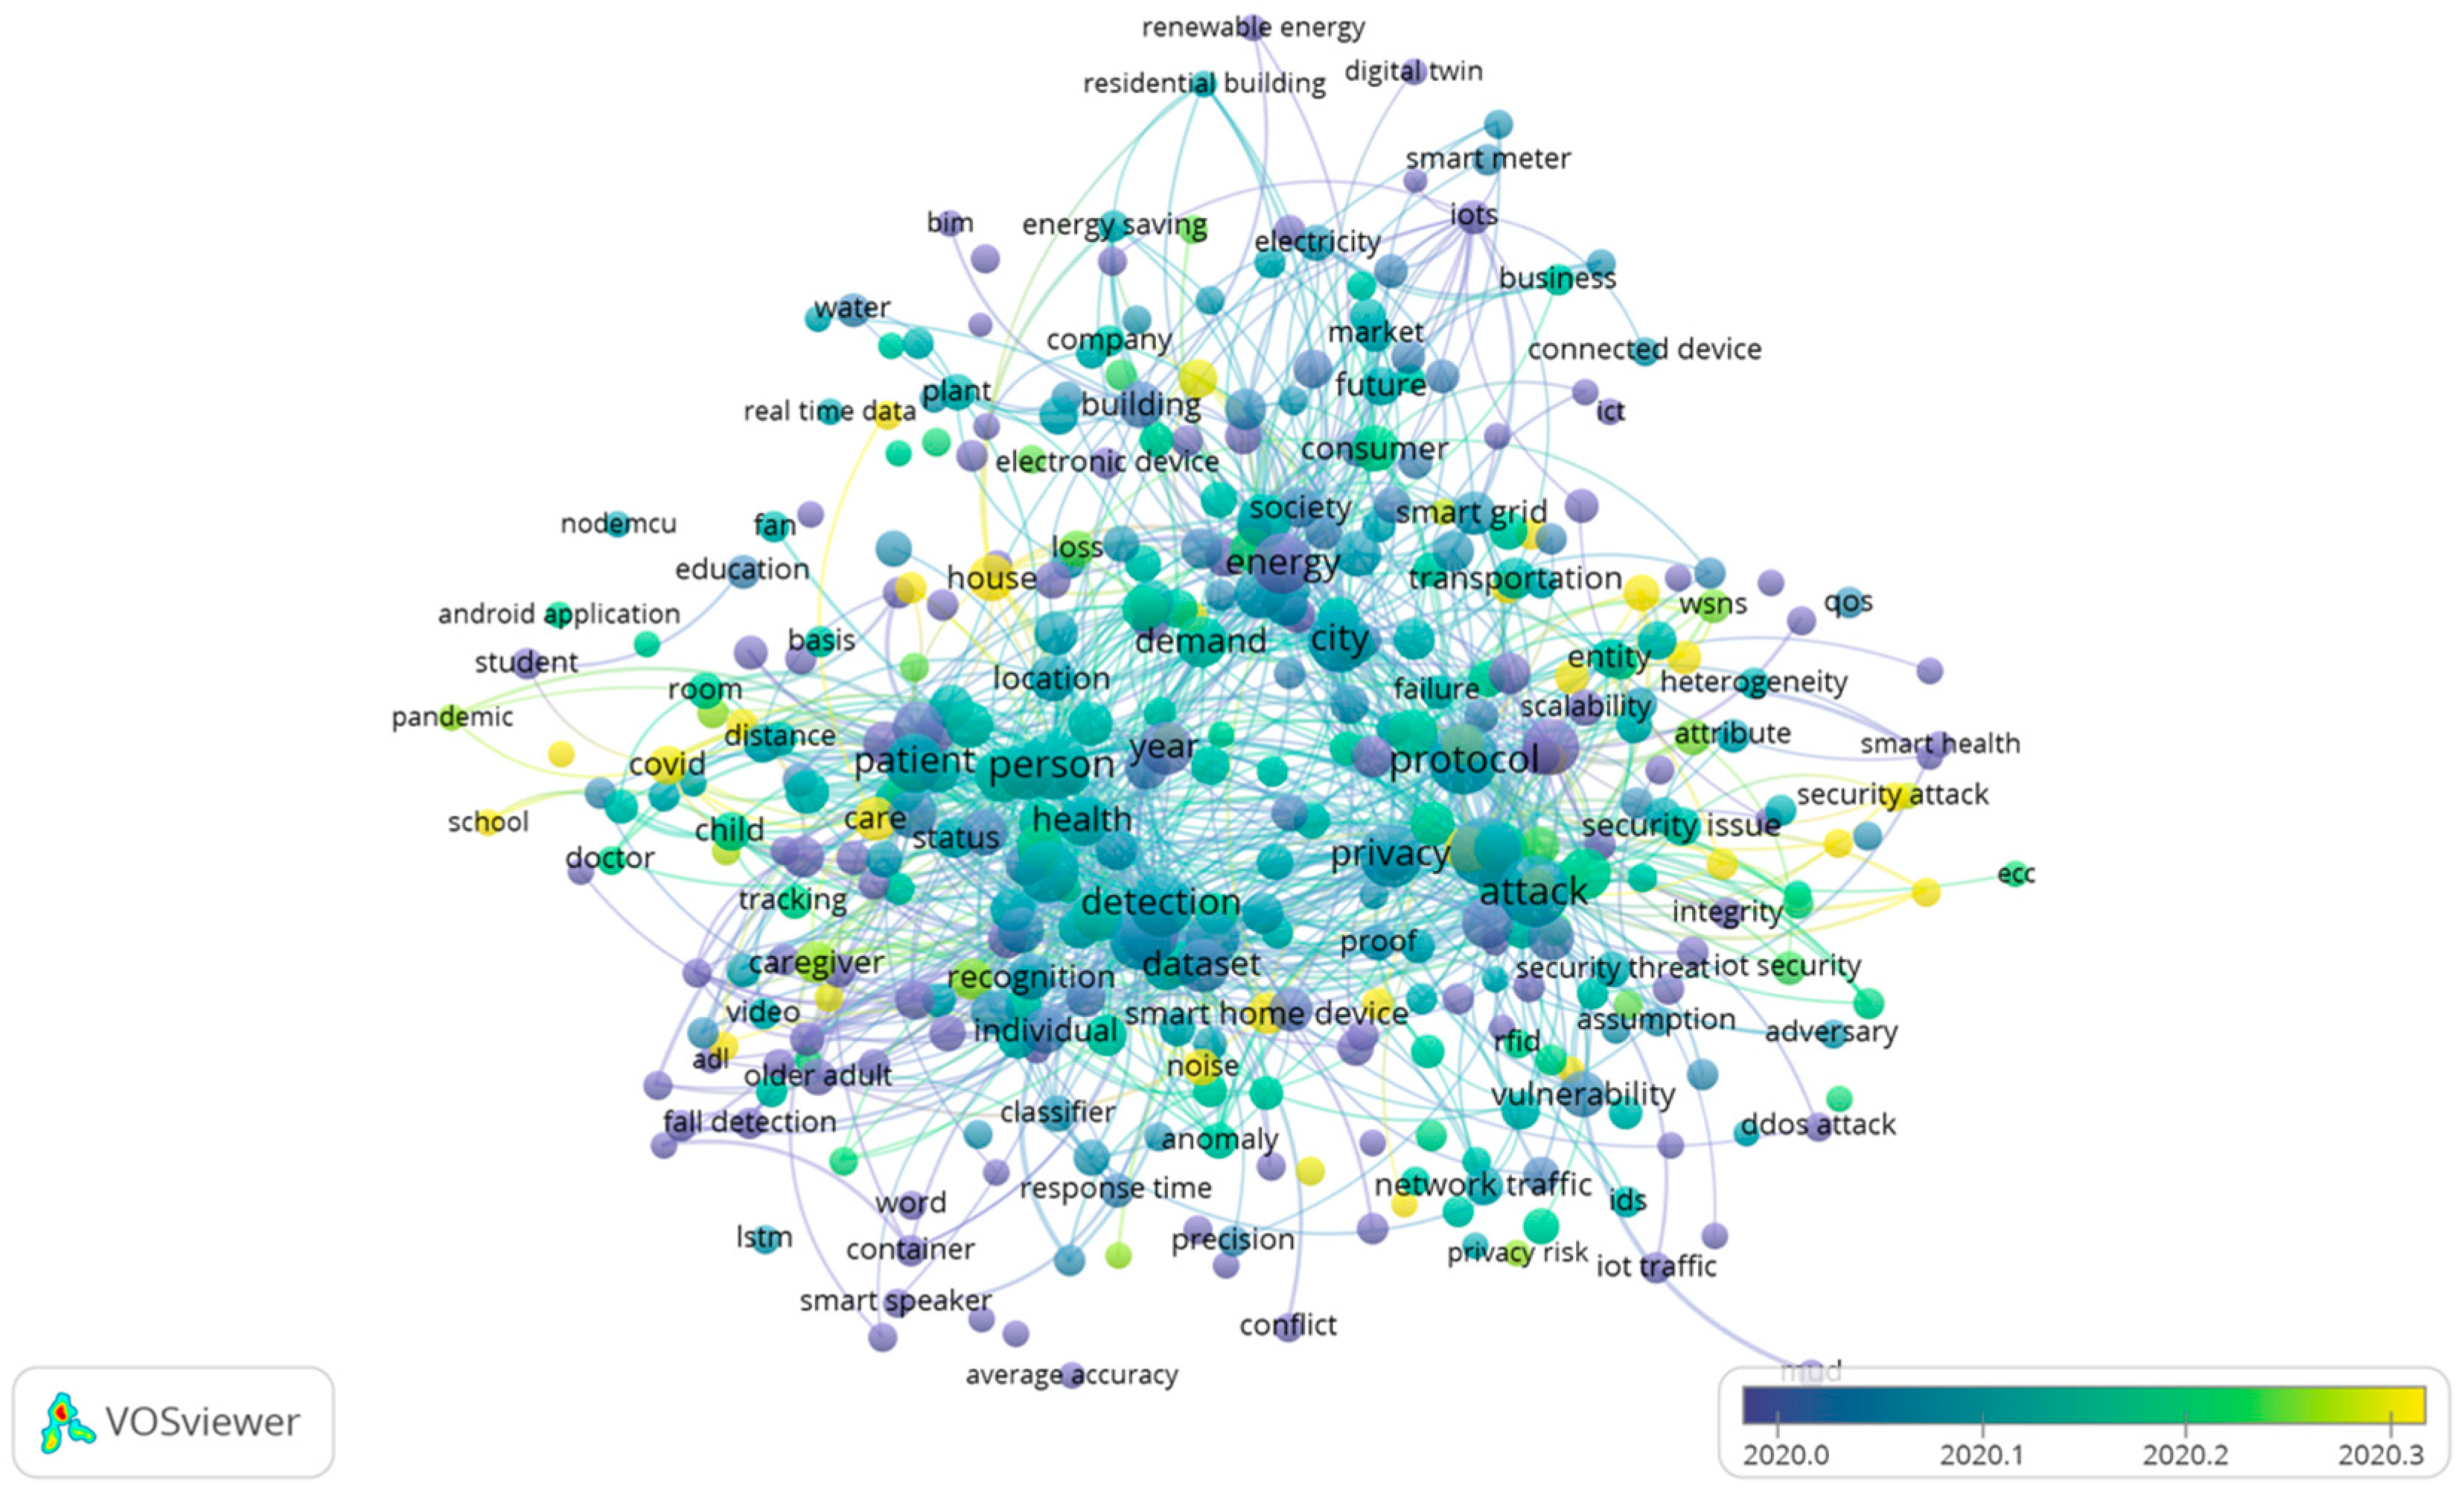
4.4. Co-Occurrence Analysis
- Application
- Risk and Security
- Data Management
- Energy
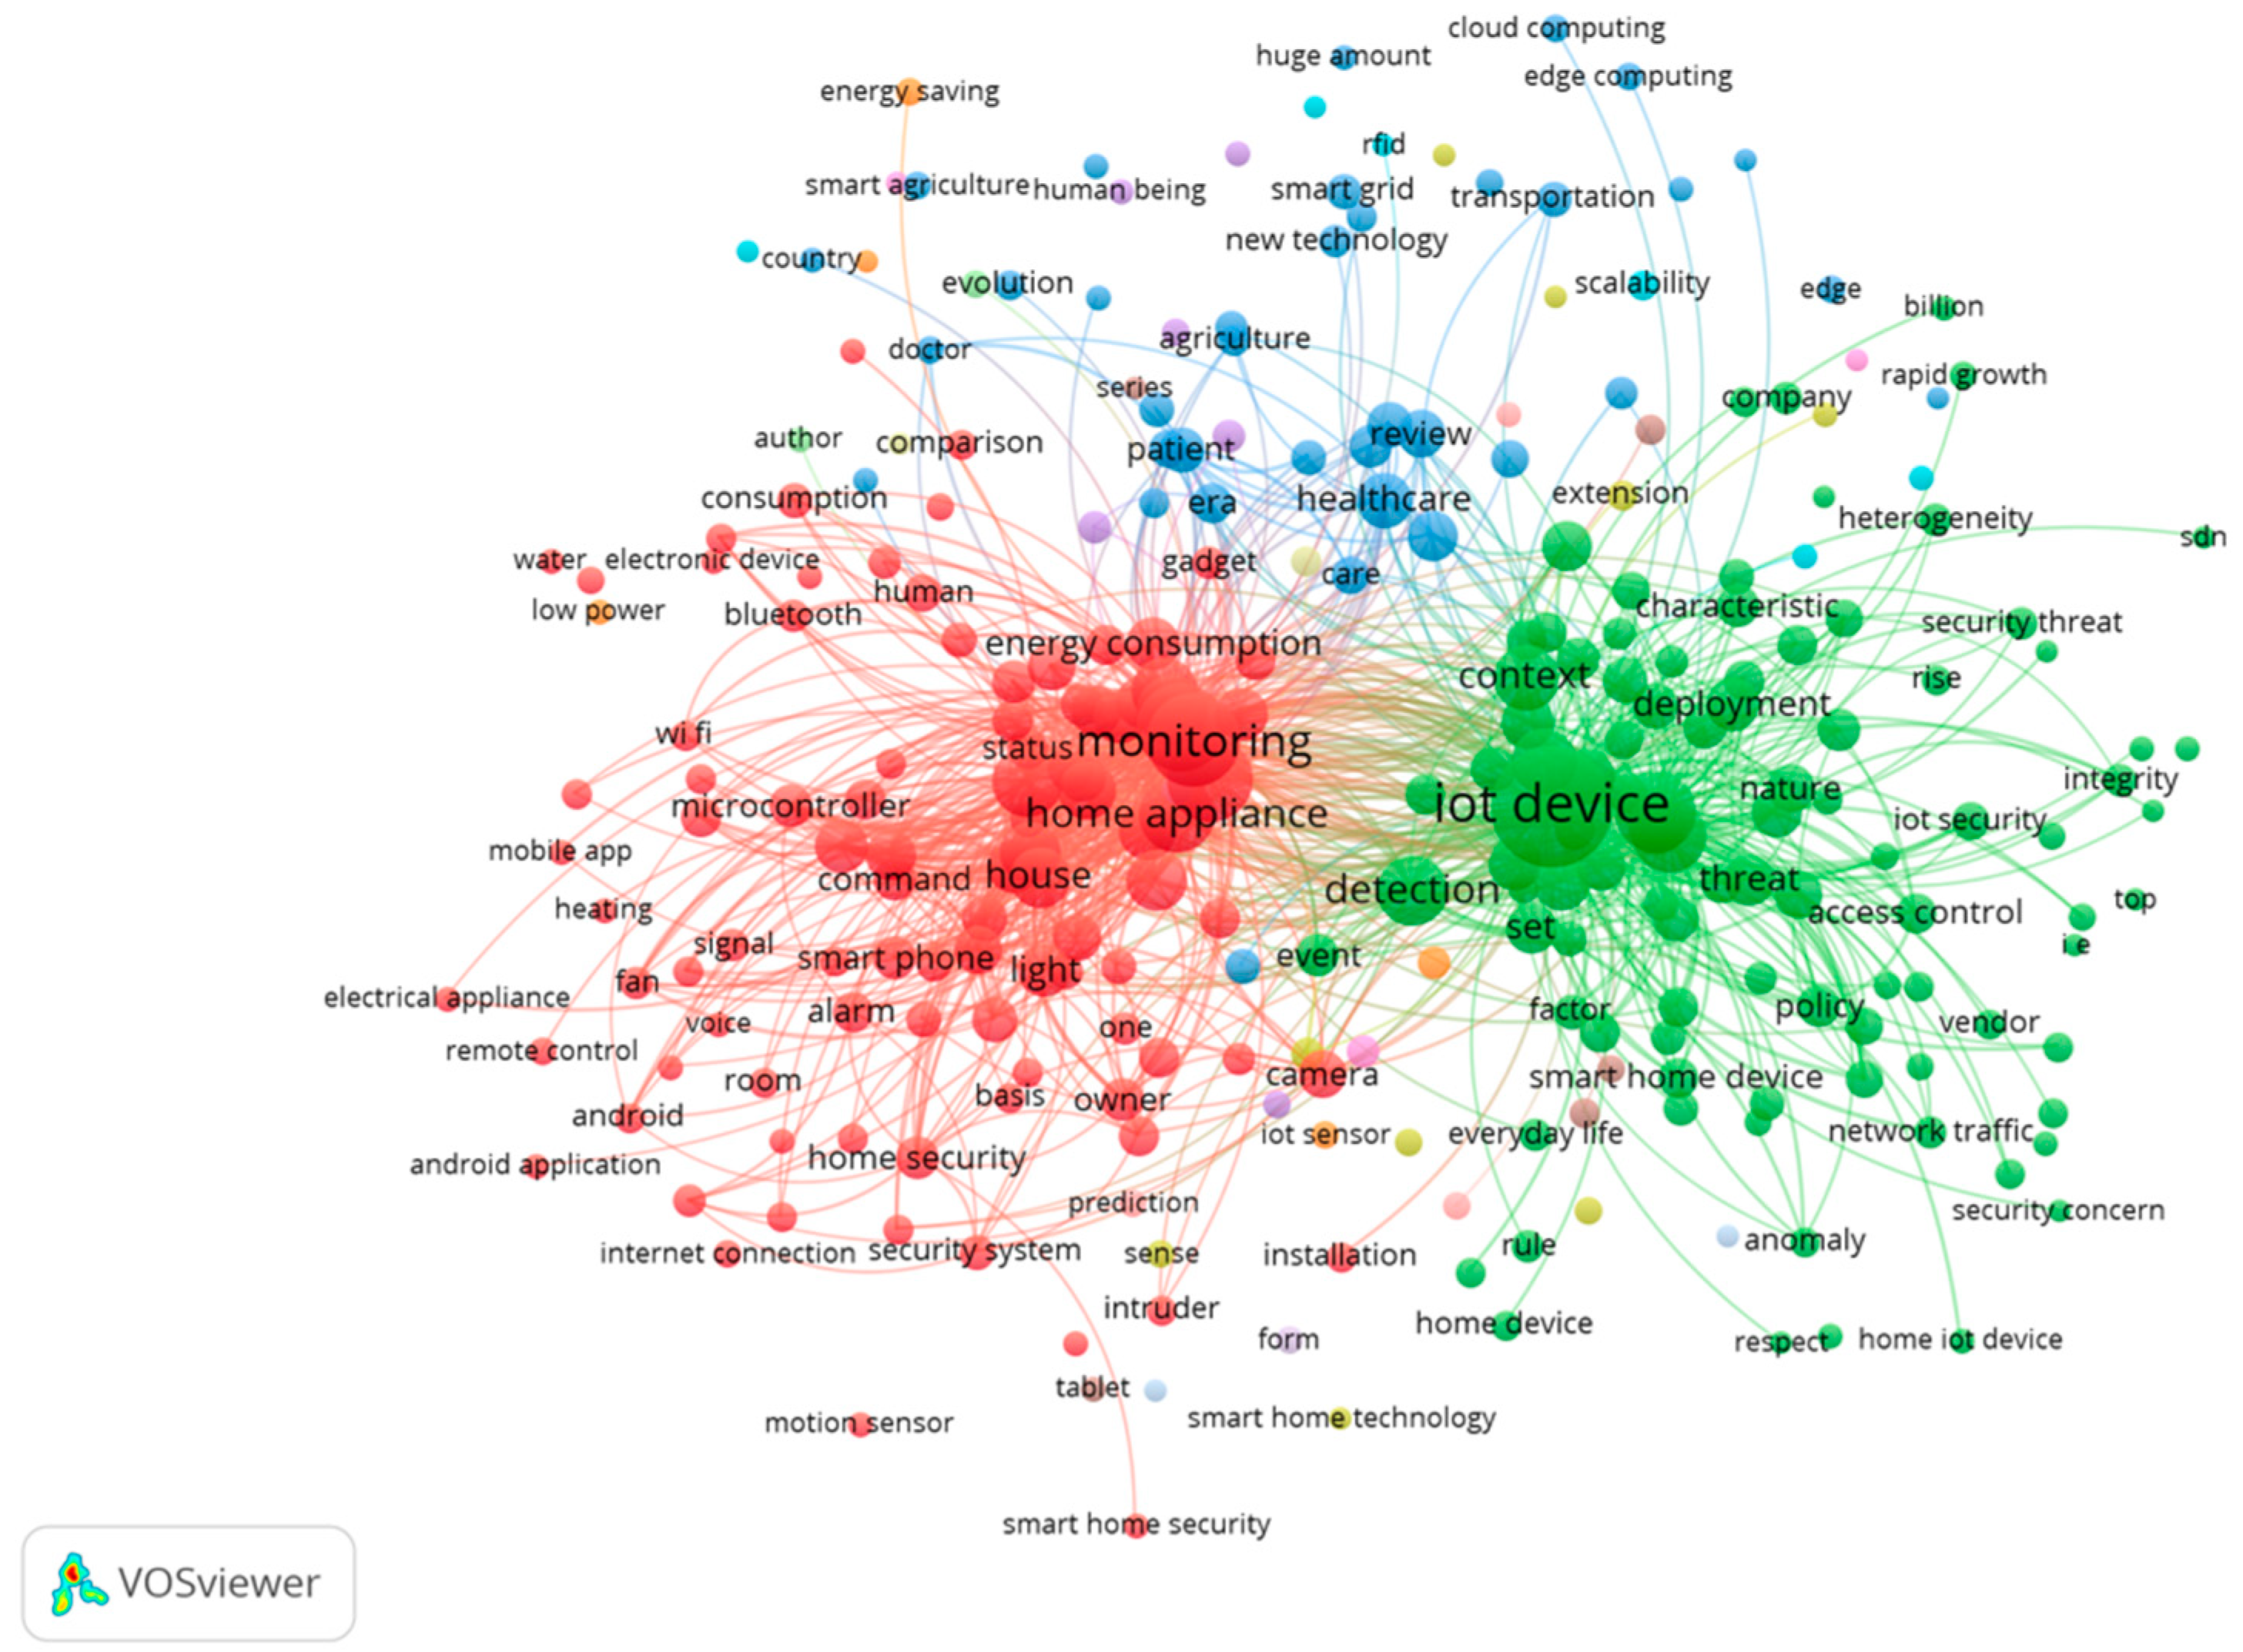
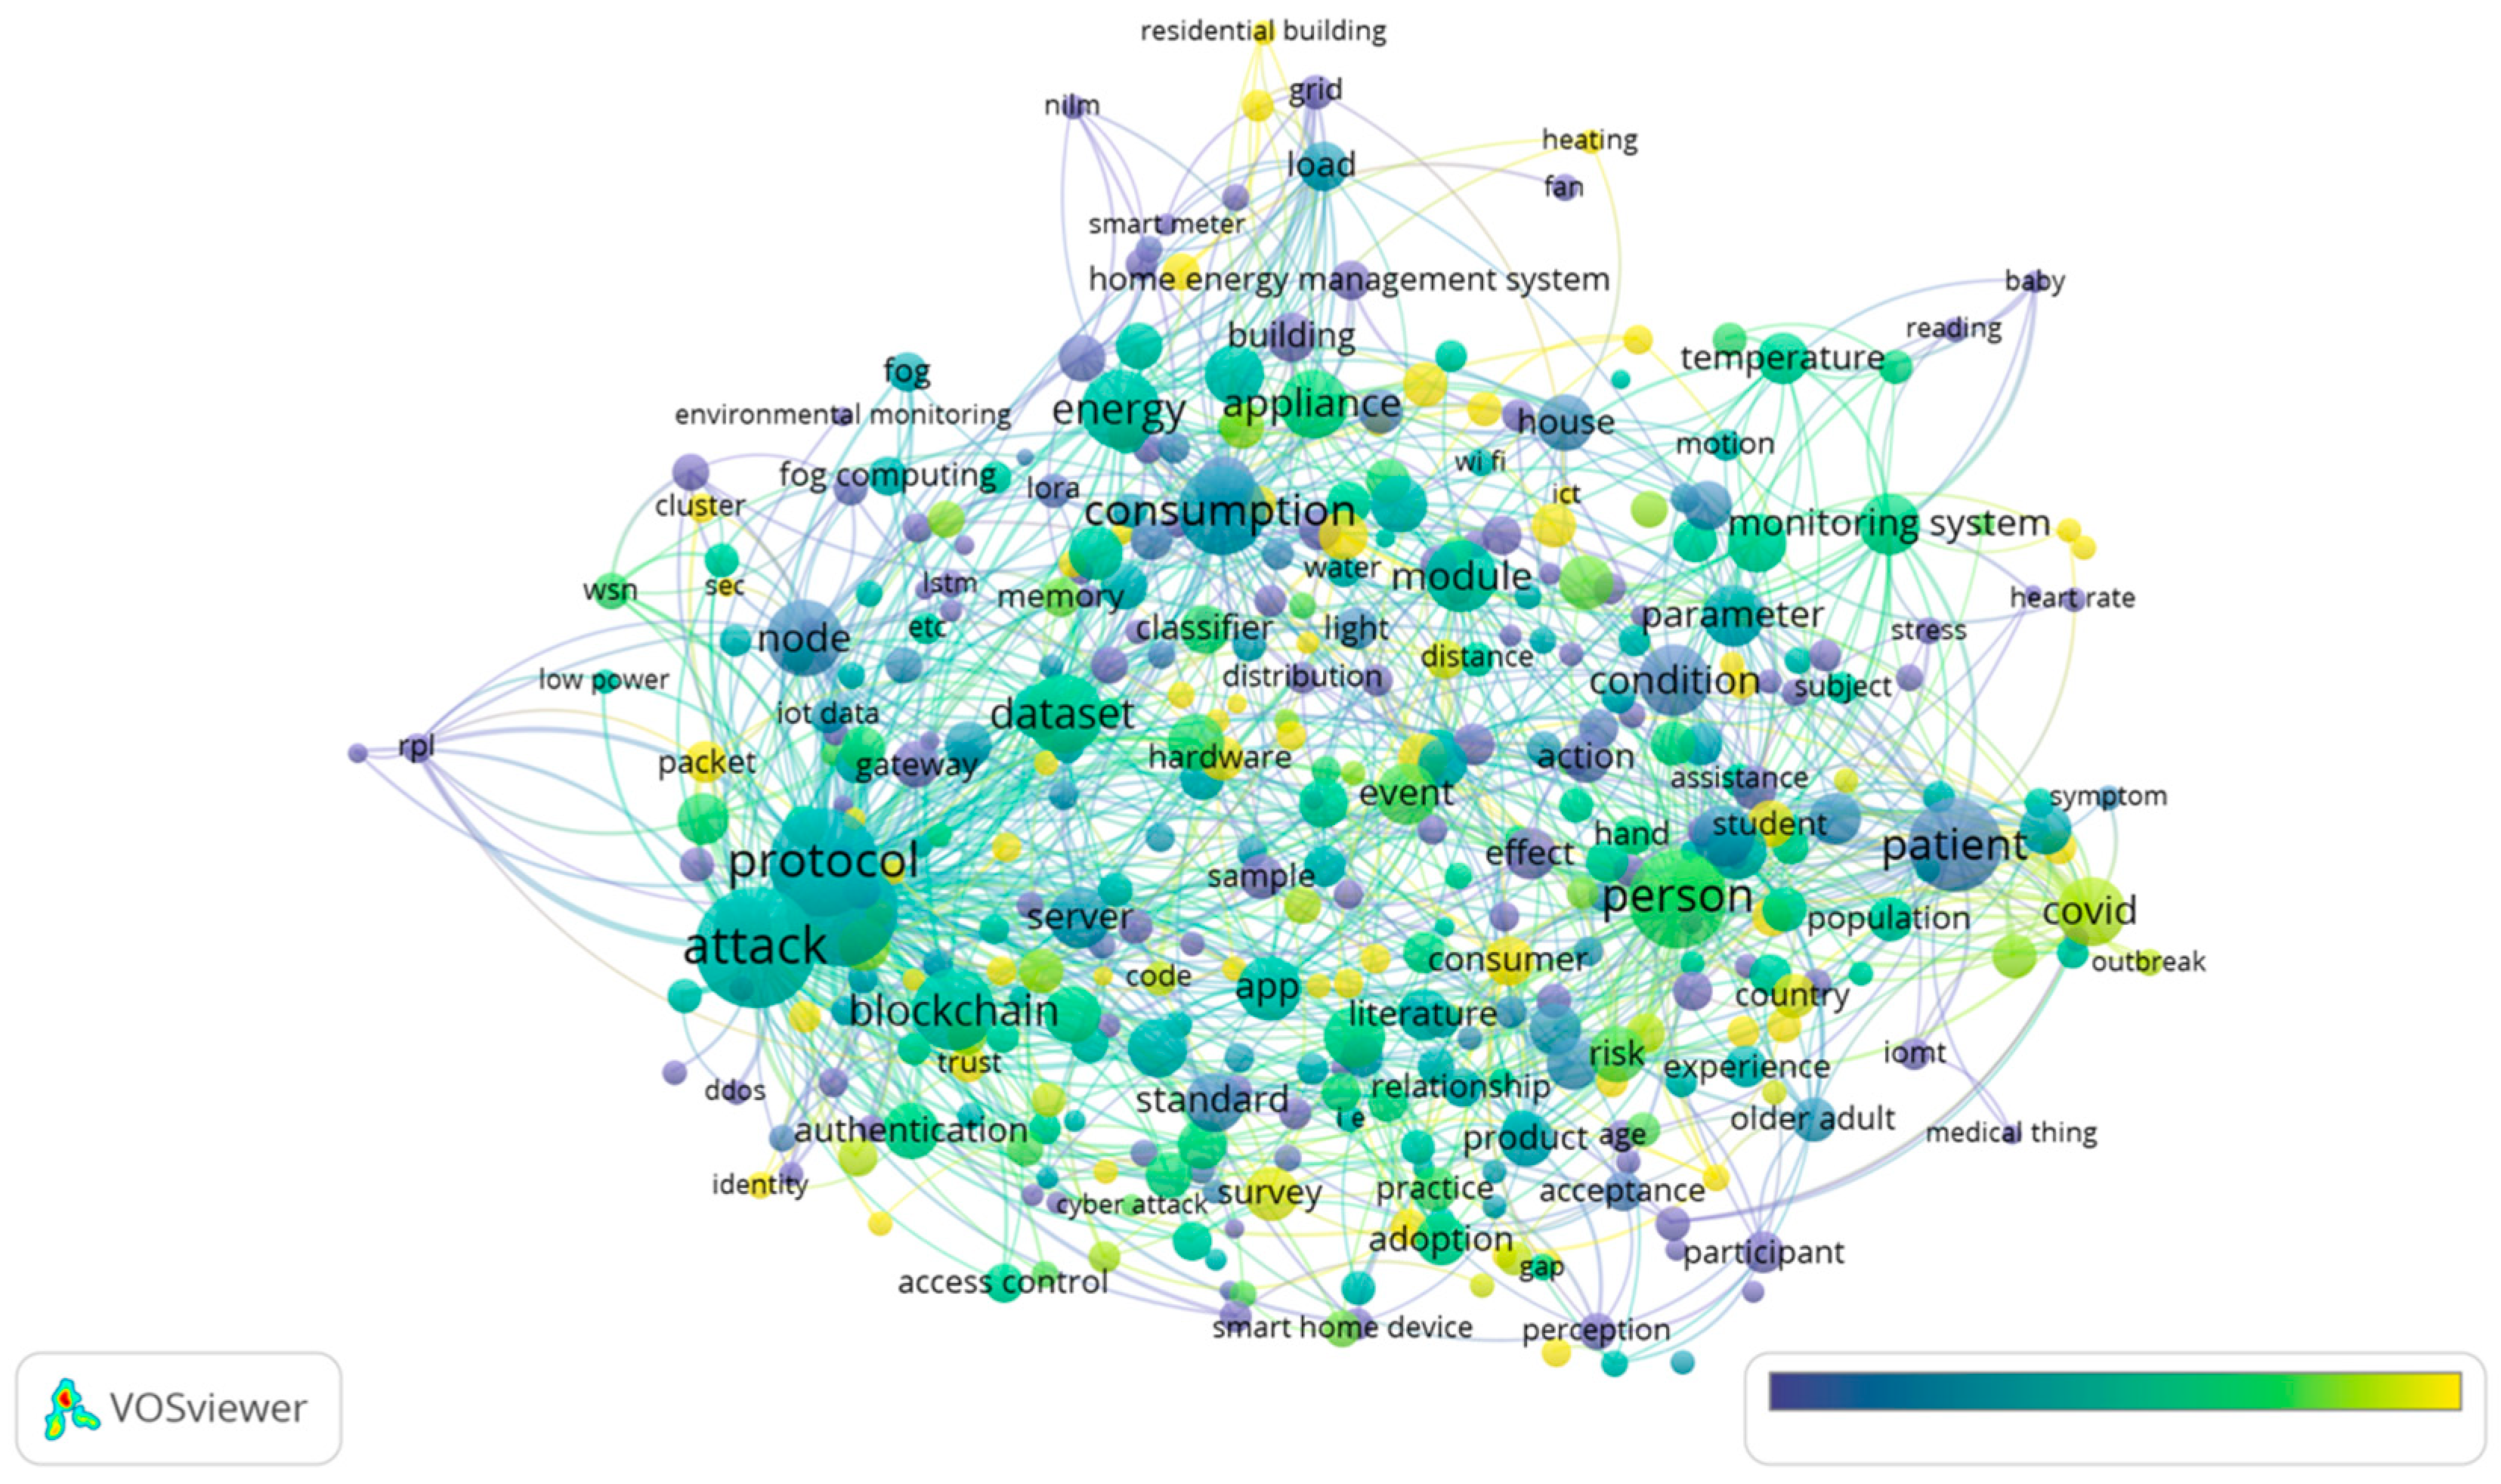
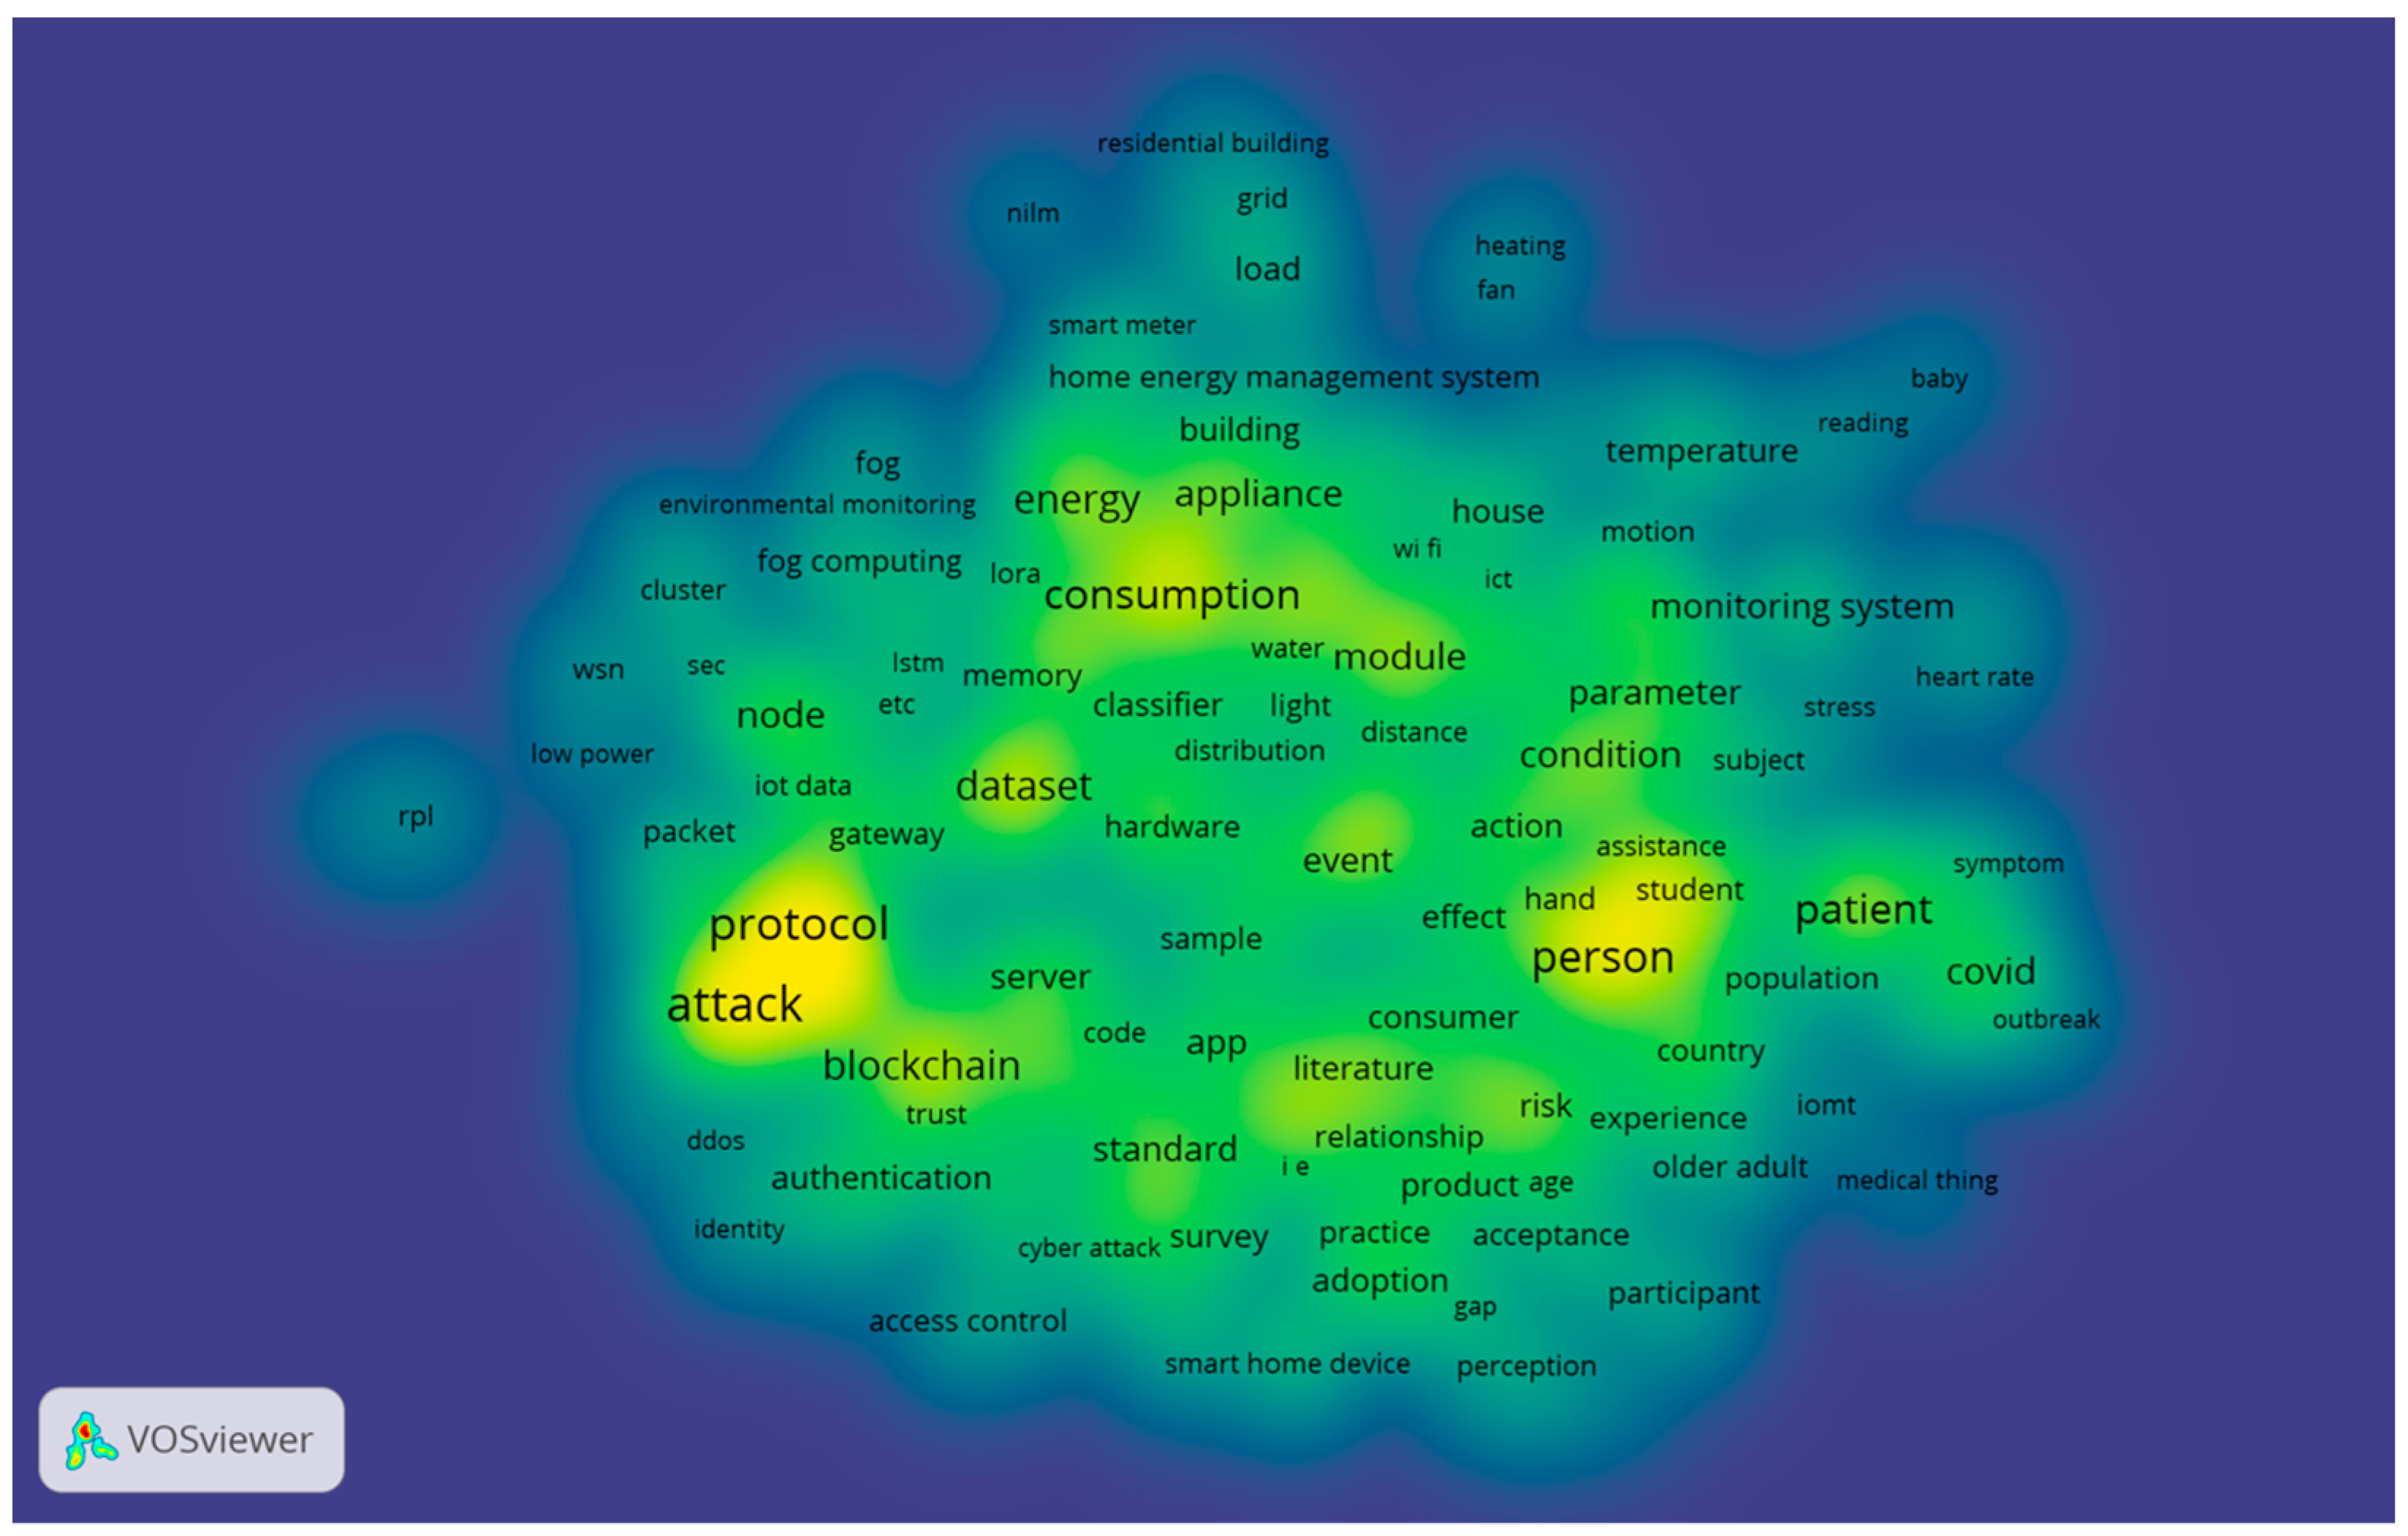
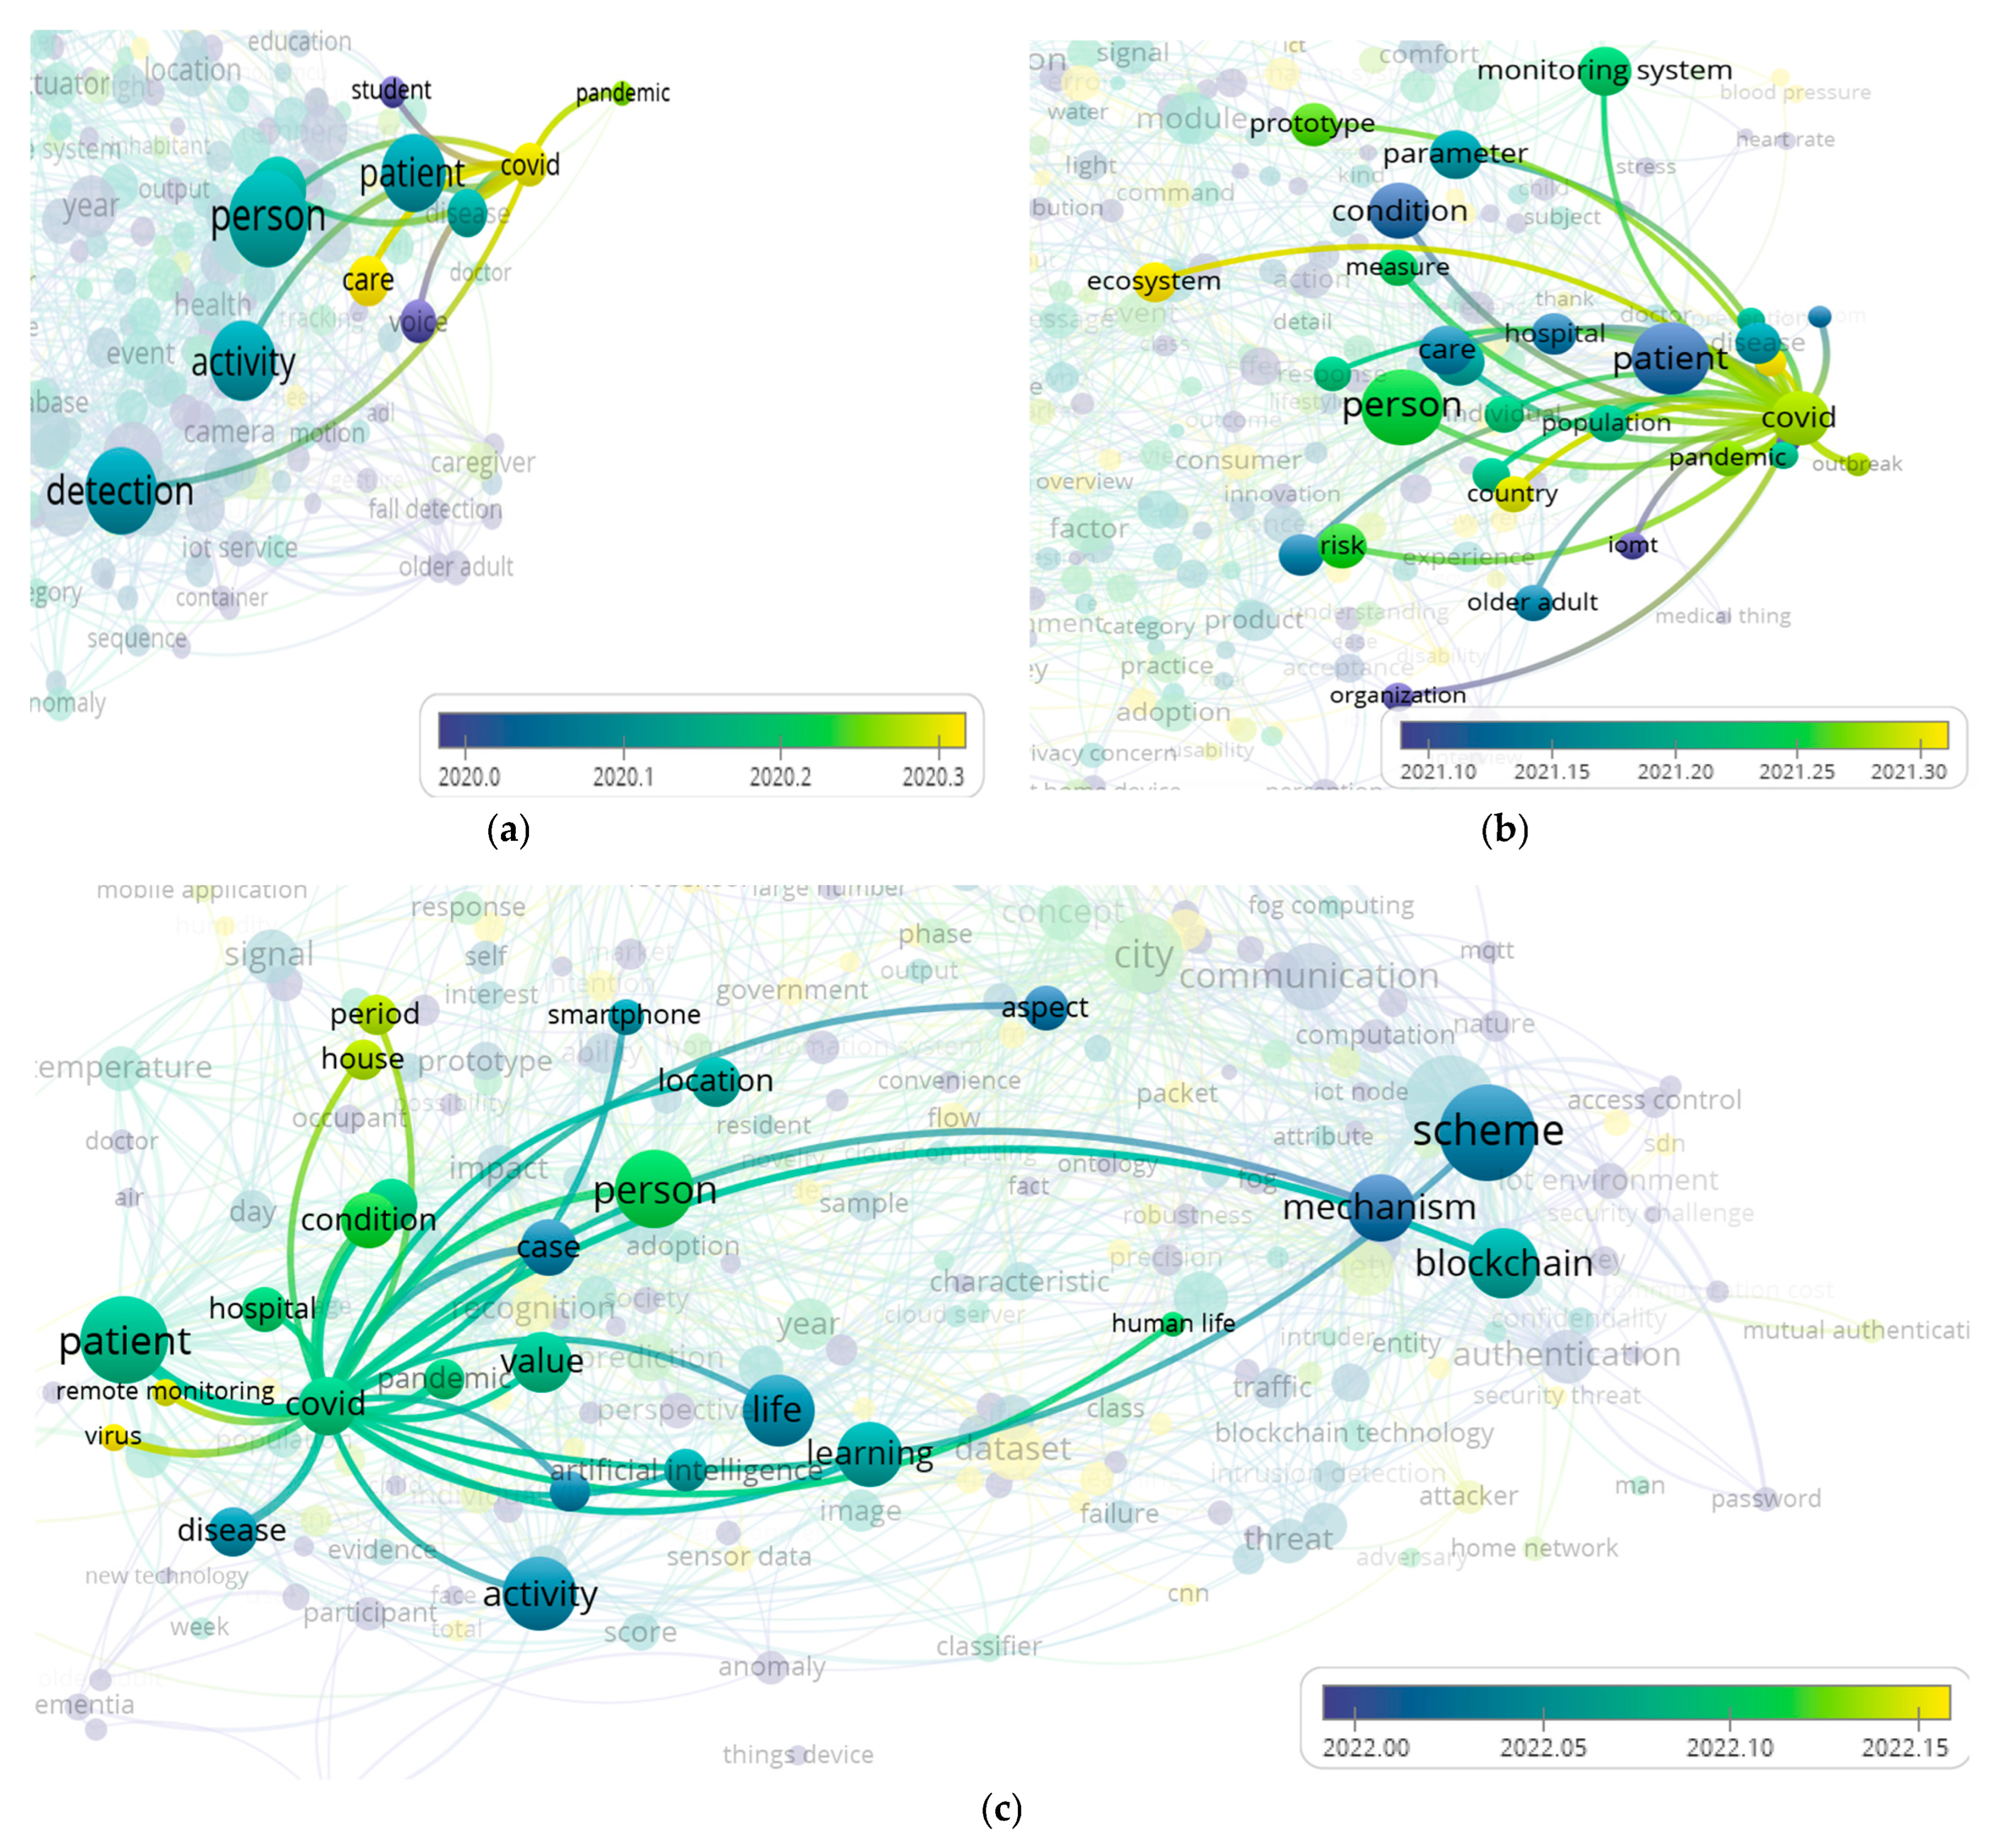
4.5. Yearly Trends Themes
4.5.1. In 2018
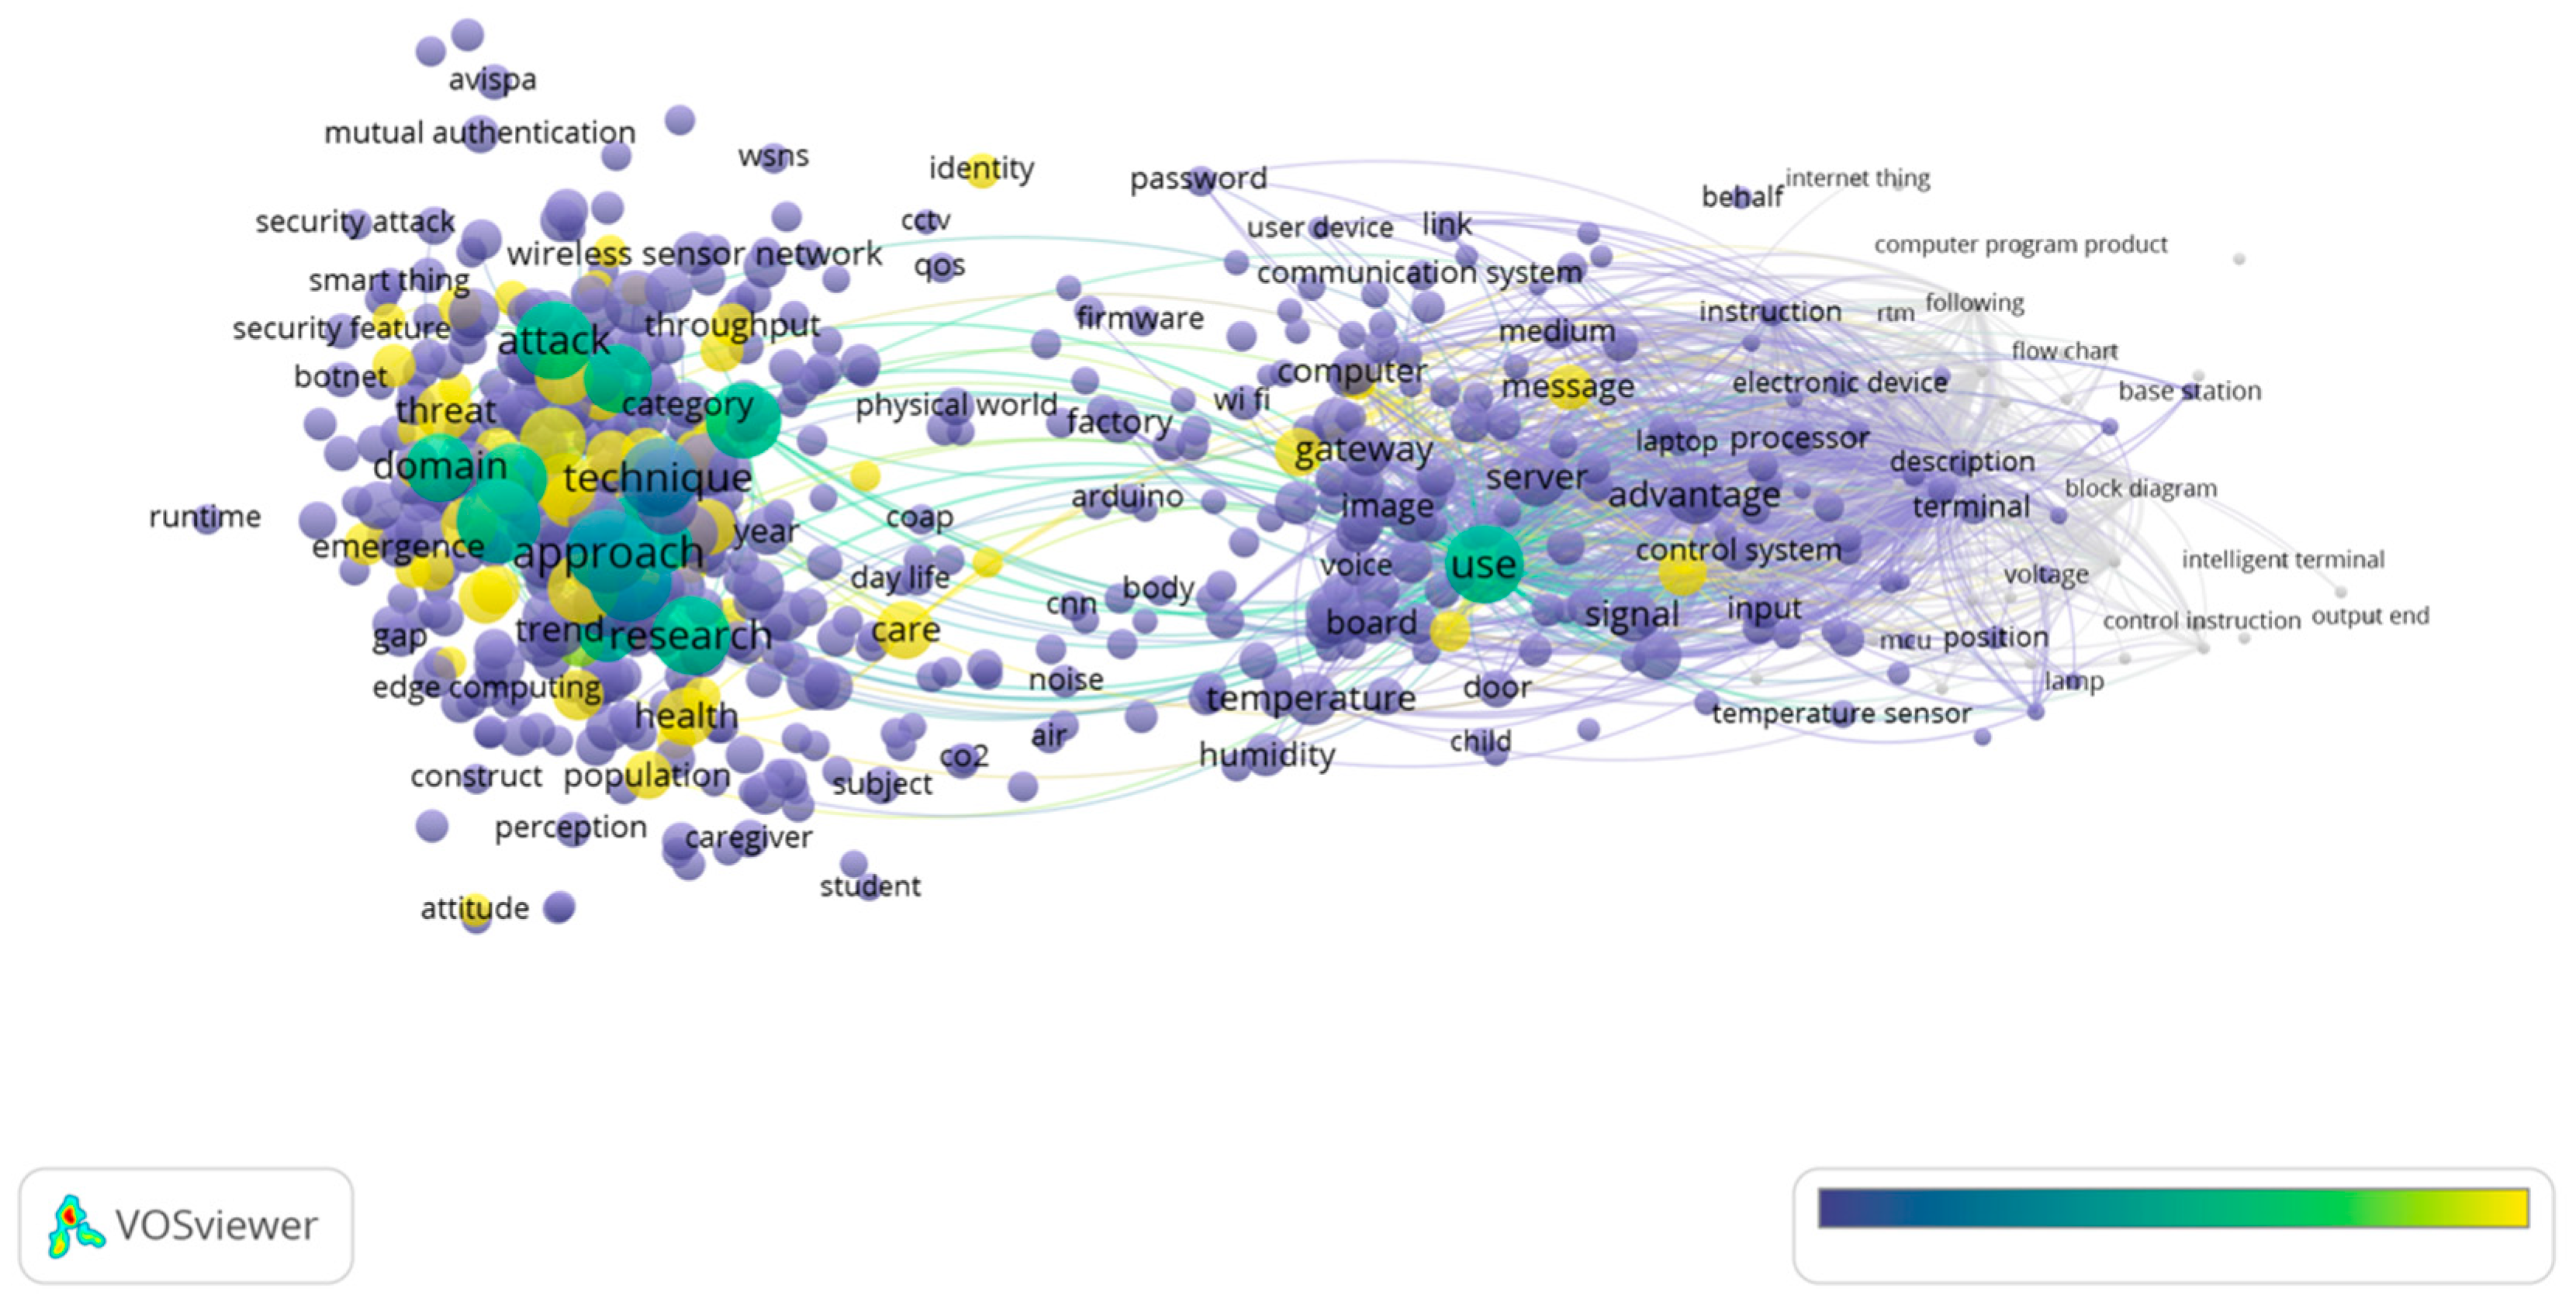
4.5.2. In 2019
4.5.3. In 2020
4.5.4. In 2021
4.5.5. In 2022
5. Discussion
5.1. Summary
5.2. Contributions and Implications
6. Conclusions
6.1. Thematic Agendas
6.2. Limitations
Author Contributions
Funding
Institutional Review Board Statement
Informed Consent Statement
Data Availability Statement
Conflicts of Interest
References
- Gaikwad, P.P.; Gabhane, J.P.; Golait, S.S. A survey based on Smart Homes system using Internet-of-Things. In Proceedings of the 2015 International Conference on Computation of Power, Energy, Information and Communication (ICCPEIC), Chennai, India, 22–23 April 2015. [Google Scholar]
- Choi, W.; Kim, J.; Lee, S.; Park, E. Smart home and internet of things: A bibliometric study. J. Clean. Prod. 2021, 301, 126908. [Google Scholar] [CrossRef]
- Ejaz, W.; Naeem, M.; Shahid, A.; Anpalagan, A.; Jo, M. Efficient energy management for the internet of things in smart cities. IEEE Commun. Mag. 2017, 55, 84–91. [Google Scholar] [CrossRef]
- Cobo, M.J.; Martínez, M.-Á.; Gutiérrez-Salcedo, M.; Fujita, H.; Herrera-Viedma, E. 25 years at knowledge-based systems: A bibliometric analysis. Knowl.-Based Syst. 2015, 80, 3–13. [Google Scholar] [CrossRef]
- Ohlan, R.; Ohlan, A. A comprehensive bibliometric analysis and visualization of smart home research. Technol. Forecast. Soc. Chang. 2022, 184, 121975. [Google Scholar] [CrossRef]
- Szum, K. IoT-based smart cities: A bibliometric analysis and literature review. Eng. Manag. Prod. Serv. 2021, 13, 115–136. [Google Scholar] [CrossRef]
- Sun, Y.; Li, S. A systematic review of the research framework and evolution of smart homes based on the internet of things. Telecommun. Syst. 2021, 77, 597–623. [Google Scholar] [CrossRef]
- Donthu, N.; Kumar, S.; Mukherjee, D.; Pandey, N.; Lim, W.M. How to conduct a bibliometric analysis: An overview and guidelines. J. Bus. Res. 2021, 133, 285–296. [Google Scholar] [CrossRef]
- Gram-Hanssen, K.; Darby, S.J. “Home is where the smart is”? Evaluating smart home research and approaches against the concept of home. Energy Res. Soc. Sci. 2018, 37, 94–101. [Google Scholar]
- Kim, M.; Man, K.L.; Helil, N. Advanced internet of things and big data Technology for Smart Human-Care Services. J. Sens. 2019, 2019, 1654013. [Google Scholar] [CrossRef]
- Zielonka, A.; Woźniak, M.; Garg, S.; Kaddoum, G.; Piran, M.J.; Muhammad, G. Smart homes: How much will they support us? A research on recent trends and advances. IEEE Access 2021, 9, 26388–26419. [Google Scholar] [CrossRef]
- Yang, H.; Lee, W.; Lee, H. IoT smart home adoption: The importance of proper level automation. J. Sens. 2018, 2018, 6464036. [Google Scholar] [CrossRef]
- Sharma, R.; Rani, S.; Nuagh, S.J. RecIoT: A Deep Insight into IoT-Based Smart Recommender Systems. Wirel. Commun. Mob. Comput. 2022, 2022, 9218907. [Google Scholar] [CrossRef]
- Iyengar, K.; Vaish, A.; Vaishya, R. Revisiting conservative orthopaedic management of fractures during COVID-19 pandemic. J. Clin. Orthop. Trauma 2020, 11, 718–720. [Google Scholar] [CrossRef] [PubMed]
- Sadoughi, F.; Behmanesh, A.; Sayfouri, N. Internet of things in medicine: A systematic mapping study. J. Biomed. Inform. 2020, 103, 103383. [Google Scholar] [CrossRef] [PubMed]
- Moral-Muñoz, J.A.; Herrera-Viedma, E.; Santisteban-Espejo, A.; Cobo, M.J. Software tools for conducting bibliometric analysis in science: An up-to-date review. Prof. Inf. 2020, 29. [Google Scholar] [CrossRef]
- Guo, Y.-M.; Huang, Z.-L.; Guo, J.; Guo, X.-R.; Li, H.; Liu, M.-Y.; Ezzeddine, S.; Nkeli, M.J. A bibliometric analysis and visualization of blockchain. Future Gener. Comput. Syst. 2021, 116, 316–332. [Google Scholar] [CrossRef]
- Kamran, M.; Khan, H.U.; Nisar, W.; Farooq, M.; Rehman, S.U. Blockchain and Internet of Things: A bibliometric study. Comput. Electrical. Eng. 2020, 81, 106525. [Google Scholar] [CrossRef]
- Rani, S.; Kataria, A.; Chauhan, M.; Rattan, P.; Kumar, R.; Sivaraman, A.K. Security and Privacy Challenges in the Deployment of Cyber-Physical Systems in Smart City Applications: State-of-Art Work. In Proceedings of the 1st International Conference on Innovative Technology for Sustainable Development (ICITSD), Chennai, India, 27–29 January 2022. [Google Scholar]
- Dai, Z.; Zhang, Q.; Zhu, X.; Zhao, L. A Comparative Study of Chinese and Foreign Research on the Internet of Things in Education: Bibliometric Analysis and Visualization. IEEE Access 2021, 9, 130127–130140. [Google Scholar] [CrossRef]
- Uppal, M.; Gupta, D.; Anand, D.; Alharithi, F.S.; Almotiri, J.; Mansilla, A.; Singh, D.; Goyal, N. Fault Pattern Diagnosis and Classification in Sensor Nodes Using Fall Curve. Comput. Mater. Contin. 2022, 72, 1799–1814. [Google Scholar] [CrossRef]
- Leong, Y.R.; Tajudeen, F.P.; Yeong, W.C. Bibliometric and content analysis of the internet of things research: A social science perspective. Online Inf. Rev. 2021, 45, 1148–1166. [Google Scholar] [CrossRef]
- Page, M.J.; McKenzie, J.E.; Bossuyt, P.M.; Boutron, I.; Hoffmann, T.C.; Mulrow, C.D.; Shamseer, L.; Tetzlaff, J.M.; Akl, E.A.; Brennan, S.E. The PRISMA 2020 statement: An updated guideline for reporting systematic reviews. Int. J. Surg. 2021, 88, 105906. [Google Scholar] [CrossRef] [PubMed]
- Khare, A.; Jain, R. Mapping the conceptual and intellectual structure of the consumer vulnerability field: A bibliometric analysis. J. Bus. Res. 2022, 150, 567–584. [Google Scholar] [CrossRef]
- Mukherjee, D.; Lim, W.M.; Kumar, S.; Donthu, N. Guidelines for advancing theory and practice through bibliometric research. J. Bus. Res. 2022, 148, 101–115. [Google Scholar] [CrossRef]
- Silva, F.S.; Schulz, P.A.; Noyons, E.C. Co-authorship networks and research impact in large research facilities: Benchmarking internal reports and bibliometric databases. Scientometrics 2019, 118, 93–108. [Google Scholar] [CrossRef]
- Glänzel, W.; Schubert, A. Analysing scientific networks through co-authorship. In Handbook of Quantitative Science and Technology Research: The Use of Publication and Patent Statistics in Studies of S&T Systems; Springer: Berlin/Heidelberg, Germany, 2005; pp. 257–276. [Google Scholar]
- Xie, L.; Chen, Z.; Wang, H.; Zheng, C.; Jiang, J. Bibliometric and visualized analysis of scientific publications on atlantoaxial spine surgery based on Web of Science and VOSviewer. World Neurosurg. 2020, 137, 435–442.e434. [Google Scholar] [CrossRef]
- Wang, Y.; Zhang, F.; Wang, J.; Liu, L.; Wang, B. A bibliometric analysis of edge computing for internet of things. Secur. Commun. Netw. 2021, 2021, 5563868. [Google Scholar] [CrossRef]
- Van Eck, N.; Waltman, L. Software survey: VOSviewer, a computer program for bibliometric mapping. Scientometrics 2010, 84, 523–538. [Google Scholar] [CrossRef]
- Singh, A.; Kumar, J.; Jha, A.; Purbey, S. Bibliometric analysis of home health and internet of health things (IoHT). In Advances in Communication, Devices and Networking: Proceedings of ICCDN 2020; Springer: Berlin/Heidelberg, Germany, 2022; pp. 75–88. [Google Scholar]
- Yudidharma, A.; Nathaniel, N.; Gimli, T.N.; Achmad, S.; Kurniawan, A. A systematic literature review: Messaging protocols and electronic platforms used in the internet of things for the purpose of building smart homes. Procedia Comput. Sci. 2023, 216, 194–203. [Google Scholar] [CrossRef]
- Pau, G.; You, I. (Eds.) Internet of Things for Smart Homes [Special Issue]. Sensors. 2022. Available online: https://www.mdpi.com/journal/sensors/special_issues/IoT_smart_home3 (accessed on 17 January 2023).
- Sindhu, P.; Bharti, K. Mapping customer experience: A taxonomical study using bibliometric visualization. VINE J. Inf. Knowl. Manag. Syst. 2021, 51, 592–617. [Google Scholar] [CrossRef]


| Authors | Article Title | Times Cited * | Included Papers | Utilized Database | Utilized Software |
|---|---|---|---|---|---|
| [17] Guo et al. (2021) | A bibliometric analysis and visualization of blockchain | 50 | 3826 | WoS Core | CiteSpace, VOSviewer |
| [15] Sadoughi et al. (2020) | Internet of things in medicine: A systematic mapping study | 40 | 89 | WoS | CitNetExplorer |
| [18] Kamran et al. (2020) | Blockchain and internet of things: A bibliometric study | 38 | 151 | WoS Core | Unspecified |
| [2] Choi et al. (2021) | Smart home and internet of things: A bibliometric study | 30 | 2339 | Scopus | Unspecified |
| [19] Rani et al. (2021) | Security and privacy challenges in the deployment of cyber-physical systems in smart city applications: State-of-art work | 5 | Unspecified | Scopus | Unspecified |
| [7] Sun and Li (2021) | A systematic review of the research framework and evolution of smart homes based on the internet of things | 5 | 2874 | WoS | CiteSpace |
| [20] Dai et al. (2021) | A comparative study of Chinese and foreign research on the internet of things in education: Bibliometric analysis and visualization | 5 | 2257 | CNKI, WoS | CiteSpace |
| [21] Uppal et al. (2022) | Fault pattern diagnosis and classification in sensor nodes using fall curve | 3 | 63 | Scopus | Unspecified |
| [22] Leong et al. (2021) | Bibliometric and content analysis of the internet of things research: a social science perspective | 3 | 169 | WoS | VOSviewer |
| [13] Sharm et al. (2021) | RecIoT: A deep insight into IoT-based smart recommender systems | 0 | 90 | Scopus | Unspecified |
| Subject | Number of Publications | Proportion (%) |
|---|---|---|
| Regions | ||
| USA | 588 | 15.15 |
| People’s Republic of China | 567 | 14.12 |
| India | 465 | 11.98 |
| South Korea | 283 | 7.29 |
| Saudi Arabia | 215 | 5.54 |
| Italy | 205 | 5.28 |
| England | 196 | 5.05 |
| Pakistan | 176 | 4.55 |
| Canada | 140 | 3.61 |
| Japan | 126 | 3.24 |
| Research Area (Can Involve Multiple Fields) | ||
| Computer science | 2995 | 77.19 |
| Engineering | 2067 | 53.27 |
| Telecommunications | 1912 | 49.28 |
| Communication | 641 | 16.52 |
| Mathematics | 490 | 12.68 |
| Instruments and instrumentation | 407 | 10.49 |
| Automation control systems | 369 | 9.41 |
| Mathematical computational biology | 343 | 8.84 |
| Energy fuels | 289 | 7.48 |
| Chemistry | 229 | 5.90 |
| Organizations | ||
| National Institute of Technology | 59 | 1.52 |
| Chinese Academy of Sciences | 53 | 1.37 |
| Centre National DE LA recherche Scient fique | 47 | 1.21 |
| Pennsylvania Commonwealth System of Higher Education | 40 | 1.03 |
| University of California | 38 | 0.98 |
| State University of Florida | 38 | 0.98 |
| University of Georgia | 36 | 0.93 |
| Electronics Research Institute Korea | 36 | 0.93 |
| Indian Institute of Technology | 35 | 0.90 |
| University Park | 12 | 0.31 |
Disclaimer/Publisher’s Note: The statements, opinions and data contained in all publications are solely those of the individual author(s) and contributor(s) and not of MDPI and/or the editor(s). MDPI and/or the editor(s) disclaim responsibility for any injury to people or property resulting from any ideas, methods, instructions or products referred to in the content. |
© 2023 by the authors. Licensee MDPI, Basel, Switzerland. This article is an open access article distributed under the terms and conditions of the Creative Commons Attribution (CC BY) license (https://creativecommons.org/licenses/by/4.0/).
Share and Cite
Wang, J.; Kim, H.-S. Visualizing the Landscape of Home IoT Research: A Bibliometric Analysis Using VOSviewer. Sensors 2023, 23, 3086. https://doi.org/10.3390/s23063086
Wang J, Kim H-S. Visualizing the Landscape of Home IoT Research: A Bibliometric Analysis Using VOSviewer. Sensors. 2023; 23(6):3086. https://doi.org/10.3390/s23063086
Chicago/Turabian StyleWang, Jue, and Hak-Seon Kim. 2023. "Visualizing the Landscape of Home IoT Research: A Bibliometric Analysis Using VOSviewer" Sensors 23, no. 6: 3086. https://doi.org/10.3390/s23063086
APA StyleWang, J., & Kim, H.-S. (2023). Visualizing the Landscape of Home IoT Research: A Bibliometric Analysis Using VOSviewer. Sensors, 23(6), 3086. https://doi.org/10.3390/s23063086