
Prediction of Actual from Climatic Precipitation with Data Collected from Northern Poland: A Statistical Approach
 ,
,  ,
,  , ,
, ,  ,
,  , , ,
, , , 
Abstract
1. Introduction
2. Materials
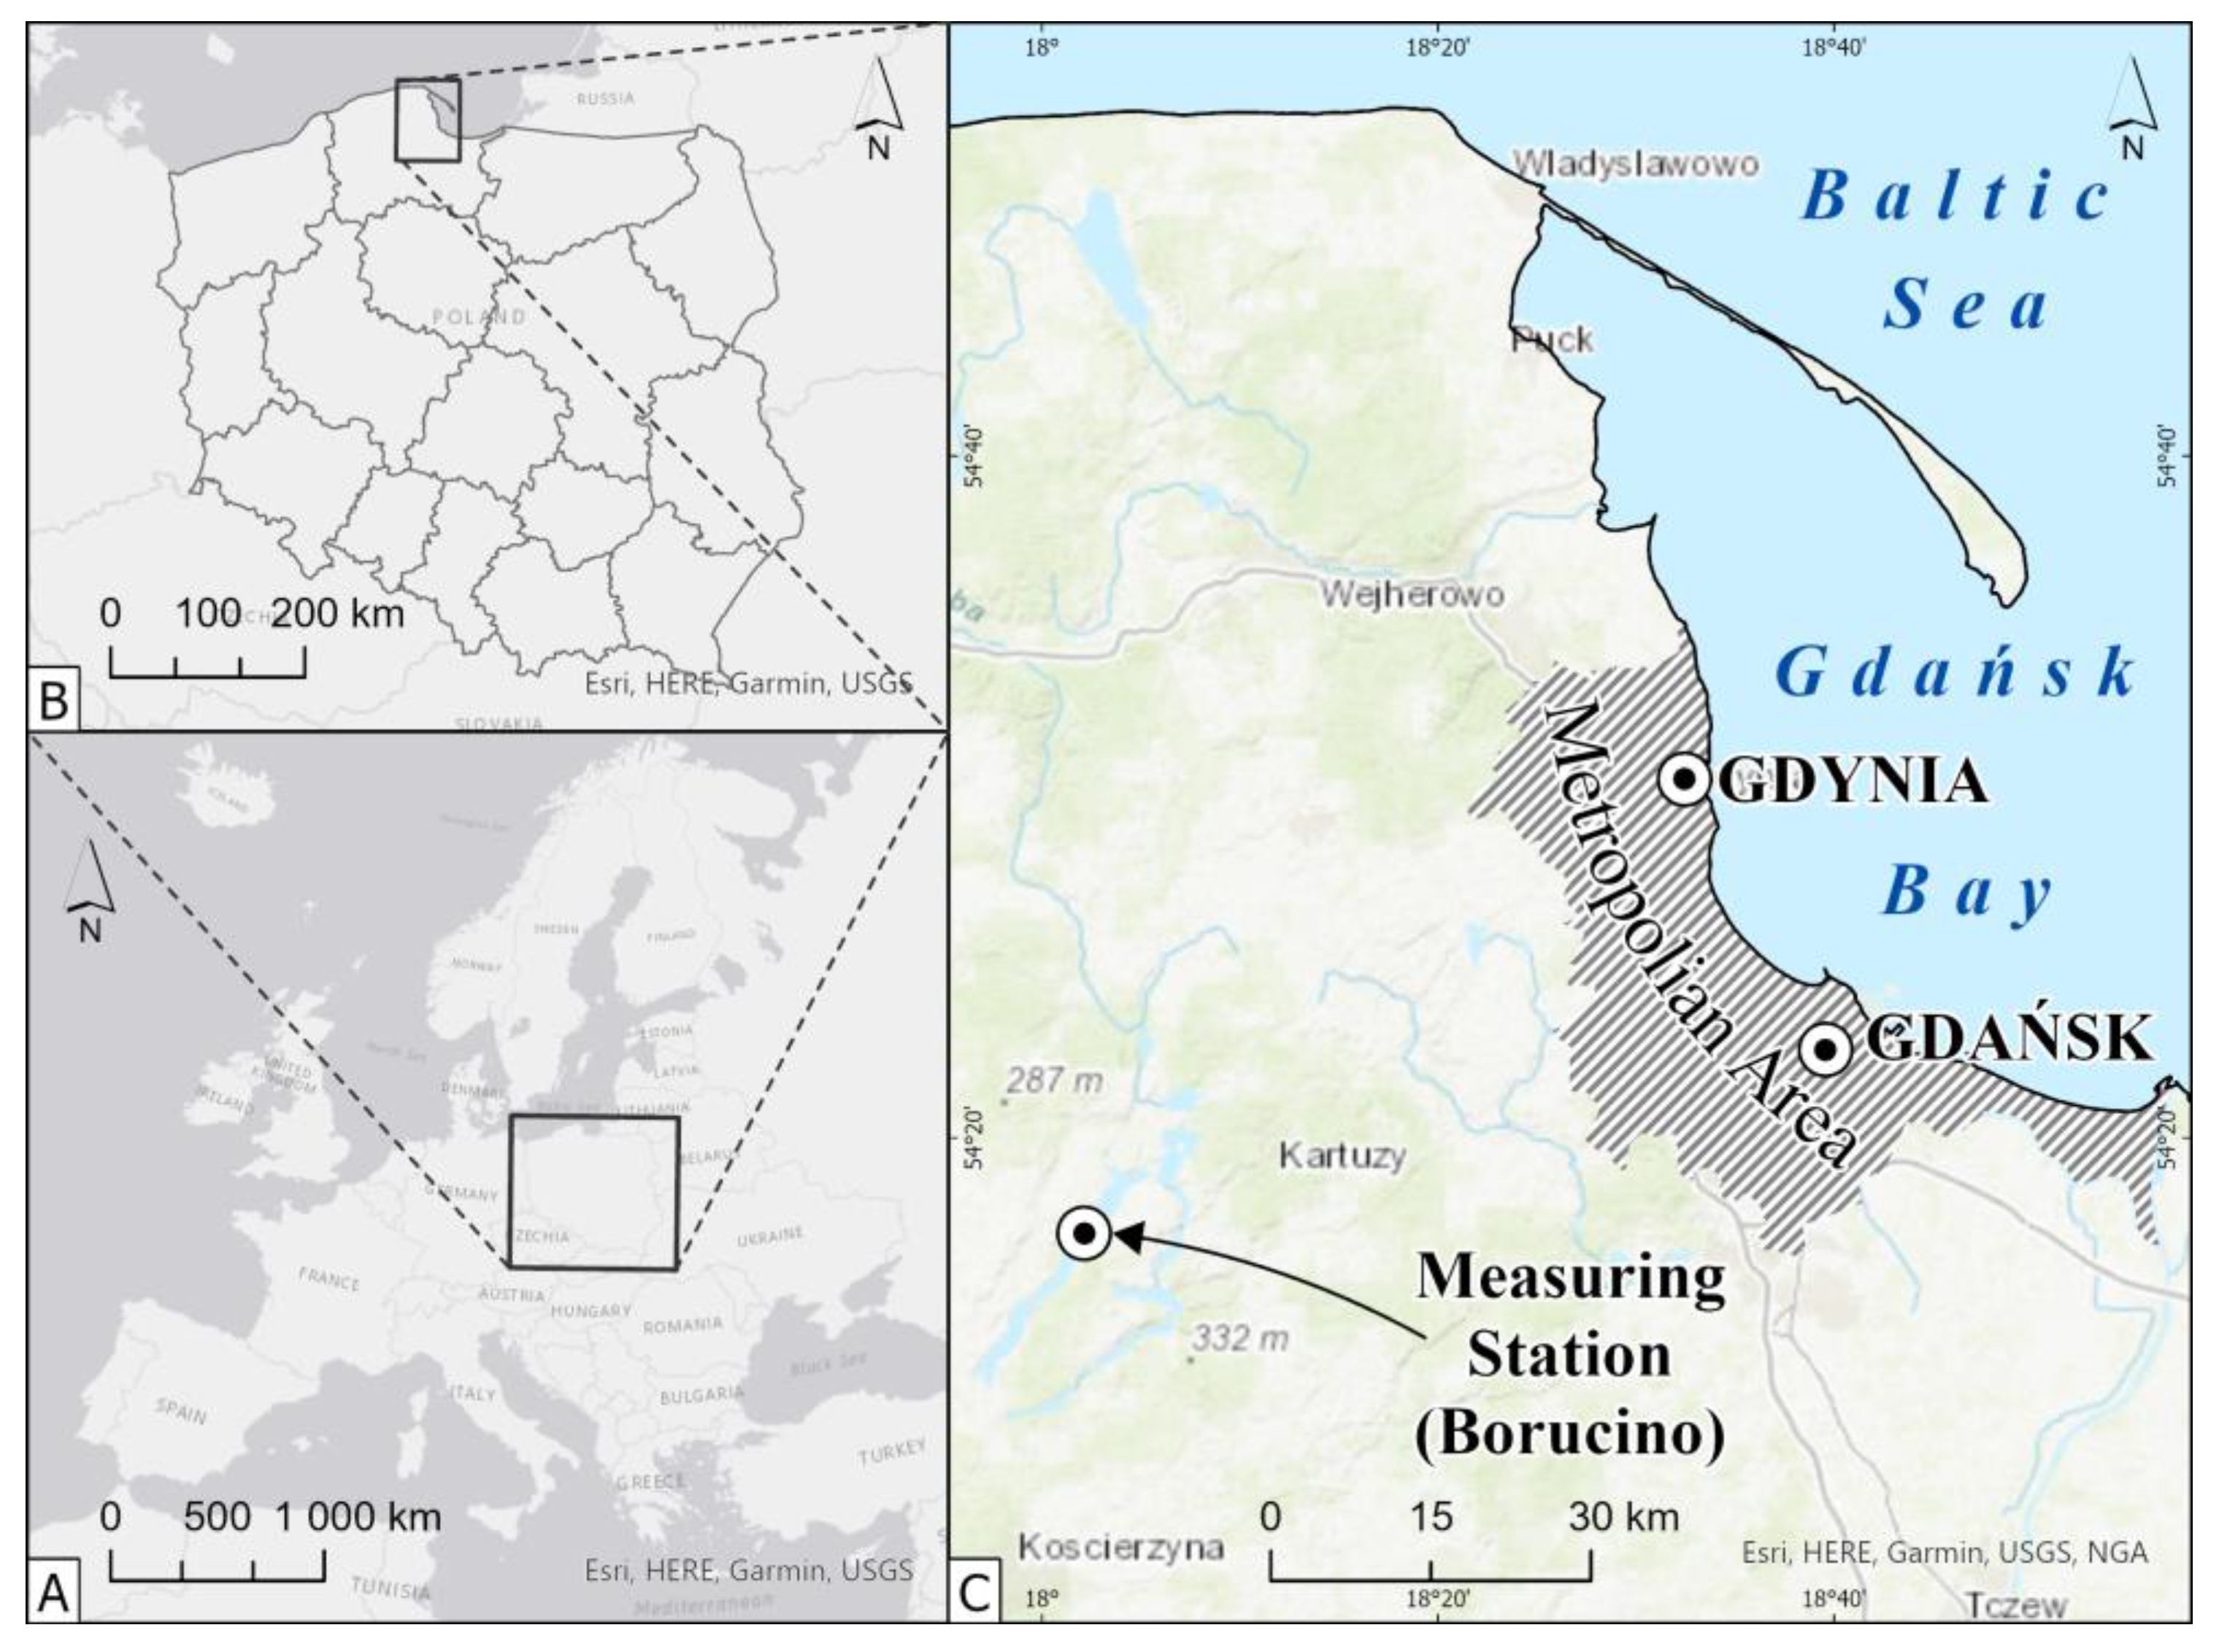
2.1. Study Area
2.2. Data Collection
3. Methods
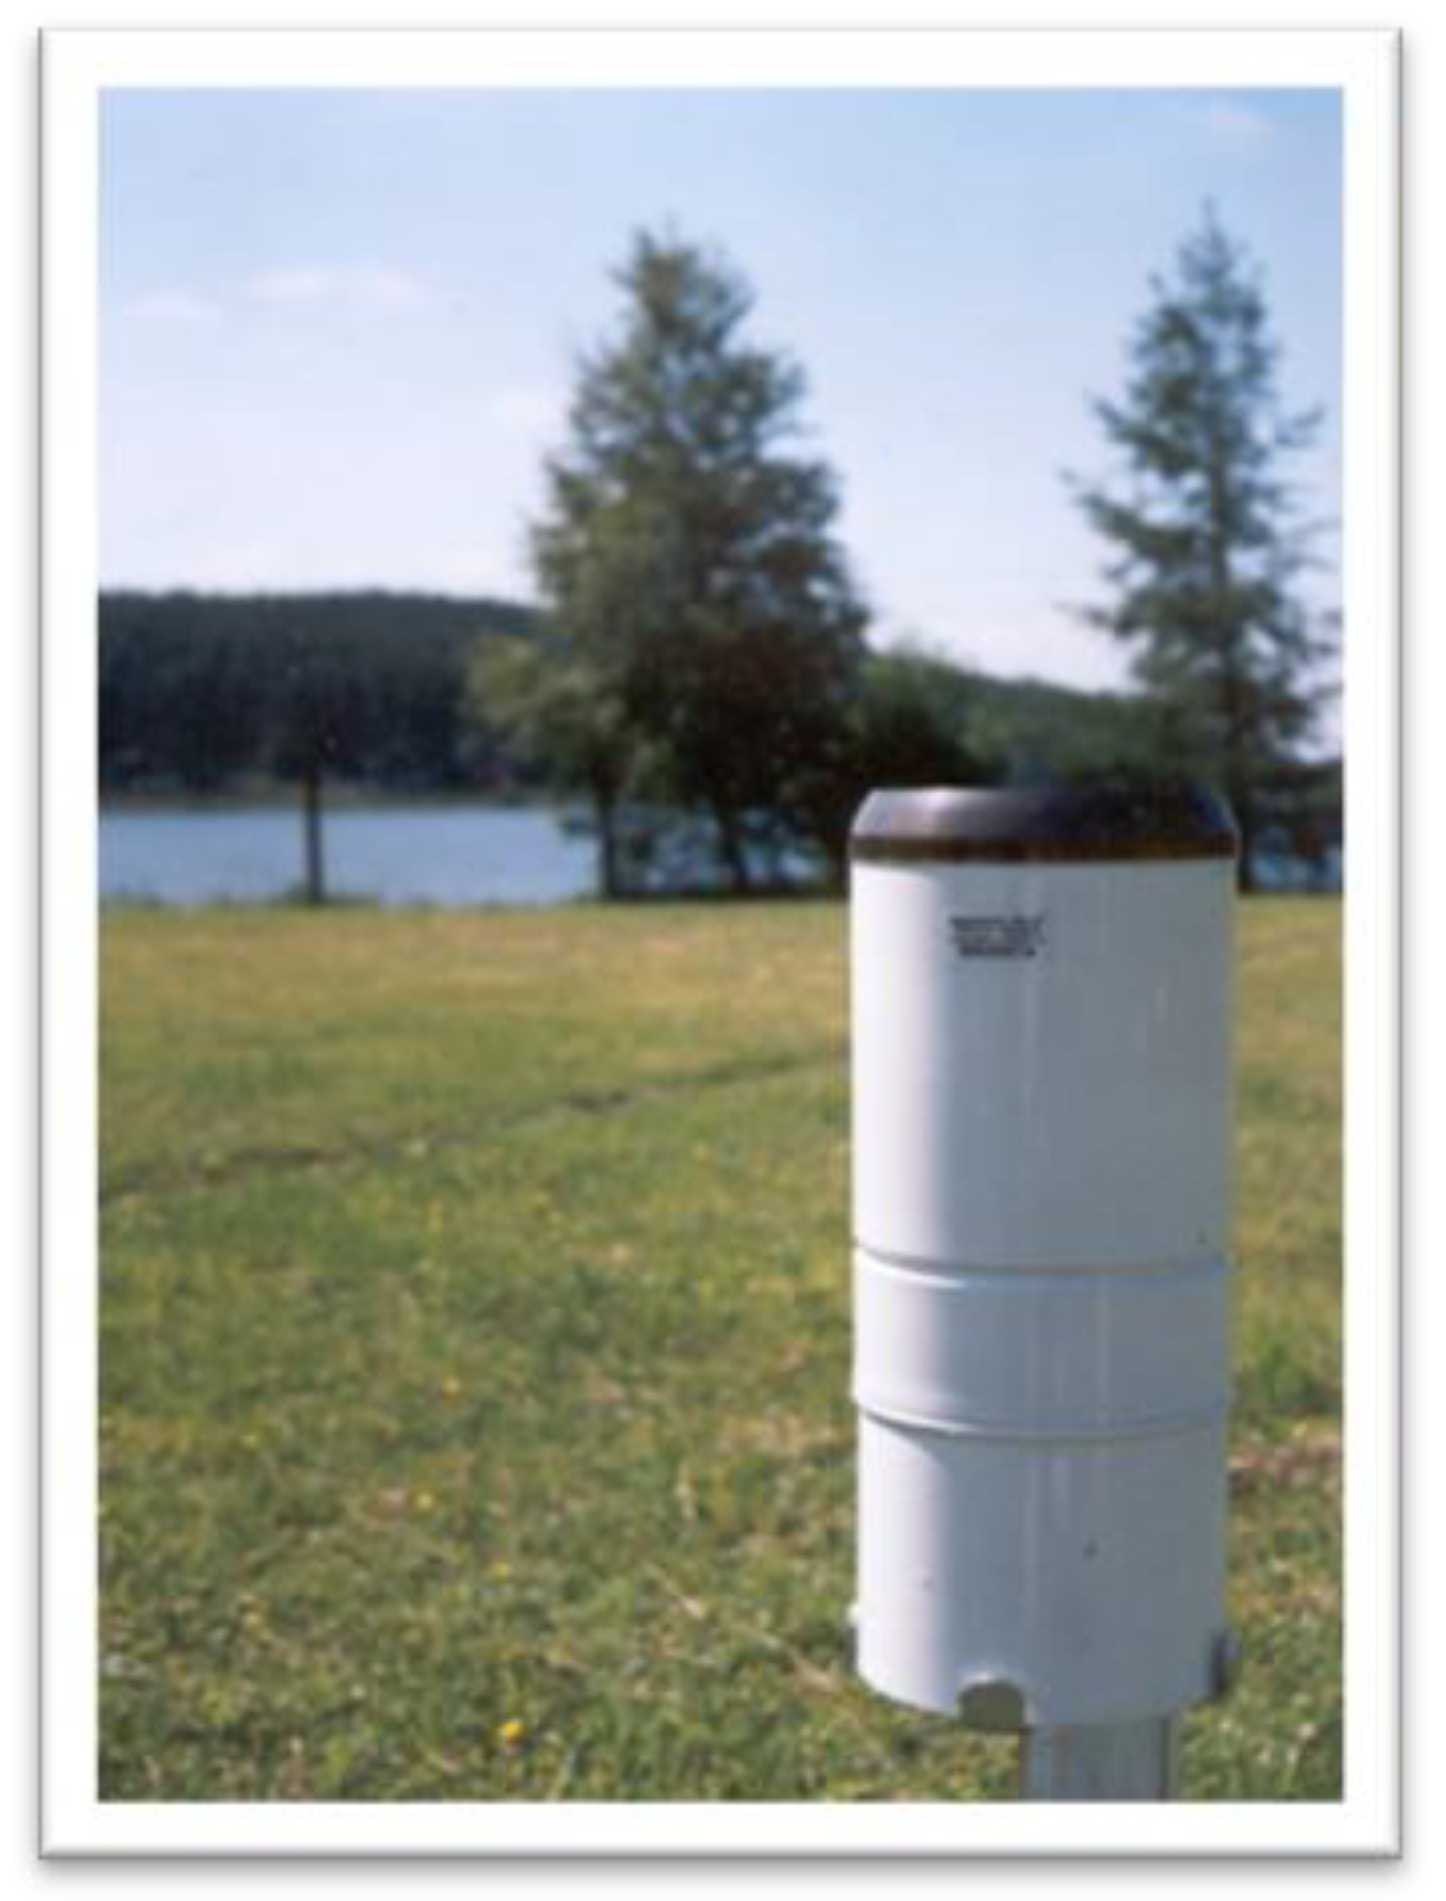
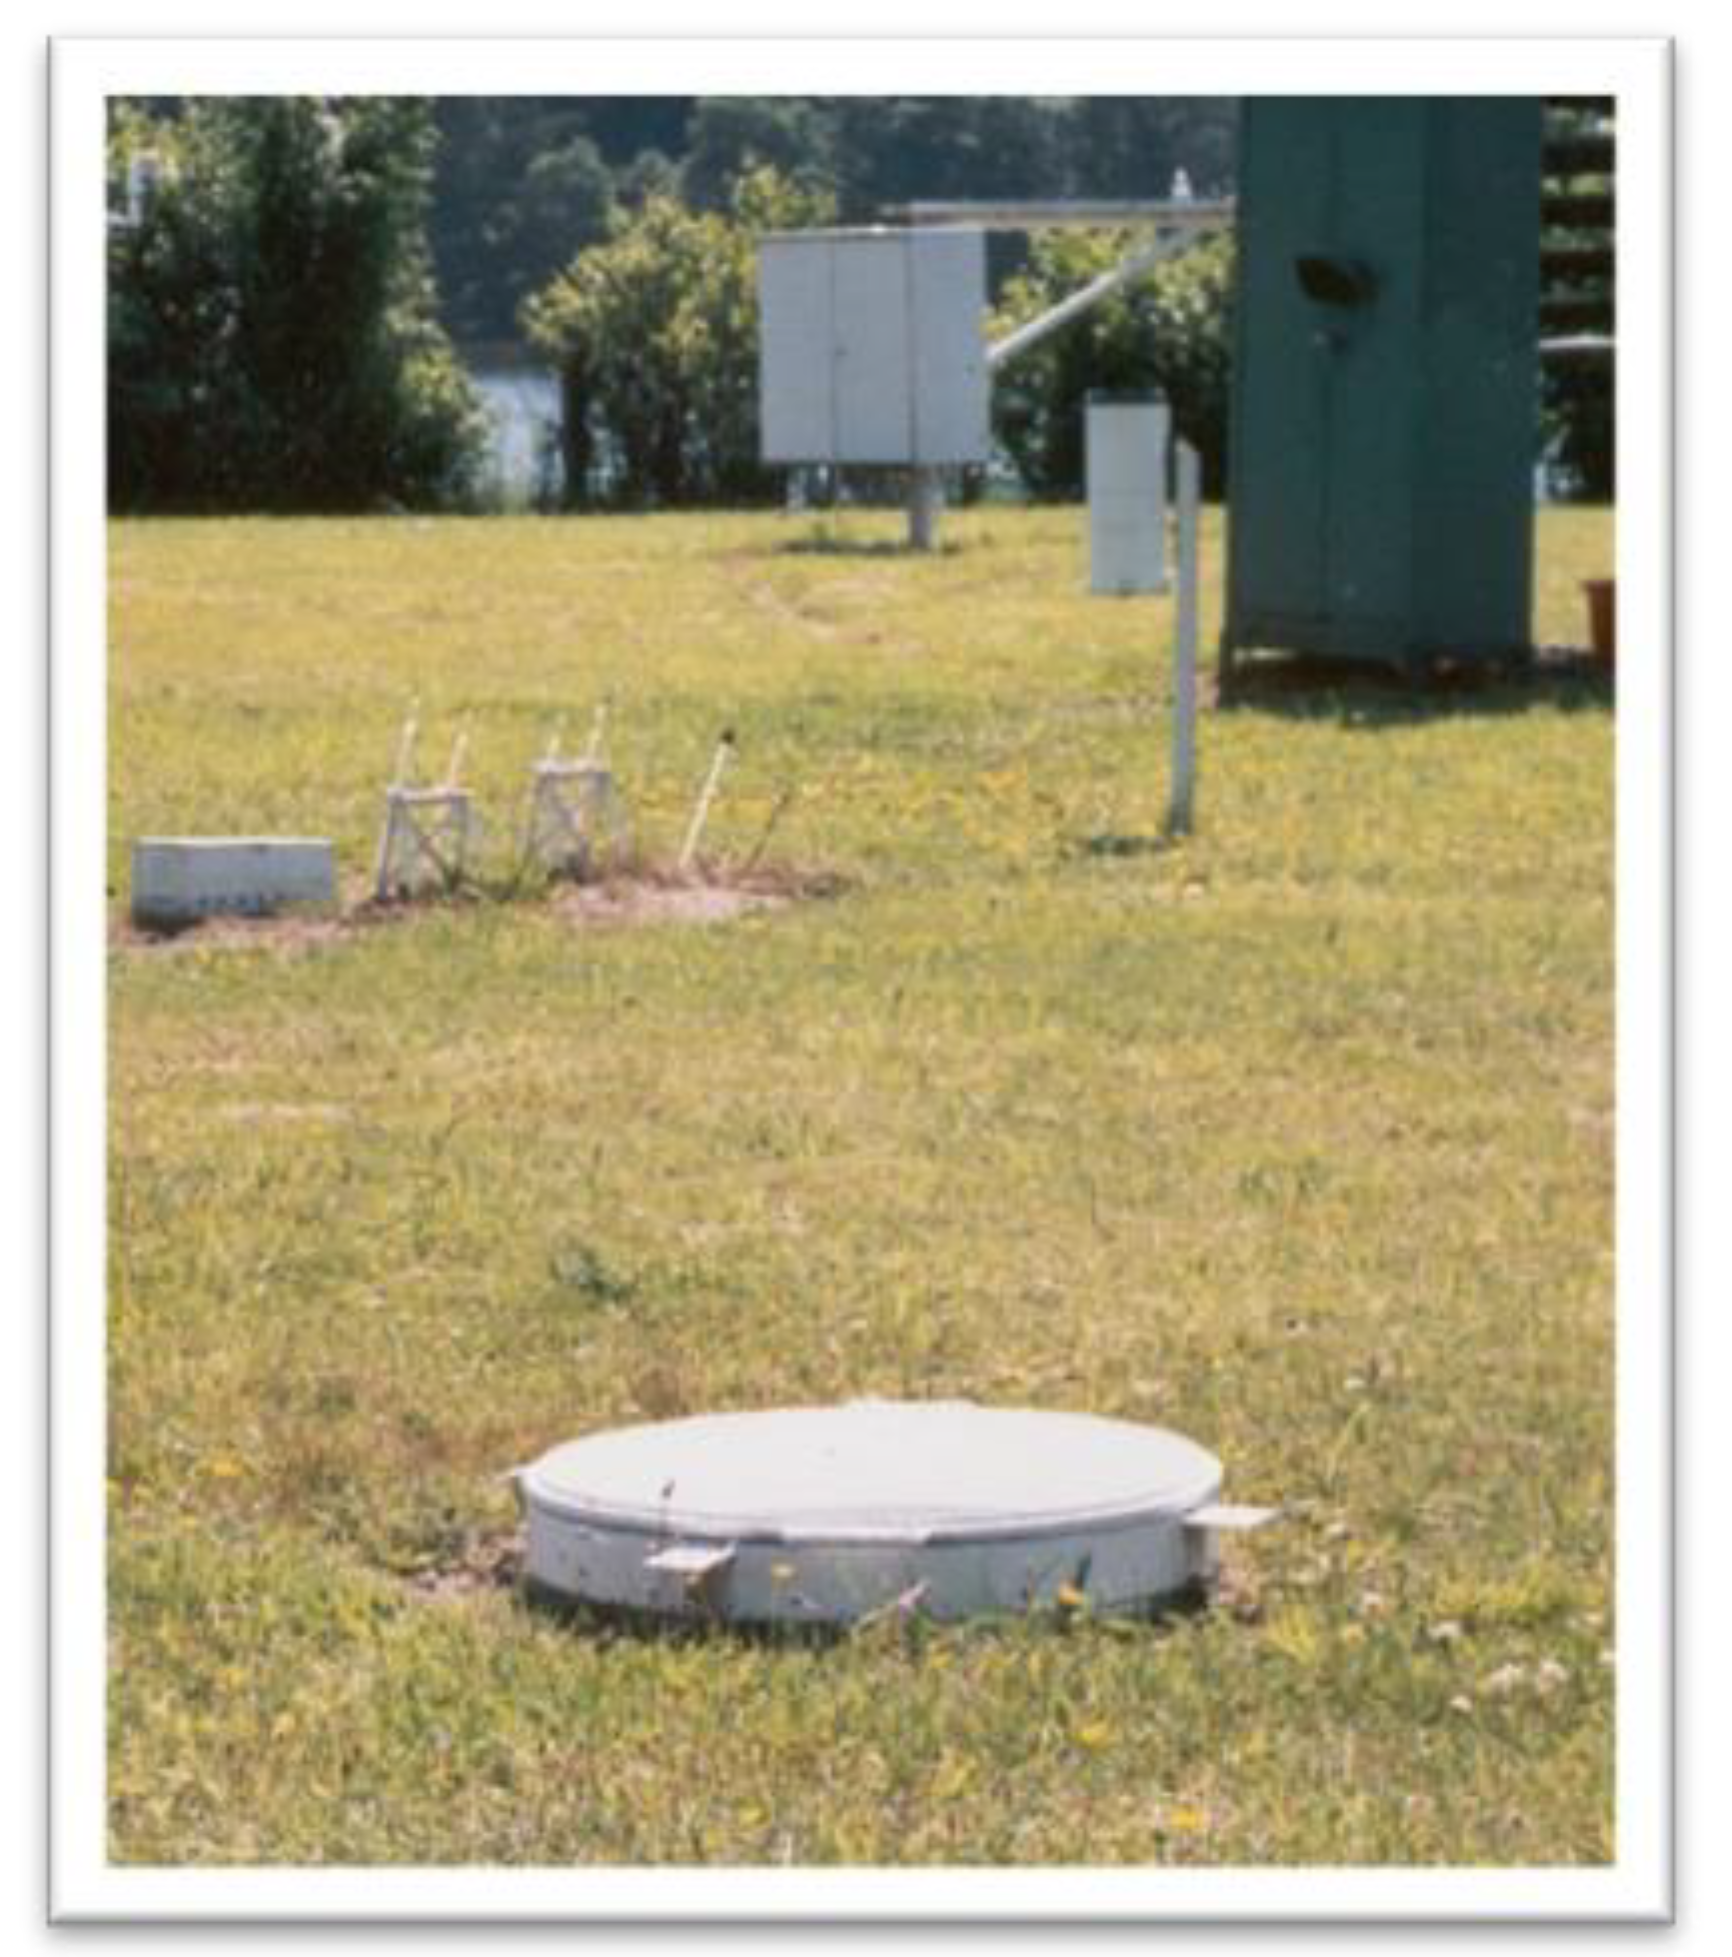
3.1. Sensors
3.2. Statistical Comparison of the Data Sets
4. Results
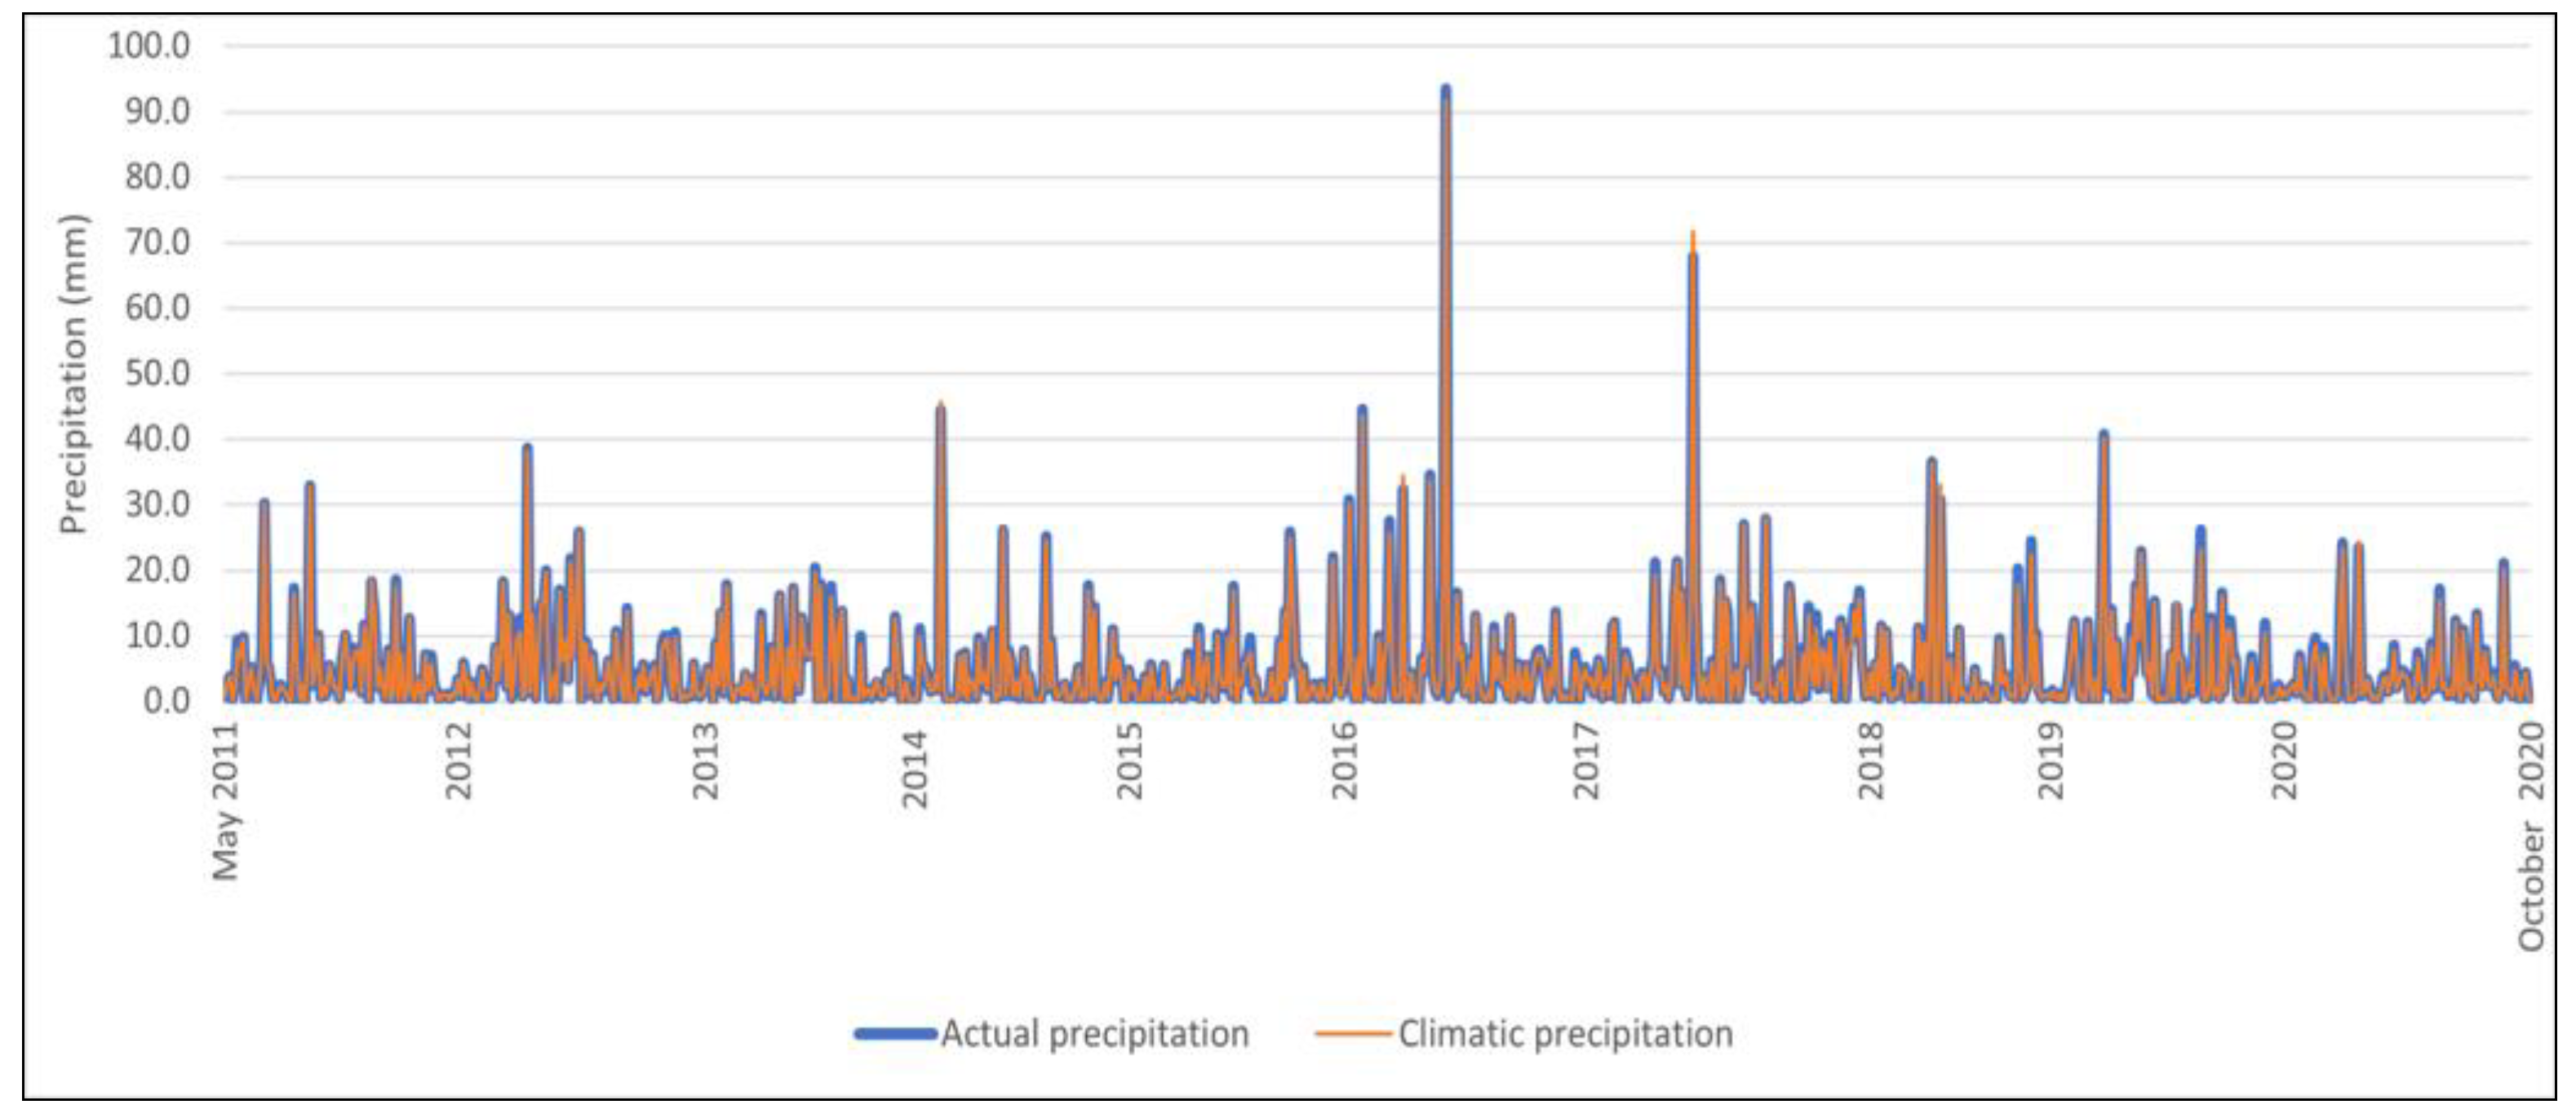
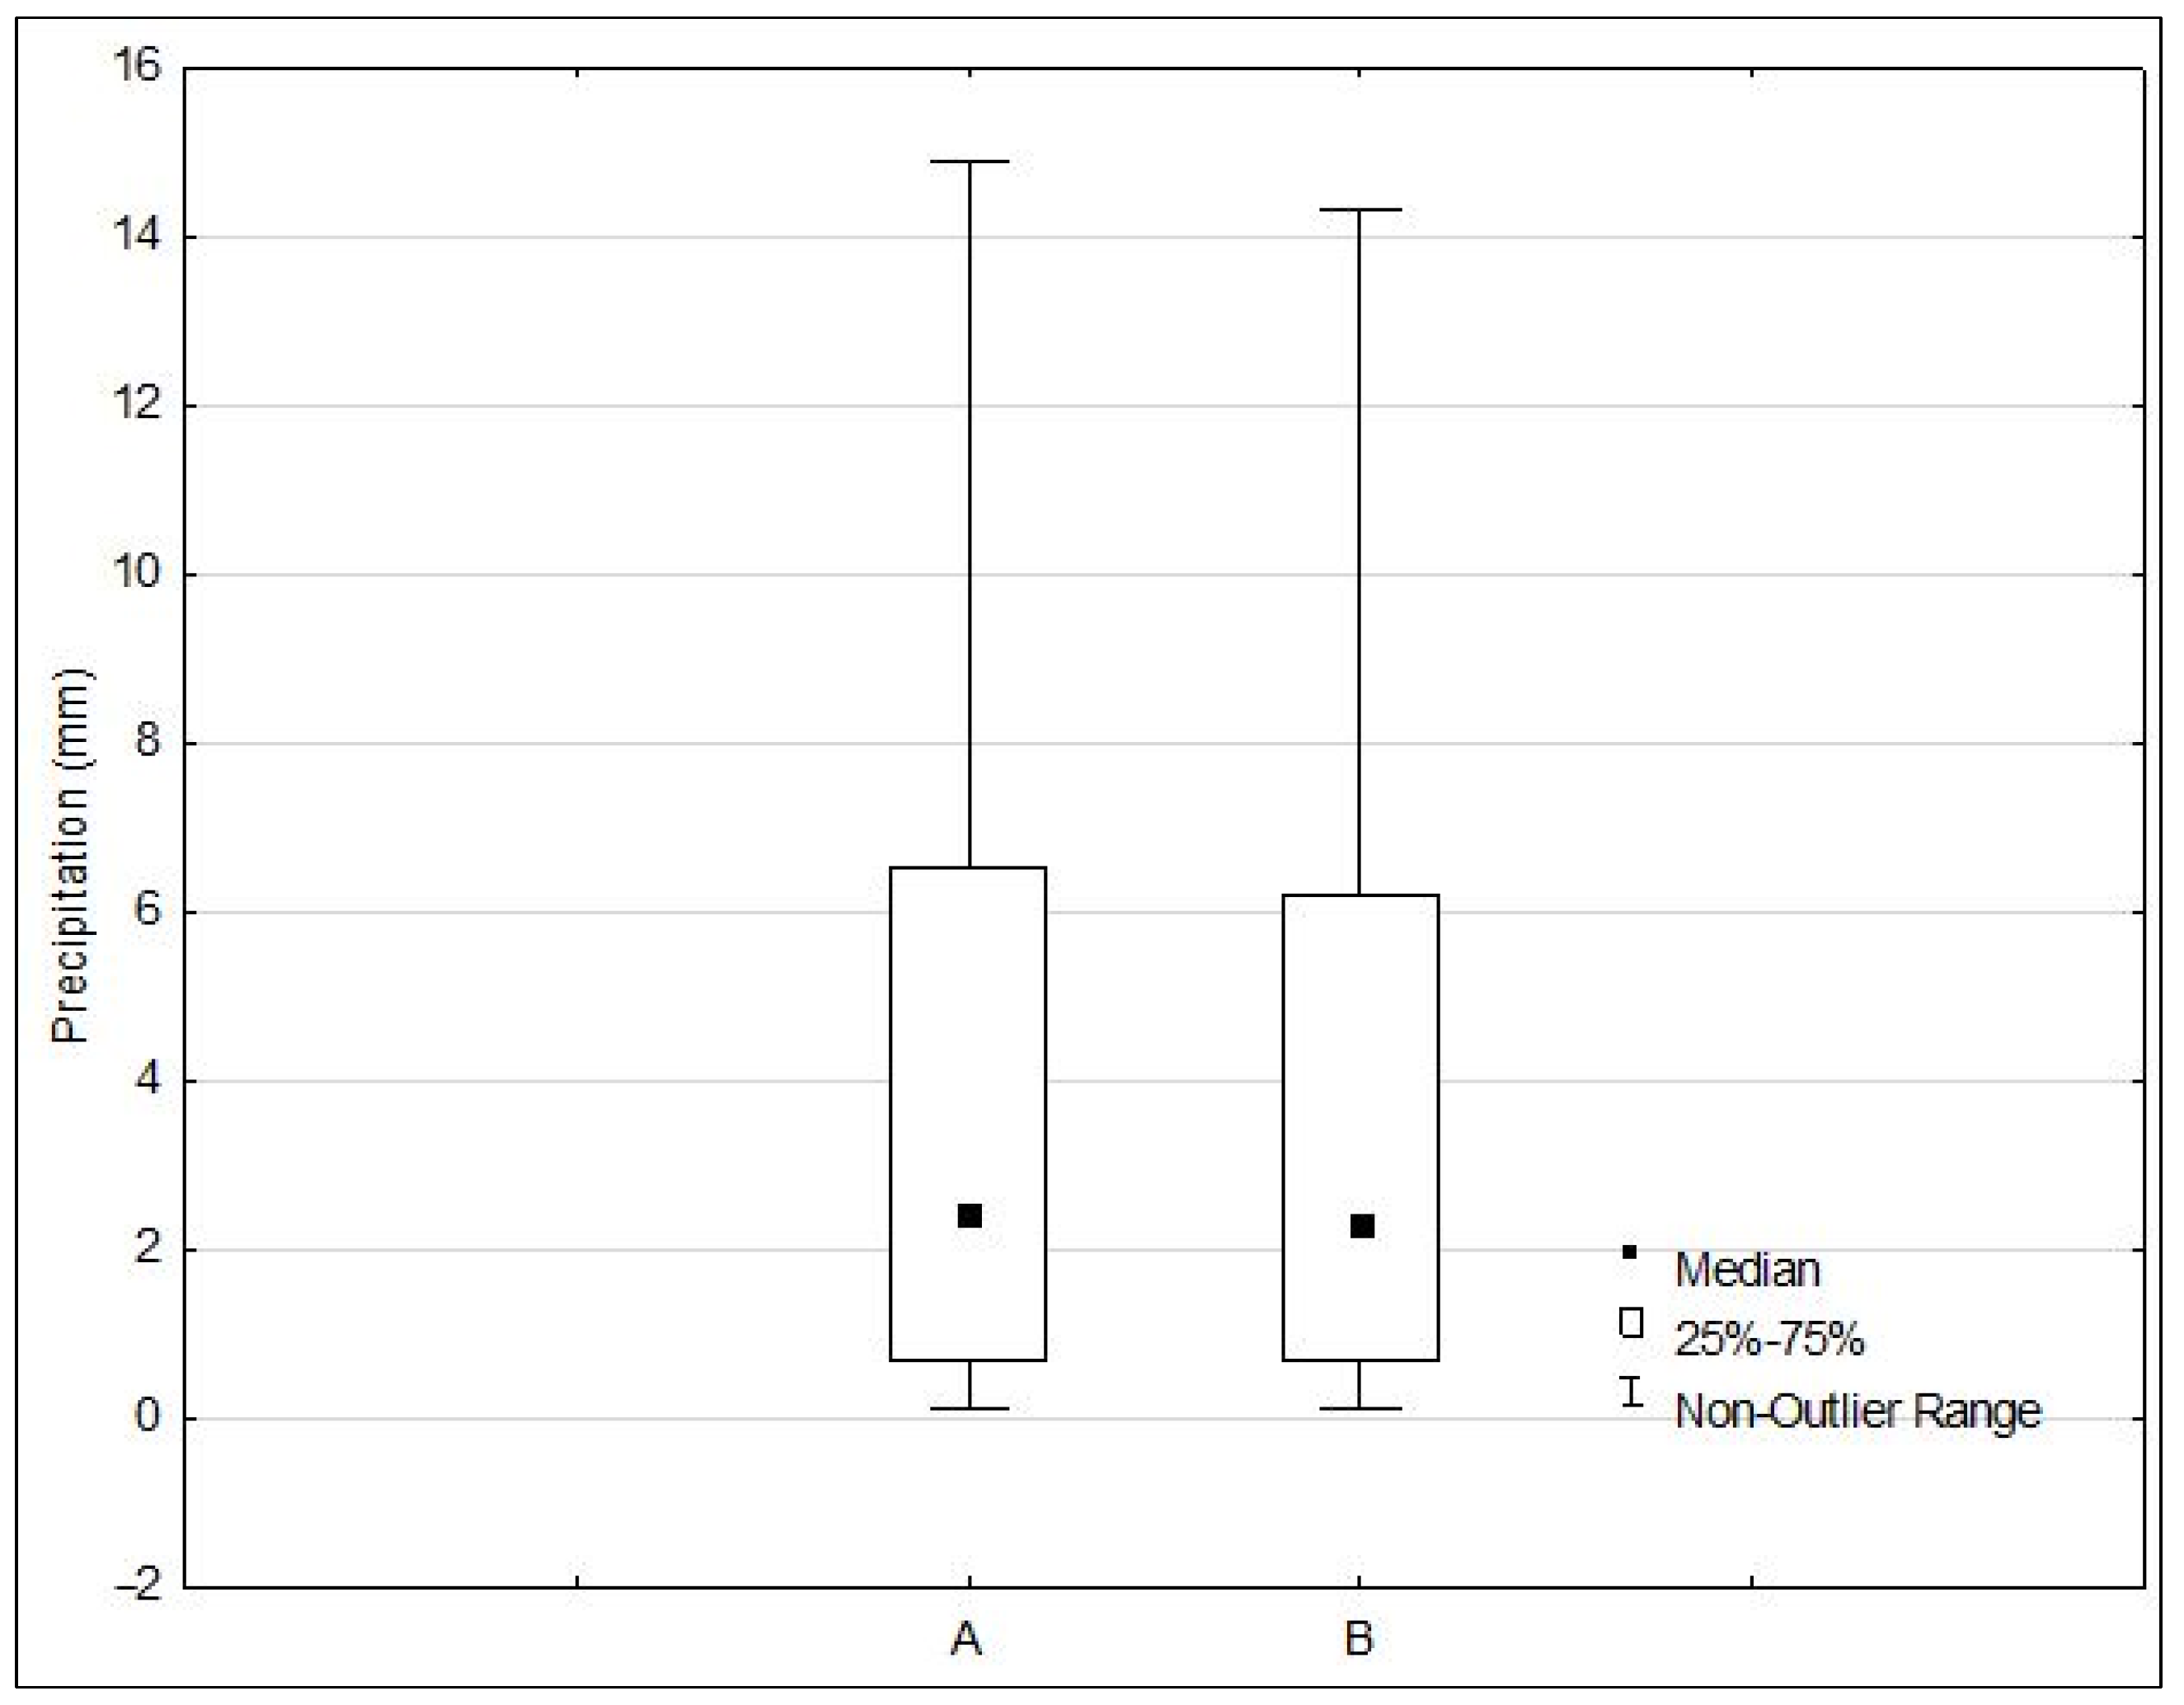
4.1. Measures of Precipitation Variability
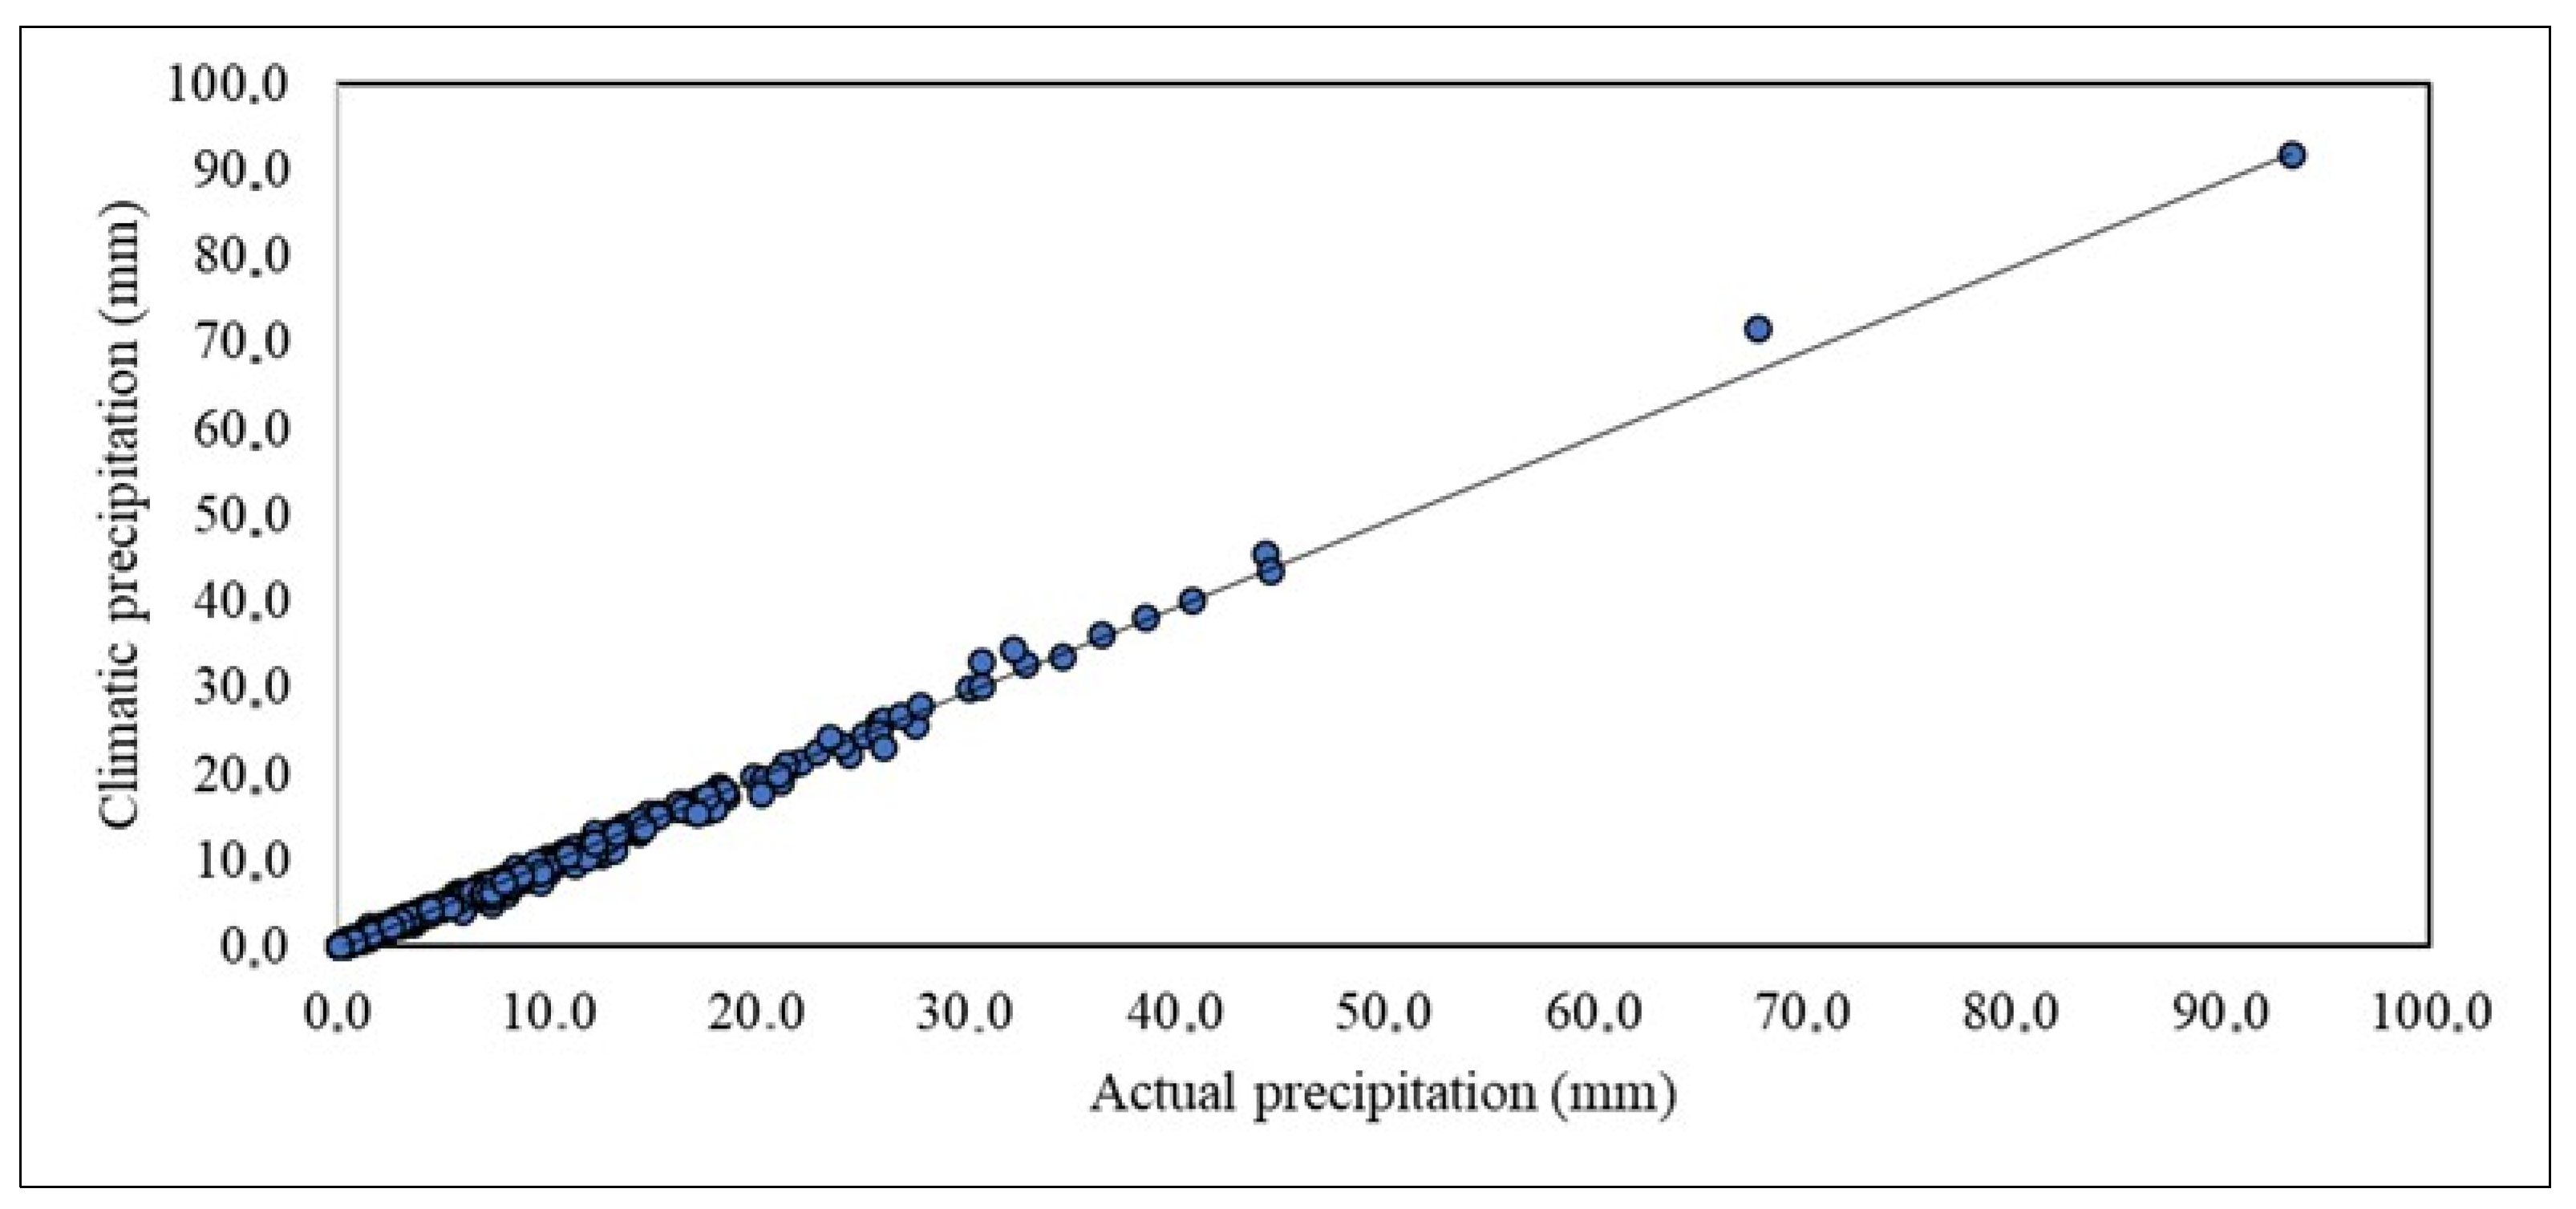
4.2. Correlation of Actual and Climatic Precipitation during the Summer Half of the Year
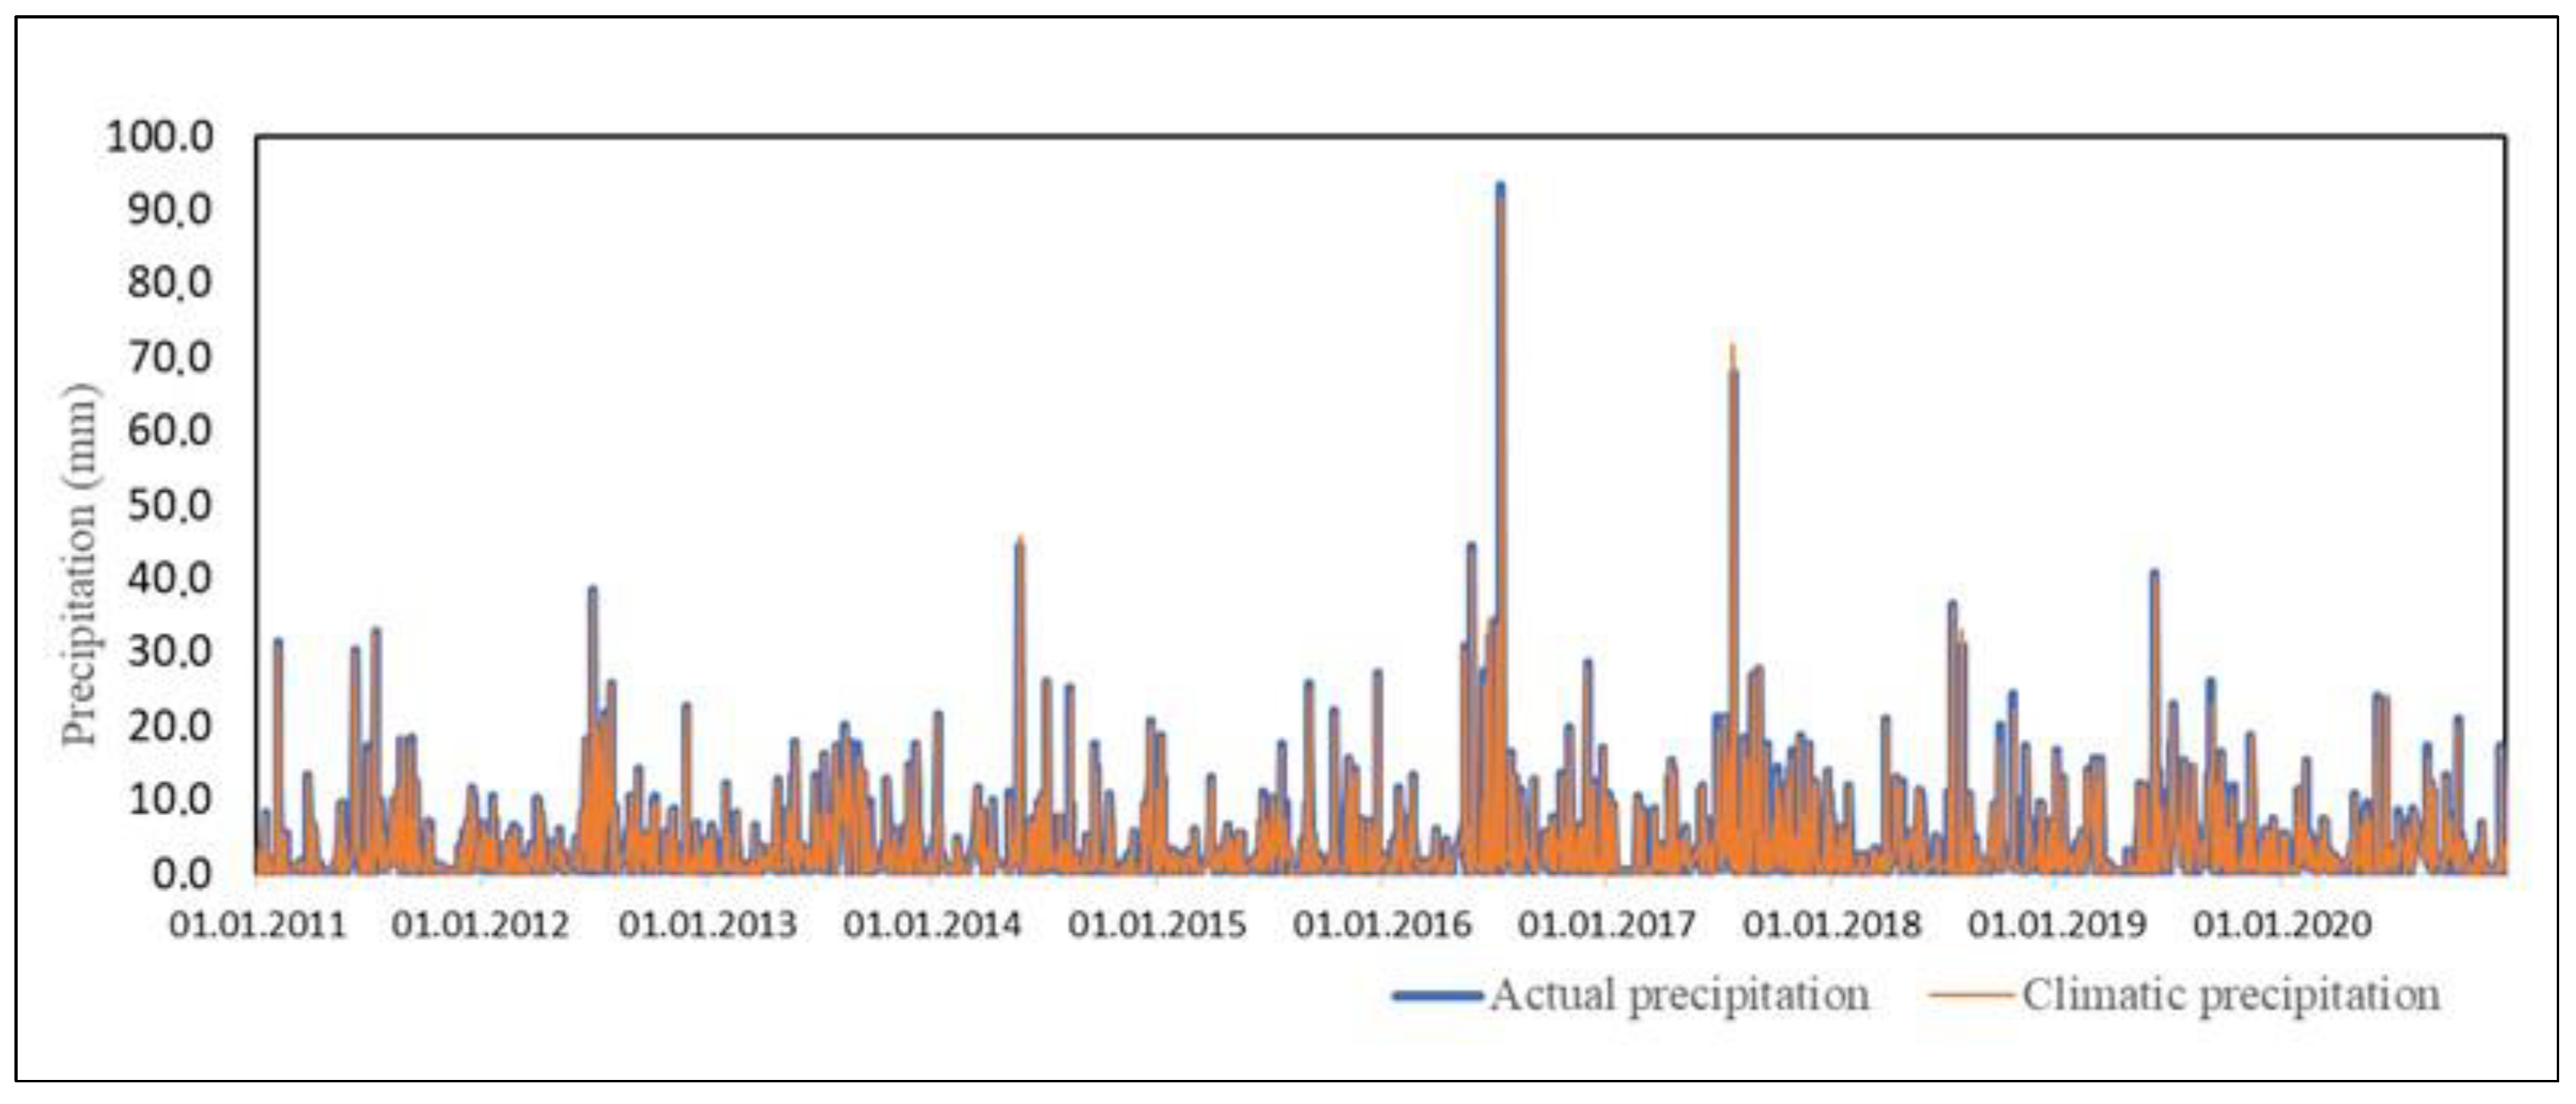
4.3. Extrapolation of Actual Precipitation to the Winter Half-Year and Comparison with Climatic Precipitation from 2011 to 2020
5. Discussion
6. Conclusions
Author Contributions
Funding
Institutional Review Board Statement
Informed Consent Statement
Data Availability Statement
Conflicts of Interest
References
- Dabar, O.A.; Waberi, M.M.; Camberlin, P.; Pohl, B.; Awaleh, M.O.; Silah–Eddine, S. Spatial and temporal variability of rainfall over the Republic of Djibouti from 1946 to 2017. Int. J. Climatol. 2021, 41, 2729–2748. [Google Scholar] [CrossRef]
- Yuan, W.H.; Yu, R.C.; Zhang, M.H.; Lin, W.Y.; Chen, H.M.; Li, J. Regimes of Diurnal Variation of Summer Rainfall over Subtropical East Asia. J. Clim. 2012, 25, 3307–3320. [Google Scholar] [CrossRef]
- Li, J.; Yu, R.C.; Sun, W. Duration and seasonality of hourly extreme rainfall in the central eastern China. Acta Meteorol. Sin. 2013, 27, 799–807. [Google Scholar] [CrossRef]
- Cattani, E.; Merino, A.; Guijarro, J.A.; Levizzani, V. East Africa rainfall trends and variability 1983–2015 using three long-term satellite products. Remote Sens. 2018, 10, 931. [Google Scholar] [CrossRef]
- Lyon, B.; DeWitt, D.G. A recent and abrupt decline in the East African long rains. Geophys. Res. Lett. 2012, 39, L02702. [Google Scholar] [CrossRef]
- Bozhinova, D.; Pulkkinen, S. The accuracy of weather radar in heavy rain: A comparative study for Denmark, the Netherlands, Finland and Sweden. Hydrol. Earth Syst. Sci. 2020, 24, 3157–3188. [Google Scholar] [CrossRef]
- Rasmussen, R.; Baker, B.; Kochendorfer, J.; Meyers, T.; Landolt, S.; Fischer, A.; Black, J.; Theriault, J.; Kucera, P.; Gochis, D.; et al. How well are we measuring snow? The NOAA/FAA/NCAR winter precipitation test bed. BAMS 2012, 6, 811–829. [Google Scholar] [CrossRef]
- Proksch, M.; Rutter, N.; Fierz, C.; Schneebeli, M. Intercomparison of snow density measurements: Bias, precision, and vertical resolution. Cryosphere 2016, 10, 371–384. [Google Scholar] [CrossRef]
- Marshall, J.S.; Gunn, K.L.S. Measurement of snow parameters by radar. J. Meteorol. 1952, 9, 322–327. [Google Scholar] [CrossRef]
- Changnon, S.A. Temporal and Spatial Distributions of Damaging Hail in the Continental United States. Phys. Geogr. 2008, 29, 341–350. [Google Scholar] [CrossRef]
- Ni, X.; Liu, C.; Cecil, D.J.; Zhang, Q. On the Detection of Hail Using Satellite Passive Microwave Radiometers and Precipitation Radar. J. Appl. Meteorol. Climatol. 2017, 56, 2693–2709. [Google Scholar] [CrossRef]
- Kumjian, M.R.; Gutierrez, R.; Soderholm, J.S.; Nesbitt, S.W.; Maldonado, P.; Luna, L.M.; Marquis, J.; Bowley, K.A.; Imaz, M.A.; Salio, P. Gargantuan Hail in Argentina. Bull. Am. Meteorol. Soc. 2020, 101, 1241–1258. [Google Scholar] [CrossRef]
- Xiao, C.; Yuan, W.; Yu, R. Diurnal cycle of rainfall in amount, frequency, intensity, duration, and the seasonality over the UK. Int. J. Climatol. 2018, 38, 4967–4978. [Google Scholar] [CrossRef]
- Cerbelaud, A.; Favro, A.; Roupioz, L.; Blanchet, G.; Briottet, X.; Delvit, J.-M.; Breil, P. Potential of high resolution satellite optical imagery to detect damages following extreme rainfall events. Houille Blanche 2020, 6, 66–74. [Google Scholar] [CrossRef]
- Abbott, P.F. Guidelines on the Quality Control of Surface Climatological Data; World Climate Data Programe 1986, WMO/TD-No.111; World Meteorological Organization: Gerhard Adrian, Germany, 1986; 56p. [Google Scholar]
- Strauch, E. Metody i Przyrządy Pomiarowe w Meterologii i Hydrologii; PWN: Warszawa, Polska, 1970; 316p. [Google Scholar]
- Kossowska-Cezak, U.; Martyn, D.; Olszewski, K.; Kopacz–Lembowicz, M. Meteorologia i Klimatologia; Wydawnictwo Naukowe PWN: Warszawa, Polska, 2000; 260p. [Google Scholar]
- Lenart, W. Zarys problematyki opadu rzeczywistego. Prz. Geofiz. 1980, 25, 303–316. [Google Scholar]
- Kuźniar, K.; Miczyński, J. Określenie ilości opadów na poszczególnych poziomach dokonywania pomiarów. Prz. Geofiz. 1977, 22, 37–42. [Google Scholar]
- Chomicz, K. Wpływ wiatru na pomiar opadu. Prz. Geofiz. 1965, 10, 71–75. [Google Scholar]
- Sieck, L.C.; Burges, S.J.; Steiner, M. Challenges in obtaining reliable measurements of point rainfall. Water Resour. Res. 2007, 43, W01420. [Google Scholar] [CrossRef]
- Chang, M.; Harrison, L. Field assessments on the accuracy of spherical gauges in rainfall measurements. Hydrol. Process. 2005, 19, 403–412. [Google Scholar] [CrossRef]
- Leung, L.R.; Boos, W.R.; Catto, J.L.A.; DeMott, C.; Martin, G.M.; Neelin, J.D.; O’Brien, T.A.; Xie, S.; Feng, Z.; Klingaman, N.P.; et al. Exploratory precipitation metrics: Spatiotemporal characteristics, process-oriented, and phenomena-based. J. Clim. 2022, 35, 3659–3686. [Google Scholar] [CrossRef]
- Yoshikane, T.; Yoshimura, K. A bias correction method for precipitation through recognizing mesoscale precipitation systems corresponding to weather conditions. PLoS Water 2022, 1, e0000016. [Google Scholar] [CrossRef]
- Gofa, F.; Flocas, H.; Louka, P.; Samos, I. A Coherent Approach to Evaluating Precipitation Forecasts over Complex Terrain. Atmosphere 2022, 13, 1164. [Google Scholar] [CrossRef]
- World Meteorological Organization. Guide to Meteorological Instruments and Methods of Observation 2008; WMO–No.8; World Meteorological Organization: Gerhard Adrian, Germany, 2008; 676p, ISBN 978-92-63-10008-5. [Google Scholar]
- Miętus, M.; Filipiak, J.; Jakusik, E.; Malinowska, M.; Marosz, M.; Korzeniewski, J.; Wyszkowski, A.; Owczarek, M.; Sobieraj, M. Wybrane zagadnienia klimatu lokalnego rejonu Stacji Limnologicznej UG w Borucinie, 1961–2000. Jeziora górnej Raduni i jej zlewnia w badaniach z udziałem Stacji Limnologicznej w Borucinie. Ser. Bad. Limnol. 2005, 3, 75–126. [Google Scholar]
- Kondracki, J. Geografia Regionalna Polski; Wydawnictwo Naukowe PWN: Warszawa, Polska, 2011; 441p. [Google Scholar]
- Barańczuk, K.; Barańczuk, J. Formulas for calculating ice cover thickness on selected spring lakes on the upper Radunia (Kashubian Lakeland, northern Poland). Limnol. Rev. 2020, 20, 199–205. [Google Scholar] [CrossRef]
- Woś, A. Meteorologia dla Geografów; Wydawnictwo Naukowe PWN: Warszawa, Polska, 2002; 313p. [Google Scholar]
- Kossowska-Cezak, U.; Bajkiewicz-Grabowska, E. Podstawy Hydrometeorologii; Wydawnictwo Naukowe PWN: Warszawa, Polska, 2009; 254p. [Google Scholar]
- Makać, W.; Urbanek-Krzysztofiak, D. Metody Opisu Statystycznego; Wydawnictwo Uniwersytetu Gdańskiego: Polska, 1997; 228p. [Google Scholar]
- Norcliffe, G.B. Statystyka dla Geografów. Wprowadzenie; PWN: Warszawa, Polska, 1986; 257p. [Google Scholar]
- Yule, G.U.; Kendall, M.G. Wstęp do Teorii Statystyki; PWN: Warszawa, Polska, 1966; 684p. [Google Scholar]
- Sobczyk, M. Statystyka; Wydawnictwo Naukowe PWN: Warszawa, Polska, 2011; 428p. [Google Scholar]
- Molga, M. O wpływie wysokości umieszczenia deszczomierza na wielkość opadów atmosferycznych. Gaz. Obs. PIHM 1951, 10, 1–4. [Google Scholar]
- Kuźniar, K. Wstępne wyniki badań kształtowania się wysokości opadów atmosferycznych na kilku poziomach dokonanych pomiarów. Zesz. Nauk. WSR Kraków. 1963, 17, 1. [Google Scholar]
- Chomicz, K. Opady rzeczywiste w Polsce (1931–1960). Prz. Geofiz. 1976, 21, 19–25. [Google Scholar]
- Chomicz, K. Struktura opadów atmosferycznych w Polsce. Pr. PIHM 1971, 1, 25–66. [Google Scholar]
- Chomicz, K. Ocena opadów rzeczywistych w Polsce za okres 1951–1965. Se. Mat. PIHM 1971, 674, 1–30. [Google Scholar]
- Pasela, E.; Zawora, T. Kształtowanie się opadów atmosferycznych na poziomie 0m i 1m nad powierzchnią gruntu w okresie wegetacji. Zesz. PPNR 1984, 288, 55–63. [Google Scholar]
- Sevruk, B. Adjustment of tipping-bucket precipitation gauge measurements. Atmos. Res. 1996, 42, 237–246. [Google Scholar] [CrossRef]
- Seibert, J.; Moren, A.S. Reducing systematic errors in rainfall measurements using a new type of gauge. Agric. For. Meteorol. 1999, 98–99, 341–348. [Google Scholar] [CrossRef]
- Duchon, C.E.; Essenberg, G.R. Comparative rainfall observations from pit and aboveground rain gauges with and without windshields. Water Resour. Res. 2001, 37, 3253–3263. [Google Scholar] [CrossRef]
- Nicholson, S.E.; Some, B.; McCollum, J.; Nelkin, E.; Klotter, D.; Berte, Y.; Diallo, B.M.; Gaye, I.; Kpabeba, G.; Ndiaye, O.; et al. Validation of TRMM and other rainfall estimates with a high-density gauge dataset for West Africa. Part I: Validation of GPCC rainfall product and pre-TRMM satellite and blended products. J. Appl. Meteorol. 2003, 42, 1337–1354. [Google Scholar] [CrossRef]
- Chvila, B.; Sevruk, B.; Ondrás, M. The wind–induced loss of thunderstorm precipitation measurements. Atmos. Res. 2005, 77, 29–38. [Google Scholar] [CrossRef]
- Koschmieder, H. Methods and results of definite rain measurements. Mon. Weather Rev. 1934, 62, 5–7. [Google Scholar] [CrossRef]
- Borowiak, D.; Barańczuk, J. Diversity of surface outflow from lakes which perform different hydrological functions. Limnol. Rev. 2006, 6, 13–20. [Google Scholar]
- Kilkus, K.; Stonevicius, E. Water balance structure of glacial tunnel lakes. Geografija 2004, 40, 15–18. [Google Scholar]
- Borowiak, D.; Barańczuk, J.; Marchlewicz, R. Role of lakes without outflow in shaping conditions of water circulation in the catchment. Limnol. Rev. 2003, 3, 25–30. [Google Scholar]
- Barańczuk, J.; Borowiak, D. Jezioro Charzykowskie. Atlas jezior Zaborskiego Parku Krajobrazowego. Bad. Limnologiczne. 2010, 6, 32–41. [Google Scholar]
- Staszek, W.; Polkowska, Ż.; Dubiella-Jackowska, A.; Barańczuk, J. The impact of the Tri–City Ring Road on surface water of small endorheic wetlands. Limnol. Rev. 2017, 3, 151–157. [Google Scholar] [CrossRef]
- Pociask-Karteczka, J. Opad. Zlewnia Właściwości i Procesy; IGiGP UJ: Kraków, Polska, 2003; pp. 97–116. [Google Scholar]


Disclaimer/Publisher’s Note: The statements, opinions and data contained in all publications are solely those of the individual author(s) and contributor(s) and not of MDPI and/or the editor(s). MDPI and/or the editor(s) disclaim responsibility for any injury to people or property resulting from any ideas, methods, instructions or products referred to in the content. |
© 2023 by the authors. Licensee MDPI, Basel, Switzerland. This article is an open access article distributed under the terms and conditions of the Creative Commons Attribution (CC BY) license (https://creativecommons.org/licenses/by/4.0/).
Share and Cite
Barańczuk, J.; Zeleňáková, M.; Abd-Elhamid, H.F.; Barańczuk, K.; Gharbia, S.S.; Blišťan, P.; Meulenberg, C.J.W.; Kumer, P.; Golus, W.; Markowski, M. Prediction of Actual from Climatic Precipitation with Data Collected from Northern Poland: A Statistical Approach. Sensors 2023, 23, 1159. https://doi.org/10.3390/s23031159
Barańczuk J, Zeleňáková M, Abd-Elhamid HF, Barańczuk K, Gharbia SS, Blišťan P, Meulenberg CJW, Kumer P, Golus W, Markowski M. Prediction of Actual from Climatic Precipitation with Data Collected from Northern Poland: A Statistical Approach. Sensors. 2023; 23(3):1159. https://doi.org/10.3390/s23031159
Chicago/Turabian StyleBarańczuk, Jacek, Martina Zeleňáková, Hany F. Abd-Elhamid, Katarzyna Barańczuk, Salem S. Gharbia, Peter Blišťan, Cécil J. W. Meulenberg, Peter Kumer, Włodzimierz Golus, and Maciej Markowski. 2023. "Prediction of Actual from Climatic Precipitation with Data Collected from Northern Poland: A Statistical Approach" Sensors 23, no. 3: 1159. https://doi.org/10.3390/s23031159
APA StyleBarańczuk, J., Zeleňáková, M., Abd-Elhamid, H. F., Barańczuk, K., Gharbia, S. S., Blišťan, P., Meulenberg, C. J. W., Kumer, P., Golus, W., & Markowski, M. (2023). Prediction of Actual from Climatic Precipitation with Data Collected from Northern Poland: A Statistical Approach. Sensors, 23(3), 1159. https://doi.org/10.3390/s23031159