

Physical Activity in Community-Dwelling Older Adults: Which Real-World Accelerometry Measures Are Robust? A Systematic Review

 ,
,  ,
,  and
and
Abstract
:1. Introduction
2. Materials and Methods
2.1. Search Strategy
2.2. Inclusion and Exclusion Criteria
2.3. Data Extraction and Abstraction
2.4. Clinimetric Properties
2.5. Risk of Bias Assessment
3. Results
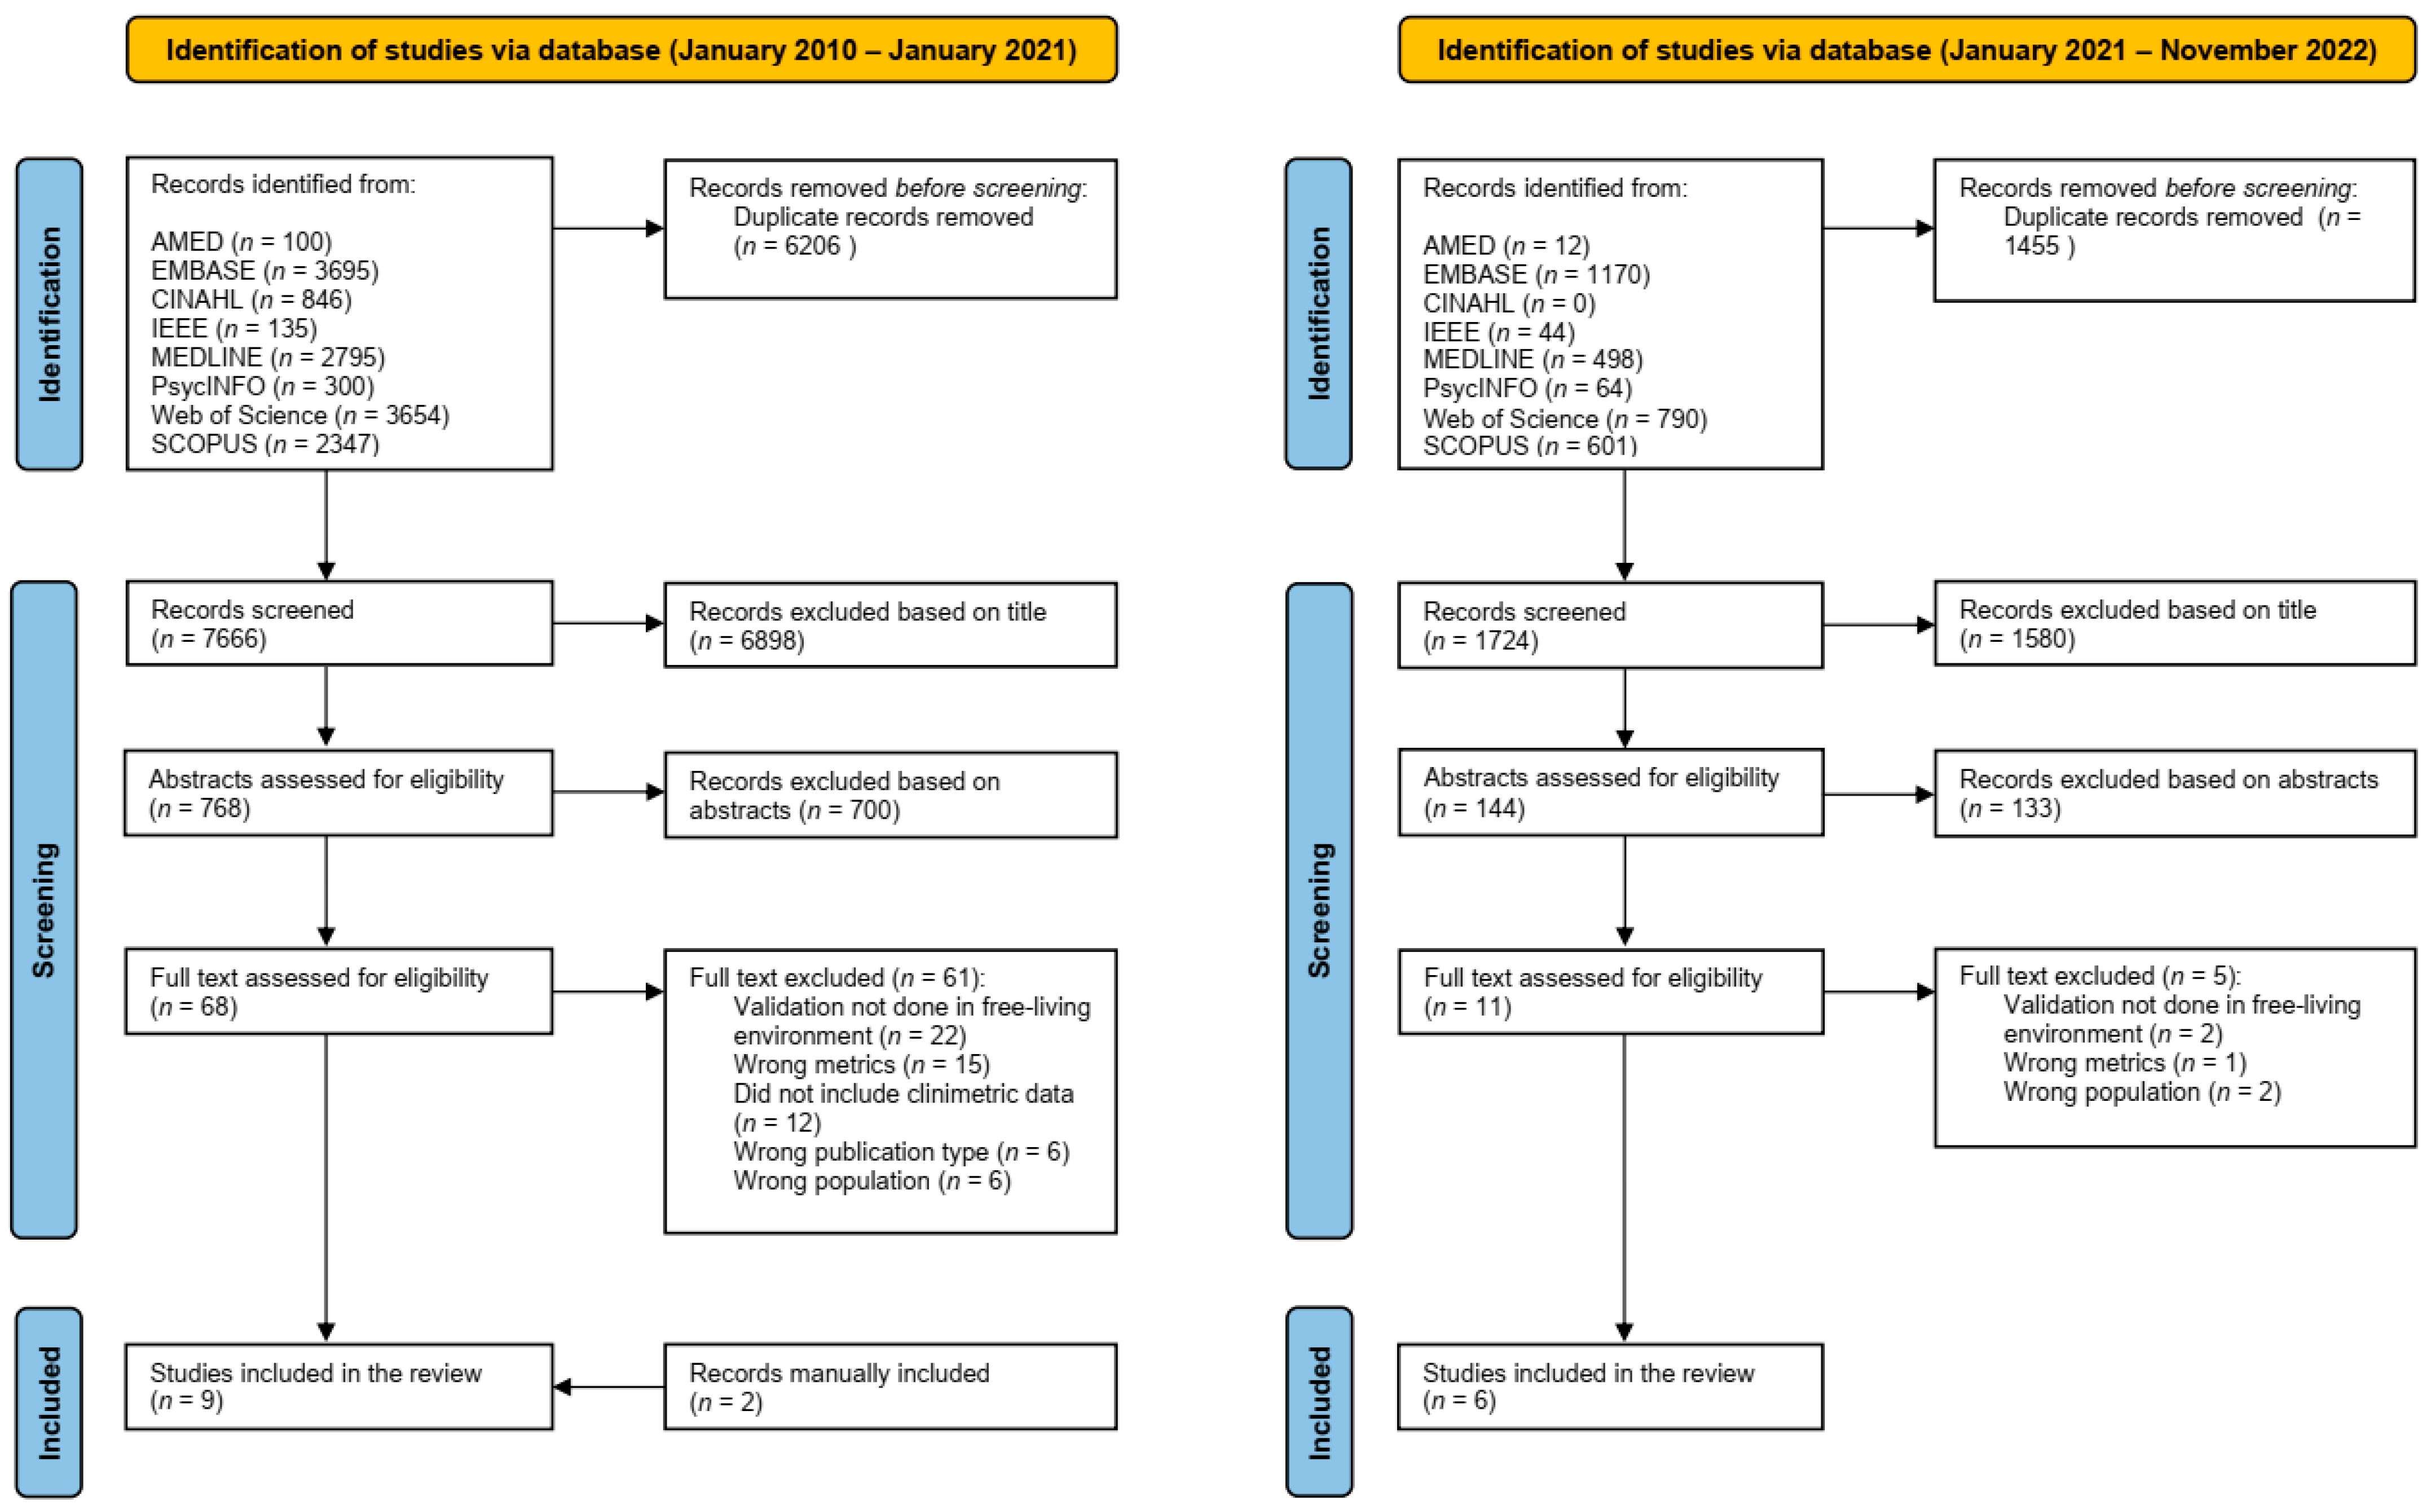
3.1. Study Selection
3.2. Quality of Studies

| Ref. | Q1 | Q2 | Q3 | Q4 | Q5 | Q6 | Q7 1 | Q8 | Q9 | Q10 | Q11 | Q12 | Q13 1 | Q14 1 | Q15 | Q16 | Q17 | Q18 | Q19 2 | Q20 | Total Score |
|---|---|---|---|---|---|---|---|---|---|---|---|---|---|---|---|---|---|---|---|---|---|
| [37] | 1 | 1 | 0 | 0 | 1 | 0 | - | 1 | 0 | 1 | 1 | 1 | - | - | 1 | 1 | 1 | 1 | 1 | 1 | 13 |
| [36] | 1 | 1 | 0 | 0 | 0 | 0 | - | 0 | 1 | 1 | 0 | 1 | - | - | 1 | 1 | 1 | 1 | 1 | 1 | 11 |
| [38] | 1 | 1 | 0 | 0 | 0 | 0 | - | 1 | 1 | 1 | 1 | 1 | - | - | 1 | 1 | 1 | 1 | 1 | 1 | 13 |
| [31] | 1 | 1 | 0 | 0 | 1 | 0 | - | 1 | 1 | 1 | 1 | 1 | - | - | 1 | 0 | 1 | 1 | 1 | 1 | 13 |
| [39] | 1 | 1 | 0 | 0 | 0 | 0 | - | 1 | 1 | 1 | 1 | 1 | - | - | 1 | 1 | 1 | 1 | 1 | 1 | 13 |
| [32] | 1 | 1 | 0 | 0 | 1 | 0 | - | 1 | 1 | 1 | 1 | 1 | - | - | 1 | 1 | 1 | 1 | 1 | 1 | 14 |
| [40] | 1 | 1 | 0 | 0 | 0 | 0 | - | 1 | 1 | 1 | 0 | 1 | - | - | 1 | 1 | 1 | 1 | 1 | 1 | 12 |
| [29] | 1 | 1 | 1 | 1 | 0 | 0 | - | 1 | 1 | 1 | 1 | 1 | - | - | 1 | 1 | 1 | 1 | 1 | 1 | 15 |
| [41] | 1 | 1 | 0 | 1 | 0 | 0 | - | 1 | 1 | 1 | 1 | 1 | - | - | 1 | 1 | 1 | 1 | 1 | 1 | 14 |
| [28] | 1 | 1 | 1 | 1 | 0 | 0 | - | 1 | 1 | 1 | 1 | 1 | - | - | 1 | 1 | 1 | 1 | 1 | 1 | 15 |
| [30] | 1 | 1 | 0 | 1 | 1 | 0 | - | 1 | 1 | 1 | 1 | 1 | - | - | 1 | 1 | 1 | 0 | 0 | 1 | 13 |
| [42] | 1 | 1 | 0 | 0 | 1 | 0 | - | 1 | 1 | 1 | 1 | 1 | - | - | 1 | 1 | 1 | 0 | 1 | 1 | 13 |
| [35] | 1 | 1 | 0 | 1 | 1 | 0 | - | 0 | 0 | 0 | 0 | 0 | - | - | 1 | 1 | 1 | 1 | 1 | 1 | 10 |
| [33] | 1 | 1 | 0 | 1 | 1 | 1 | - | 1 | 1 | 0 | 0 | 1 | - | - | 1 | 1 | 1 | 1 | 1 | 1 | 14 |
| [43] | 1 | 1 | 0 | 1 | 1 | 0 | - | 1 | 1 | 0 | 0 | 1 | - | - | 1 | 1 | 1 | 1 | 1 | 1 | 13 |
3.3. Characteristics of the Studies
3.4. Study Protocol
3.5. Reference Standard
3.6. Outcomes
3.7. Environment
3.8. Duration of Wear
3.9. Sensor Location
3.10. Reliability
3.11. Validity of Accelerometers
3.12. Responsiveness of Accelerometers
3.13. Acceptability and Adherence of Accelerometers
3.14. Summary of Results
4. Discussion
4.1. Reliability of PA Measures
4.2. Validity of PA Measures
4.3. Study Protocol
4.4. Adherence to Study Protocol
4.5. Strengths and Limitations of the Review
5. Conclusions and Implications for Future Research
Supplementary Materials
Author Contributions
Funding
Institutional Review Board Statement
Informed Consent Statement
Data Availability Statement
Acknowledgments
Conflicts of Interest
References
- Bull, F.C.; Al-Ansari, S.S.; Biddle, S.; Borodulin, K.; Buman, M.P.; Cardon, G.; Carty, C.; Chaput, J.P.; Chastin, S.; Chou, R.; et al. World Health Organization 2020 guidelines on physical activity and sedentary behaviour. Br. J. Sports Med. 2020, 54, 1451–1462. [Google Scholar] [CrossRef] [PubMed]
- Ramsey, K.A.; Rojer, A.G.M.; D’Andrea, L.; Otten, R.H.J.; Heymans, M.W.; Trappenburg, M.C.; Verlaan, S.; Whittaker, A.C.; Meskers, C.G.M.; Maier, A.B. The association of objectively measured physical activity and sedentary behavior with skeletal muscle strength and muscle power in older adults: A systematic review and meta-analysis. Ageing Res. Rev. 2021, 67, 101266. [Google Scholar] [CrossRef] [PubMed]
- Cunningham, C.; O’Sullivan, P.; Caserotti, P.; Tully, M.A. Consequences of physical inactivity in older adults: A systematic review of reviews and meta-analyses. Scand. J. Med. Sci. Sports 2020, 30, 816–827. [Google Scholar] [CrossRef] [PubMed]
- Engeroff, T.; Ingmann, T.; Banzer, W. Physical Activity Throughout the Adult Life Span and Domain-Specific Cognitive Function in Old Age: A Systematic Review of Cross-Sectional and Longitudinal Data. Sports Med. 2018, 48, 1405–1436. [Google Scholar] [CrossRef]
- Landi, F.; Onder, G.; Carpenter, I.; Cesari, M.; Soldato, M.; Bernabei, R. Physical activity prevented functional decline among frail community-living elderly subjects in an international observational study. J. Clin. Epidemiol. 2007, 60, 518–524. [Google Scholar] [CrossRef]
- Paterson, D.H.; Warburton, D.E. Physical activity and functional limitations in older adults: A systematic review related to Canada’s Physical Activity Guidelines. Int. J. Behav. Nutr. Phys. Act. 2010, 7, 1–22. [Google Scholar] [CrossRef]
- Kingston, A.; Wohland, P.; Wittenberg, R.; Robinson, L.; Brayne, C.; Matthews, F.E.; Jagger, C.; Green, E.; Gao, L.; Barnes, R.; et al. Is late-life dependency increasing or not? A comparison of the Cognitive Function and Ageing Studies (CFAS). Lancet 2017, 390, 1676–1684. [Google Scholar] [CrossRef]
- Gore, P.G.; Kingston, A.; Johnson, G.R.; Kirkwood, T.B.L.; Jagger, C. New horizons in the compression of functional decline. Age Ageing 2018, 47, 764–768. [Google Scholar] [CrossRef]
- Spaltenstein, J.; Bula, C.; Santos-Eggimann, B.; Krief, H.; Seematter-Bagnoud, L. Factors associated with going outdoors frequently: A cross-sectional study among Swiss community-dwelling older adults. BMJ Open 2020, 10, e034248. [Google Scholar] [CrossRef]
- Romero-Ortuno, R.; Casey, A.-M.; Cunningham, C.U.; Squires, S.; Prendergast, D.; Kenny, R.A.; Lawlor, B.A. Psychosocial and functional correlates of nutrition among community-dwelling older adults in Ireland. J. Nutr. Health Aging 2011, 15, 527–531. [Google Scholar] [CrossRef]
- Dowd, K.P.; Szeklicki, R.; Minetto, M.A.; Murphy, M.H.; Polito, A.; Ghigo, E.; van der Ploeg, H.; Ekelund, U.; Maciaszek, J.; Stemplewski, R.; et al. A systematic literature review of reviews on techniques for physical activity measurement in adults: A DEDIPAC study. Int. J. Behav. Nutr. Phys. Act. 2018, 15, 15. [Google Scholar] [CrossRef]
- Gao, W.; Emaminejad, S.; Nyein, H.Y.Y.; Challa, S.; Chen, K.; Peck, A.; Fahad, H.M.; Ota, H.; Shiraki, H.; Kiriya, D.; et al. Fully integrated wearable sensor arrays for multiplexed in situ perspiration analysis. Nature 2016, 529, 509–514. [Google Scholar] [CrossRef] [PubMed]
- Jung, S.; Michaud, M.; Oudre, L.; Dorveaux, E.; Gorintin, L.; Vayatis, N.; Ricard, D. The Use of Inertial Measurement Units for the Study of Free Living Environment Activity Assessment: A Literature Review. Sensors 2020, 20, 5625. [Google Scholar] [CrossRef] [PubMed]
- McCambridge, J.; Witton, J.; Elbourne, D.R. Systematic review of the Hawthorne effect: New concepts are needed to study research participation effects. J. Clin. Epidemiol. 2014, 67, 267–277. [Google Scholar] [CrossRef]
- Khandelwal, S.; Wickström, N. Evaluation of the performance of accelerometer-based gait event detection algorithms in different real-world scenarios using the MAREA gait database. Gait Posture 2017, 51, 84–90. [Google Scholar] [CrossRef] [PubMed]
- Brodie, M.A.; Coppens, M.J.; Lord, S.R.; Lovell, N.H.; Gschwind, Y.J.; Redmond, S.J.; Del Rosario, M.B.; Wang, K.; Sturnieks, D.L.; Persiani, M. Wearable pendant device monitoring using new wavelet-based methods shows daily life and laboratory gaits are different. Med. Biol. Eng. Comput. 2016, 54, 663–674. [Google Scholar] [CrossRef] [PubMed]
- Renggli, D.; Graf, C.; Tachatos, N.; Singh, N.; Meboldt, M.; Taylor, W.R.; Stieglitz, L.; Schmid Daners, M. Wearable inertial measurement units for assessing gait in real-world environments. Front. Physiol. 2020, 11, 90. [Google Scholar] [CrossRef] [PubMed]
- Lai, T.F.; Liao, Y.; Lin, C.Y.; Huang, W.C.; Hsueh, M.C.; Chan, D.C. Moderate-to-vigorous physical activity duration is more important than timing for physical function in older adults. Sci. Rep. 2020, 10, 21344. [Google Scholar] [CrossRef]
- Chen, J.H.; Lauderdale, D.S. Cognitive Function, Consent for Participation, and Compliance with Wearable Device Protocols in Older Adults. J. Gerontol. A Biol. Sci. Med. Sci. 2019, 74, 269–273. [Google Scholar] [CrossRef]
- Trost, S.G.; Mciver, K.L.; Pate, R.R. Conducting accelerometer-based activity assessments in field-based research. Med. Sci. Sports Exerc. 2005, 37, S531–S543. [Google Scholar] [CrossRef]
- Doherty, A.; Jackson, D.; Hammerla, N.; Plötz, T.; Olivier, P.; Granat, M.H.; White, T.; Van Hees, V.T.; Trenell, M.I.; Owen, C.G. Large scale population assessment of physical activity using wrist worn accelerometers: The UK Biobank Study. PLoS ONE 2017, 12, e0169649. [Google Scholar] [CrossRef] [PubMed]
- Sagelv, E.H.; Ekelund, U.; Pedersen, S.; Brage, S.; Hansen, B.H.; Johansson, J.; Grimsgaard, S.; Nordström, A.; Horsch, A.; Hopstock, L.A. Physical activity levels in adults and elderly from triaxial and uniaxial accelerometry. The Tromsø Study. PLoS ONE 2019, 14, e0225670. [Google Scholar] [CrossRef] [PubMed]
- Marin, F.; Lepetit, K.; Fradet, L.; Hansen, C.; Mansour, K.B. Using accelerations of single inertial measurement units to determine the intensity level of light-moderate-vigorous physical activities: Technical and mathematical considerations. J. Biomech. 2020, 107, 109834. [Google Scholar] [CrossRef] [PubMed]
- Buchan, D.S.; McLellan, G. Comparing physical activity estimates in children from hip-worn Actigraph GT3X+ accelerometers using raw and counts based processing methods. J. Sports Sci. 2019, 37, 779–787. [Google Scholar] [CrossRef] [PubMed]
- Straiton, N.; Alharbi, M.; Bauman, A.; Neubeck, L.; Gullick, J.; Bhindi, R.; Gallagher, R. The validity and reliability of consumer-grade activity trackers in older, community-dwelling adults: A systematic review. Maturitas 2018, 112, 85–93. [Google Scholar] [CrossRef] [PubMed]
- Moher, D.; Liberati, A.; Tetzlaff, J.; Altman, D.G.; Group, P. Preferred reporting items for systematic reviews and meta-analyses: The PRISMA statement. PLoS Med. 2009, 6, e1000097. [Google Scholar] [CrossRef]
- Ouzzani, M.; Hammady, H.; Fedorowicz, Z.; Elmagarmid, A. Rayyan—A web and mobile app for systematic reviews. Syst. Rev. 2016, 5, 1–10. [Google Scholar] [CrossRef]
- Kastelic, K.; Dobnik, M.; Löfler, S.; Hofer, C.; Šarabon, N. Validity, reliability and sensitivity to change of three consumer-grade activity trackers in controlled and free-living conditions among older adults. Sensors 2021, 21, 6245. [Google Scholar] [CrossRef]
- Farina, N.; Lowry, R.G. The Validity of Consumer-Level Activity Monitors in Healthy Older Adults in Free-Living Conditions. J. Aging Phys. Act. 2018, 26, 128–135. [Google Scholar] [CrossRef]
- Paul, S.S.; Tiedemann, A.; Hassett, L.M.; Ramsay, E.; Kirkham, C.; Chagpar, S.; Sherrington, C. Validity of the Fitbit activity tracker for measuring steps in community-dwelling older adults. BMJ Open Sport Exerc. Med. 2015, 1, e000013. [Google Scholar] [CrossRef]
- Briggs, B.C.; Hall, K.S.; Jain, C.; Macrea, M.; Morey, M.C.; Oursler, K.K. Assessing Moderate to Vigorous Physical Activity in Older Adults: Validity of a Commercial Activity Tracker. Front. Sports Act. Living 2022, 3, 766317. [Google Scholar] [CrossRef] [PubMed]
- Chigateri, N.G.; Kerse, N.; Wheeler, L.; MacDonald, B.; Klenk, J. Validation of an accelerometer for measurement of activity in frail older people. Gait Posture 2018, 66, 114–117. [Google Scholar] [CrossRef] [PubMed]
- Taylor, L.M.; Klenk, J.; Maney, A.J.; Kerse, N.; MacDonald, B.M.; Maddison, R. Validation of a body-worn accelerometer to measure activity patterns in octogenarians. Arch. Phys. Med. Rehabil. 2014, 95, 930–934. [Google Scholar] [CrossRef] [PubMed]
- Downes, M.J.; Brennan, M.L.; Williams, H.C.; Dean, R.S. Development of a critical appraisal tool to assess the quality of cross-sectional studies (AXIS). BMJ Open 2016, 6, e011458. [Google Scholar] [CrossRef] [PubMed]
- Stack, E.; Agarwal, V.; King, R.; Burnett, M.; Tahavori, F.; Janko, B.; Harwin, W.; Ashburn, A.; Kunkel, D. Identifying balance impairments in people with Parkinson’s disease using video and wearable sensors. Gait Posture 2018, 62, 321–326. [Google Scholar] [CrossRef]
- Boateng, G.; Petersen, C.L.; Kotz, D.; Fortuna, K.L.; Masutani, R.; Batsis, J.A. A Smartwatch Step-Counting App for Older Adults: Development and Evaluation Study. JMIR Aging 2022, 5, e33845. [Google Scholar] [CrossRef]
- Awais, M.; Chiari, L.; Ihlen, E.A.; Helbostad, J.L.; Palmerini, L. Classical machine learning versus deep learning for the older adults free-living activity classification. Sensors 2021, 21, 4669. [Google Scholar] [CrossRef]
- Brand, Y.E.; Schwartz, D.; Gazit, E.; Buchman, A.S.; Gilad-Bachrach, R.; Hausdorff, J.M. Gait Detection from a Wrist-Worn Sensor Using Machine Learning Methods: A Daily Living Study in Older Adults and People with Parkinson’s Disease. Sensors 2022, 22, 7094. [Google Scholar] [CrossRef]
- Burton, E.; Hill, K.D.; Lautenschlager, N.T.; Thogersen-Ntoumani, C.; Lewin, G.; Boyle, E.; Howie, E. Reliability and validity of two fitness tracker devices in the laboratory and home environment for older community-dwelling people. BMC Geriatr. 2018, 18, 103. [Google Scholar] [CrossRef]
- Dijkstra, B.; Kamsma, Y.; Zijlstra, W. Detection of gait and postures using a miniaturised triaxial accelerometer-based system: Accuracy in community-dwelling older adults. Age Ageing 2010, 39, 259–262. [Google Scholar] [CrossRef]
- Geraedts, H.A.; Zijlstra, W.; Van Keeken, H.G.; Zhang, W.; Stevens, M. Validation and User Evaluation of a Sensor-Based Method for Detecting Mobility-Related Activities in Older Adults. PLoS ONE 2015, 10, e0137668. [Google Scholar] [CrossRef] [PubMed]
- Soltani, A.; Paraschiv-Ionescu, A.; Dejnabadi, H.; Marques-Vidal, P.; Aminian, K. Real-world gait bout detection using a wrist sensor: An unsupervised real-life validation. IEEE Access 2020, 8, 102883–102896. [Google Scholar] [CrossRef]
- Yamada, Y.; Hashii-Arishima, Y.; Yokoyama, K.; Itoi, A.; Adachi, T.; Kimura, M. Validity of a triaxial accelerometer and simplified physical activity record in older adults aged 64–96 years: A doubly labeled water study. Eur. J. Appl. Physiol. 2018, 118, 2133–2146. [Google Scholar] [CrossRef] [PubMed]
- Bourke, A.K.; Ihlen, E.A.F.; Bergquist, R.; Wik, P.B.; Vereijken, B.; Helbostad, J.L. A physical activity reference data-set recorded from older adults using body-worn inertial sensors and video technology—The ADAPT study data-set. Sensors 2017, 17, 559. [Google Scholar] [CrossRef]
- Bourke, A.K.; Ihlen, E.A.F.; Helbostad, J.L. Development of a gold-standard method for the identification of sedentary, light and moderate physical activities in older adults: Definitions for video annotation. J. Sci. Med. Sport 2019, 22, 557–561. [Google Scholar] [CrossRef] [PubMed]
- Westerterp, K.R. Doubly labelled water assessment of energy expenditure: Principle, practice, and promise. Eur. J. Appl. Physiol. 2017, 117, 1277–1285. [Google Scholar] [CrossRef]
- Awais, M.; Chiari, L.; Ihlen, E.A.F.; Helbostad, J.L.; Palmerini, L. Physical activity classification for elderly people in free-living conditions. IEEE J. Biomed. Health Inform. 2018, 23, 197–207. [Google Scholar] [CrossRef]
- Freedson, P.S.; Melanson, E.; Sirard, J. Calibration of the computer science and applications, inc. accelerometer. Med. Sci. Sports Exerc. 1998, 30, 777–781. [Google Scholar] [CrossRef]
- Najafi, B.; Aminian, K.; Loew, F.; Blanc, Y.; Robert, P.A. Measurement of stand-sit and sit-stand transitions using a miniature gyroscope and its application in fall risk evaluation in the elderly. IEEE Trans. Biomed. Eng. 2002, 49, 843–851. [Google Scholar] [CrossRef]
- Agency, I.A.E. IAEA Human Health Series No. 3. Int. At. Energy Agency 2009. [Google Scholar]
- Harris, J.A.; Benedict, F.G. A biometric study of human basal metabolism. Proc. Natl. Acad. Sci. USA 1918, 4, 370–373. [Google Scholar] [CrossRef] [PubMed]
- Lindemann, U.; Zijlstra, W.; Aminian, K.; Chastin, S.F.; De Bruin, E.D.; Helbostad, J.L.; Bussmann, J.B. Recommendations for standardizing validation procedures assessing physical activity of older persons by monitoring body postures and movements. Sensors 2014, 14, 1267–1277. [Google Scholar] [CrossRef] [PubMed]
- Coviello, G.; Florio, A.; Avitabile, G.; Talarico, C.; Wang-Roveda, J.M. Distributed full synchronized system for global health monitoring based on flsa. IEEE Trans. Biomed. Circuits Syst. 2022, 16, 600–608. [Google Scholar] [CrossRef]
- Devereux-Fitzgerald, A.; Powell, R.; Dewhurst, A.; French, D.P. The acceptability of physical activity interventions to older adults: A systematic review and meta-synthesis. Soc. Sci. Med. 2016, 158, 14–23. [Google Scholar] [CrossRef]
- Collins, J.E.; Yang, H.Y.; Trentadue, T.P.; Gong, Y.; Losina, E. Validation of the Fitbit Charge 2 compared to the ActiGraph GT3X+ in older adults with knee osteoarthritis in free-living conditions. PLoS ONE 2019, 14, e0211231. [Google Scholar] [CrossRef] [PubMed]
- Park, J.; Ishikawa-Takata, K.; Tanaka, S.; Bessyo, K.; Tanaka, S.; Kimura, T. Accuracy of estimating step counts and intensity using accelerometers in older people with or without assistive devices. J. Aging Phys. Act. 2017, 25, 41–50. [Google Scholar] [CrossRef] [PubMed]
- Chen, T.; Honda, T.; Chen, S.; Narazaki, K.; Kumagai, S. Dose–Response Association between Accelerometer-Assessed Physical Activity and Incidence of Functional Disability in Older Japanese Adults: A 6-Year Prospective Study. J. Gerontol. Ser. A 2020, 75, 1763–1770. [Google Scholar] [CrossRef] [PubMed]
- Leroux, A.; Xu, S.; Kundu, P.; Muschelli, J.; Smirnova, E.; Chatterjee, N.; Crainiceanu, C. Quantifying the predictive performance of objectively measured physical activity on mortality in the UK Biobank. J. Gerontol. Ser. A 2021, 76, 1486–1494. [Google Scholar] [CrossRef]
| Factors | Inclusion Criteria | Exclusion Criteria |
|---|---|---|
| Language | published in the English language | published in any other than English |
| Time frame | 1 January 2010 to 25 November 2022 | not applicable |
| Setting | living in the community and including those in retirement villages | studies only including participants from aged residential care settings, including supported living, assisted living, nursing homes, care homes |
| Topic | data were collected in a real-world environment; studies that reported at least one clinimetric property—reliability, validity, responsiveness | studies in which PA were not objectively quantified using accelerometry; studies not concerned with PA metrics; studies that only reported only qualitative data; studies that only investigated disease-specific populations, e.g., Parkinson’s Disease, Alzheimer’s Disease, stroke; studies that only include laboratory-based measurement |
| Population | aged 65 years and above | children; adults < 65 years |
| Publication type | peer-reviewed publications; randomized controlled studies, cross-sectional and longitudinal (retrospective and prospective) quantitative studies, case–control studies | conference abstracts; posters; study protocols; reviews; meta-analyses; grey literature |
| Study | Sample Size (n) | Mean Age (yrs) ± SD | Female (%) |
|---|---|---|---|
| Awais et al., 2021, Norway [37] | 20 * | 76.4 ± 5.6 | 75.0 |
| Brand et al., 2022, Israel [38] | 12 | 76.1 ± 7.3 | 75.0 |
| Briggs et al., 2022, US [31] | 35 | 73.7 ± 6.3 | 6.0 |
| Burton et al., 2018, Australia [39] | 30 | 74.20 ± 5.78 | 64.5 |
| Chigateri et al., 2018, New Zealand [32] | 23 | 80.5, range: 75–92 | 74.0 |
| Dijkstra et al., 2010, Netherlands [40] | 5 | 73.0 ± 6.2 | 80.0 |
| Farina et al., 2018, UK [29] | 25 | 72.5 ± 4.9 | 48.0 |
| Geraedts et al., 2015, Netherlands [41] | Frail (n = 7); Non-frail (n = 13) | Frail (84.1 ± 2.6); Non-frail (77.3 ± 5.5) | Frail (100%); Non-frail (61.5%) |
| Kastelic et al., 2021, Slovenia [28] | 16 (Polar Vantage M); 17 (Garmin Vivoactive 4s); 17 (Garmin Vivosport); | 74.0 ± 5.0 | 56.3 (Polar Vantage M); 70.6 (Garmin Vivoactive 4s); 58.8 (Garmin Vivosport); |
| Paul et al., 2015, Australia [30] | 32 | 67.7 ± 5.7 | 63.0 |
| Soltani et al., 2020, Switzerland [42] | 37 | 64.0 ± 11.0 | 51.3 |
| Taylor et al., 2014, New Zealand [33] | Independent (15); Long-term care (7) | Independent (87.9 ± 5.1); Long-term care (88.3 ± 5.3) | Independent (78.6%); Long-term care (85.7%) |
| Yamada et al., 2018, Japan [43] | With sporting habits (9); Without sporting habits (19); Frail (16) | With sporting habits (71 ± 5); Without sporting habits (74 ± 7); Frail (84 ± 8)) | With sporting habits (33.3%); Without sporting habits (68.4%); Frail (50%) |
| Study | Design and Settings | Aims | Inclusion Criteria | Exclusion Criteria | Strengths of Study | Limitations of Study |
|---|---|---|---|---|---|---|
| Awais et al. [37] | Cross-sectional—validation study; dataset (ADAPT) used in the study was based on Bourke et al. 1 All free-living activities were performed in participants’ homes. | To use deep learning approach to classify physical activity, and to compare the performance of the deep learning approach with classical machine learning approach. Algorithms tested were PAC-LSTM, PAC-All-Feat, PAC-CFS, PAC-FCBF and PAC-ReliefF. | Aged 65 years and over; able to walk 100 m without walking aids; accepts oral instructions; living independently. | ND * | Study included a well annotated dataset of older people in free-living conditions. | Dataset was not large for machine learning and deep learning type of studies. |
| Brand et al. [38] | Cross-sectional—validation study; free-living measurements were carried out in participants’ homes and in the community. | To detect gait from wrist worn tri-axial accelerometer recordings of daily living of older adults, using an anomaly detection algorithm and compared its performance to four previously published gait detection algorithms. | ND * | ND * | ND * | The current study did not investigate shorter gait bouts (<6 s). |
| Briggs et al. [31] | Cross-sectional—validation study; free-living measurements were carried out in participants’ homes and in the community. | To determine the content validity of the Garmin Vivosmart HR compared to ActiGraph GT3X+ for the domains of daily step count and MVPA 2. | Veterans aged ≥65; able to perform ADL; able to follow instructions in a group setting; free from ischemic heart and severe lung diseases. Does not require walking assists devices; able to provide written consent. | ND * | ND * | The participants were mainly male—this limits the generalizability of the findings. |
| Burton et al. [39] | Cross-sectional—validation study; laboratory validation was carried out in outside research lab with walking space, e.g., hallway. Free-living measurements were carried out in participants’ homes and in the community. | To test the reliability and validity of two fitness trackers (Fitbit Flex and Fitbit ChargeHR) by step count when worn by older community-dwelling people. | Aged 65 years and over; living in Perth; owns a smart phone or tablet; understands English and no medical condition which made participation in the study unsafe (i.e., must be able to walk for a minimum of 2 min unassisted). | ND * | First study investigating an older population in both laboratory and free-living (over 14 days) environments using the Fitbit Flex and Fitbit ChargeHR. | Reference device (GENEactiv) did not quantify exact parameter (step count) as devices being validated. Limited generalizability as participants were older with good mobility. |
| Chigateri et al. [32] | Cross-sectional—validation study; scripted and unscripted task were performed in participants’ homes. | To validate the performance of uSense in detecting non-sedentary activities, differentiating walking and non-walking episodes for frail older people aged 75 years and above in free-living environment. | Aged ≥75; the ability to walk independently with or without a walking aid for a minimum of 20 m. | Any significant medical, orthopaedic or neurological conditions that would contraindicate normal activity, e.g., acute inflammatory arthritis, pneumonia, unstable or acute heart failure, allergy to surgical adhesive tape. | ND * | Waist-worn sensor unable to discriminate sitting and standing postures. Shuffling from walking were not explicitly differentiated. |
| Dijkstra et al. [40] | Cross-sectional—data collected at participants’ homes. | To determine the accuracy of the DynaPort system for detecting gait (walking, shuffling) and postures (lying, sitting, standing) in community-dwelling older adults during activity sequences in a home environment. | ND * | Impairments or diseases (e.g., orthopaedic, neurological) that could affect the performance of daily activities such as walking, getting in and out of a chair or bed. | ND * | Study was based on large number of fairly short activities. Results may further improve during prolonged monitoring when older adults are expected to have longer periods of sedentary activity. |
| Farina et al. [29] | Cross-sectional—validation study; validation was carried out in the research lab. Free-living measurements were carried out in participants’ homes and in the community. | To validate two commercially available devices (Misfit Shine and Fitbit Charge HR) against two well-validated research-grade, tri-axial activity monitors (ActiGraph GT3X+ and New Lifestyle NL2000i) in community-dwelling older adults in free-living conditions. To determine whether the Misfit Shine, which is designed to be worn on the wrist or waist, is valid to wear on one or both locations. | Community-dwelling older adults; aged 65–84 | Not independently ambulatory or use of a walking aid (self-reported). | ND * | The accuracy of the consumer-level devices is based upon the agreement with existing reference devices that assumes validity in an older population. The population was composed solely of healthy older adults who were independently ambulatory, thus might not be generalizable on frail older populations. Did not have objective means to determine whether participants wore the device in accordance with the protocol. |
| Geraedts et al. [41] | Cross-sectional—validation study; all data collected at participants’ homes. | To assess the validity of a sensor-based method to detect time-on-legs (standing) and daily life mobility related postures in older adults based on a necklace-worn motion sensor. To evaluate user opinion about the practical use of the sensor. | Community-dwelling or living in an older adult home; aged ≥70 years; able to walk 10 m without support or with a cane or walker. | Orthopaedic impairments that debilitate the ability to walk unsupported for ten metres; total hip or knee replacement surgery in the previous six months; having had a stroke within the last six months; Parkinson’s disease stage 4/5 or other neurologic diseases that can impair daily functioning or visual problems to a degree that make it impossible for the participant to accurately read the questionnaires or walk around safely. | Validation was carried out in semi-structured home environment and not in lab settings. Both frail and non-frail participants were included in the study. | Free living data collection was limited to 30 min only. Outdoor activities, such as cycling was not included in study. Participants performed movements in a rushed manner to complete several tasks which has an impact on accuracy. |
| Kastelic et al. [28] | Cross-sectional—validation study; free-living measurements were carried out in participants’ homes and in the community. | To explore the validity, reliability and sensitivity to change of movement behaviors metrics from three activity trackers in free-living conditions when worn by older adults | Aged ≥60 years; able to walk independently without mobility aids; absence of substantial (self-reported) neurological and cognitive impairments | ND * | Approach included key measurement of properties of three commonly used activity trackers, in both controlled and free-living environments. | Results cannot be generalized to other populations, e.g., the older adult population with physical impairments that significantly affect ambulation. The use of research-grade monitor ActiGraph as a convergent measure as the ground-truth for free-living tasks was not ideal. Inability to define the level of user’s physical activity/fitness within the proprietary wearables could have affect the computed outputs. |
| Paul et al. [30] | Cross-sectional—validation study; all data collected at participants’ homes. | To investigate the criterion validity of Fitbit step counts compared to (i) visual count and (ii) ActiGraph accelerometer step counts. To investigate the accuracy of ActiGraph step counts compared to visual count in community-dwelling older people. | Aged over 60 years; lived at home; were regular (weekly) users of the internet via a computer or tablet device and left their house regularly (at least once per week) without physical assistance from another person. | Were housebound; had a cognitive impairment. diagnosis of dementia or a Memory Impairment score < 5; had insufficient English language skills to fully participate in the programme; had a progressive neurological condition or a medical condition precluding exercise; were currently participating in 150 min of moderate intensity physical activity per week and had undergone a fall risk assessment in the past year with subsequent adoption of recommendations. | ND * | ND * |
| Soltani et al. [42] | Cross-sectional—validation study; free-living measurements were carried out in participants’ homes and in the community. | To investigate the accuracy and precision of an algorithm designed to detect gait bouts in free-living conditions using a single three-dimensional accelerometer on a wrist, and on older adults. | ND * | ND * | ND * | ND * |
| Taylor et al. [33] | Cross-sectional—data collected at retirement village and participants’ homes. | To evaluate the validity of the DynaPort MoveMonitor system for detection of gait and postures (sitting, lying, standing) in people aged >80 years, using video observation as the reference measure. | Aged >80 years; were living in either independent or in long-term care (nursing home) facilities at the retirement village; able to transfer and walk independently with or without a walking aid. | ND * | ND * | The use of scripted test protocol could have increased error when testing short activity bouts. In real life, transitions are less common, and the duration of activity bouts, especially inactivity, is longer. Therefore, the unscripted test protocol might better reflect the accelerometer’s validity for everyday activity recognition than the short activity bouts used in the scripted test protocol. |
| Yamada et al. [43] | Cross-sectional—data collected at participants’ homes. | To examine the validity of a triaxial accelerometer in estimating total energy expenditure and physical activity levels in older adults with the doubly labelled water method. | Aged >64; weight is stable. | On medications known to affect weight, kidney function, or metabolism | ND * | Participants were recruited from ongoing health and physical function check-up cohort and institutionalized people. The participants of the annual check-up tend to have high motivation to be active to prevent decrease in physical function. Small sample size for generalisability. Selection bias may have occurred. |
| Study | Brand of PA Instrument | Testing Protocol | PA Metrics | Definitions of PA Metrics | Reliability | Validity | Responsiveness |
|---|---|---|---|---|---|---|---|
| Awais et al. [37] | uSense (on chest, L5 and thigh); Shimmer3 (on non-dominant wrist) | To use deep learning approach to classify physical activity; and to compare the performance of the deep learning approach with classical machine learning approach. Algorithms tested were PAC-LSTM, PAC-All-Feat, PAC-CFS, PAC-FCBF and PAC-ReliefF 1. | Participants performed unsupervised activities of daily living but were advised to include a set of defined activities 2 (see Bourke et al. for more details). All activities were performed in their own homes. | Sitting: When the person’s buttock is on the seat of the chair and their trunk is in a continuous relatively upright posture. Lying: The person’s body, including trunk and thigh are in a relatively horizontal posture supported along the length of the body. Standing: The person is in an upright posture with both feet supporting the person’s body weight, with no feet movement. Walking: Locomotion towards a destination with 1 stride or more, (minimum: 1 step with both feet, finishing where 1 foot is placed beside the other foot). 2 | Inter-rater reliability 2 was calculated from five raters annotating one randomly selected video. Cohen’s Kappa was 90.05%. | F-scores (in %) were computed for sitting, lying, standing and walking activities. Overall F-score (mean of all classes) was used to compare between algorithms. PAC-LSTM: walking: 94.48%; sitting: 99.90%; standing: 96.09%; lying: 98.46%; Overall: 97.23% PAC-All-Feat: walking: 92.65%; sitting: 99.81%; standing: 95.48%; lying: 89.39%; Overall: 94.33% PAC-CFS: walking: 93.32%; sitting: 99.68%; standing: 95.29%; lying: 84.72%; Overall: 93.25% PAC-FCBF: walking: 86.91%; sitting: 99.69%; standing: 91.58%; lying: 86.49%; Overall: 91.17% PAC-ReliefF: walking: 93.48%; sitting: 99.95%; standing: 95.41%; lying: 98.46%; Overall: 96.83% | ND * |
| Brand et al. [38] | Garmin (Garmin International, Olathe, KS, US), AX3 (Axivity, UK) (as reference) | Participants wore Garmin on their nondominant wrist and AX3 on L5, for up to 10 days. | Gait bouts based on 6 s windows; Amount of daily walking. | ND * | ND * | The new algorithm had 76.2% accuracy, 29.9% precision, 67.6% sensitivity and 78.1% specificity in detecting gait bouts. The Pearson’s correlation coefficient for amount of daily walking was 0.84. | ND * |
| Briggs et al. [31] | Garmin Vivosmart HR (Garmin International, Olathe, KS, US), ActiGraph GT3X+ (Actigraph, Pensacola, FL, US) (as reference) | Participants wore Garmin and ActiGraph on their nondominant wrist. An additional ActiGraph was worn on the hip. Participants were instructed to wear all activity devices continuously, including sleep, except for water activities, for a minimum of 48 consecutive hours while not participating in any structured Gerofit exercise. | Daily average step counts and duration (in minutes) of MVPA. | ND * | ND * | Intraclass correlation (95% CI) between Garmin and ActiGraph (hip) was: (a) for daily step count: 0.94 (0.88, 0.97) (b) for MVPA (>2020 counts/min): 0.16 (−0.40, 0.55) (c) for MVPA (>1013 counts/min): 0.35 (−0.32, 0.70) (d) for MVPA (>1924 counts/min): 0.38 (−0.31, 0.71) BA plots revealed that Garmin overestimated MVPA compared with the hip worn ActiGraph. However, the difference was small using the lower, age specific, MVPA cut-off (see above) | ND * |
| Burton et al. [39] | Flex (FitBit, San Francisco, CA, US), ChargeHR (FitBit, San Francisco, CA, US), GENEactiv(ActivInsights Ltd., UK) (as reference for free-living) | Participants wore a randomly allocated Flex or ChargeHR fitness tracker and an accelerometer to wear for 14 days (including sleeping). The only exception was to remove when in water (e.g., shower or swimming). | Number of steps (for lab and free-living); distance walked (for lab only), sleep (for free-living) from Flex and ChargeHR. Total PA (in mins) (for free-living), MPVA (for free-living) and sleep (for free-living) from GENEactiv. | ND * | ND * | Construct validity—14-day free-living: strength of agreement (Spearman Rho’s) for steps (fitness tracker) and MPVA(GENEactiv) was 0.70 (−0.10, 0.96) (Flex—0.68, ChargeHR—0.72), steps (fitness tracker) and Total PA (GENEactiv) was 0.54 (−0.12, 0.90). | ND * |
| Chigateri et al. [32] | uSense | Scripted tasks—Two sets of TUG 3 (at usual gait speed), sit-to-stand and stand-to-sit transfers using a chair with arms and without arms. Unscripted tasks—activities that reflected what the participants normally do during the day. Both scripted and unscripted tasks were videoed and coded as sit to stand, stand to sit, sit to lie, lie to sit; lying; standing or active standing; shuffling; and walking. | Duration of tasks identified in “Testing Protocol” categorised as “walking” and “non-walking”. | Shuffling was defined as “where there was forward ambulation but not clear strides” Shuffling and walking were grouped as “walking”. Sit to stand, stand to sit, sit to lie, lie to sit; lying; standing or active standing—“non-walking”. | ND * | 95% limits of agreement between the mean video time and the algorithm time categorization during scripted activity was 1.47 s (−4.69 to 7.63) for walking and for −1.47 s (−7.63 to 4.69) non-walking. 95% limits of agreement between the mean video time and the algorithm time categorization during scripted activity was 26.5 s (18.8 to 71.6) for walking and −26.5 s (−71.6 to −18.8) for non-walking. Algorithm identified walking episodes for unscripted and scripted activities with 92.8% and 95.1%, respectively. For scripted activity, 97.2% and 91.4% agreement were achieved between the video and the algorithm for non-walking and walking activity, respectively. For unscripted activity, 92.2% and 88.7% agreement were achieved between the video and the algorithm for non-walking and walking activity, respectively. | ND * |
| Dijkstra et al. [40] | MiniMod (DynaPort) | Participants performed a fixed activity sequence including walking trajectories (1.4 m, 2.3 m, 4.5 m, taking a three-step stair) and postures (sitting, standing, lying), five times. Thereafter, they were allowed to move freely for 3 min with the only instruction that taking the stairs, sitting and lying had to be completed at least once. They also performed usual domestic activities (such as doing the dishes, watering plants, hanging up laundry or mowing the lawn). During all activities, participants were video recorded. Start and end of each activity was scored by an observer from the video analysis. Inter-rater reliability was determined for the fixed sequence task by two raters for 10 participants. | Mean activity duration of walking, sitting, standing and lying, | Walking was determined, starting from the heel-off for the initial step until ending with full floor contact of the foot making the last step 4, and the number of steps taken 2 or more. Persons were considered to be sitting when their upper body was upright and at a 90° angle to the legs. Standing was determined when the participant was in an upright position with no or a small displacement, but no distinctive steps, of the feet. Lying was defined as the person being in a horizontal position and either the side or the back of the body contacting the bed. | Inter-rater reliability was calculated from two independent raters. Intraclass correlation coefficient (ICC) for the duration of walking, sitting, standing and lying were 0.95, 0.78, 0.99 and 0.98, respectively. | Agreement per participant ranged between 68.3 and 85.9% (mean = 79.8%; SD = 6.9). Sensitivity for duration of walking, sitting, standing and lying were 93.5%, 83.2%, 80.1% and 98.7%, respectively. Specificity for duration of walking, sitting, standing and lying were 71.8%, 78.7%, 77.7% and 77.6%, respectively. Positive predictive value for duration of walking, sitting, standing and lying were 80.7%, 76.8%, 80.2% and 64.6%, respectively. | ND * |
| Farina et al. [29] | Fitbit Charge HR (FitBit, San Francisco, CA, US), Misfit Shine (Misfit Wearables), ActiGraph GT3X+ (Actigraph, Pensacola, FL, US) (as reference), NL2000i (New-Lifestyles Inc, Lee’s Summit, MO, US) (as reference). | Participants wore all 5 devices: on dominant wrist—Fitbit Charge HR and Misfit Shine, waist (dominant side)—Misfit Shine, ActiGraph GT3X+ and NL2000i (not described further). | step count, steps/day | ND * | ND * | Fitbit Charge HR (wrist)—ICC:0.86 (0.68 to 0.94) with ActiGraph GT3X+; 0.85 (0.65 to 0.94) with NL2000i. Misfit Shine (wrist) ICC:0.86 (0.67 to 0.94) with ActiGraph GT3X+; 0.83 (0.59 to 0.93) with NL2000i. Misfit Shine (waist) ICC:0.96 (0.91 to 0.99) with ActiGraph GT3X+; 0.91 (0.79 to 0.97) with NL2000i. Bland–Altman plots—compared with and both references “near perfect” agreement for Misfit (Waist), “moderately wide” agreement for Misfit (Waist), “very wide” agreement for Fitbit (Wrist). | ND * |
| Geraedts et al. [41] | Philips (Philips Research, Eindhoven, Netherlands) | Standardized movement protocol: Participants performed TUG (slow, normal, fast), Five Times Chair Rise, standing still, walking, lying and sitting with rest in between, if required. Free movement protocol: 30 min of self-chosen activities (e.g., vacuuming, reading, preparing tea or coffee, cleaning dishes and watering plants). All activities, in both protocols, were videoed, annotated and scored, namely for sitting, standing, walking and lying by three (two/three for watch video) independent raters. Participants wore the sensor over 1 week and provided feedback on comfort, weight, size and usability via questionnaire. | Total duration (in seconds) of Time-on-leg (ToL), sitting, standing, walking and lying. | ToL: the time spent actively on the legs, i.e., standing, shuffling around, walking 5 and transitions in between. Lying was defined when the person’s trunk was in a horizontal position with the back, stomach or side touching a horizontal underground without signs of further movement. Sitting was defined when the person’s trunk was in a vertical seated position without movement in the trunk. Standing was defined when the person was in an upright vertical position with no or only a small displacement, but no distinctive steps, of the feet. | Percentage of agreement was calculated for assessment of inter-rater reliability on the video annotation. ICC for free-living protocol was 0.91. | Overall agreement for non-frail participants: Standardized movement protocol: TOL—79.2%, sitting—72.9%, standing—75.9%, walking—93.3%, lying—96.9%. Free movement protocol: TOL—85.0%, sitting—84.6%, standing—70.7%, walking—86.2%, lying—99.5%. Overall agreement for frail participants: Standardized movement protocol: TOL—86.0%, sitting—78.8%, standing—83.0%, walking—92.6%, lying—97.5%. Free movement protocol: TOL—91.6%, sitting—85.1%, standing—77.4%, walking—90.9%, lying—99.9%. | ND * |
| Kastelic et al. [28] | Polar Vantage M (Polar Electro OY, Kempele, Finland); Garmin Vivoactive 4s (Garmin, Olathe, KS, US); Garmin Vivosport (Garmin, Olathe, KS, US); ActiGraph wGT3X-BT (Actigraph, Pensacola, FL, US) (as reference). | Participants wore a randomly assigned activity tracker on their non-dominant wrist, whilst wearing the ActiGraph on their waist over their dominant leg, for either six days (baseline protocol group) or 4 days (extended protocol group). 6 | Daily step count, intensity minutes 7 (calculated), active calories burned 7 (calculated). | Sedentary behaviour cut-off was 0–99 cpm 8; Light activity was 100–2019 cpm; moderate activity was 2020–5998 cpm; vigorous activity was 5999 cpm and above. | Intraclass correlation coefficients (ICC2,1) for single-day daily step counts: Polar Vantage M—0.68 [0.43, 0.85]; Garmin Vivoactive 4s—0.70 [0.44, 0.88]; Garmin Vivosport—0.65 [0.39, 0.84]. Intraclass correlation coefficients (ICC2,1) for three-day average step counts: Polar Vantage M—0.82 [0.48, 0.94]; Garmin Vivoactive 4s—0.24 [−0.56, 0.81]; Garmin Vivosport—0.66 [0.13, 0.89]. Intraclass correlation coefficients (ICC2,1) for single-day daily active kcal: Polar Vantage M—0.80 [0.61, 0.91]; Garmin Vivoactive 4s—0.66 [0.38, 0.85]; Garmin Vivosport—0.48 [0.18, 0.74]. | Agreement (ICC2,1) between Polar Vantage M and ActiGraph for steps: 0.37 (p = 0.001) Agreement (ICC2,1) between Garmin Vivosport and ActiGraph for steps: 0.98 (p = 0.000) Agreement (ICC2,1) between Garmin Vivoactive 4s and ActiGraph for steps: 0.95 (p = 0.000) Agreement (ICC2,1) between Polar Vantage M and ActiGraph for active kcal: 0.15 (p = 0.056) Agreement (ICC2,1) between Garmin Vivosport and ActiGraph for active kcal: 0.58 (p = 0.001) Agreement (ICC2,1) between Garmin Vivoactive 4s and ActiGraph for active kcal: 0.55 (p = 0.011) | Between subjects’ responsiveness over a single day activity for steps count (Guyatt’s responsiveness coefficient (GR)): Polar Vantage M—0.126; Garmin Vivosport—0.411; Garmin Vivoactive 4s—0.022 Between subjects’ responsiveness over 3-day activity for steps: Polar Vantage M—0.060; Garmin Vivosport—0.041; Garmin Vivoactive 4s—0.288 |
| Kastelic et al. [28] | Intraclass correlation coefficients (ICC2,1) for three-day average active kcal: Polar Vantage M—0.86 [0.59, 0.96]; Garmin Vivoactive 4s—0.54 [−0.26, 0.90]; Garmin Vivosport—0.66 [0.13, 0.90] | Bland–Altman plots revealed that all devices overestimated step counts: Polar Vantage M (6719 ± 4168 steps), Garmin Vivosport (740 ± 1262 steps) and Vivoactive 4s (639 ± 796 steps) Minimal detectable change in step counts over a single day (steps): Polar Vantage M: 10,832 Garmin Vivosport: 9592 Garmin Vivoactive 4s: 7714 Minimal detectable change in step counts averaged over three valid days (steps): Polar Vantage M: 6178 Garmin Vivosport: 6987 Garmin Vivoactive 4s: 5864 Minimal detectable change of active calories over a single day (kcal): Polar Vantage M: 597 Garmin Vivosport: 572 Garmin Vivoactive 4s: 446 Minimal detectable change of active calories averaged over three valid days: Polar Vantage M: 368 Garmin Vivosport: 380 Garmin Vivoactive 4s: 289 | Between subjects’ responsiveness over a single day active kcal: Polar Vantage M—0.232; Garmin Vivosport—0.261; Garmin Vivoactive 4s—0.073 Between subjects’ responsiveness over 3-day active kcal: Polar Vantage M—0.248; Garmin Vivosport—0.933; Garmin Vivoactive 4s—0.536 | ||||
| Paul et al. [30] | One (FitBit, San Francisco, CA, US); Zip (Fitbit, San Francisco, CA, US); ActiGraph GT3X+ (Actigraph, Pensacola, FL, US) | Participants performed a 2MWT 9 in the space available in their homes. Number of steps was visually counted by research physiotherapist using a hand-held stationery counter. Participants were instructed to stand still for 10 s prior to and after the 2 MWT, and the start and finish times of the 2 MWT were recorded. Participants also wore the Fitbit simultaneously with the ActiGraph during waking hours (except for water sports or bathing) for a 7-day period. Completed a physical activity log for weeklong period which data was checked against for inconsistencies and erroneous data. | steps/day | Fitbit—step counts per day estimated based on proprietary algorithm; ActiGraph—step counts in 60 s epochs and Freesdon Adult (1998) 10 equation. | ND * | 2 MWT—Fitbit versus Observer (ICC2,1 = 0.88, 95% CI 0.76 to 0.94), Fitbit and ActiGraph (ICC2,1 = 0.66, 95% CI 0.41 to 0.82), ActiGraph versus Observer (ICC2,1 = 0.60, 95% CI 0.33 to 0.79). Average steps/day—Fitbit versus ActiGraph (ICC2,1 = 0.94, 95% CI 0.88 to 0.97) but Fitbit had 716.7 more steps/day (95% CI 318.2 to 1115.1). Bland–Altman plots revealed a bias by the ActiGraph for people who took fewer steps during the 2 MWT. Bland–Altman plot revealed no systematic bias in averaged daily step counts between the Fitbit tracker and ActiGraph accelerometer. There was less percentage agreement between the Fitbit and ActiGraph for average daily steps with 34–66% of participants having Fitbit scores within 5–15% of ActiGraph scores. | ND * |
| Soltani et al. [42] | GENEactiv Original (ActivInsights Ltd., UK), ActiGraph GT9X (ActiGraph, Pensacola, FL, US) (as reference) | Participants wore GENEactiv Original on the wrist, whilst wearing the ActiGraph GT9X on the shank, for a continuous 12 h in real-world situations. | Total duration of gait bouts. | A walking period is defined as an interval with at least 3 successive steps. 11 | ND * | Leave-one subject-out cross validation for total duration of gait bouts resulted in the following: sensitivity was 87.1% [72.6, 91.8], specificity was 96.7% [95.5, 97.6], accuracy was 95.2% [94.1, 96.7], precision was 71.8% [56.4, 76.3] and F1-score was 74.9% [63.6, 83.6]. | ND * |
| Taylor et al. [33] | MoveMonitor (DynaPort) | Scripted 12: (in retirement village) performed a TUG at their usual walking pace; a 4.5 m walk and lie down on a bed for 30 s; rise from lying and stand for 30 s; and walk back to the chair and sit down. The sequence was performed twice, taking 4 to 6 min in total to complete. | Total duration (in seconds) and mean duration (in seconds) of sitting, standing, locomotion and lying. | Based on Dijkstra et al. [40] | Inter-rater reliability was calculated from two independent raters. The ICC (average measures) for sitting, standing, locomotion, and lying were 0.99, 0.98, 0.94, and 0.99, respectively. | Median percentage of error: sitting, −22.3% (IQR, −62.8% to 10.7%); standing, 24.7% (IQR, −7.3% to 39.6%); locomotion, 0.2% (IQR, −4.3% to 14.0%); and lying, 0.3% (IQR, −4.2% to 21.4%). 13 Sensitivity (Unscripted): sitting—94.5 (91.1–97.0); standing—38.6 (10.7–86.2); locomotion—92.2 (84.2–97.3); lying—100 (97.9–100) Specificity (Unscripted): sitting—81.4 (78.1–98.8); standing—96.8 (91.9–98.4); locomotion—97.1 (96.3–99.1); lying—99.2 (99.0–100) | ND * |
| Taylor et al. [33] | Unscripted (at home): move about freely; walking, sitting, standing, and lying down in a random sequence for between 5 and 9 min within their own home environment. Instruction was limited to ensure that activities were performed in their normal manner. Both scripted and unscripted tasks were recorded using a handheld digital video camera that was synchronized with the accelerometer. | ND * | Overall agreement (Unscripted): sitting—85.2 (78.7–91.5); standing—56.1 (34.8–81.2); locomotion—89.9 (80.8–94.7); lying—98.0 (73.8–100). When misclassified activities were analysed further, standing was found to be incorrectly classified as sitting for 28.1% of the scripted and 45.6% of the unscripted total standing time. Sitting was misclassified as standing for 14.9% and 5.3% of the total sitting time for the scripted and unscripted tasks, respectively. | ND * | |||
| Yamada et al. [43] | Actimarker (Panasonic, Osaka, Japan) Lifecorder (Kenz, Suzuken, Japan) | Basal metabolic rate (BMR) obtained in the laboratory over 12 wakeful hours. Total energy expenditure (TEE) was measured using doubly labelled water (DLW) method over 14 days (iii) Physical activity levels (via Actimarker) and step counts (via Lifecorder) were obtained based on “usual daily activities” over 14 days. | TEE measured via DLW method over 14 days based on step count and steps/day. | Based on IAEA 14 | ND * | The 24 h average MET of ACCTRI was significantly correlated with PAL of DLW but significantly underestimated it (p < 0.001). TEE of the ACCTRI systematically underestimated actual TEE (−14.2 ± 11.6%). Correlation between 24 h average MET of ACCTRI and PAL of DLW was R2 = 0.475, p < 0.001. Correlation between daily step counts and PAL of DLW was R2 = 0.248, p < 0.001. | ND * |
| Clinimetric Property | Measures | Range |
|---|---|---|
| Inter-rater reliability (ICC 1) | walking duration | 0.94–0.95 |
| lying duration | 0.98–0.99 | |
| sitting duration | 0.78–0.99 | |
| standing duration | 0.98–0.99 | |
| Relative reliability (ICC) | step counts | 0.24–0.82 |
| active calories | 0.48–0.86 | |
| Absolute reliability (minimal detectable change) | step counts 2 | 5864–10,832 |
| active calories 3 | 289–597 | |
| Responsiveness (Guyatt’s responsiveness coefficient) | step counts | 0.02–0.41 |
| active calories | 0.07–0.93 | |
| Criterion validity | step counts (ICC) | 0.83–0.98 |
| walking duration (%) | 63.6–94.5 | |
| lying duration (%) | 35.6–100.0 | |
| sitting duration (%) | 79.2–100.0 | |
| standing duration (%) | 38.6–96.1 | |
| Construct validity (Spearman’s Rho) | step counts and MVPA | 0.68–0.72 |
Disclaimer/Publisher’s Note: The statements, opinions and data contained in all publications are solely those of the individual author(s) and contributor(s) and not of MDPI and/or the editor(s). MDPI and/or the editor(s) disclaim responsibility for any injury to people or property resulting from any ideas, methods, instructions or products referred to in the content. |
© 2023 by the authors. Licensee MDPI, Basel, Switzerland. This article is an open access article distributed under the terms and conditions of the Creative Commons Attribution (CC BY) license (https://creativecommons.org/licenses/by/4.0/).
Share and Cite
Abdul Jabbar, K.; Mc Ardle, R.; Lord, S.; Kerse, N.; Del Din, S.; Teh, R. Physical Activity in Community-Dwelling Older Adults: Which Real-World Accelerometry Measures Are Robust? A Systematic Review. Sensors 2023, 23, 7615. https://doi.org/10.3390/s23177615
Abdul Jabbar K, Mc Ardle R, Lord S, Kerse N, Del Din S, Teh R. Physical Activity in Community-Dwelling Older Adults: Which Real-World Accelerometry Measures Are Robust? A Systematic Review. Sensors. 2023; 23(17):7615. https://doi.org/10.3390/s23177615
Chicago/Turabian StyleAbdul Jabbar, Khalid, Ríona Mc Ardle, Sue Lord, Ngaire Kerse, Silvia Del Din, and Ruth Teh. 2023. "Physical Activity in Community-Dwelling Older Adults: Which Real-World Accelerometry Measures Are Robust? A Systematic Review" Sensors 23, no. 17: 7615. https://doi.org/10.3390/s23177615
APA StyleAbdul Jabbar, K., Mc Ardle, R., Lord, S., Kerse, N., Del Din, S., & Teh, R. (2023). Physical Activity in Community-Dwelling Older Adults: Which Real-World Accelerometry Measures Are Robust? A Systematic Review. Sensors, 23(17), 7615. https://doi.org/10.3390/s23177615