
Design and Implementation of an ML and IoT Based Adaptive Traffic-Management System for Smart Cities

 ,
,  ,
,  , ,
, ,  ,
,  and
and 
Abstract
:1. Introduction
- The proposed ATM system utilizes the architecture and smart traffic signal to avoid congestion.
- We introduce a completely deterministic adaptive technique for effective and close traffic monitoring and a congestion-control system at major regional intersections on any sequence of events.
- One critical advantage of the proposed ATM structure is its ability to integrate with any adaptive method without requiring changes to the architectural style.
2. Related Work
2.1. Traffic Monitoring Based on Traffic Conditions
2.2. IoT Based Real-Time Traffic Management
2.3. ML Methods in Real-Time Traffic Management
2.4. VANET Based Real-Time Traffic Management
2.5. Comparative Analysis of Existing Work
3. Materials and Methods
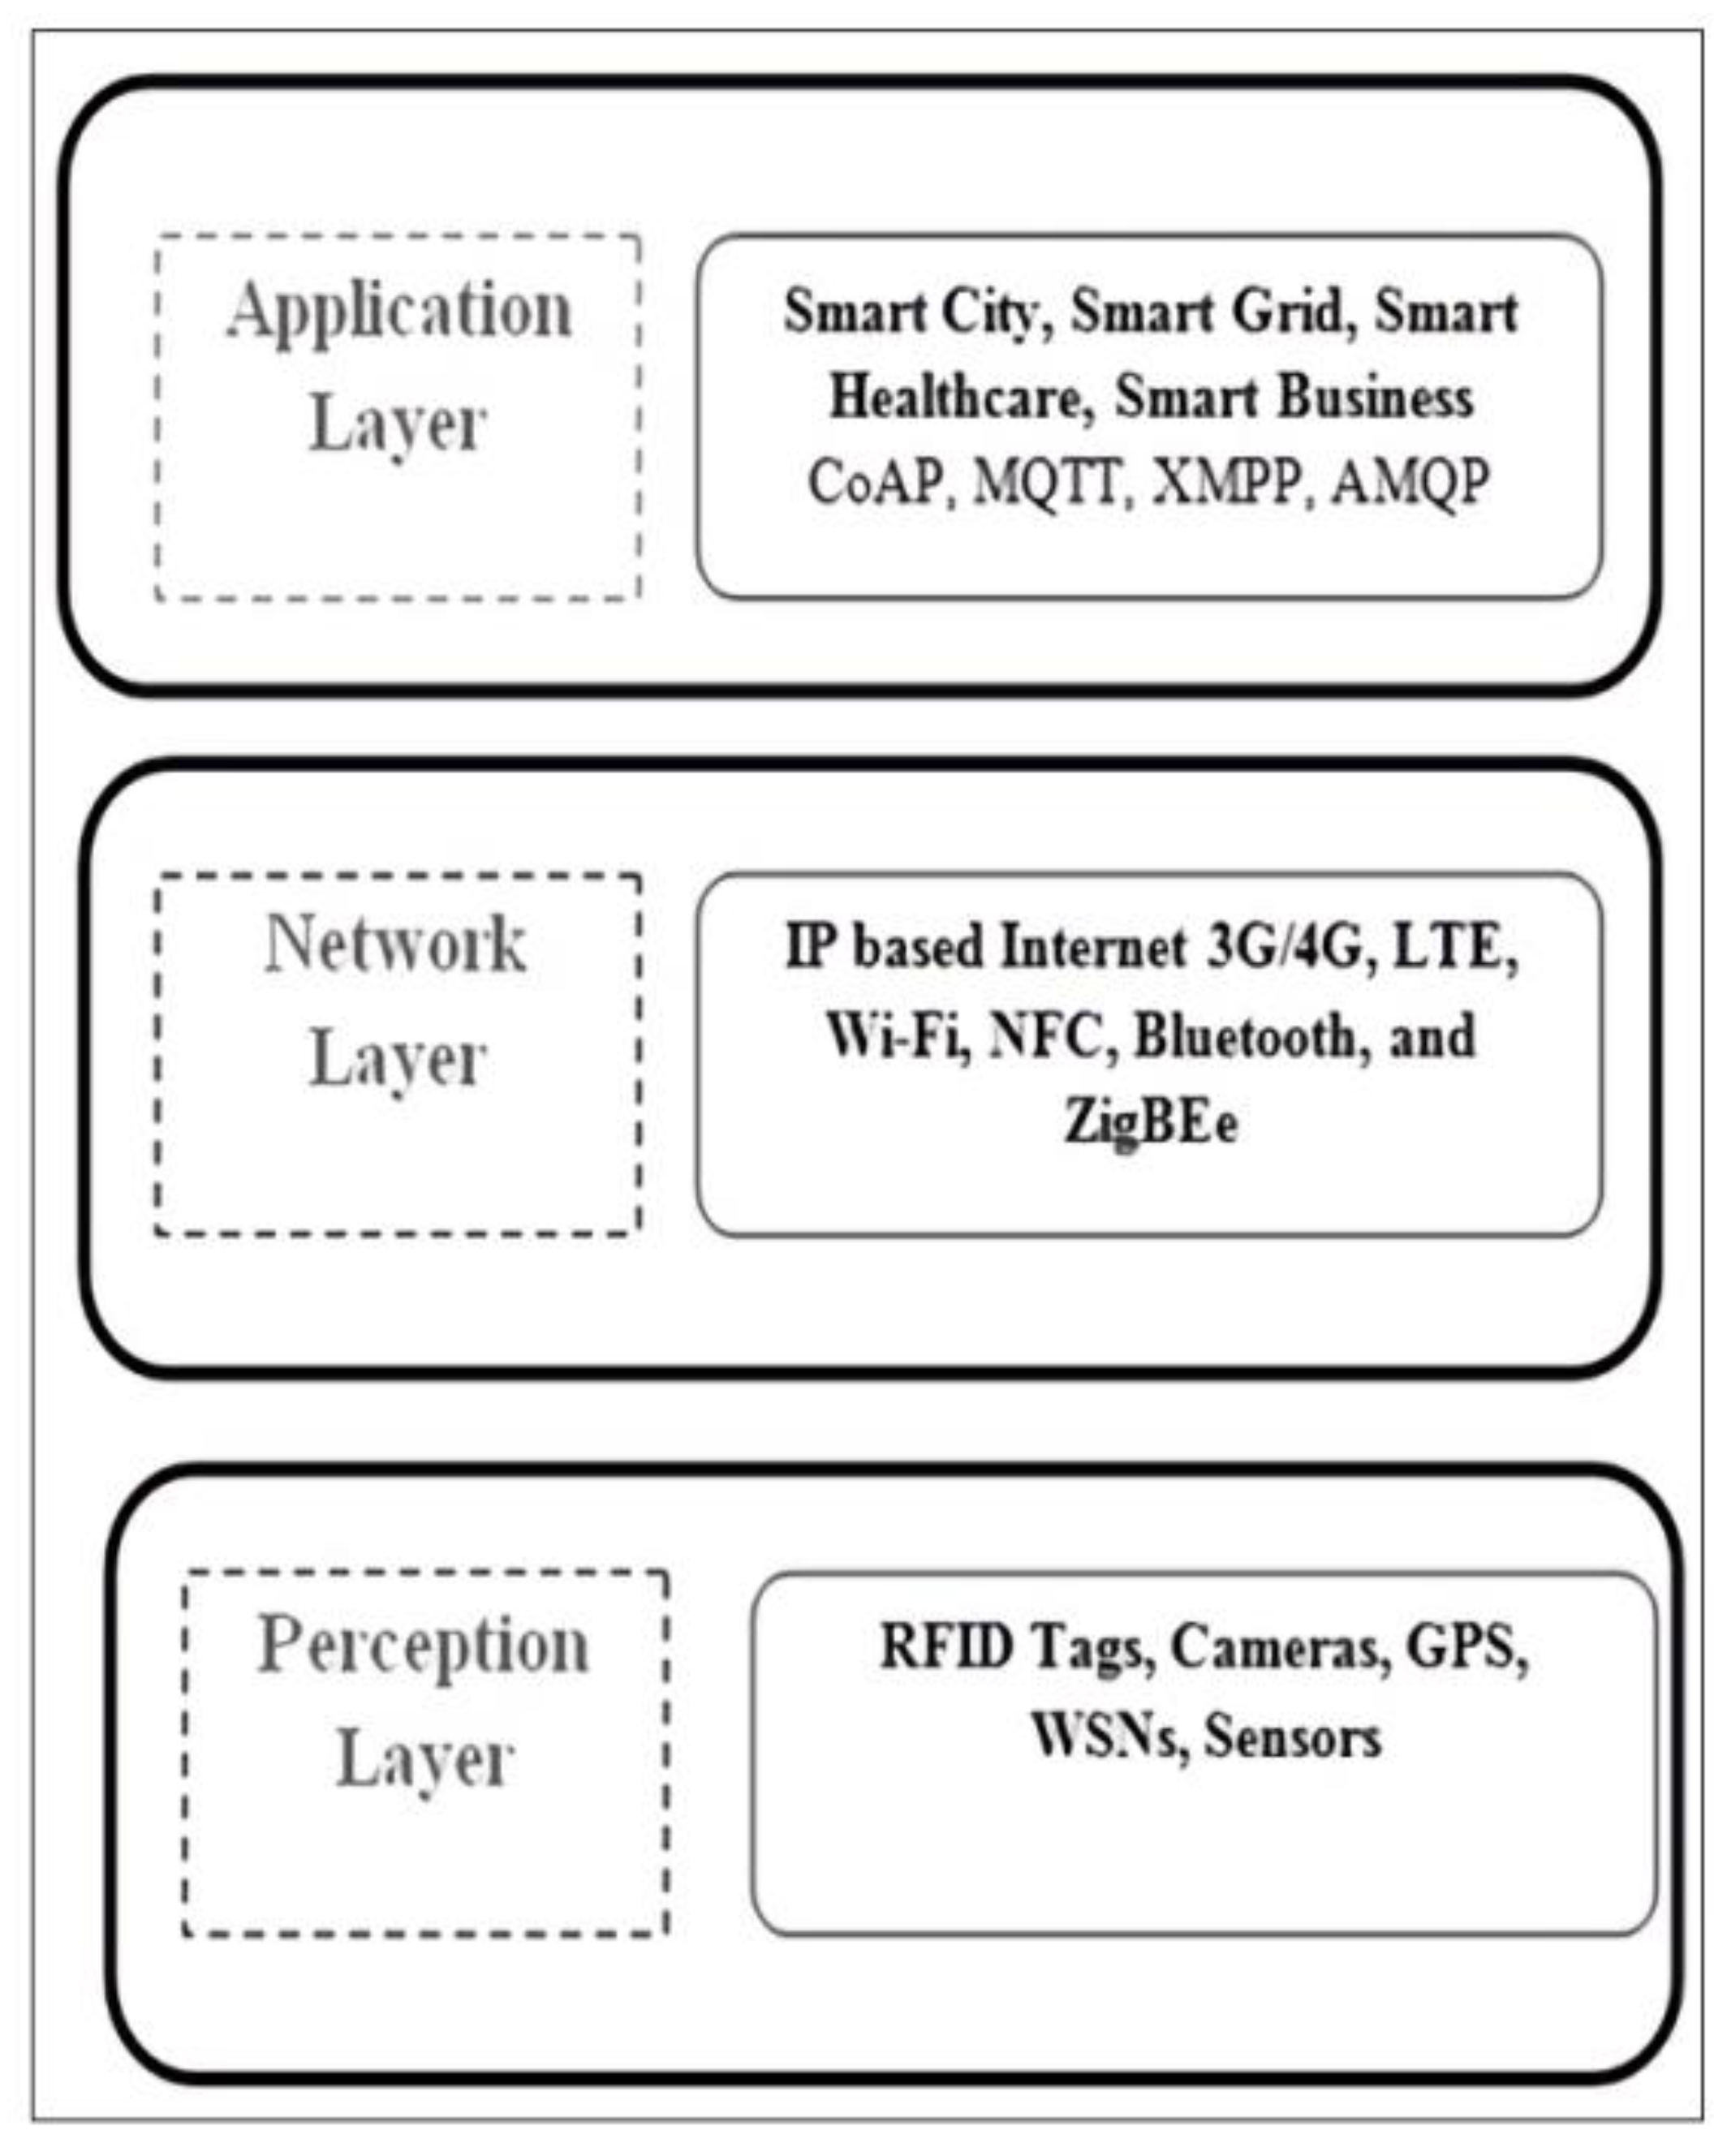
3.1. IoT Architecture
3.2. IoT in ITM
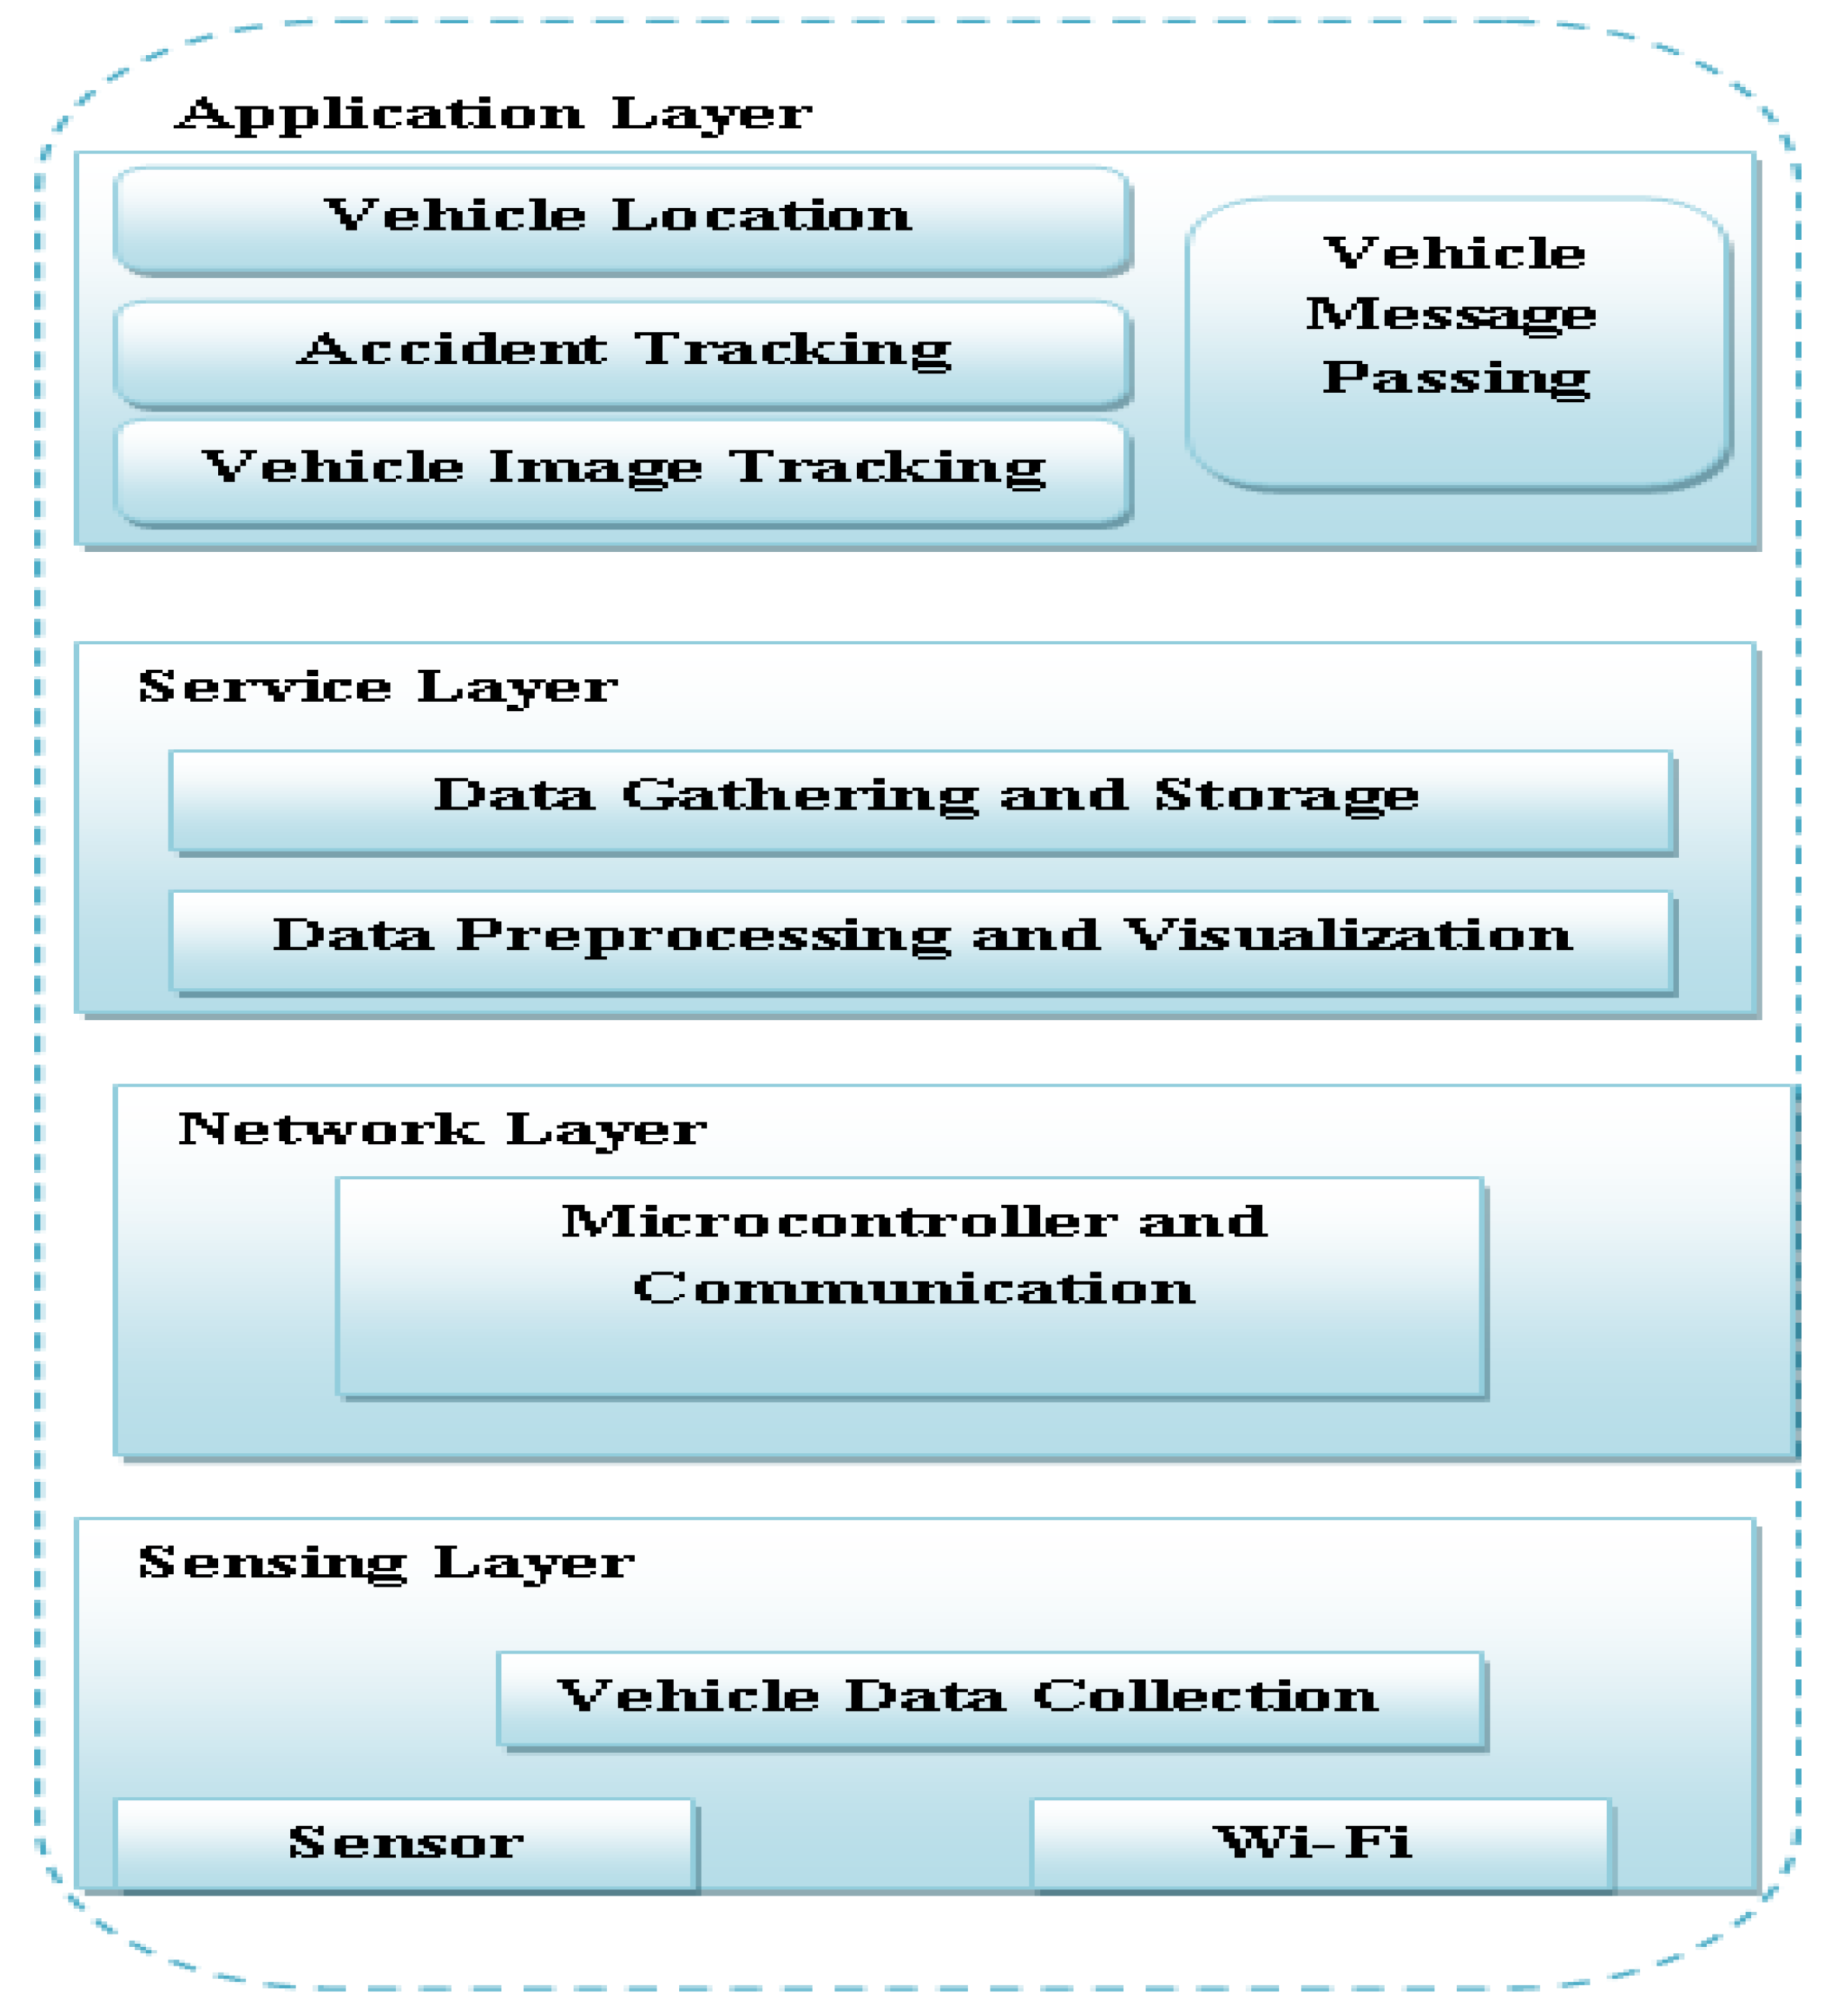
3.3. Proposed ATM System Design and Implementation
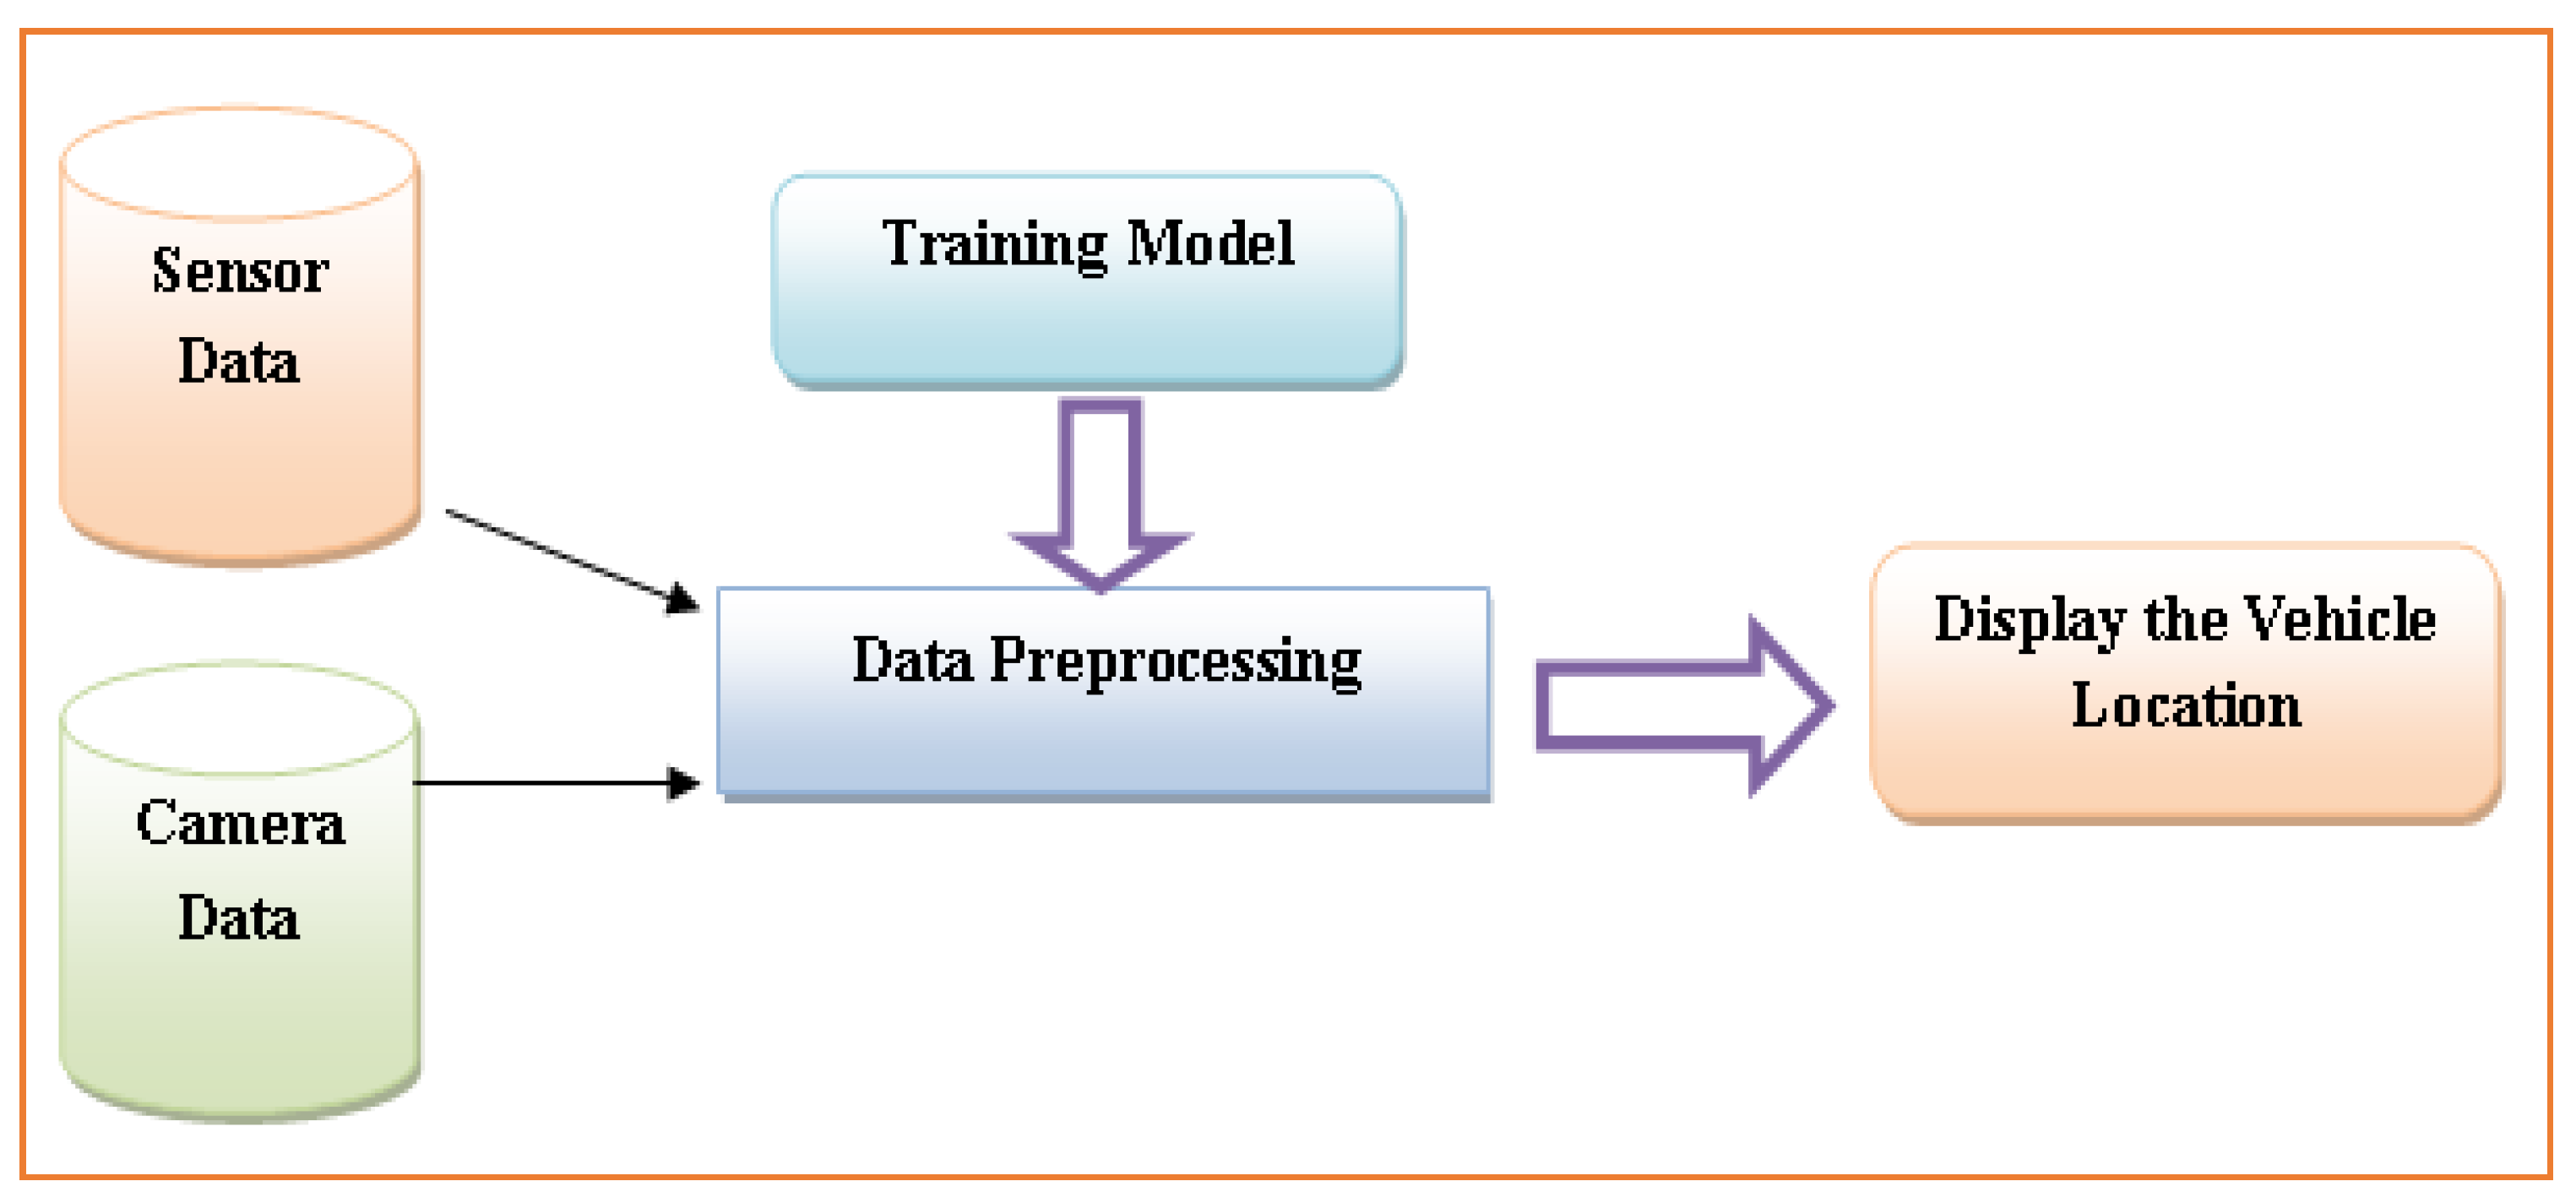
3.3.1. Vehicle Location Tracking
- Step 1—Features identified at a time interval (Ti) for the frame (Fi) are picked and monitored for a threshold number of frames, if the expressed cumulative personal motion is sufficiently massive. Almost every newly formed feature that is extracted is linked to the presently recorded characteristics inside an Euclidean distance minimum.
- Step 2—The distance (Disi,j) between all presently monitored sets of linked functionalities (Lfi,j) is approximated, and the upper and lower limits intervals are revised. The Dseg represents the value of the feature segmentation threshold. The linked vehicles’ characteristics can be defined as mentioned in (1).[Max Tidij (Ti) − Min Tidij(Ti)] (Dseg)
- Step 3—The graph’s linked features are discovered. Each related component, i.e., pair of attribute paths, represents a vehicle observation. Suppose all of the functionalities that comprise a factor are no longer recorded. The attributes are eliminated from the graph, and the vehicle hypothesis’ attributes (speed vector, centroid position, and vehicle size) are calculated.
3.3.2. Accident Detection Module
3.3.3. Vehicle Image Processing Module in ITM
| Algorithm 1: Image processing in the intelligent transport system |
| Step-1. Image data collection: using a camera and sensor installed over the road. |
| Step-2 Preprocessing phase: To process the images as follows- |
| 2.1 Images are converted into a standard size (i.e., 450 × 450 pixels) |
| 2.2 Convert all the captured RGB images into grayscale images. |
| Step-3. Edge detection phase: Canny edge detection method |
| Step-4. Pixel match technique: The output of step 3 is compared by using pixel to pixel (P.P.M.) matching techniques |
| Step-5. Timing allocation: It depends on the result of step 4; the percentage of image matching criteria is as follows: |
| 5.1 If the image matched = 40%, then on a green light for 90 s |
| 5.2 If the 40% image matched = 70% then on green light for 60 s |
| 5.3 If the 70% image matched = 90% then on green light for 30 s |
| 5.4 If the 90% image matched = 100% then on Red light for 90 s |
| 5.5 Repeat steps 3–5 |
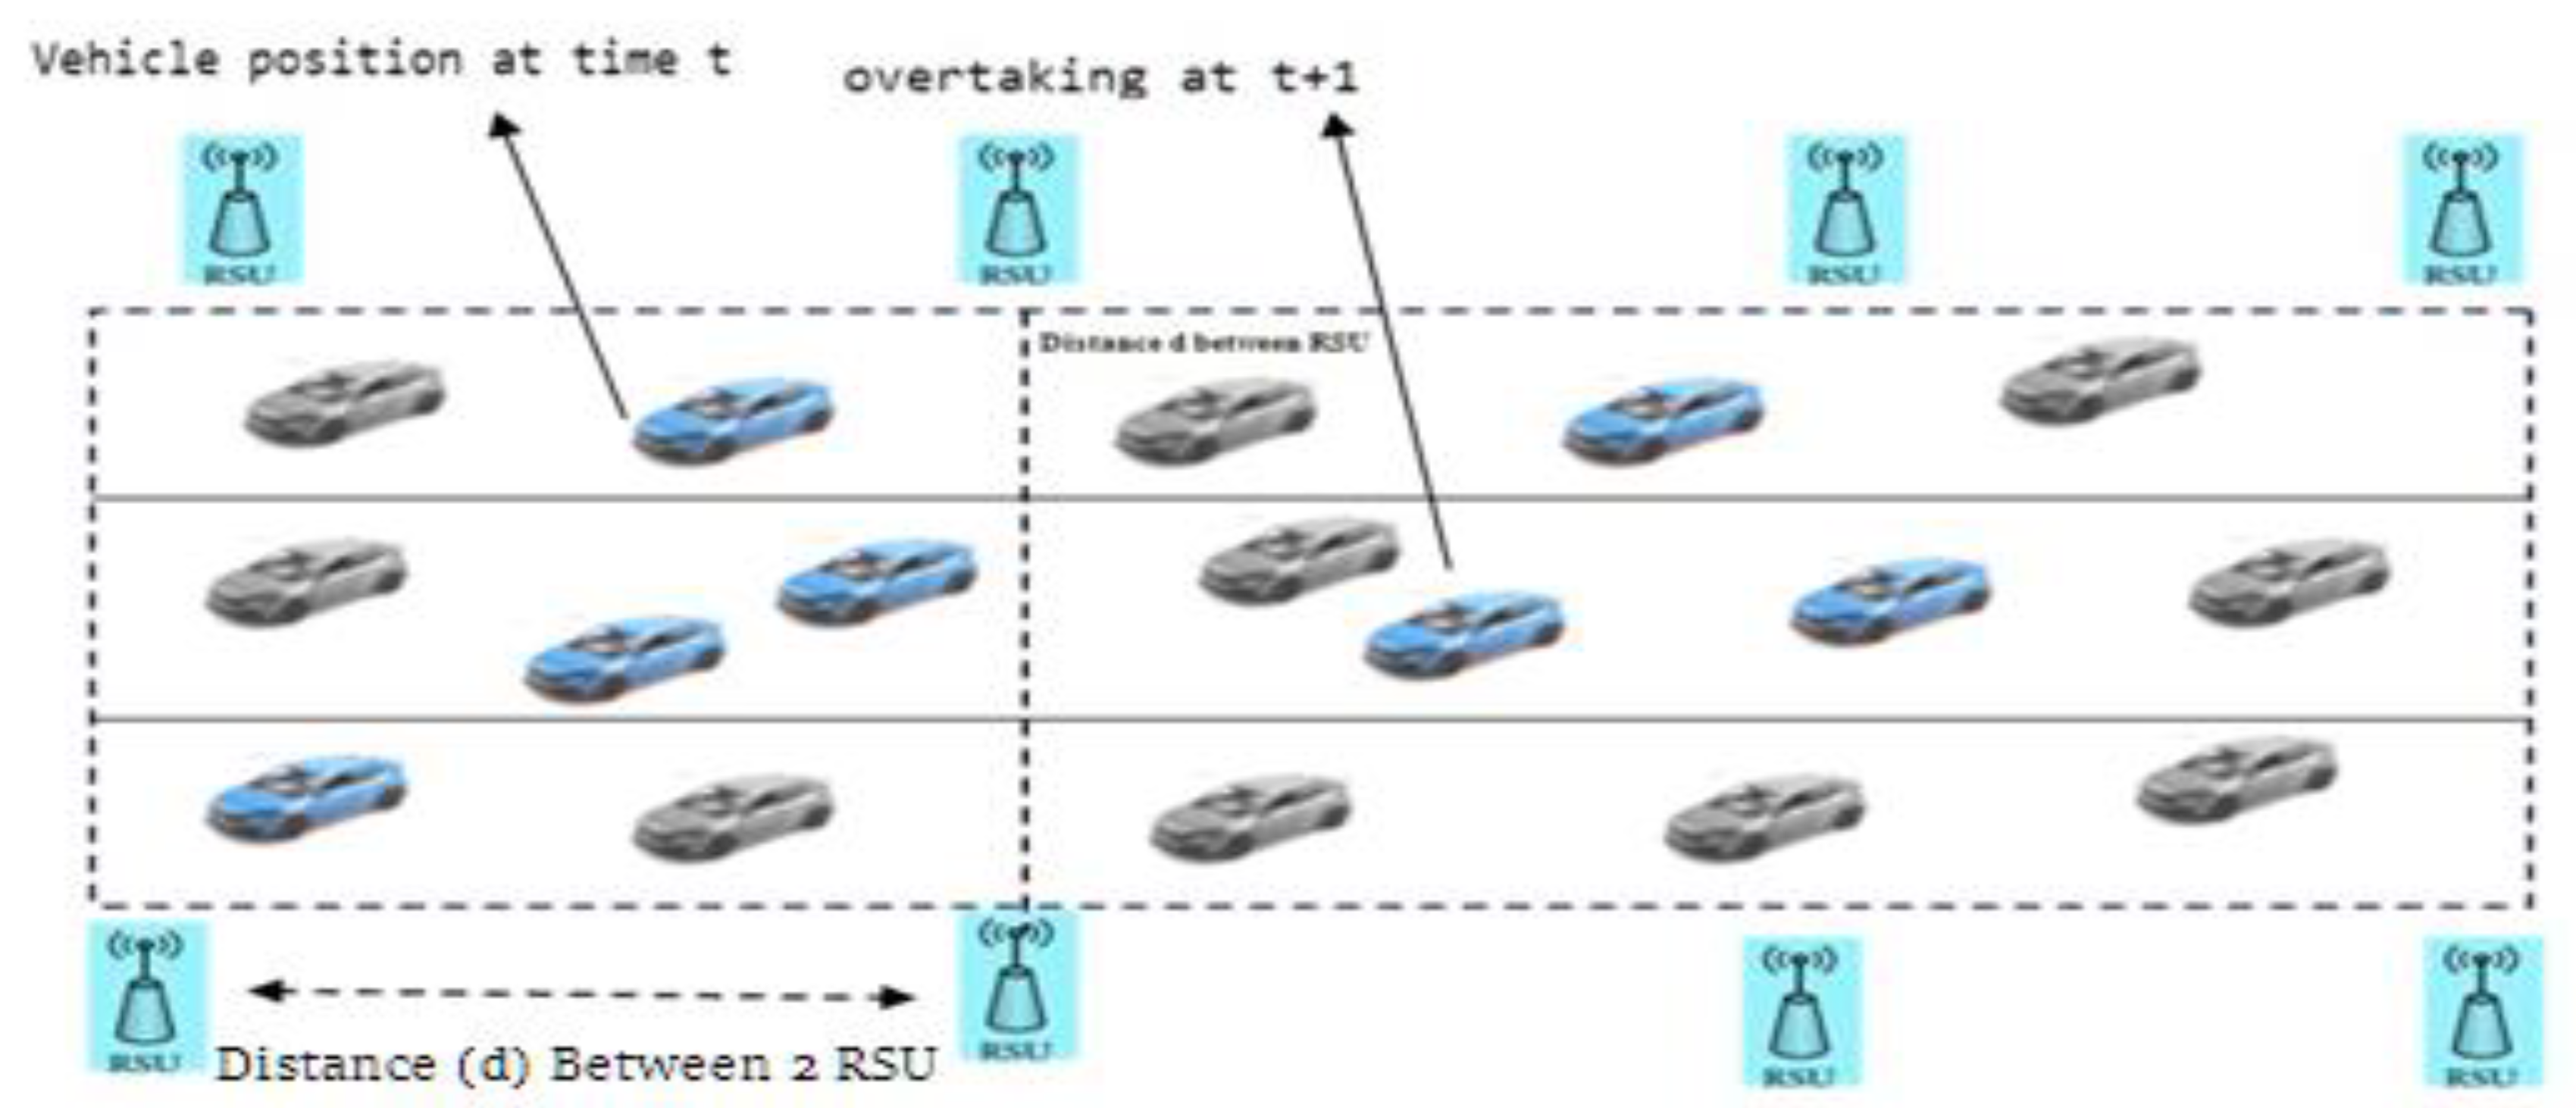
3.3.4. Vehicle Communication with VANET
| Algorithm 2: Vehicle communication process in proposed ATM |
| Step-1 installed the RSU unit set the roadside at a specific distance |
| Step-2 Vehicle connection setup with RSU |
| 2.1 Neighboring vehicle receives a setup connection request from RSU |
| 2.2 Vehicle sends the required data, i.e., location, velocity, start time to RSU |
| Step-3 Data storage: RSU stores all the received data in a data-based |
| Step-4 RSU Interval: if RSU received more than one request from multiple vehicles, then apply the wait and synchronization method for data storage per the time interval. |
| Step-5 call (Image processing in ITM) method is described in the previous section. |
| Step-6 Vehicle synchronization: if Synchronization values are high (because of higher speed vehicle), send the alert data (priority) |
| Step-7 Eliminate vehicle: remove the low-velocity vehicle and set the lower priority |
| Step-8 RSU communication: RSUs communicate with each other and share alert messages to handle congestion |
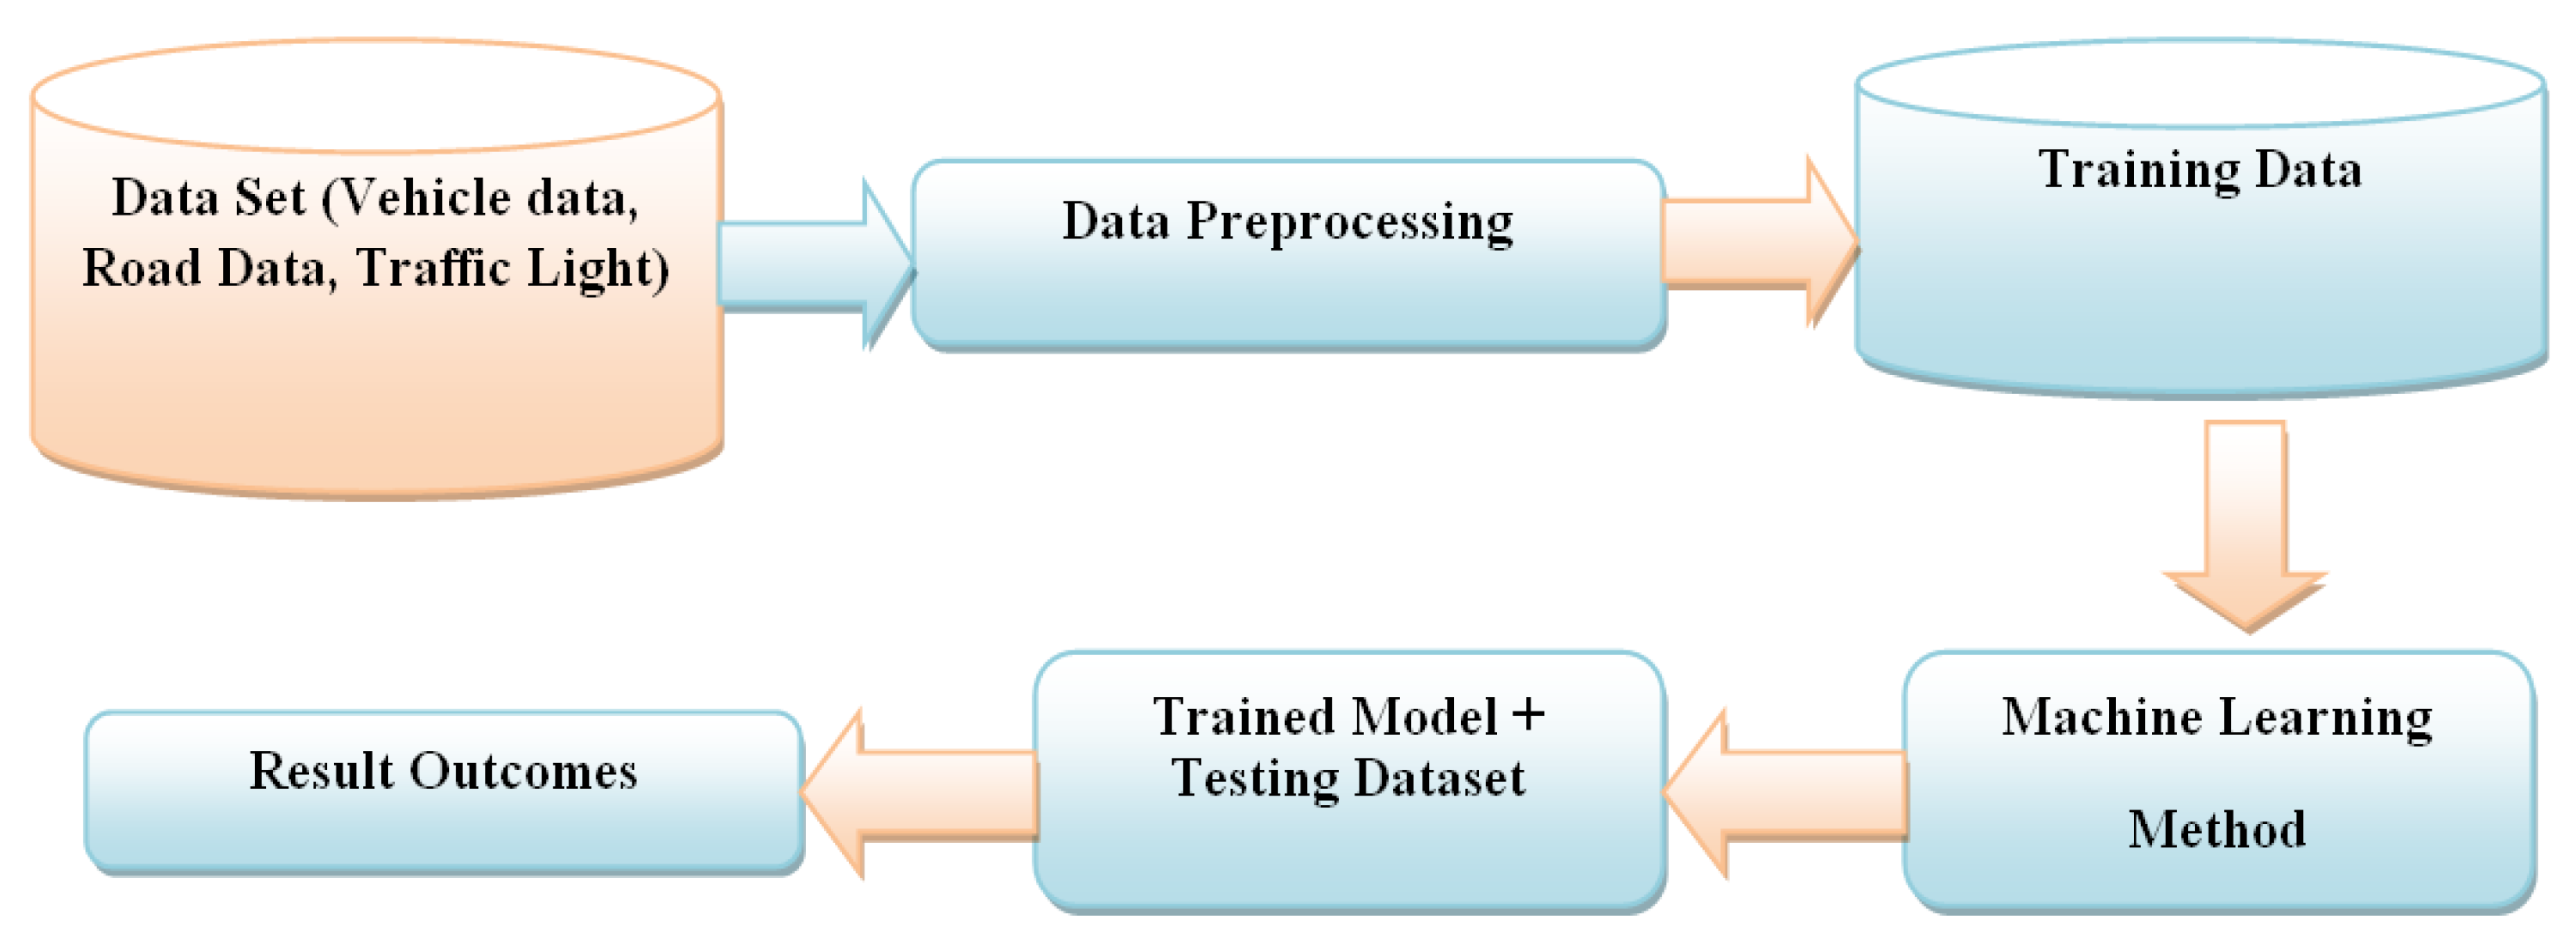
3.3.5. Machine Learning in ITM
| Algorithm 3: DBSCAN (Da, minimum_points, epsilon) |
| // Detection of a vehicle collision on the road |
| Input: dataset accidents Da; clusters Ck; and cluster mean Mc |
| Output: accidental cluster groups recognize Cki |
| Step-1 initialize the cluster Ck = 0 |
| Step-2 Mark all the unvisited entries U.D. as visited VD in the dataset |
| Step-3 Calculate the s_p, |
| Where s_p is sphere_points, m_p is min_points, and r_Q is region_Quer. |
| s_p = r_Q(VD, epsilon) |
| Step-4 if size of (s_p) m_p) not consider the value of V.D. |
| Else |
| Step-5 Calculate the next cluster by |
| Ck = Cnew, where Cnew is the next cluster value |
| Step-6 Call the expand clustering function E_C ( ) |
| 6.1 E_C(VD, s_p, Ck, epsilon, m_p); |
| 6.2 E_C(VD, s_p, Cnewi, epsilon, m_p); |
| Step-7 Add all the new visited V.D. to cluster set Ck |
| Step-8 Verify for all the points V.D. in s_p |
| Step-9 For instance, if V.D. is marked as unvisited |
| Step-10 Update the V.D. and set it as status visited |
| Step-11 Calculate s_p=r_Q (VD, epsilon) |
| Step-12 Verify the size by if size of(s_p) = m_p |
| Step-13 s_p = New s_p U existing s_p |
| Step-14 for any of the instances if V.D. is not in any of the cluster set |
| Step-15 update the V.D. status and add V.D. to the Ck cluster |
| 15.1 Calculate the region are and execute the r_Q() |
| 15.2 R_Q(V.D., epsilon); |
| 15.3 Return all the new points inside the n-dimensional V.D. towards the radius epsilon. |
3.4. Mathematical Model of the Proposed ATM System
Mathematical Model Formulation for Proposed ATM
| M ST0 ST0 | M ST0 ST1 | … | M ST0 STn |
| M ST1 ST0 | M ST1 ST1 | … | M ST1 STn |
| … | … | … | … |
| M STn ST0 | M STn ST1 | … | M STn STn |
4. Discussion
- (a)
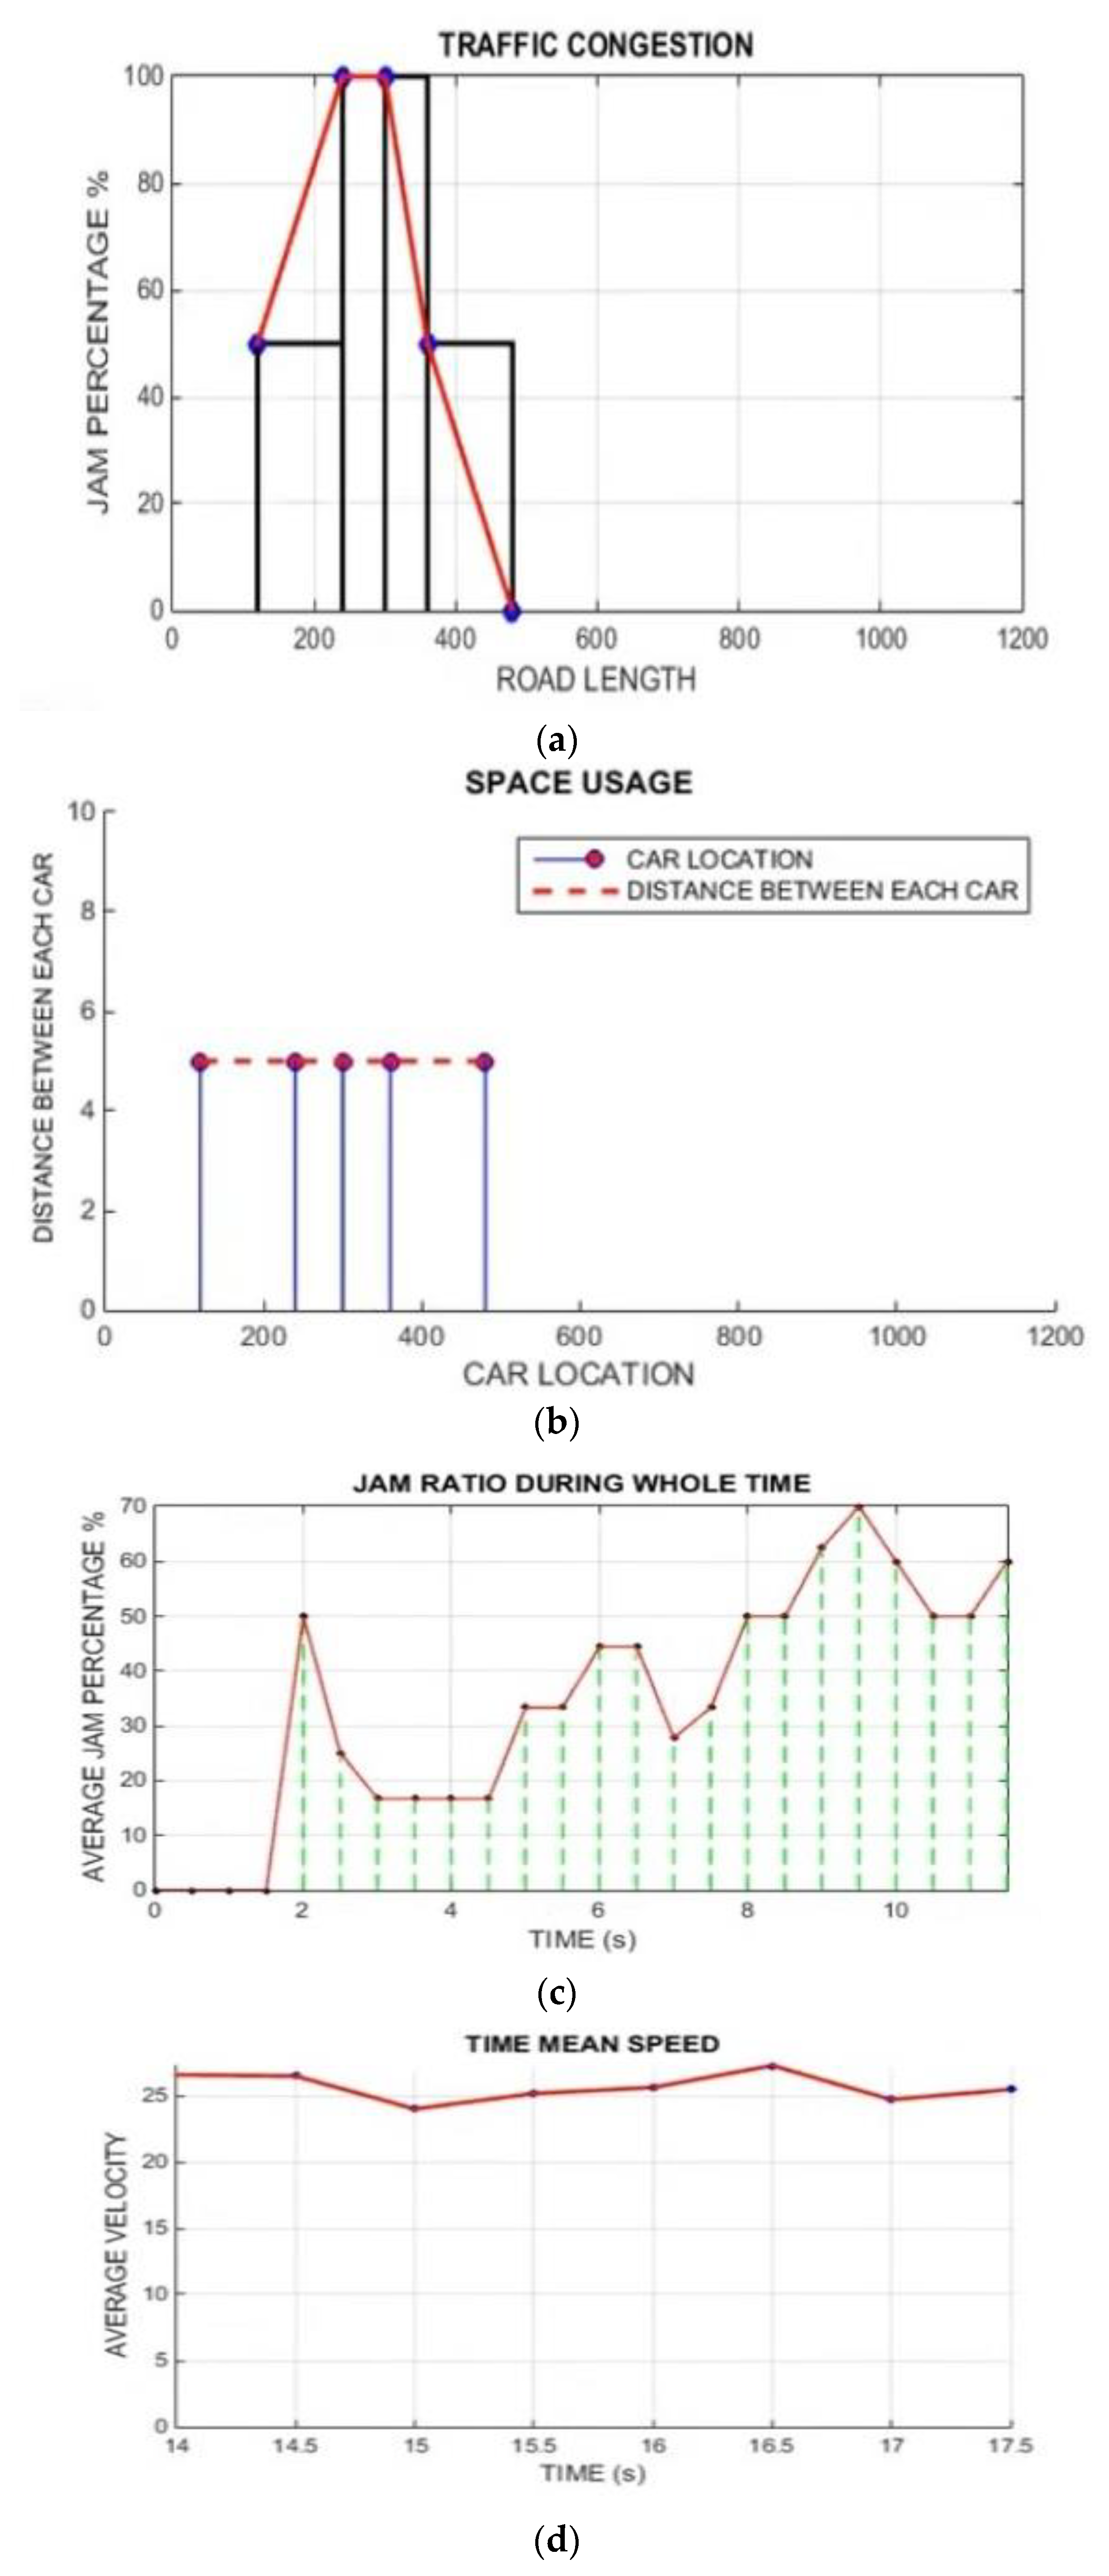
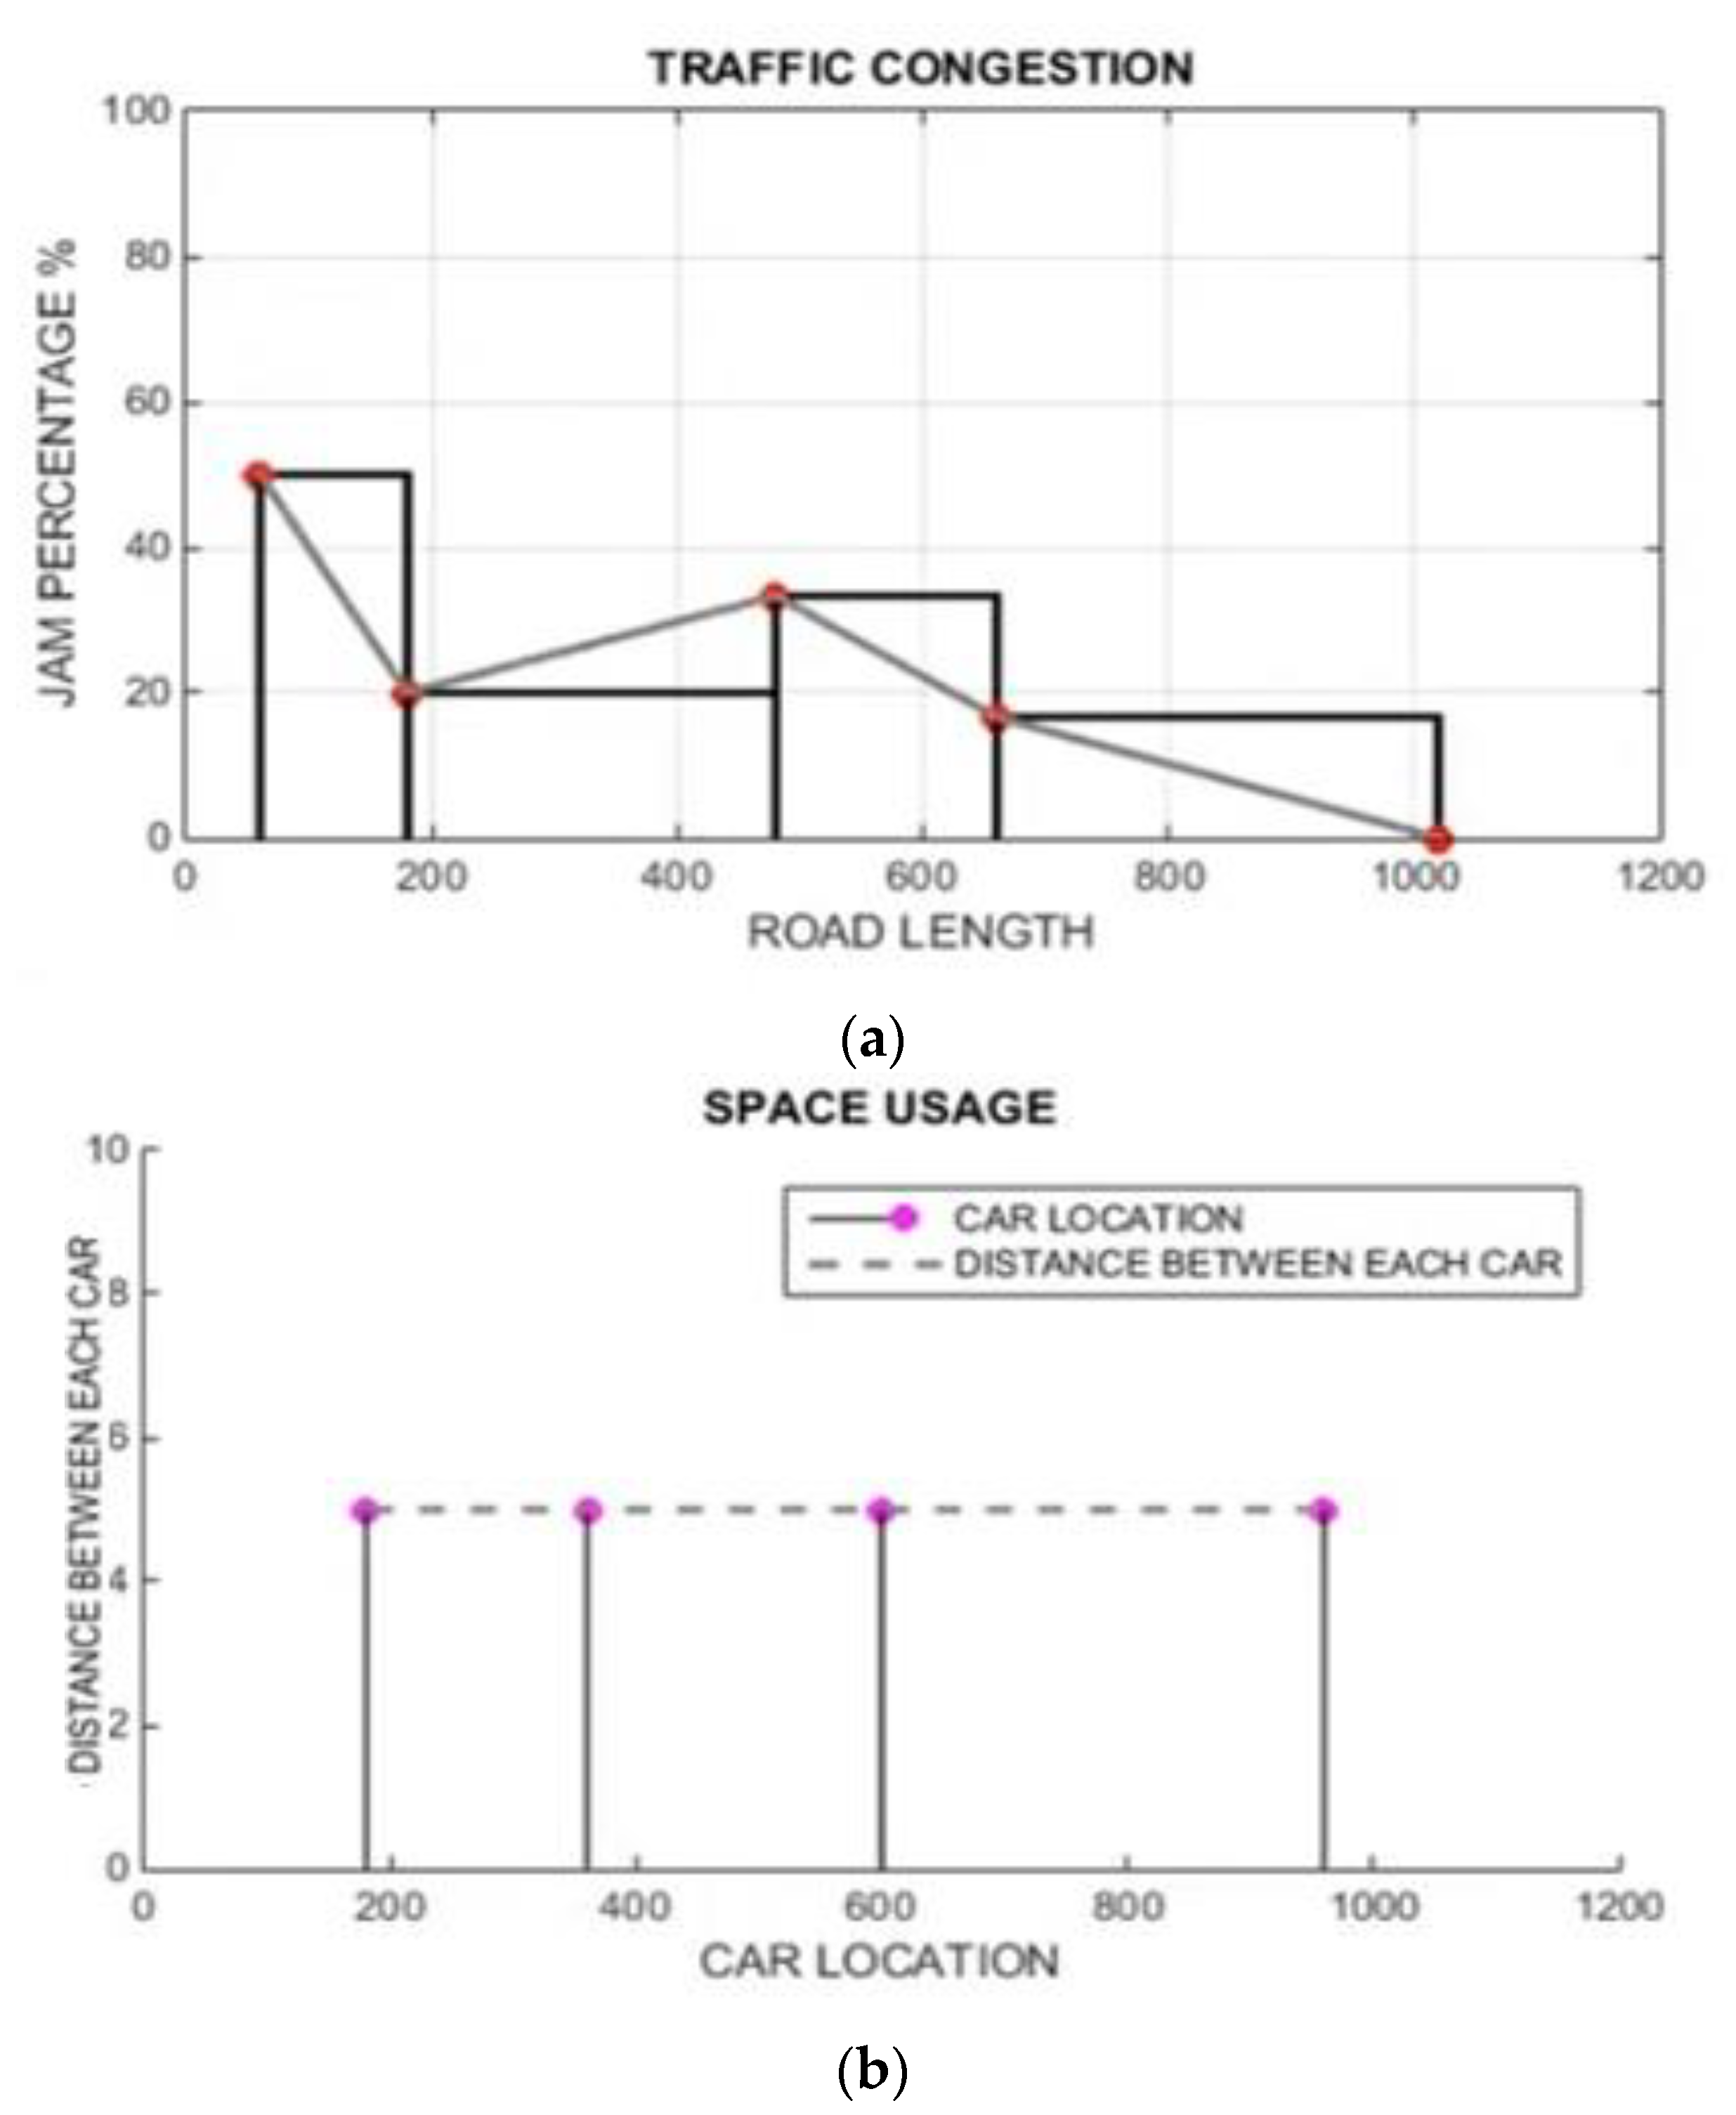
- Only with LAVs—This is the first scenario considering only LAVs. In this scenario, the intelligent traffic-management systems mainly divide the traffic into two segments. The first is the control segment (CS), and another is the merging segmentation (MS). The CS has a control entity named control unit (CU), which helps it to communicate with LAVs [62].
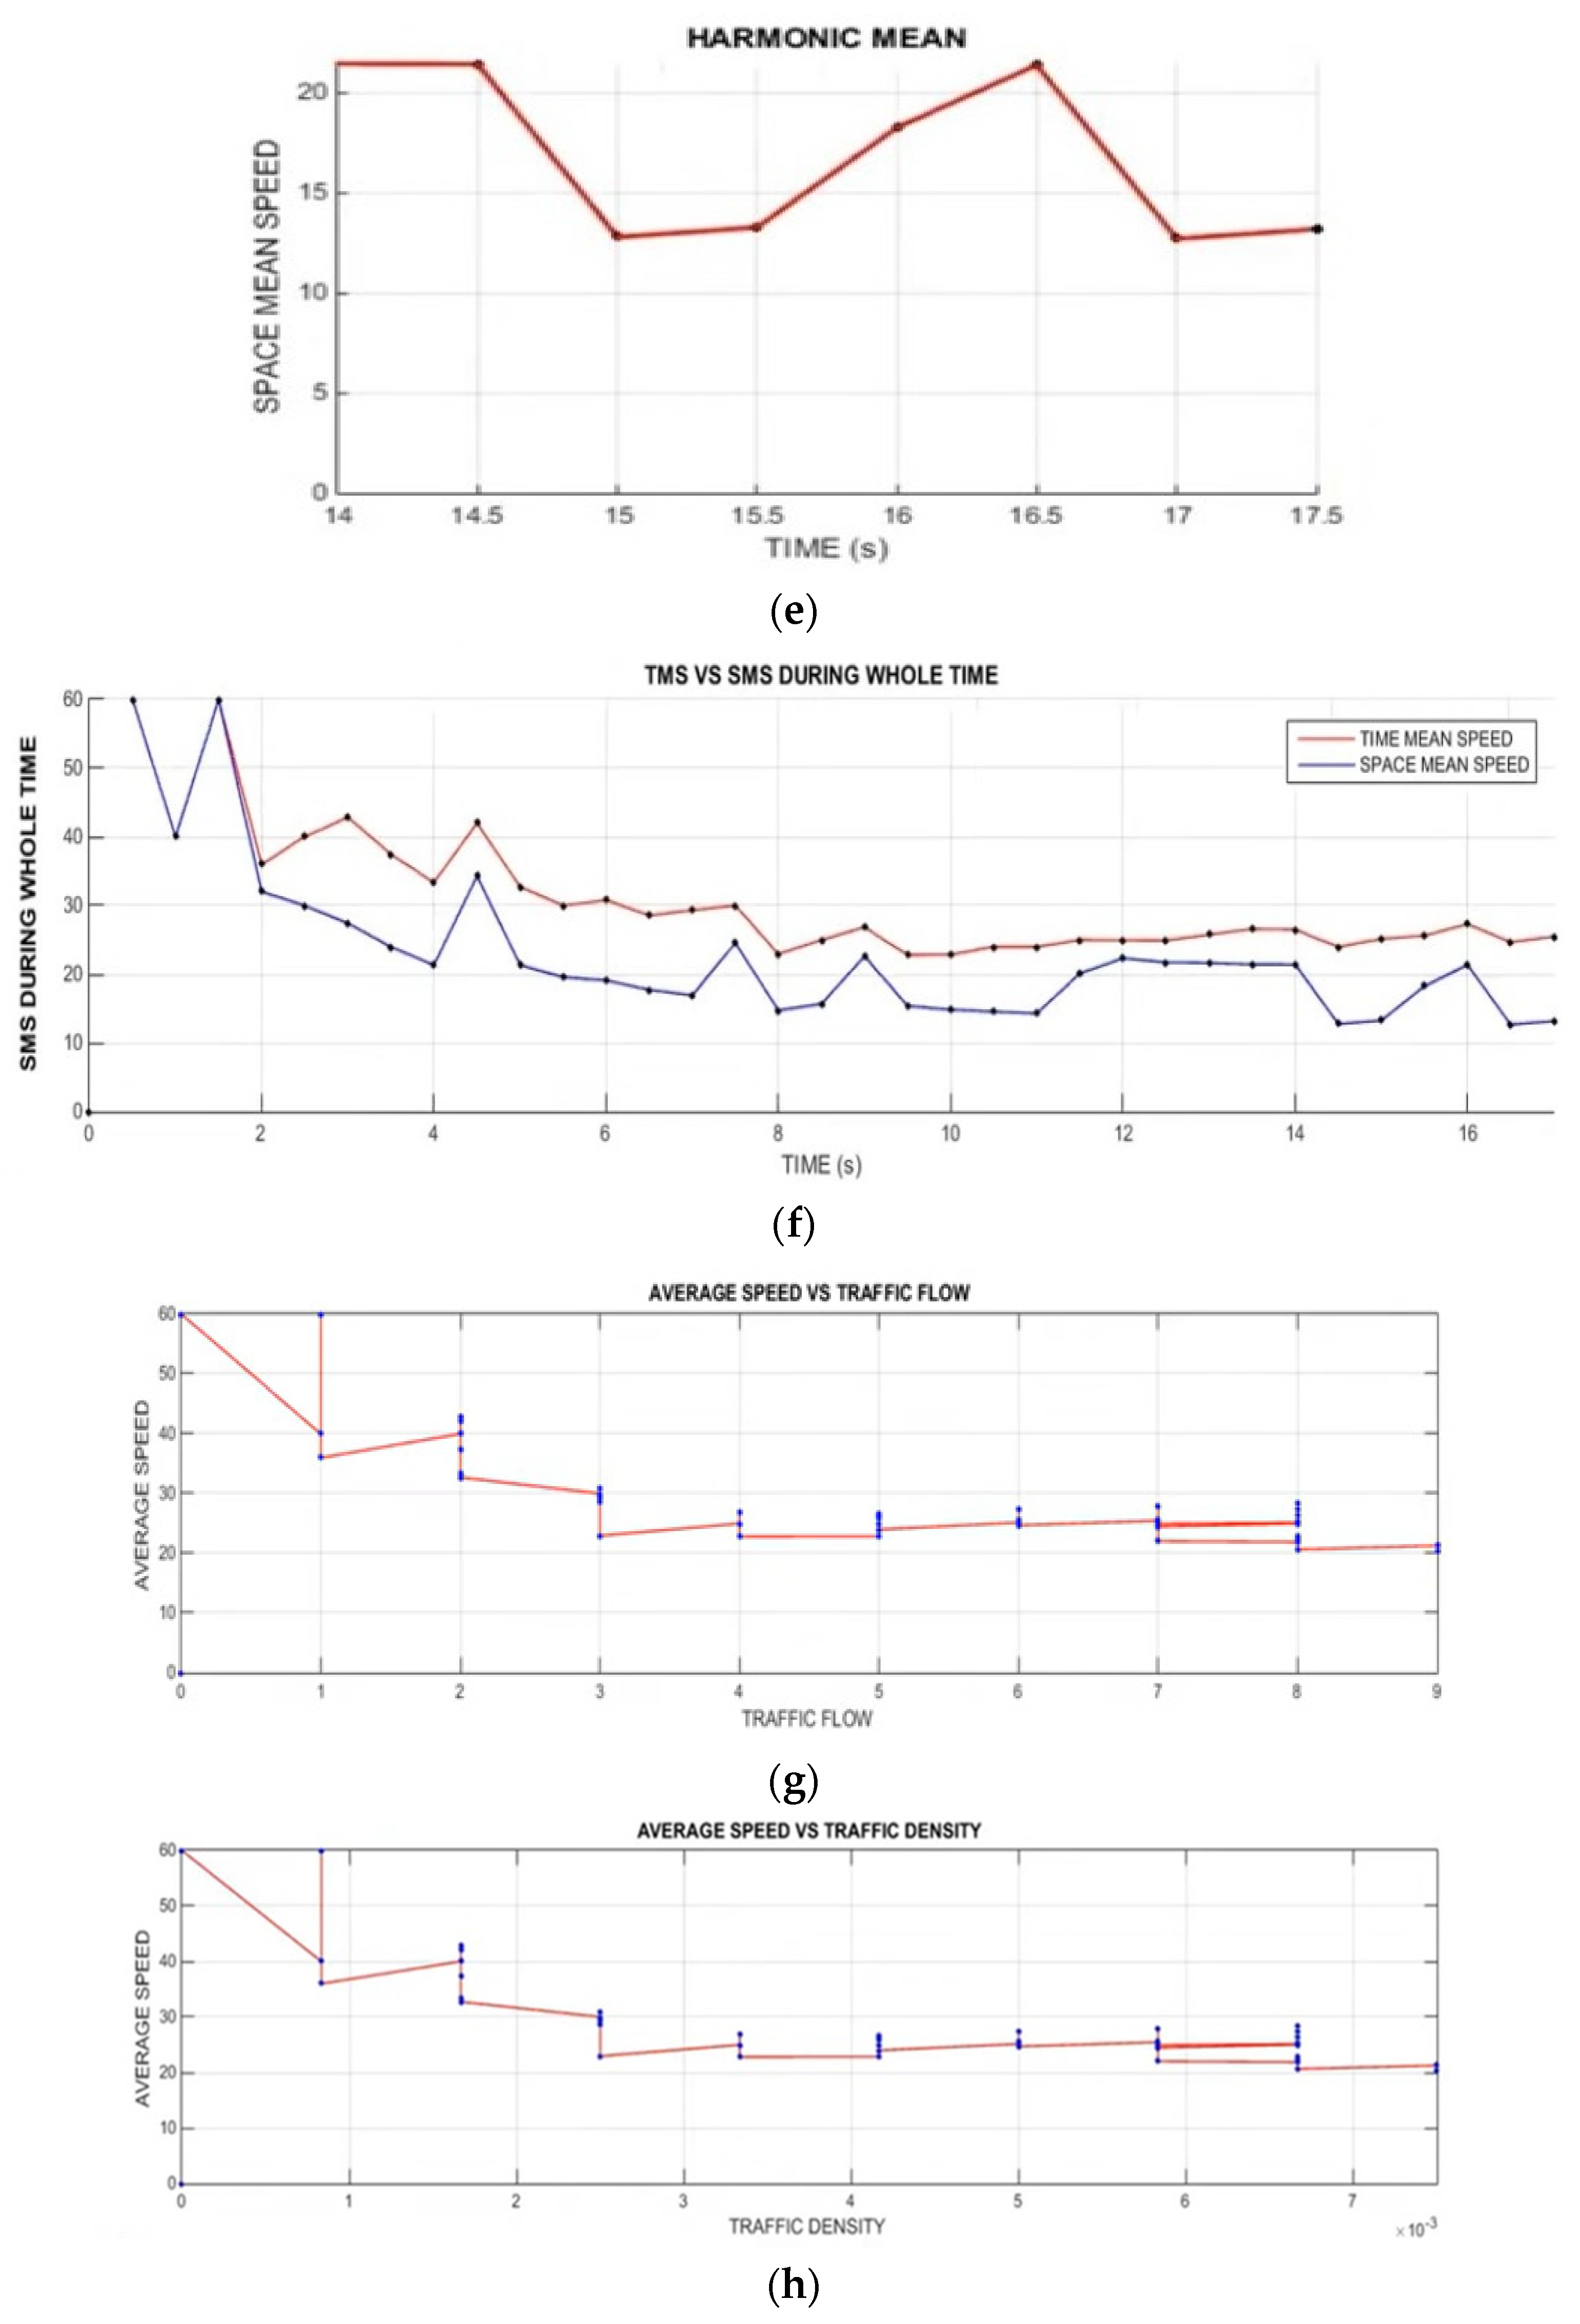
- (b)
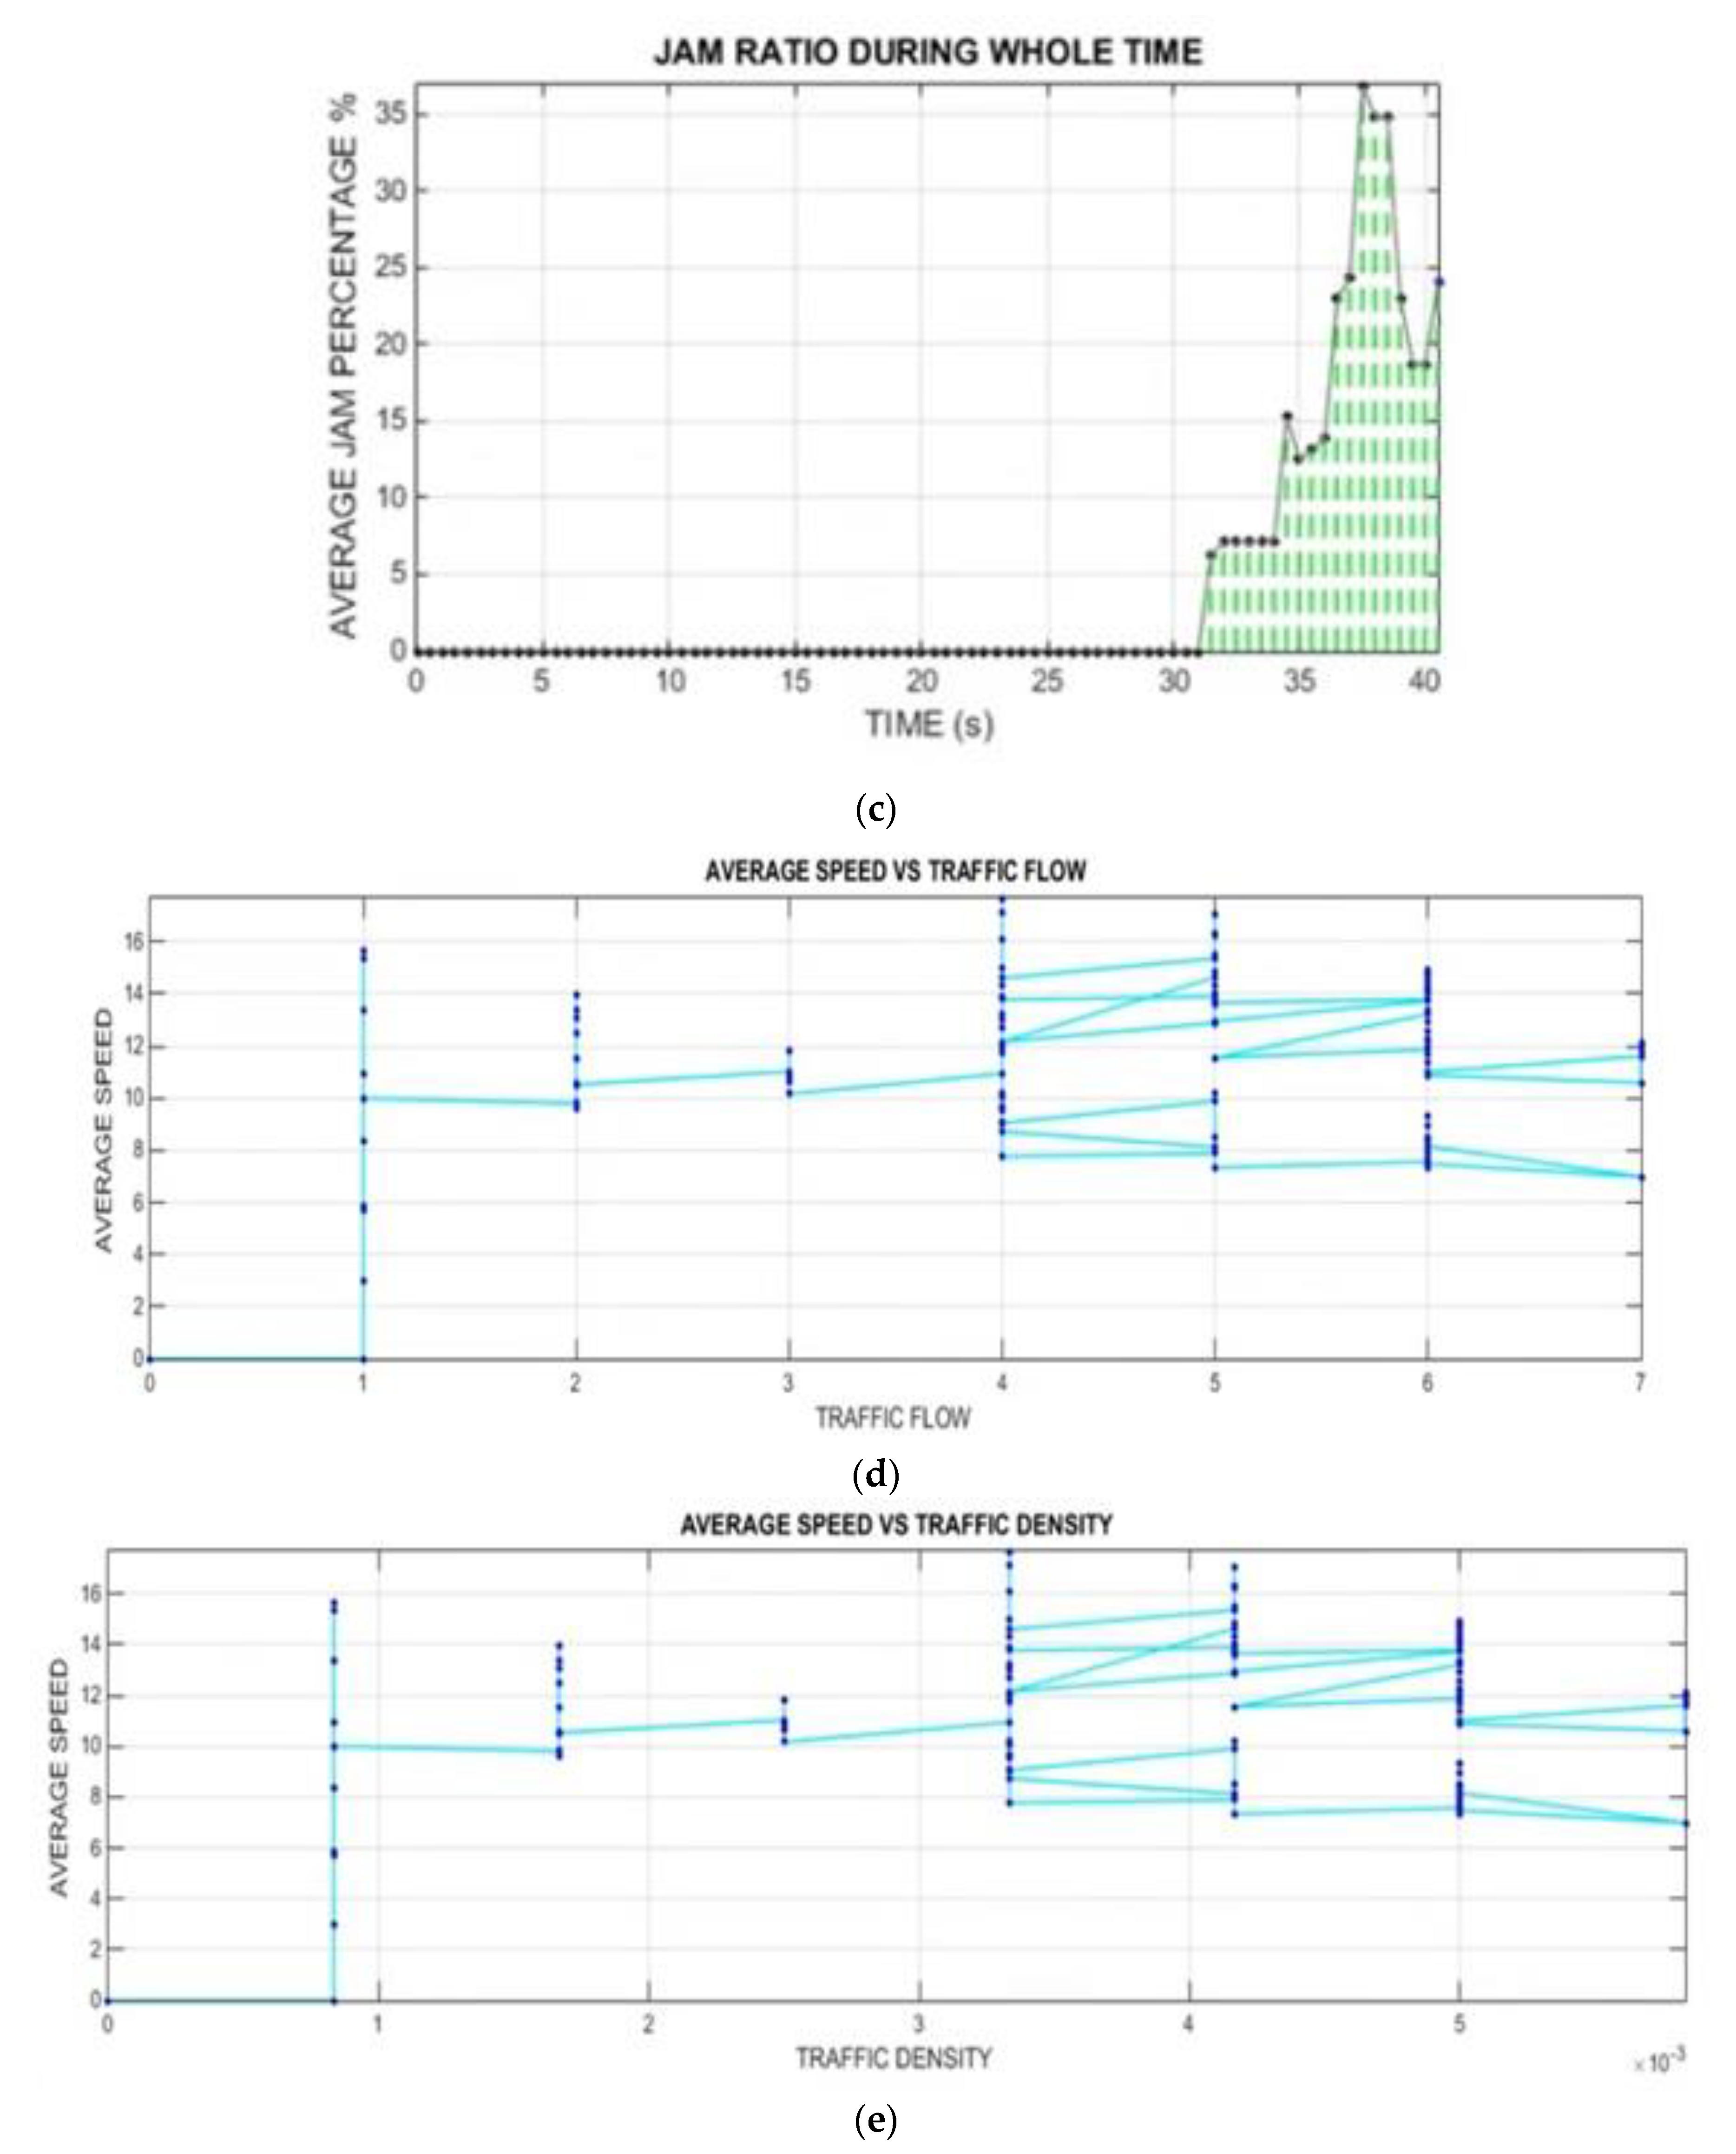
- Where Only with Non-LAVs—Assessments are necessary to verify the effectiveness of proposed ATM methods. As a result, a traffic virtual environment system must be easily adaptable to various traffic situations, allowing users to compare diverse perspectives. A baseline sequence of events is developed and evaluated on the vehicular modeling in which just the fixed-cycle traffic illumination monitors the Non-LAVs [63].
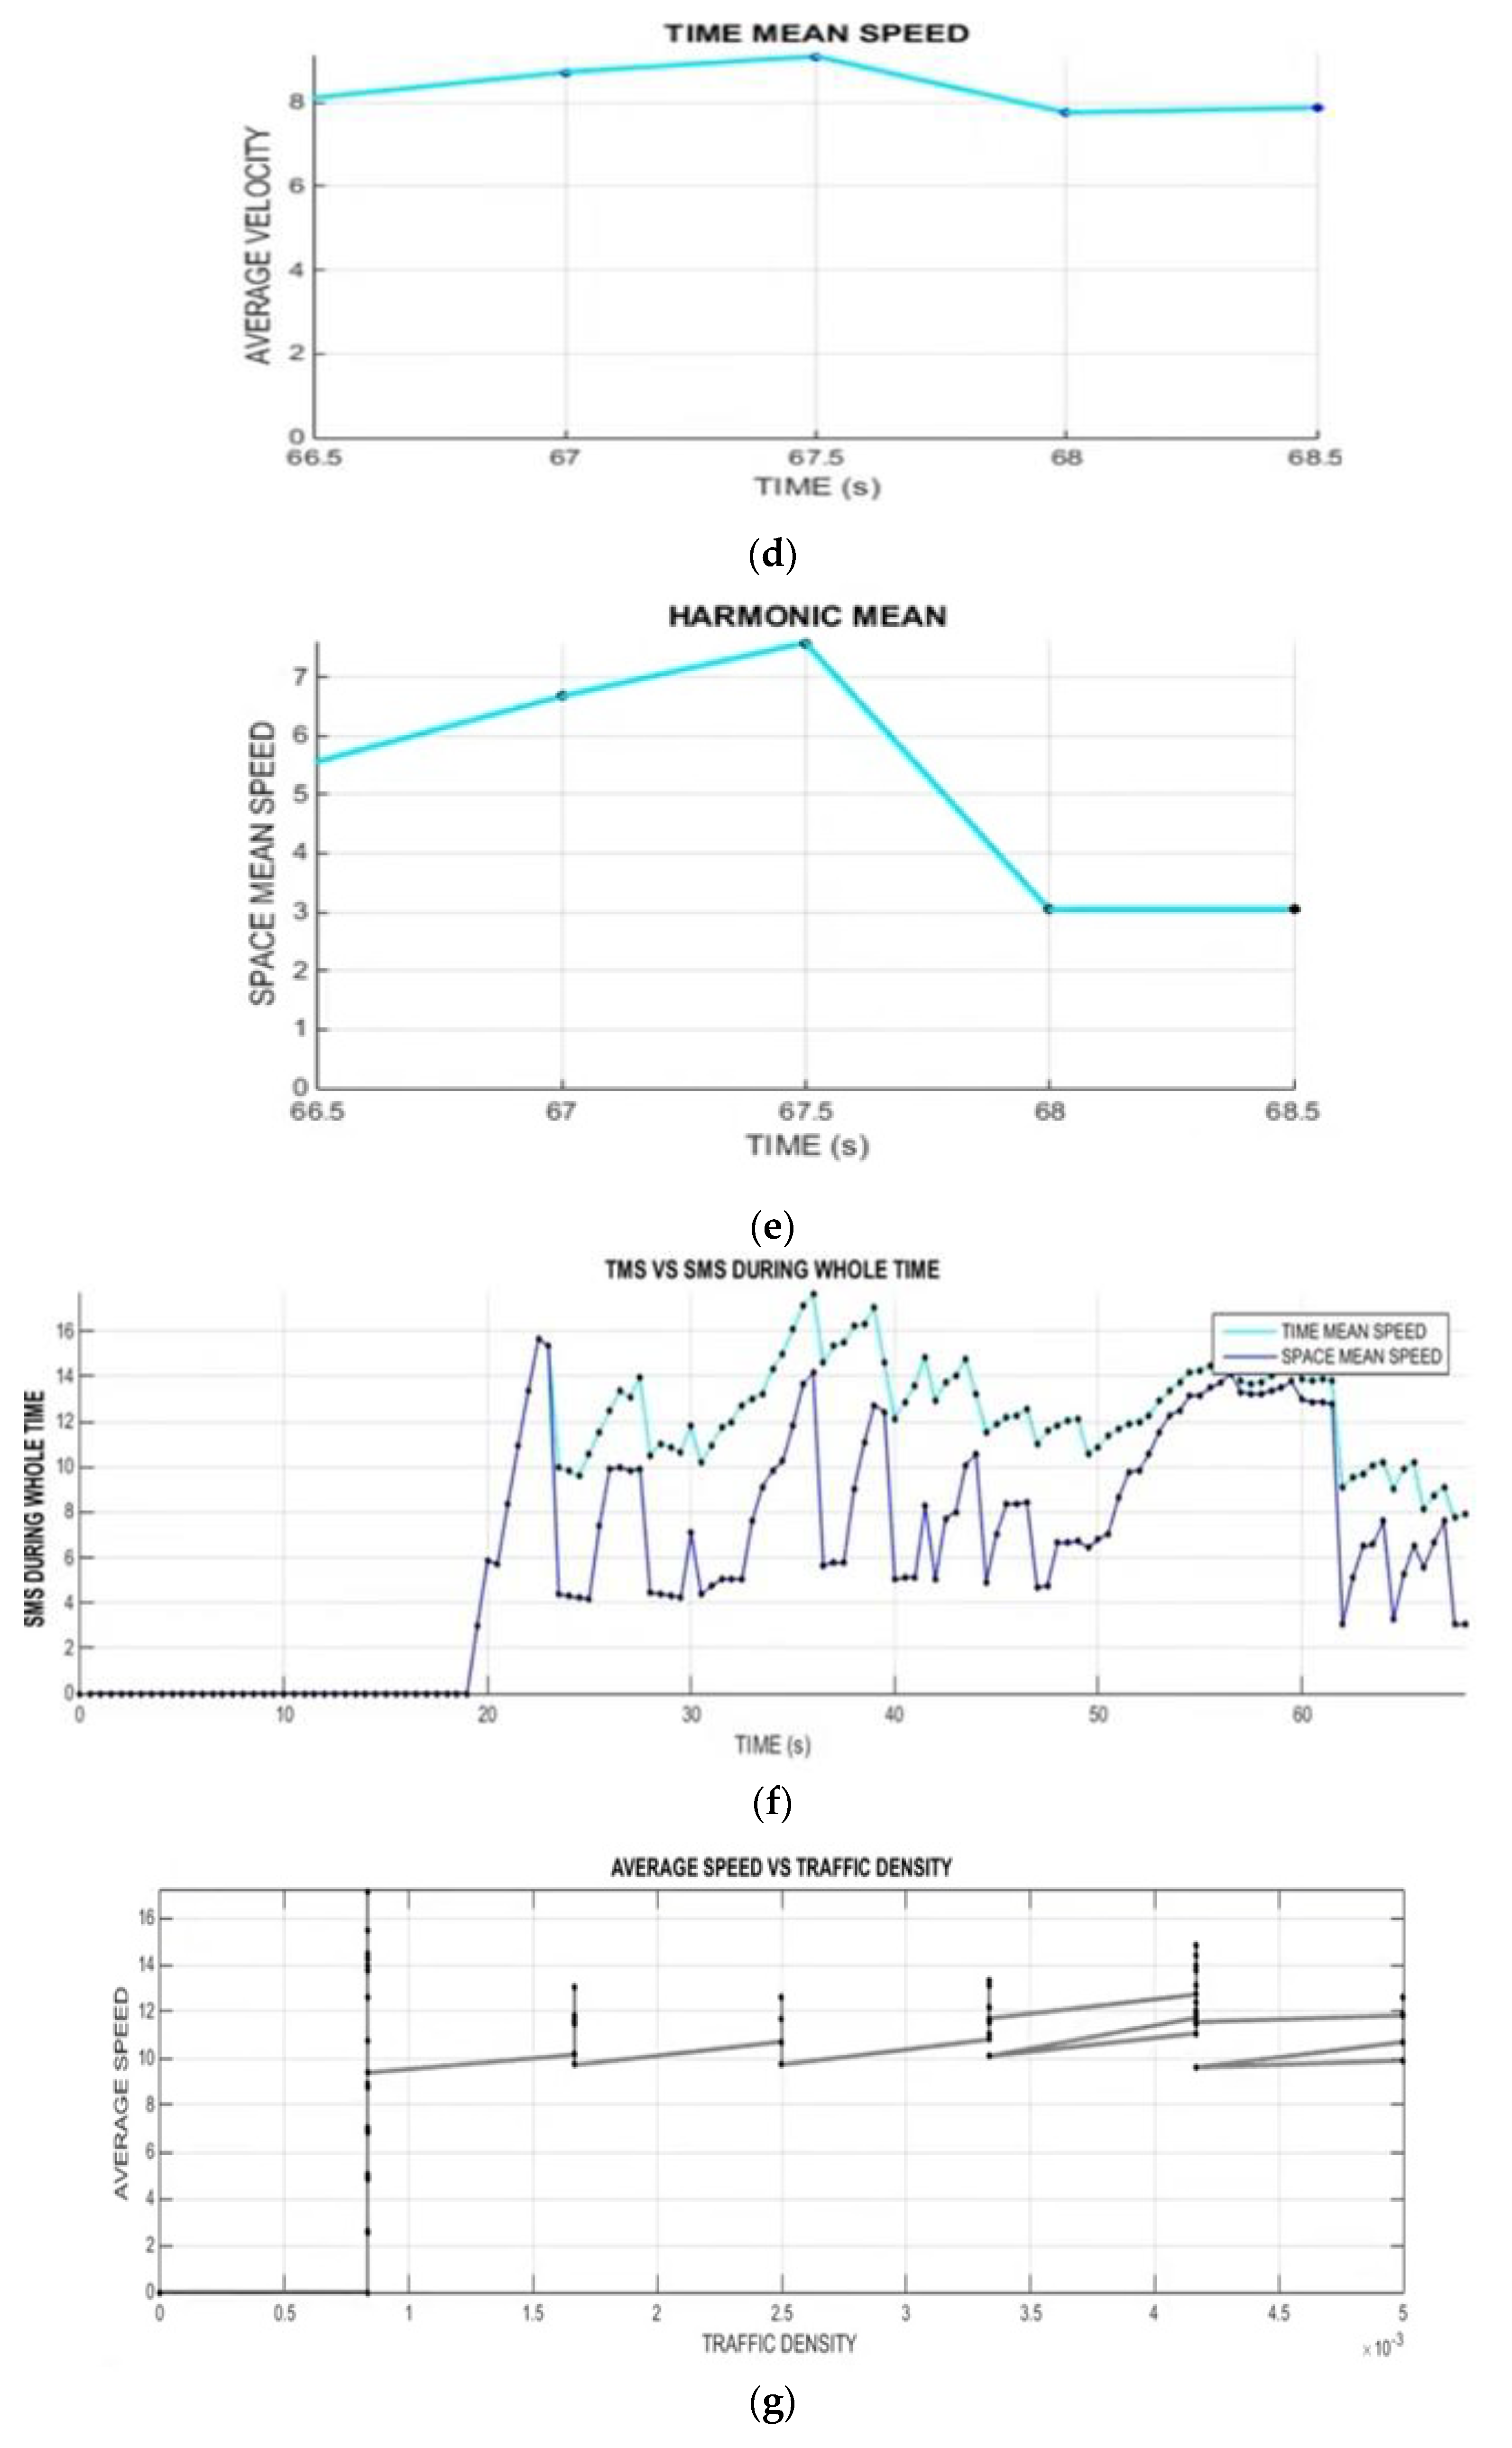
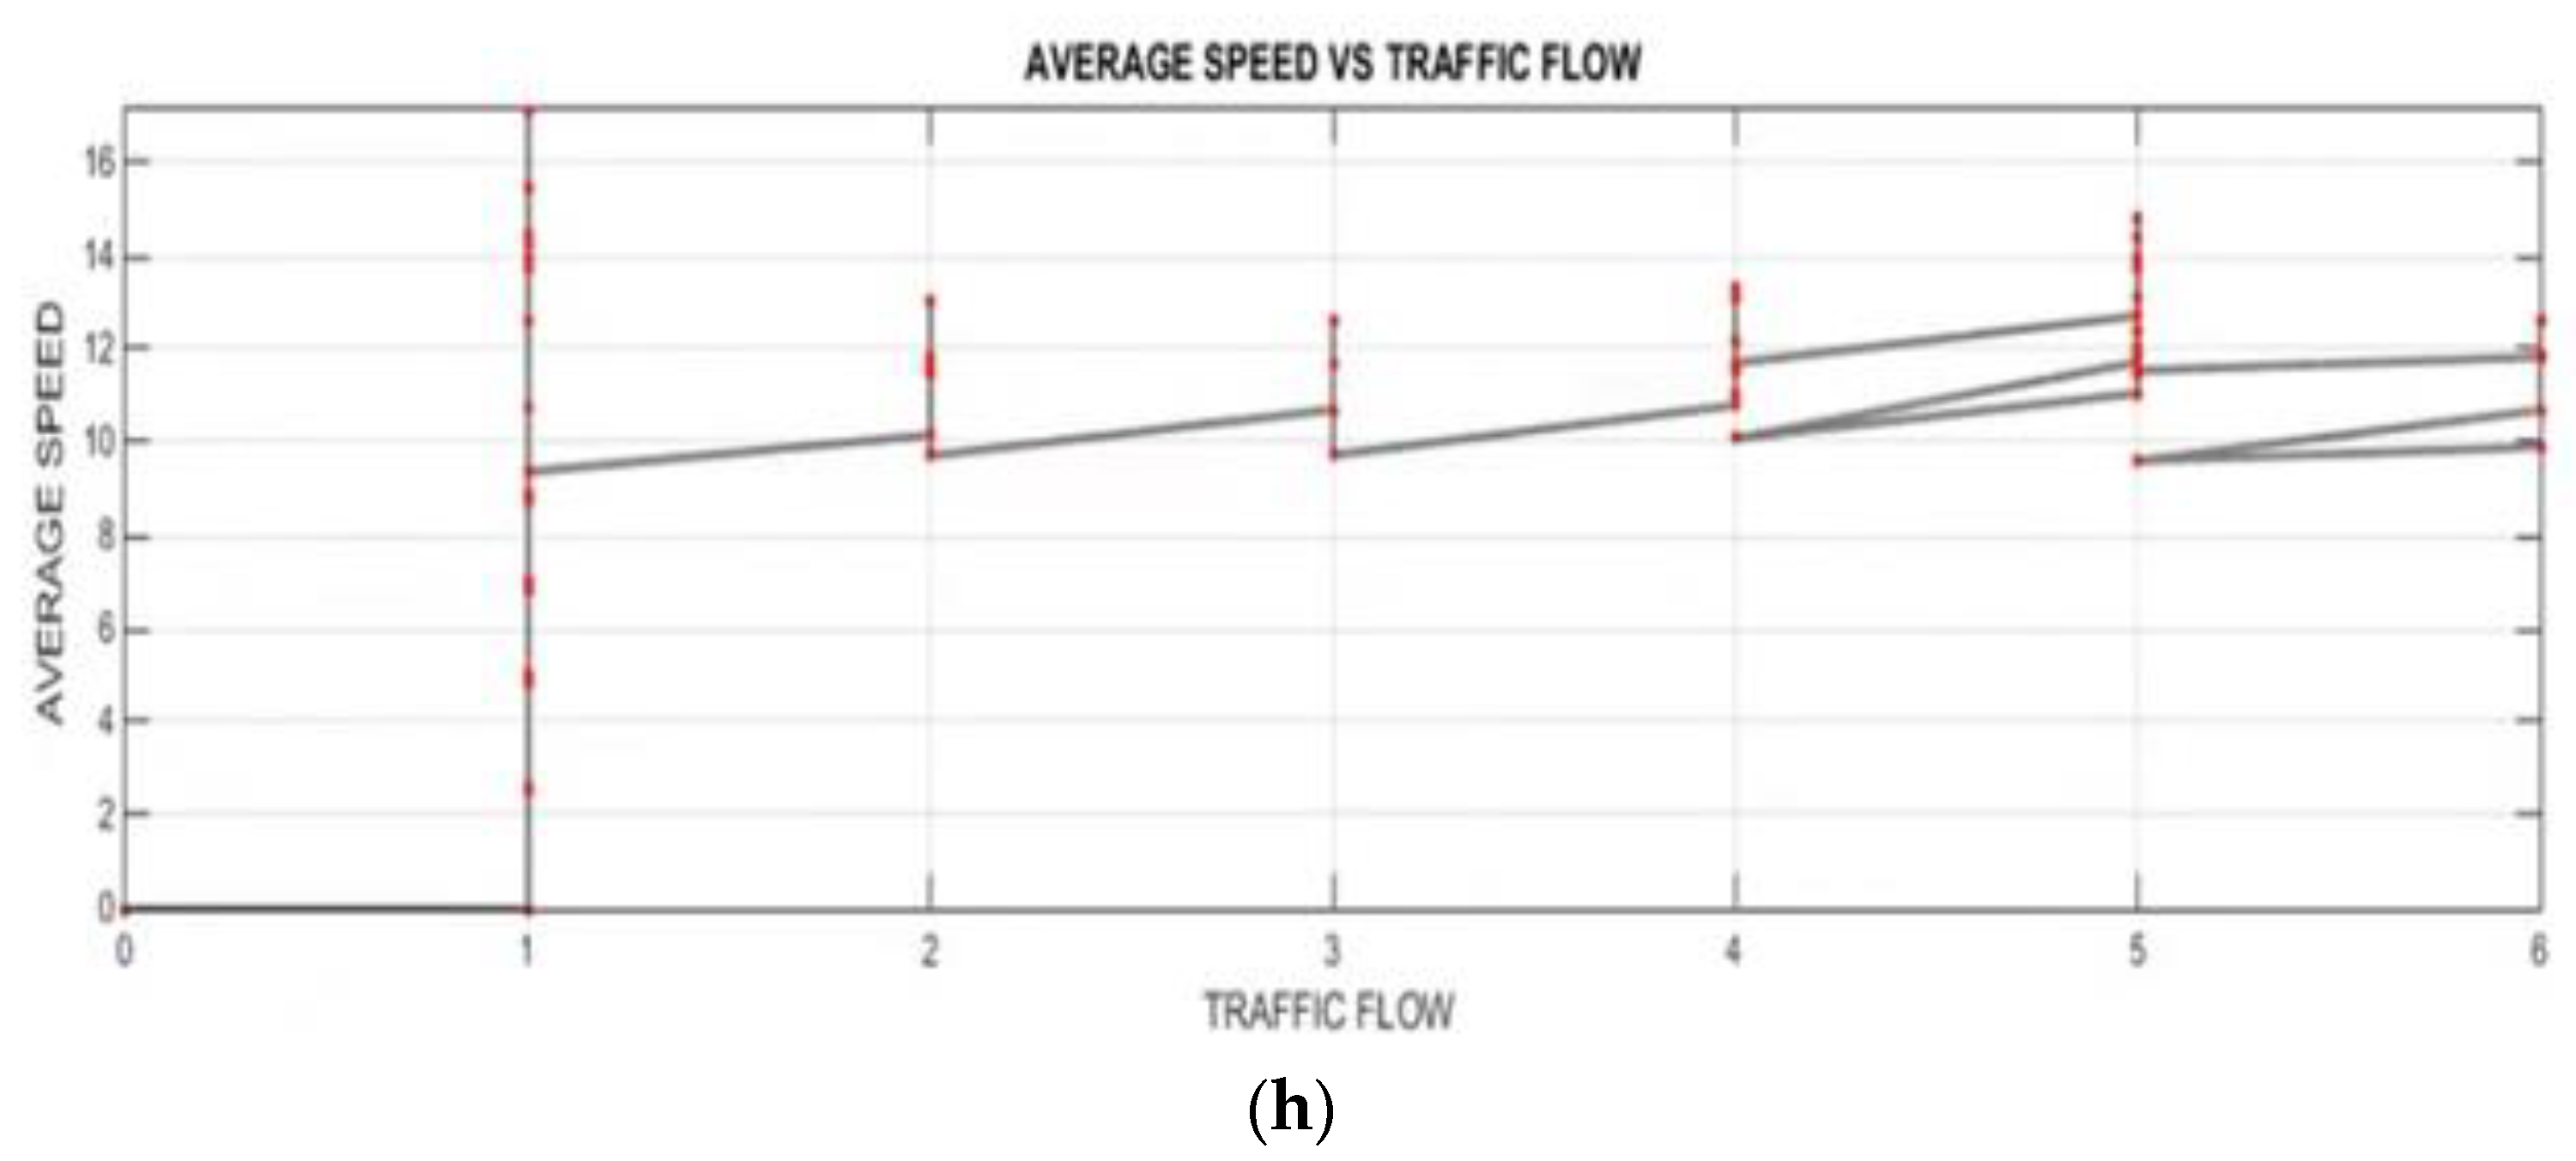
- (c)
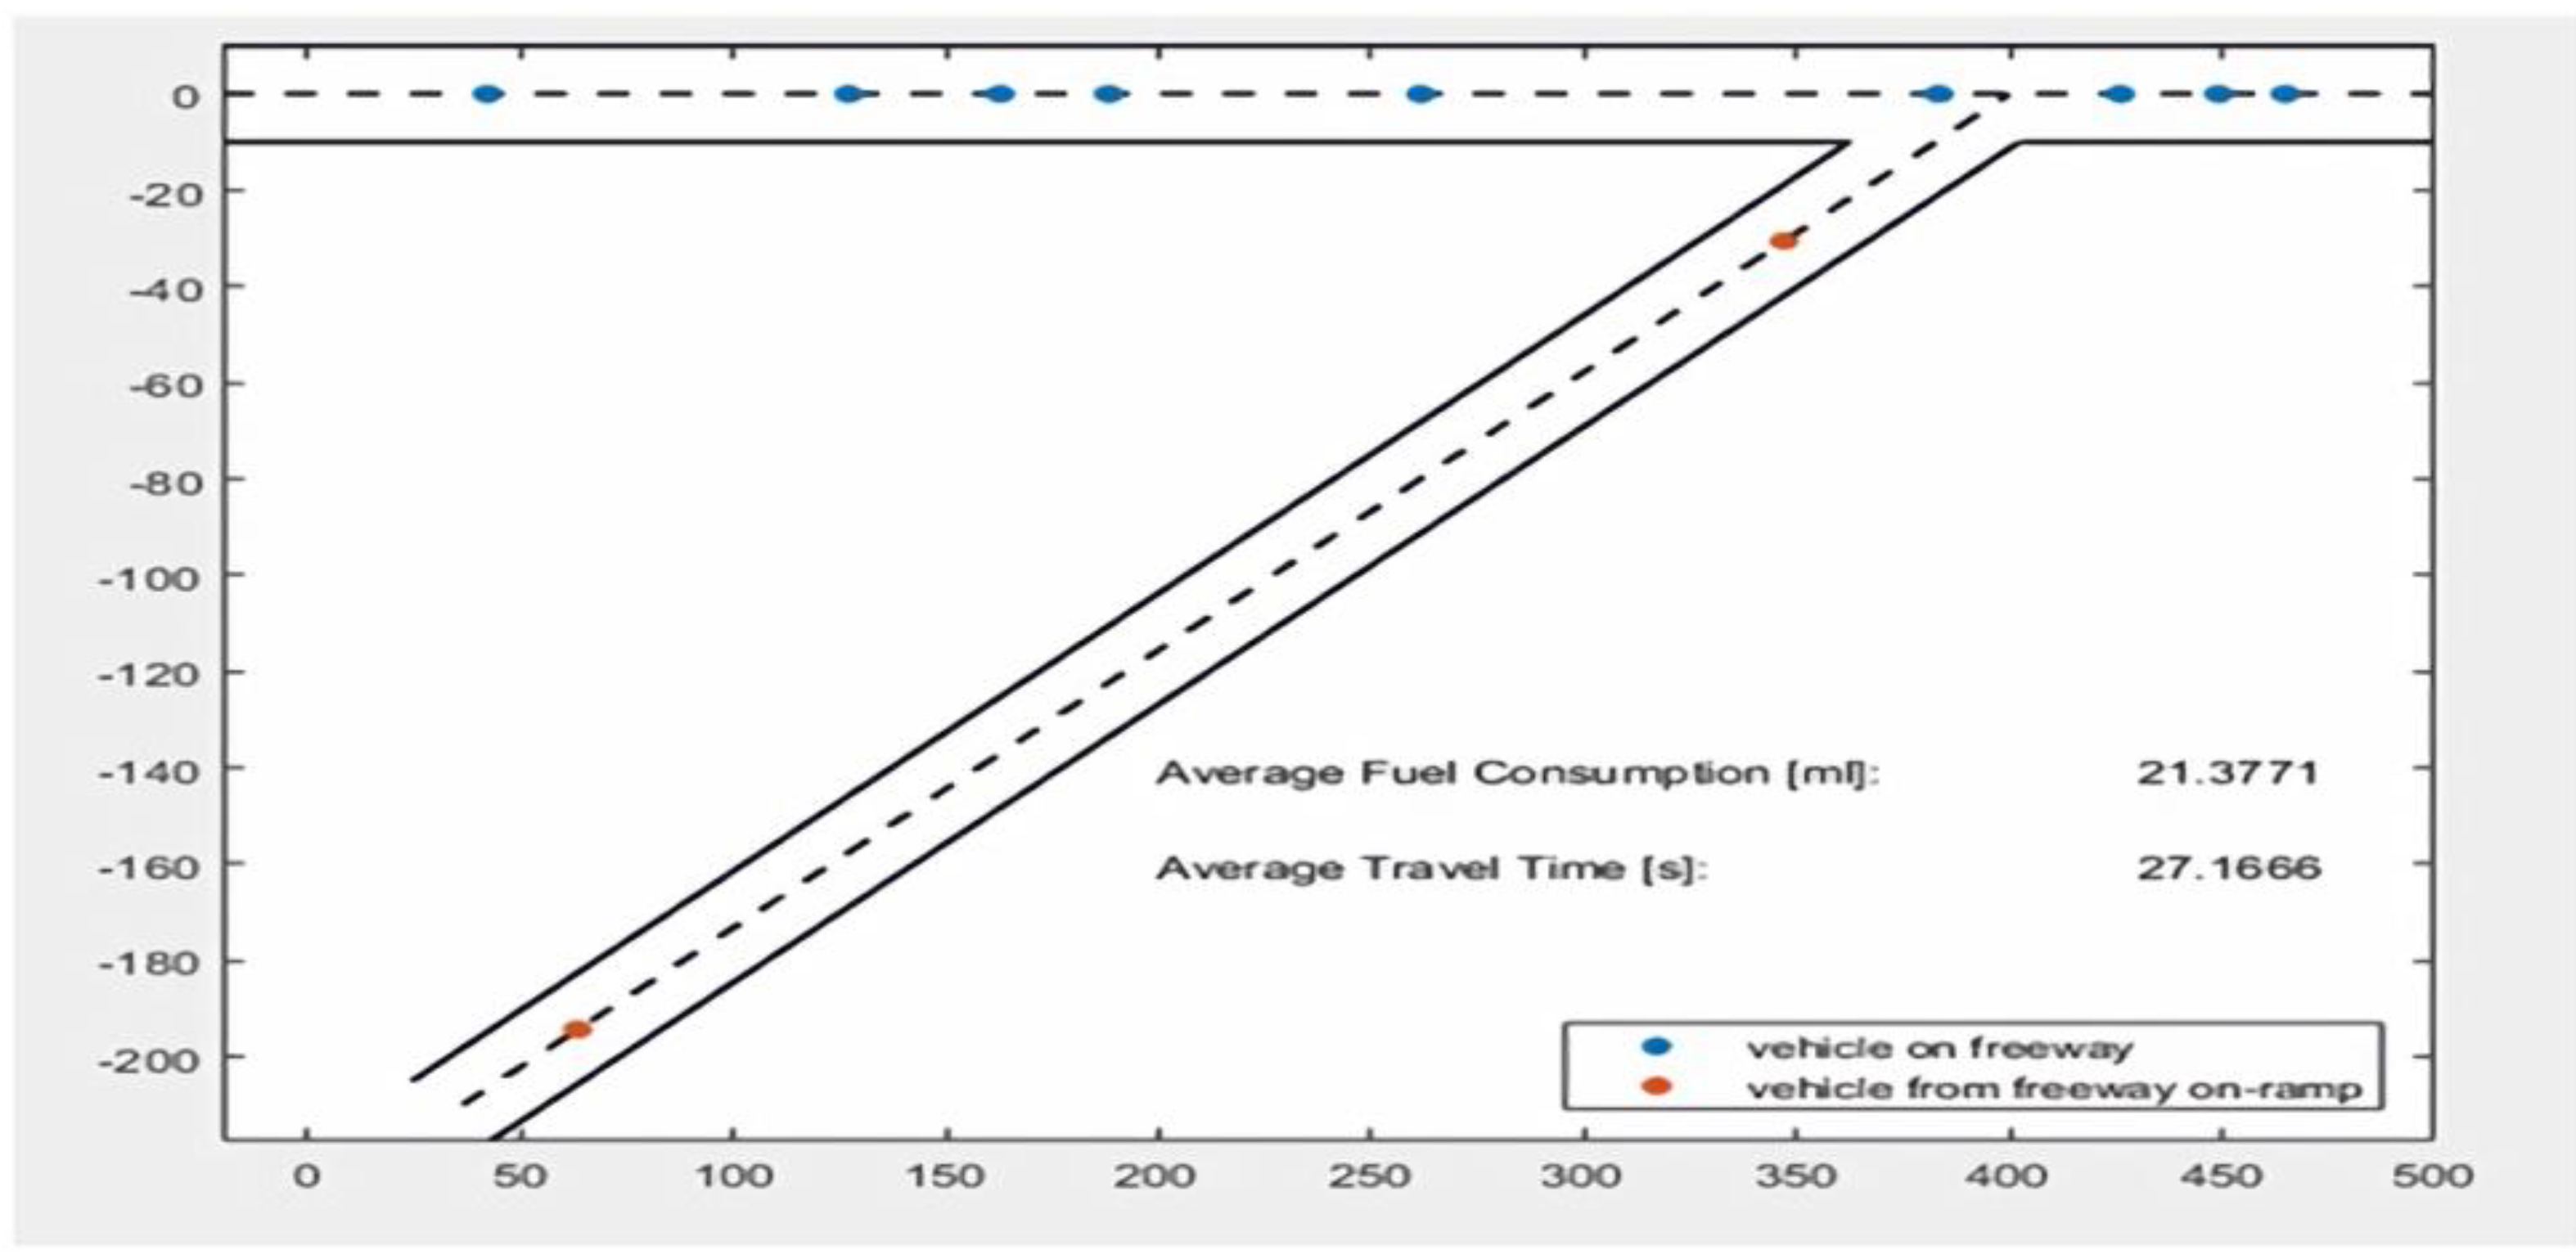
- Where LAVs and Non-Linked both types of vehicles are moving—The mixed-traffic case, in which both LAVs and Non-LAVs move on the roadways, should be viewed as a significant challenge for the massive implementation of automated vehicles. System model control techniques are tested on the proposed approach for this situation. Figure 5 shows the results for LAVs and Non-Linked automated vehicles [64].
Experimental Results and Discussions
5. Conclusions
Author Contributions
Funding
Institutional Review Board Statement
Informed Consent Statement
Data Availability Statement
Acknowledgments
Conflicts of Interest
References
- Hina, M.D.; Soukane, A.; Ramdane-Cherif, A. Computational Intelligence in Intelligent Transportation Systems: An Overview. In Innovative Trends in Computational Intelligence; Springer: Berlin/Heidelberg, Germany, 2021; pp. 27–43. [Google Scholar] [CrossRef]
- Jelínek, J.; Čejka, J.; Šedivý, J. Importance of the Static Infrastructure for Dissemination of Information within Intelligent Transportation Systems. Commun.–Sci. Lett. Univ. Zilina 2021, 24, E63–E73. [Google Scholar] [CrossRef]
- Parihar, M.; Dasari, N.; Bhagwat, K. Intelligent Infrastructure and Transportation: A Case of Passenger Transportation System in Jaipur City of Rajasthan. In Smart Systems: Innovations in Computing; Springer: Singapore, 2021; pp. 11–20. [Google Scholar] [CrossRef]
- Olayode, I.O.; Severino, A.; Campisi, T.; Tartibu, L.K. Prediction of Vehicular Traffic Flow using Levenberg-Marquardt Artificial Neural Network Model: Italy Road Transportation System. Commun.-Sci. Lett. Univ. Zilina 2021, 24, E74–E86. [Google Scholar] [CrossRef]
- Bhatia, V.; Jaglan, V.; Kumawat, S.; Siwach, V.; Sehrawat, H. Intellıgent Transportatıon System Applıcatıons: A Traffıc Management Perspectıve. In Intelligent Sustainable Systems; Springer: Singapore, 2022; pp. 419–433. [Google Scholar]
- Manasseh, C.; Sengupta, R. Middleware to enhance mobile communications for road safety and traffic mobility applications. IET Intell. Transp. Syst. 2010, 4, 24–36. [Google Scholar] [CrossRef]
- Choi, J.; Kum, K. Analysis of Mutual Understanding about Dangerous Driving Behaviors between Male and Female Drivers by Co-orientation Model. J. Korea Inst. Intell. Transp. Syst. 2018, 17, 32–45. [Google Scholar] [CrossRef]
- Zhang, Y.; Chu, L.; Fu, Z.; Xu, N.; Guo, C.; Zhang, X.; Chen, Z.; Wang, P. Optimal energy management strategy for parallel plug-in hybrid electric vehicle based on driving behavior analysis and real time traffic information prediction. Mechatronics 2017, 46, 177–192. [Google Scholar] [CrossRef]
- Kaginalkar, A.; Kumar, S.; Gargava, P.; Niyogi, D. Review of urban computing in air quality management as smart city service: An integrated IoT, AI, and cloud technology perspective. Urban Clim. 2021, 39, 100972. [Google Scholar] [CrossRef]
- Silva, P.B.; Andrade, M.; Ferreira, S. Machine learning applied to road safety modeling: A systematic literature review. J. Traffic Transp. Eng. 2020, 7, 775–790. [Google Scholar] [CrossRef]
- Gatto, R.C.; Forster, C.H.Q. Audio-Based Machine Learning Model for Traffic Congestion Detection. IEEE Trans. Intell. Transp. Syst. 2020, 22, 7200–7207. [Google Scholar] [CrossRef]
- Tubaishat, M.; Zhuang, P.; Qi, Q.; Shang, Y. Wireless sensor networks in intelligent transportation systems. Wirel. Commun. Mob. Comput. 2008, 9, 287–302. [Google Scholar] [CrossRef]
- Padmaja, B.; Rao, P.V.N.; Bala, M.M.; Patro, E.K.R. A Novel Design of Autonomous Cars using IoT and Visual Features. In Proceedings of the 2018 2nd International Conference on I-SMAC (IoT in Social, Mobile, Analytics and Cloud) (I-SMAC)I-SMAC (IoT in Social, Mobile, Analytics and Cloud) (I-SMAC), Palladam, India, 30–31 August 2018; pp. 18–21. [Google Scholar] [CrossRef]
- Bhardwaj, K.K.; Khanna, A.; Sharma, D.K.; Chhabra, A. Designing energy-efficient IoT-based intelligent transport system: Need, architecture, characteristics, challenges, and applications. In Energy Conservation for IoT Devices; Springer: Singapore, 2019; pp. 209–233. [Google Scholar]
- Perez-Murueta, P.; Gómez-Espinosa, A.; Cardenas, C.; Gonzalez-Mendoza, M., Jr. Deep Learning System for Vehicular Re-Routing and Congestion Avoidance. Appl. Sci. 2019, 9, 2717. [Google Scholar] [CrossRef] [Green Version]
- Nosratabadi, S.; Mosavi, A.; Keivani, R.; Ardabili, S.; Aram, F. State of the Art Survey of Deep Learning and Machine Learning Models for Smart Cities and Urban Sustainability. In Proceedings of the International Conference on Global Research and Education, Balatonfüred, Hungary, 4–7 September 2019; pp. 228–238. [Google Scholar] [CrossRef] [Green Version]
- Chen, C.; Xiang, H.; Qiu, T.; Wang, C.; Zhou, Y.; Chang, V. A rear-end collision prediction scheme based on deep learning in the Internet of Vehicles. J. Parallel Distrib. Comput. 2018, 117, 192–204. [Google Scholar] [CrossRef]
- Majumdar, S.; Subhani, M.M.; Roullier, B.; Anjum, A.; Zhu, R. Congestion prediction for smart sustainable cities using IoT and machine learning approaches. Sustain. Cities Soc. 2020, 64, 102500. [Google Scholar] [CrossRef]
- Arshad, R.; Zahoor, S.; Shah, M.A.; Wahid, A.; Yu, H. Green IoT: An Investigation on Energy Saving Practices for 2020 and Beyond. IEEE Access 2017, 5, 15667–15681. [Google Scholar] [CrossRef]
- Balasubramaniam, A.; Paul, A.; Hong, W.-H.; Seo, H.; Kim, J.H. Comparative Analysis of Intelligent Transportation Systems for Sustainable Environment in Smart Cities. Sustainability 2017, 9, 1120. [Google Scholar] [CrossRef] [Green Version]
- Priyanka, E.B.; Thangavel, S.; Madhuvishal, V.; Tharun, S.; Raagul, K.V.; Krishnan, C.S.S. Application of Integrated IoT Framework to Water Pipeline Transportation System in Smart Cities. In Intelligence in Big Data Technologies—Beyond the Hype; Springer: Singapore, 2020; pp. 571–579. [Google Scholar] [CrossRef]
- Hussein, W.N.; Kamarudin, L.; Hussain, H.N.; Zakaria, A.; Ahmed, R.B.; Zahri, N. The Prospect of Internet of Things and Big Data Analytics in Transportation System. J. Phys. Conf. Ser. 2018, 1018, 012013. [Google Scholar] [CrossRef]
- Shoeibi, N. Future of smart parking: Automated valet parking using deep Q-learning. In Advances in Intelligent Systems and Computing; Springer International Publishing: Cham, Switzerland, 2020; pp. 177–182. [Google Scholar]
- Calabrese, M.; Cimmino, M.; Fiume, F.; Manfrin, M.; Romeo, L.; Ceccacci, S.; Paolanti, M.; Toscano, G.; Ciandrini, G.; Carrotta, A.; et al. SOPHIA: An Event-Based IoT and Machine Learning Architecture for Predictive Maintenance in Industry 4.0. Information 2020, 11, 202. [Google Scholar] [CrossRef] [Green Version]
- Patil, P. Smart IoT based system for vehicle noise and pollution monitoring. In Proceedings of the 2017 International Conference on Trends in Electronics and Informatics (ICEI), Tirunelveli, India, 11–12 May 2017. [Google Scholar]
- Zear, A.; Singh, P.K.; Singh, Y. Intelligent Transport System: A Progressive Review. Indian J. Sci. Technol. 2016, 9, 32. [Google Scholar] [CrossRef]
- Cheng, J.C.; Chen, W.; Chen, K.; Wang, Q. Data-driven predictive maintenance planning framework for MEP components based on BIM and IoT using machine learning algorithms. Autom. Constr. 2020, 112, 103087. [Google Scholar] [CrossRef]
- Jan, F.; Min-Allah, N.; Düştegör, D. IoT based smart water quality monitoring: Recent techniques, trends, and challenges for domestic applications. Water 2021, 13, 1729. [Google Scholar] [CrossRef]
- Asha, P.; Natrayan, L.; Geetha, B.; Beulah, J.R.; Sumathy, R.; Varalakshmi, G.; Neelakandan, S. IoT enabled environmental toxicology for air pollution monitoring using AI techniques. Environ. Res. 2021, 205, 112574. [Google Scholar] [CrossRef] [PubMed]
- Nocera, S.; Cavallaro, F. A Two-Step Method to Evaluate the Well-To-Wheel Carbon Efficiency of Urban Consolidation Centres. Res. Transp. Econ. 2017, 65, 44–55. [Google Scholar] [CrossRef]
- John, S.K.; Sivaraj, D.; Mugelan, R.K. Implementation Challenges and Opportunities of Smart City and Intelligent Transport Systems in India. In Internet of Things and Big Data Analytics for Smart Generation; Springer: Berlin/Heidelberg, Germany, 2018; pp. 213–235. [Google Scholar] [CrossRef]
- Menouar, H.; Guvenc, I.; Akkaya, K.; Uluagac, A.S.; Kadri, A.; Tuncer, A. UAV-Enabled Intelligent Transportation Systems for the Smart City: Applications and Challenges. IEEE Commun. Mag. 2017, 55, 22–28. [Google Scholar] [CrossRef]
- Velaga, N.R.; Quddus, M.; Bristow, A. Developing an enhanced weight-based topological map-matching algorithm for intelligent transport systems. Transp. Res. Part C Emerg. Technol. 2009, 17, 672–683. [Google Scholar] [CrossRef] [Green Version]
- Mitsakis, E.; Kotsi, A. Cooperative Intelligent Transport Systems as a Policy Tool for Mitigating the Impacts of Climate Change on Road Transport. In Data Analytics: Paving the Way to Sustainable Urban Mobility; Springer: Berlin/Heidelberg, Germany, 2018; pp. 418–425. [Google Scholar] [CrossRef]
- Zhao, Z.; Chen, W.; Wu, X.; Chen, P.C.Y.; Liu, J. LSTM network: A deep learning approach for short-term traffic forecast. IET Intell. Transp. Syst. 2017, 11, 68–75. [Google Scholar] [CrossRef] [Green Version]
- Bugeja, M.; Dingli, A.; Attard, M.; Seychell, D. Comparison of Vehicle Detection Techniques applied to IP Camera Video Feeds for use in Intelligent Transport Systems. Transp. Res. Procedia 2020, 45, 971–978. [Google Scholar] [CrossRef]
- Javed, M.A.; Zeadally, S.; Ben Hamida, E. Data analytics for Cooperative Intelligent Transport Systems. Veh. Commun. 2019, 15, 63–72. [Google Scholar] [CrossRef]
- Tian, Y.; Du, Y.; Zhang, Q.; Cheng, J.; Yang, Z. Depth estimation for advancing intelligent transport systems based on self-improving pyramid stereo network. IET Intell. Transp. Syst. 2020, 14, 338–345. [Google Scholar] [CrossRef]
- Zhang, D.; Kabuka, M.R. Combining weather condition data to predict traffic flow: A GRU-based deep learning approach. Intell. Transp. Syst. 2018, 12, 578–585. [Google Scholar] [CrossRef]
- Levina, A.I.; Dubgorn, A.S.; Iliashenko, O.Y. Internet of Things within the Service Architecture of Intelligent Transport Systems. In Proceedings of the 2017 European Conference on Electrical Engineering and Computer Science (EECS), Bern, Switzerland, 17–19 November 2017; pp. 351–355. [Google Scholar] [CrossRef]
- Dass, P.; Misra, S.; Roy, C. T-safe: Trustworthy service provisioning for IoT-based intelligent transport systems. IEEE Trans. Veh. Technol. 2020, 69, 9509–9517. [Google Scholar] [CrossRef]
- Deng, Z.; Huang, D.; Liu, J.; Mi, B.; Liu, Y. An Assessment Method for Traffic State Vulnerability Based on a Cloud Model for Urban Road Network Traffic Systems. IEEE Trans. Intell. Transp. Syst. 2020, 22, 7155–7168. [Google Scholar] [CrossRef]
- Zambada, J.; Quintero, R.; Isijara, R.; Galeana, R.; Santillan, L. An IoT based scholar bus monitoring system. In Proceedings of the 2015 IEEE First International Smart Cities Conference (ISC2), Guadalajara, Mexico, 25–28 October 2015. [Google Scholar]
- Eswaraprasad, R.; Raja, L. Improved intelligent transport system for reliable traffic control management by adapting internet of things. In Proceedings of the 2017 International Conference on Infocom Technologies and Unmanned Systems (Trends and Future Directions) (ICTUS), Dubai, United Arab Emirates, 18–20 December 2017. [Google Scholar]
- Choy, J.L.C.; Wu, J.; Long, C.; Lin, Y.-B. Ubiquitous and Low Power Vehicles Speed Monitoring for Intelligent Transport Systems. IEEE Sens. J. 2020, 20, 5656–5665. [Google Scholar] [CrossRef]
- Carignani, M.; Ferrini, S.; Petracca, M.; Falcitelli, M.; Pagano, P. A prototype bridge between automotive and the IoT. In Proceedings of the 2015 IEEE 2nd World Forum on Internet of Things (WF-IoT), Milan, Italy, 14–16 December 2015. [Google Scholar]
- Manjoro, W.S.; Dhakar, M.; Chaurasia, B.K. Traffic congestion detection using data mining in VANET. In Proceedings of the 2016 IEEE Students’ Conference on Electrical, Electronics and Computer Science (SCEECS), Bhopal, India, 5–6 March 2016; pp. 1–6. [Google Scholar] [CrossRef]
- Al-Turjman, F.; Lemayian, J.P. Intelligence, security, and vehicular sensor networks in the internet of things (IoT)-enabled smart-cities: An overview. Comput. Electr. Eng. 2020, 87, 106776. [Google Scholar] [CrossRef]
- Mogi, R.; Nakayama, T.; Asaka, T. Load-balancing method for IoT sensor system using multi-access edge computing, In Proceedings of the 2018 Sixth International Symposium on Computing and Networking Workshops (CANDARW), Takayama, Japan, 27–30 November 2018.
- Kebbeh, P.S.; Jain, M.; Gueye, B. SenseNet: IoT temperature measurement in railway networks for intelligent transport. In Proceedings of the 2020 IEEE International Conf on Natural and Engineering Sciences for Sahel’s Sustainable Development–Impact of Big Data Application on Society and Environment (IBASE-BF), Ouagadougou, Burkina Faso, 4–6 February 2020. [Google Scholar]
- Wang, D.; Chen, D.; Song, B.; Guizani, N.; Yu, X.; Du, X. From IoT to 5G I-IoT: The Next Generation IoT-Based Intelligent Algorithms and 5G Technologies. IEEE Commun. Mag. 2018, 56, 114–120. [Google Scholar] [CrossRef]
- Sodhro, A.H. Quality of service optimization in an IoT-driven intelligent transportation system. IEEE Wirel. Commun. 2019, 26, 10–17. [Google Scholar] [CrossRef] [Green Version]
- Kiela, K.; Barzdenas, V.; Jurgo, M.; Macaitis, V.; Rafanavicius, J.; Vasjanov, A.; Kladovscikov, L.; Navickas, R. Review of V2X–IoT Standards and Frameworks for ITS Applications. Appl. Sci. 2020, 10, 4314. [Google Scholar] [CrossRef]
- Geetha, S.; Cicilia, D. IoT enabled intelligent bus transportation system. In Proceedings of the 2017 2nd International Conference on Communication and Electronics Systems (ICCES), Coimbatore, India, 19–20 October 2017. [Google Scholar]
- Sharma, K.; Chaurasia, B.K.; Verma, S.; Bhargava, A. Trust computation in VANET using TOEFV. Int. J. Trust. Manag. Comput. Commun. 2017, 4, 36–51. [Google Scholar] [CrossRef]
- Lilhore, U.K.; Simaiya, S.; Guleria, K.; Prasad, D. An efficient load balancing method using machine learning-based V.M. distribution and dynamic resource mapping. J. Comput. Theor. Nanosci. 2020, 17, 2545–2551. [Google Scholar] [CrossRef]
- Lilhore, U.K.; Saurabh, P.; Verma, B. A new approach to overcome the problem of congestion in wireless networks. In Advances in Intelligent Systems and Computing; Springer: Berlin/Heidelberg, Germany, 2013; pp. 499–506. [Google Scholar] [CrossRef]
- Misbahuddin, S.; Zubairi, J.A.; Saggaf, A.; Basuni, J.; Sulaiman, A.; Al-Sofi, A. IoT based dynamic road traffic management for smart cities. In Proceedings of the 2015 12th International Conference on High-Capacity Optical Networks and Enabling/Emerging Technologies (HONET), Islamabad, Pakistan, 21–23 December 2015; pp. 1–5. [Google Scholar]
- Qureshi, K.N.; Abdullah, A.H. A survey of intelligent transportation systems. In Proceedings of the 2011 Third International Conference on Computational Intelligence, Communication Systems and Networks, Washington, DC, USA, 23–28 July 2011; 2011; pp. 332–337. [Google Scholar]
- Makarova, I.; Khabibullin, R.; Belyaev, E.; Mavrin, V. Intelligent transportation systems–problems and perspectives. Stud. Syst. Decis. Control 2015, 32, 37–80. [Google Scholar]
- Ota, K.; Kumrai, T.; Dong, M.; Kishigami, J.; Guo, M. Smart Infrastructure Design for Smart Cities. IT Prof. 2017, 19, 42–49. [Google Scholar] [CrossRef]
- Datta, P.; Sharma, B. A survey on IoT architectures, protocols, security and smart city-based applications. In Proceedings of the 8th International Conference on Computing, Communication and Networking Technologies (ICCCNT), Delhi, India, 3–5 July 2017. [Google Scholar]
- Simaiya, S.; Lilhore, U.K.; Sharma, S.K.; Gupta, K.; Baggan, V. Blockchain: A New Technology to Enhance Data Security and Privacy in Internet of Things. J. Comput. Theor. Nanosci. 2020, 17, 2552–2556. [Google Scholar] [CrossRef]
- Saifuzzaman, M.; Shetu, S.F.; Moon, N.N.; Nur, F.N.; Ali, M.H. IoT Based Street Lighting Using Dual Axis Solar Tracker and Effective Traffic Management System Using Deep Learning: Bangladesh Context. In Proceedings of the 11th International Conference on Computing, Communication And Networking Technologies (ICCCNT 2020), Kharagpur, India, 1–3 July 2020. [Google Scholar]


| Ref. No. | Key Technique | Methods/Algorithm | Traffic Congestion | Smart Parking/Road | Merits |
|---|---|---|---|---|---|
| [36] | Traffic congestion detection | Machine learning, IoT | Yes | No | Automatic vehicle detection method and automatic route-transfer method |
| [37] | Collision avoidance | IoT, Big data | Yes | Yes | Design collision-free protocol for transportation |
| [38] | Intelligent transport system | Machine learning, IoT | Yes | Yes | No collision Improved road transportation Improved safety |
| [39] | Congestion and pollution control in transportation | Deep learning, IoT | Yes | Yes | Improved pollution control Congestion control by time method and route transfer |
| [40] | Sustainable and safety in transportation | IoT and Machine learning | Yes | No | Effectively managed road safety, minor collision |
| [41] | Collision and pollution in traffic management | IoT and Neural Network | Yes | Yes | Consumed less energy collision control method |
| [42] | Intelligent, sustainable transport | Machine learning, Cloud, and IoT | Yes | Yes | Smart route discovery zero collision |
| [43] | Green transportation | Neural Network, IoT | Yes | No | Pollution control method smooth traffic control |
| [44] | Pollution control and avoidance in transportation | IoT and Big data | Yes | Yes | Smart traffic lights and road pollution control |
| [45] | Smart transportation design | IoT, Machine learning | No | Yes | Smart city and parking system model |
| [14] | Safety issues in transportation | Big data, IoT | No | No | Road safety model analysis of accidental records identification of critical accidental zones |
| [46] | Smart parking | IoT, Machine learning | No | Yes | Smart city model |
| [47] | IoT Industry 4.0 | IoT, Machine learning | Yes | Yes | Smart logistics and supply chain and automation in the industry |
| [48] | Pollution and smart transport | Cloud computing, IoT | Yes | No | Congestion control method and pollution control |
| [49] | Intelligent transport system | IoT and cloud computing | Yes | Yes | No collision improved road transportation |
| [50] | Automation in transportation | IoT and Machine learning | Yes | No | Improved pollution control congestion control improved time method and route transfer protocol |
| Entity | Subunit | Property | Functionalities |
|---|---|---|---|
| Vehicles | Automobiles (2, 3, and 4 wheelers) | Vehicle ID, speed, vehicle type, lane | To recognize a vehicle |
| Vehicle control unit | Manual and automatic | To determine the vehicle control type | |
| Infrastructure | Road unit | Lane ID, Lane name, length, one way, two way | To determine the road unit |
| Traffic light control unit, | ID, installation status, delay duration | To determine the traffic light control unit | |
| Street light unit | ID, installation status | To determine the street light unit | |
| Events | Vehicle to Vehicle Communication | Vehicle speed, vehicle turn information, | To determine the V2V communication |
| Vehicle to infrastructure communication | Signboard, pedestrian crossing, traffic light, speed indicator | To determine the V2I communication |
| Simulation Duration in Seconds | Vehicle Count(in Each Road Segment) | Cluster Type (Normal) | Cluster Type (Anomaly) |
|---|---|---|---|
| 60 | 75 | 70 | 1 |
| 70 | 77 | 72 | 1 |
| 80 | 80 | 75 | 1 |
| 90 | 82 | 76 | 2 |
| 100 | 85 | 78 | 2 |
| 110 | 87 | 79 | 3 |
| 120 | 88 | 81 | 3 |
| 130 | 90 | 82 | 3 |
Publisher’s Note: MDPI stays neutral with regard to jurisdictional claims in published maps and institutional affiliations. |
© 2022 by the authors. Licensee MDPI, Basel, Switzerland. This article is an open access article distributed under the terms and conditions of the Creative Commons Attribution (CC BY) license (https://creativecommons.org/licenses/by/4.0/).
Share and Cite
Lilhore, U.K.; Imoize, A.L.; Li, C.-T.; Simaiya, S.; Pani, S.K.; Goyal, N.; Kumar, A.; Lee, C.-C. Design and Implementation of an ML and IoT Based Adaptive Traffic-Management System for Smart Cities. Sensors 2022, 22, 2908. https://doi.org/10.3390/s22082908
Lilhore UK, Imoize AL, Li C-T, Simaiya S, Pani SK, Goyal N, Kumar A, Lee C-C. Design and Implementation of an ML and IoT Based Adaptive Traffic-Management System for Smart Cities. Sensors. 2022; 22(8):2908. https://doi.org/10.3390/s22082908
Chicago/Turabian StyleLilhore, Umesh Kumar, Agbotiname Lucky Imoize, Chun-Ta Li, Sarita Simaiya, Subhendu Kumar Pani, Nitin Goyal, Arun Kumar, and Cheng-Chi Lee. 2022. "Design and Implementation of an ML and IoT Based Adaptive Traffic-Management System for Smart Cities" Sensors 22, no. 8: 2908. https://doi.org/10.3390/s22082908
APA StyleLilhore, U. K., Imoize, A. L., Li, C.-T., Simaiya, S., Pani, S. K., Goyal, N., Kumar, A., & Lee, C.-C. (2022). Design and Implementation of an ML and IoT Based Adaptive Traffic-Management System for Smart Cities. Sensors, 22(8), 2908. https://doi.org/10.3390/s22082908