Author Contributions
Conceptualization, C.-H.S. and P.-C.C.; methodology, C.-H.S., P.-C.C., S.-F.L., H.-W.T., T.-L.Y. and Y.-C.S.; software, C.-H.S.; validation, C.-H.S., P.-C.C. and H.-W.T.; formal analysis, C.-H.S., P.-C.C. and H.-W.T.; investigation, C.-H.S.; resources, S.-F.L., H.-W.T., T.-L.Y. and Y.-C.S.; data curation, S.-F.L., H.-W.T., T.-L.Y. and Y.-C.S.; writing—original draft preparation, C.-H.S.; writing—review and editing, P.-C.C. and Y.-C.S.; visualization, C.-H.S.; supervision, P.-C.C.; project administration, P.-C.C.; funding acquisition, P.-C.C., S.-F.L. and Y.-C.S. All authors have read and agreed to the published version of the manuscript.
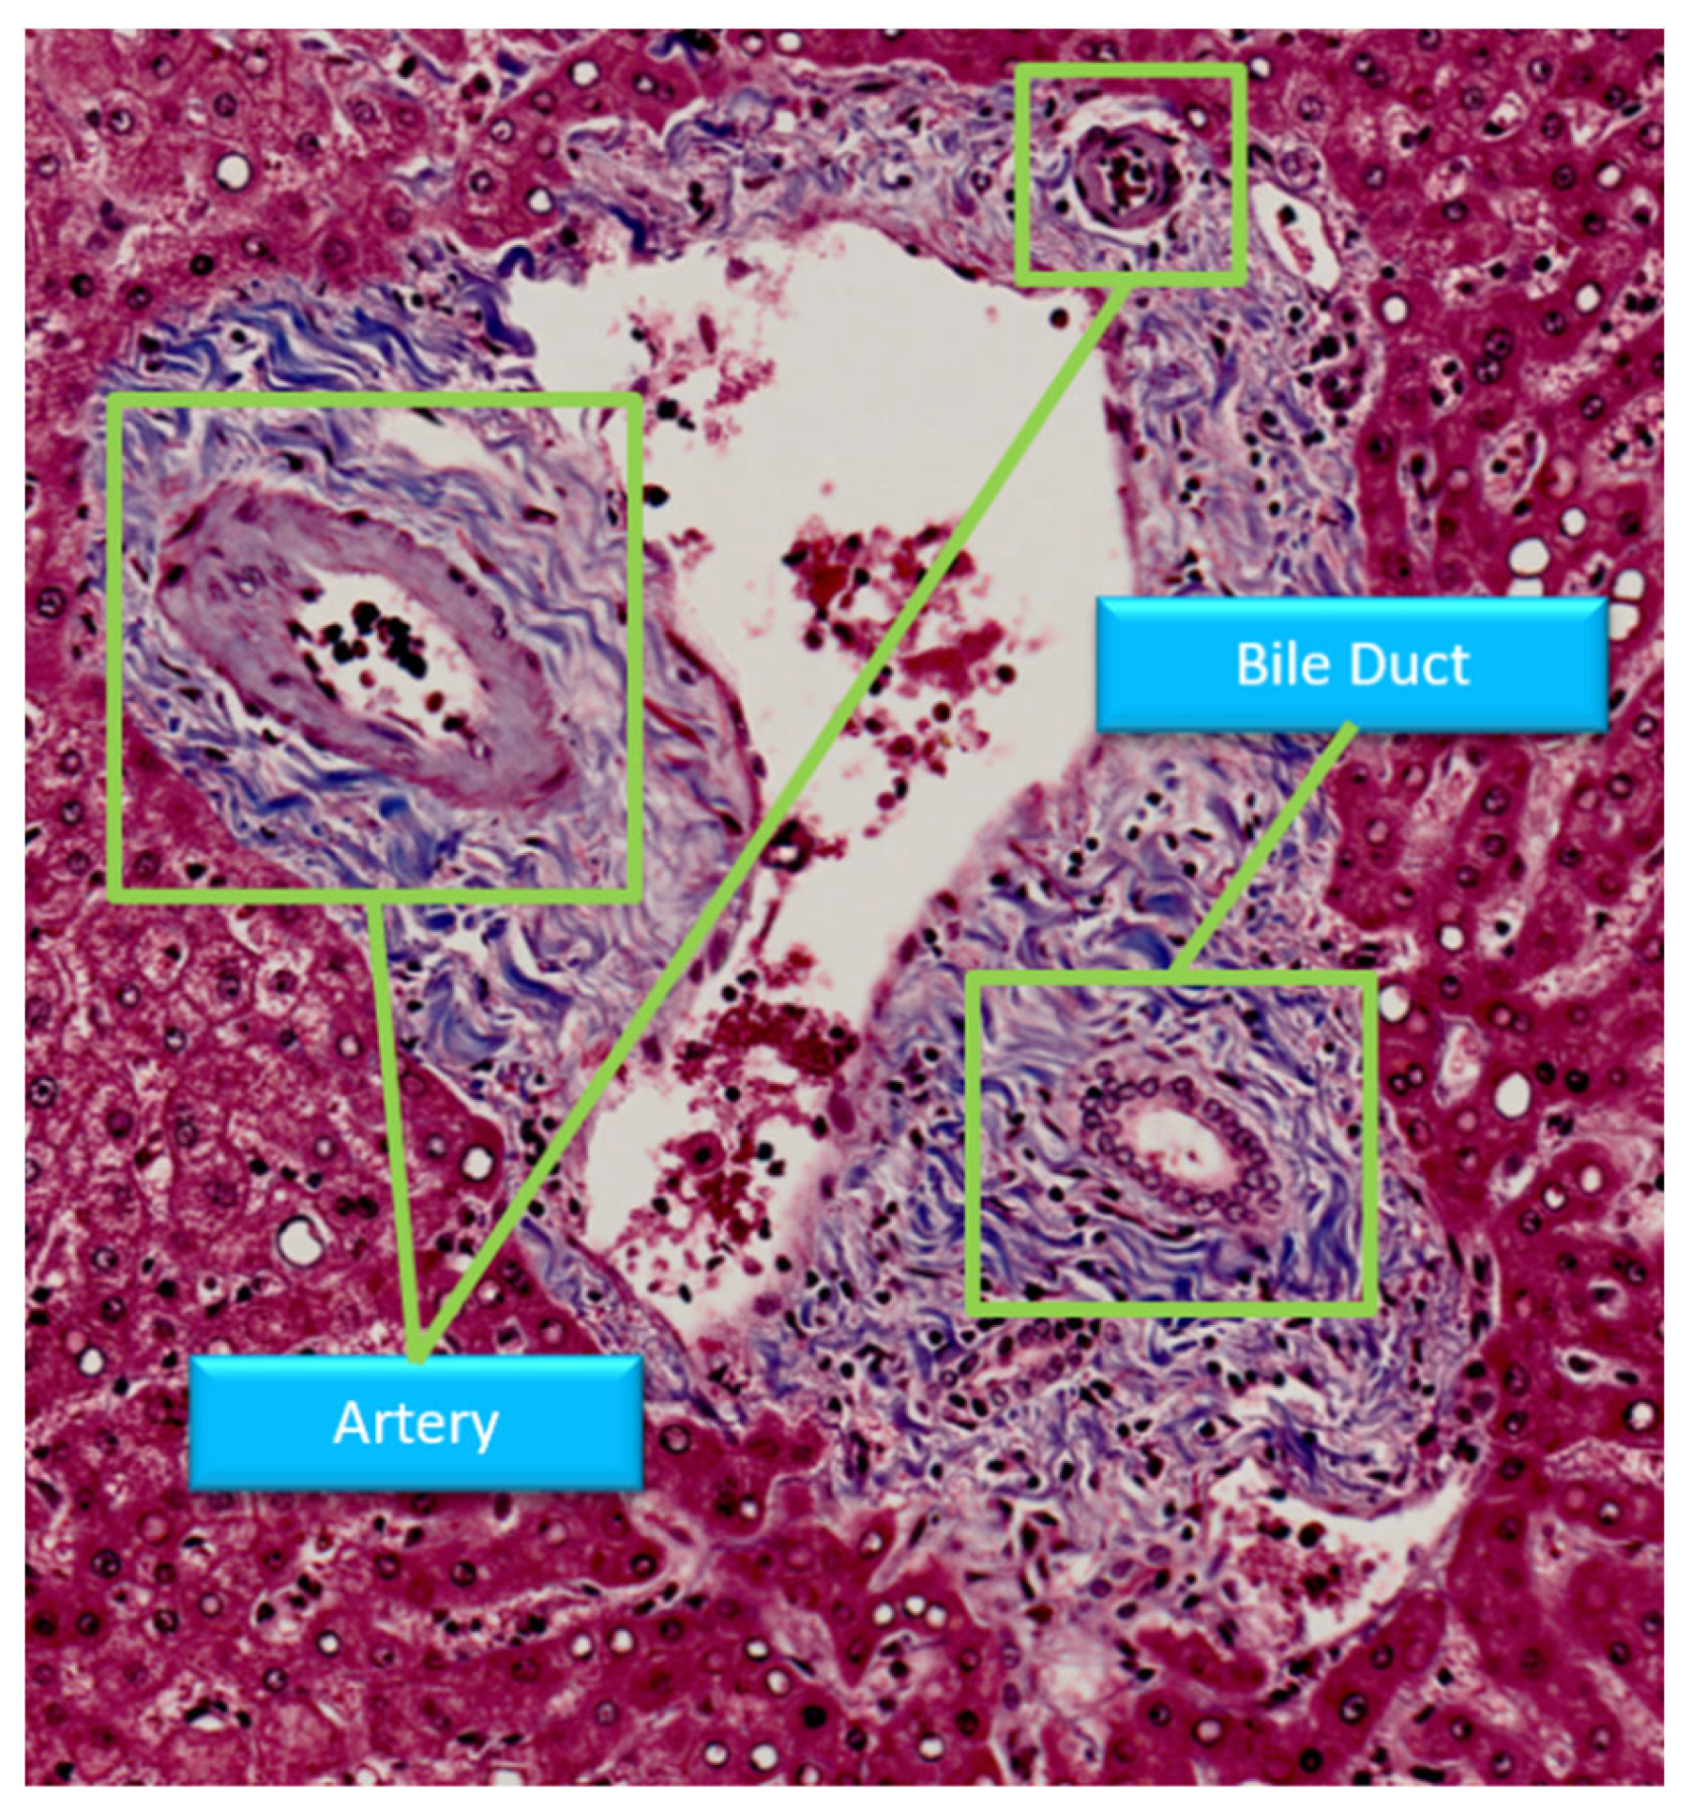
Figure 1.
Structure of portal area in Masson stain.
Figure 1.
Structure of portal area in Masson stain.
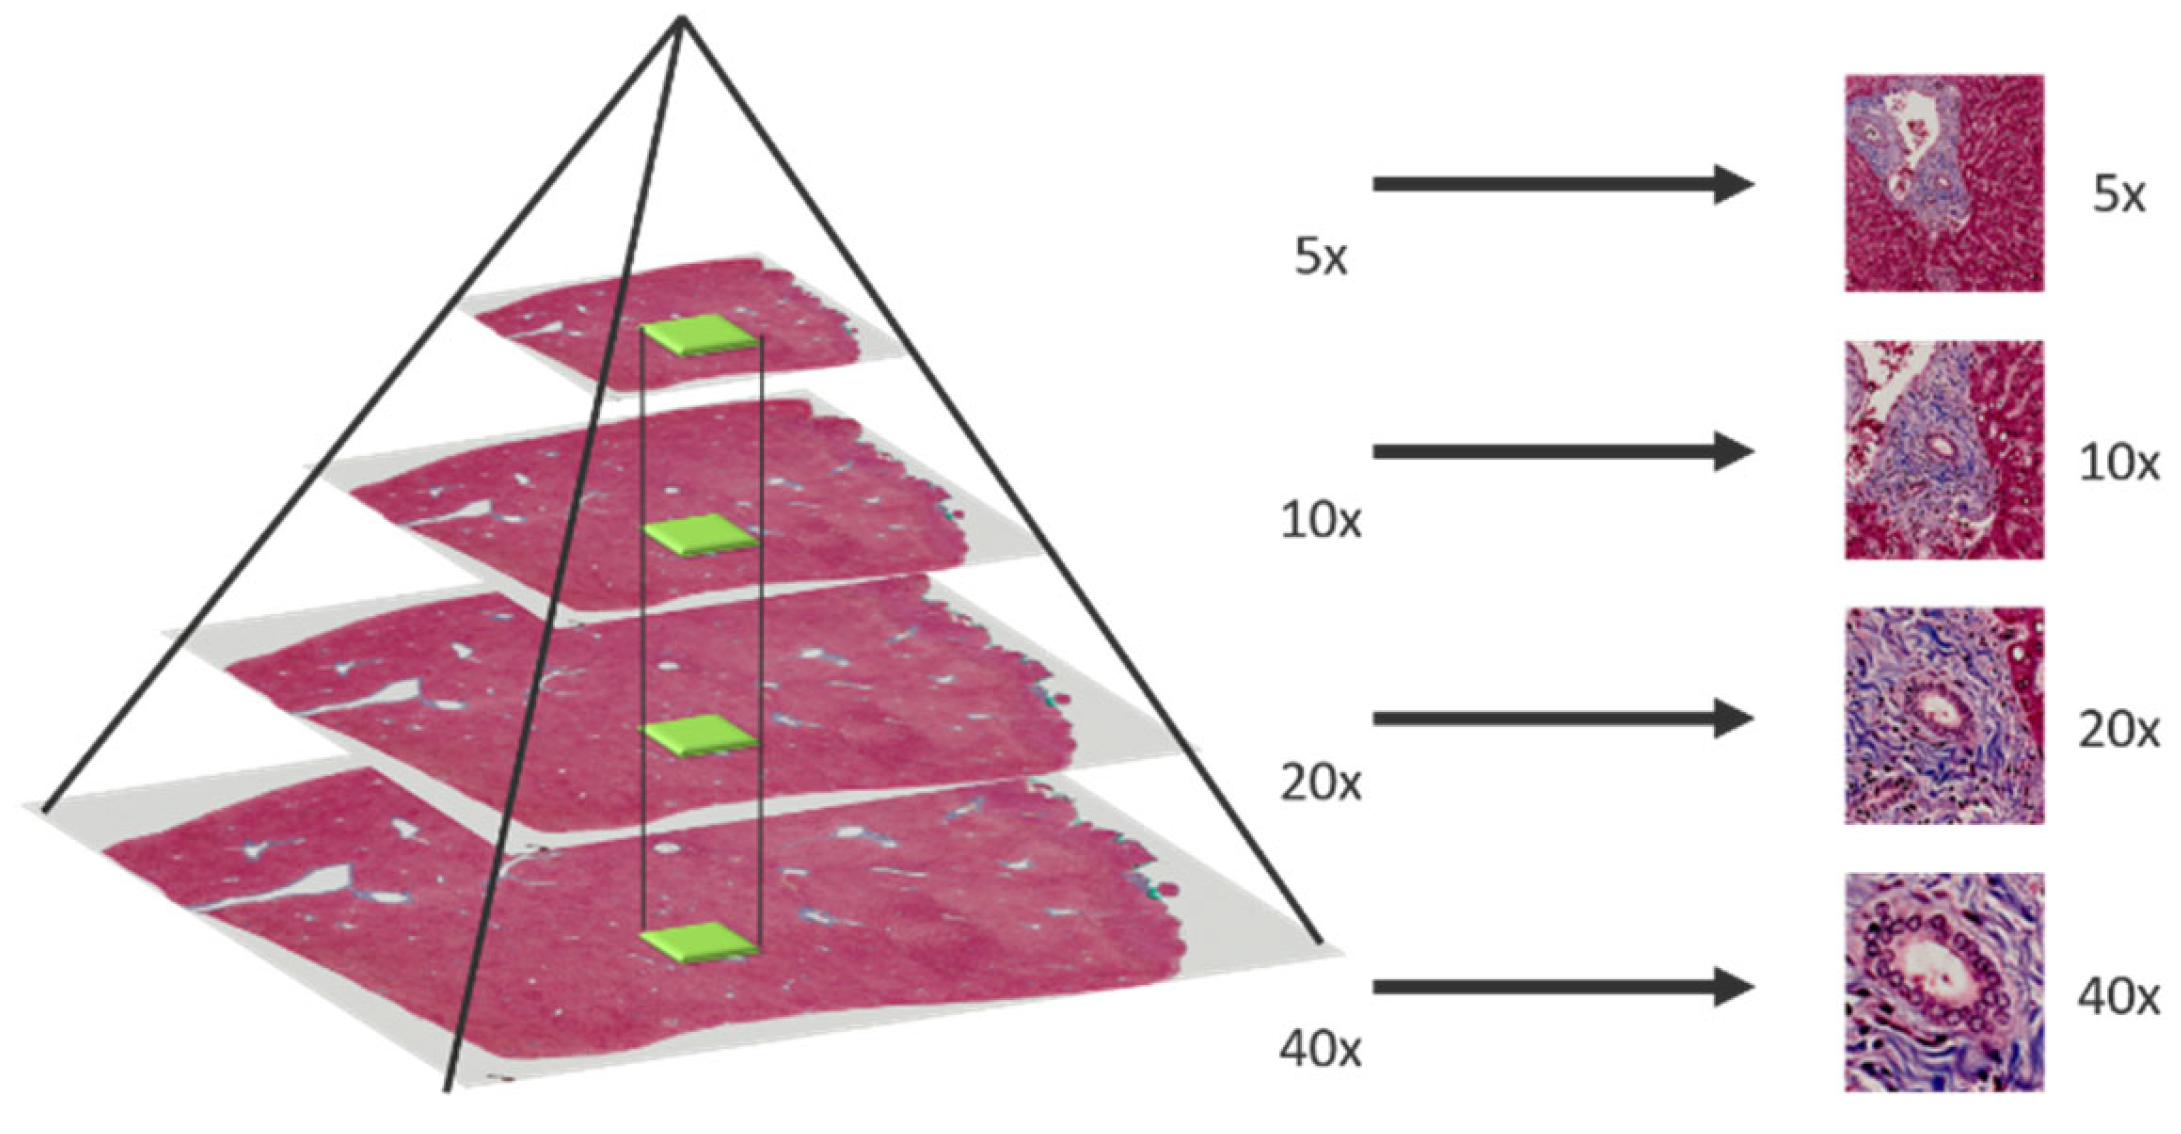
Figure 2.
Multi-magnification patches generated by sliding window.
Figure 2.
Multi-magnification patches generated by sliding window.
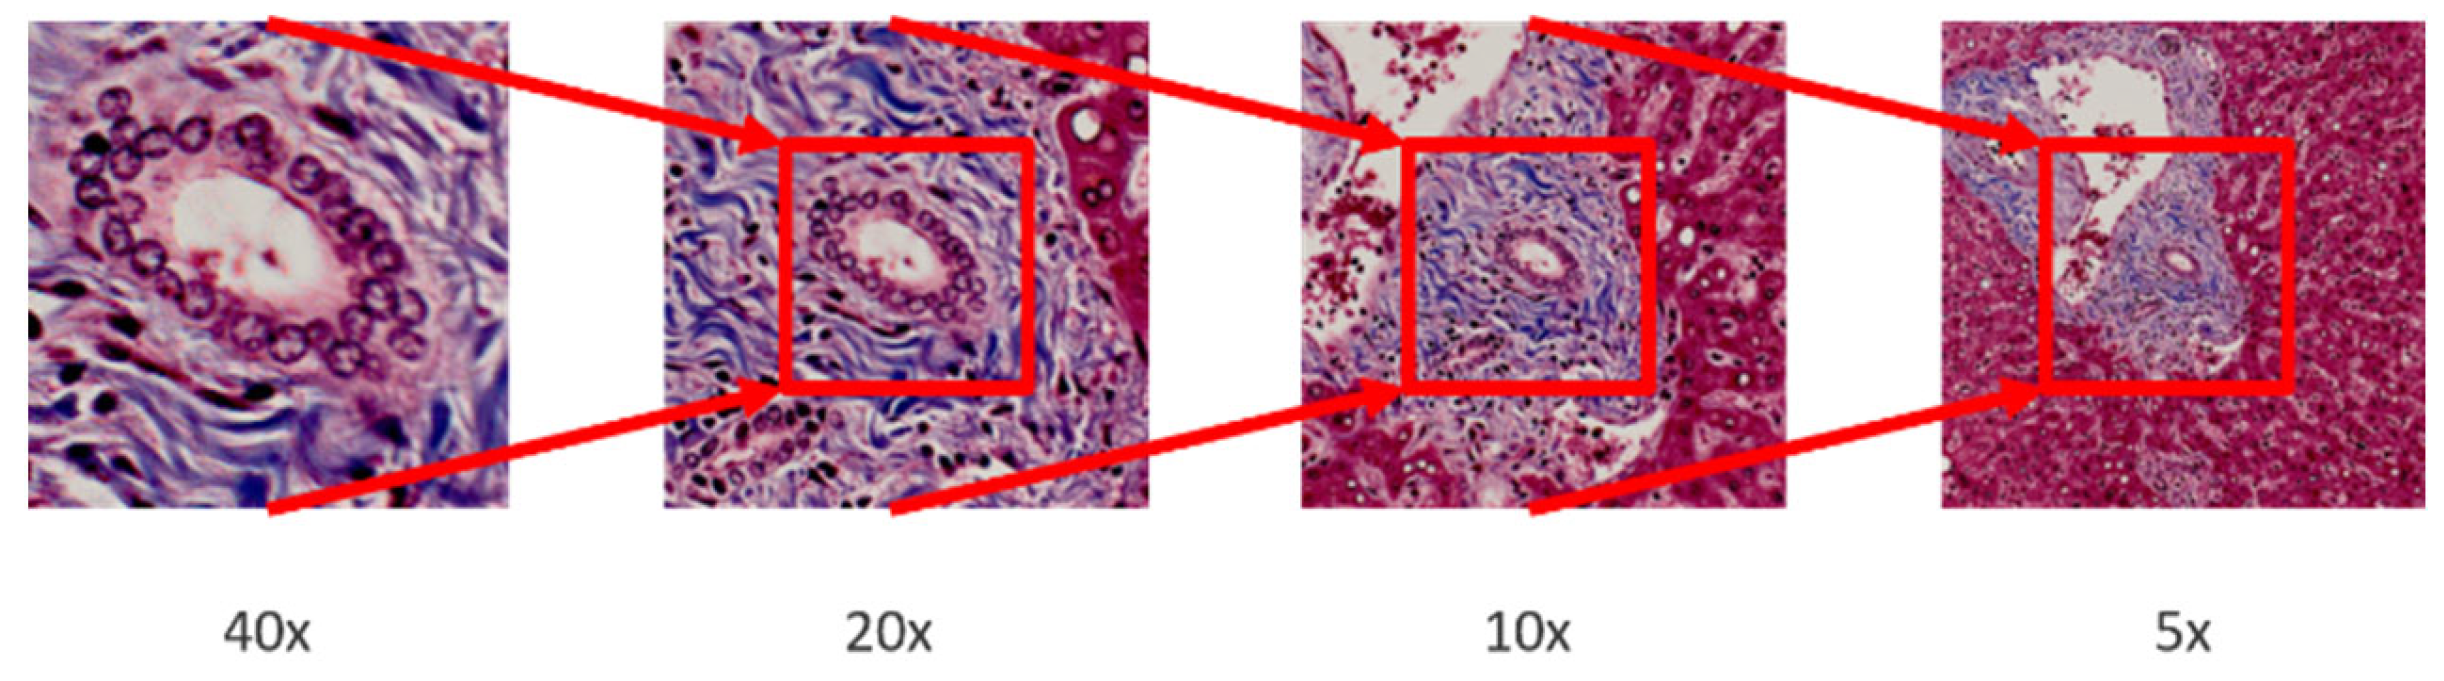
Figure 3.
Patches from different magnifications. The higher magnification patch is located in the central region of the lower magnification patch.
Figure 3.
Patches from different magnifications. The higher magnification patch is located in the central region of the lower magnification patch.
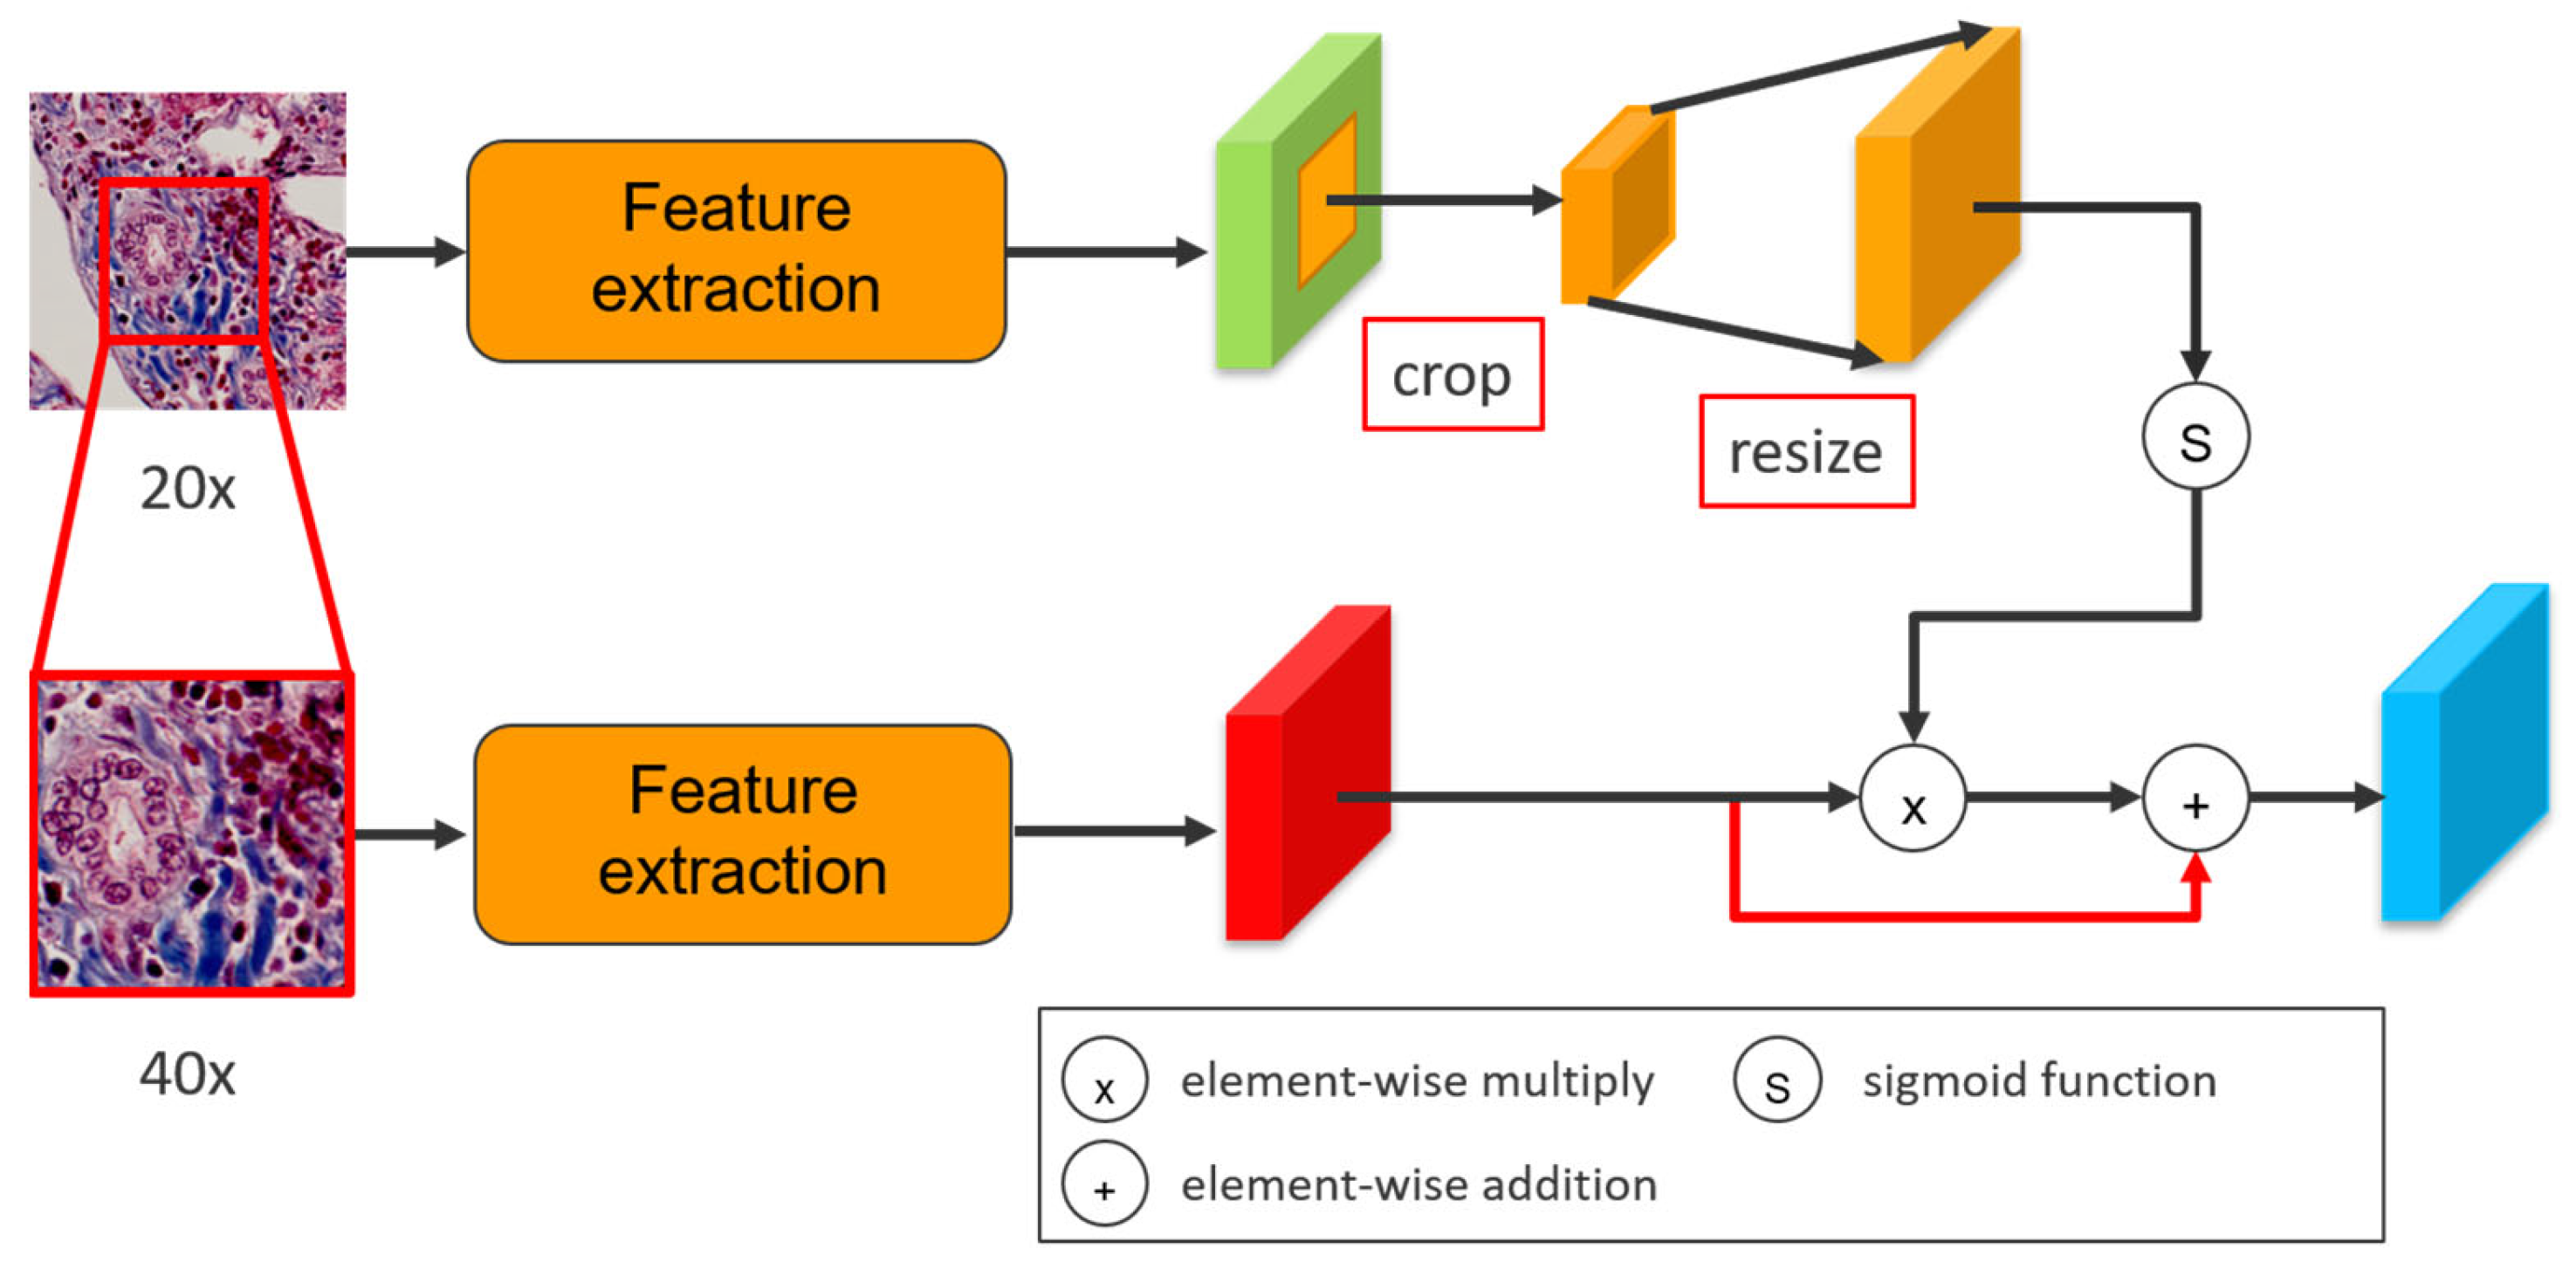
Figure 4.
The central crop method to align different magnification feature maps.
Figure 4.
The central crop method to align different magnification feature maps.
Figure 5.
An attention method to enhance the high-magnification feature map.
Figure 5.
An attention method to enhance the high-magnification feature map.
Figure 6.
The attention method visualization.
Figure 6.
The attention method visualization.
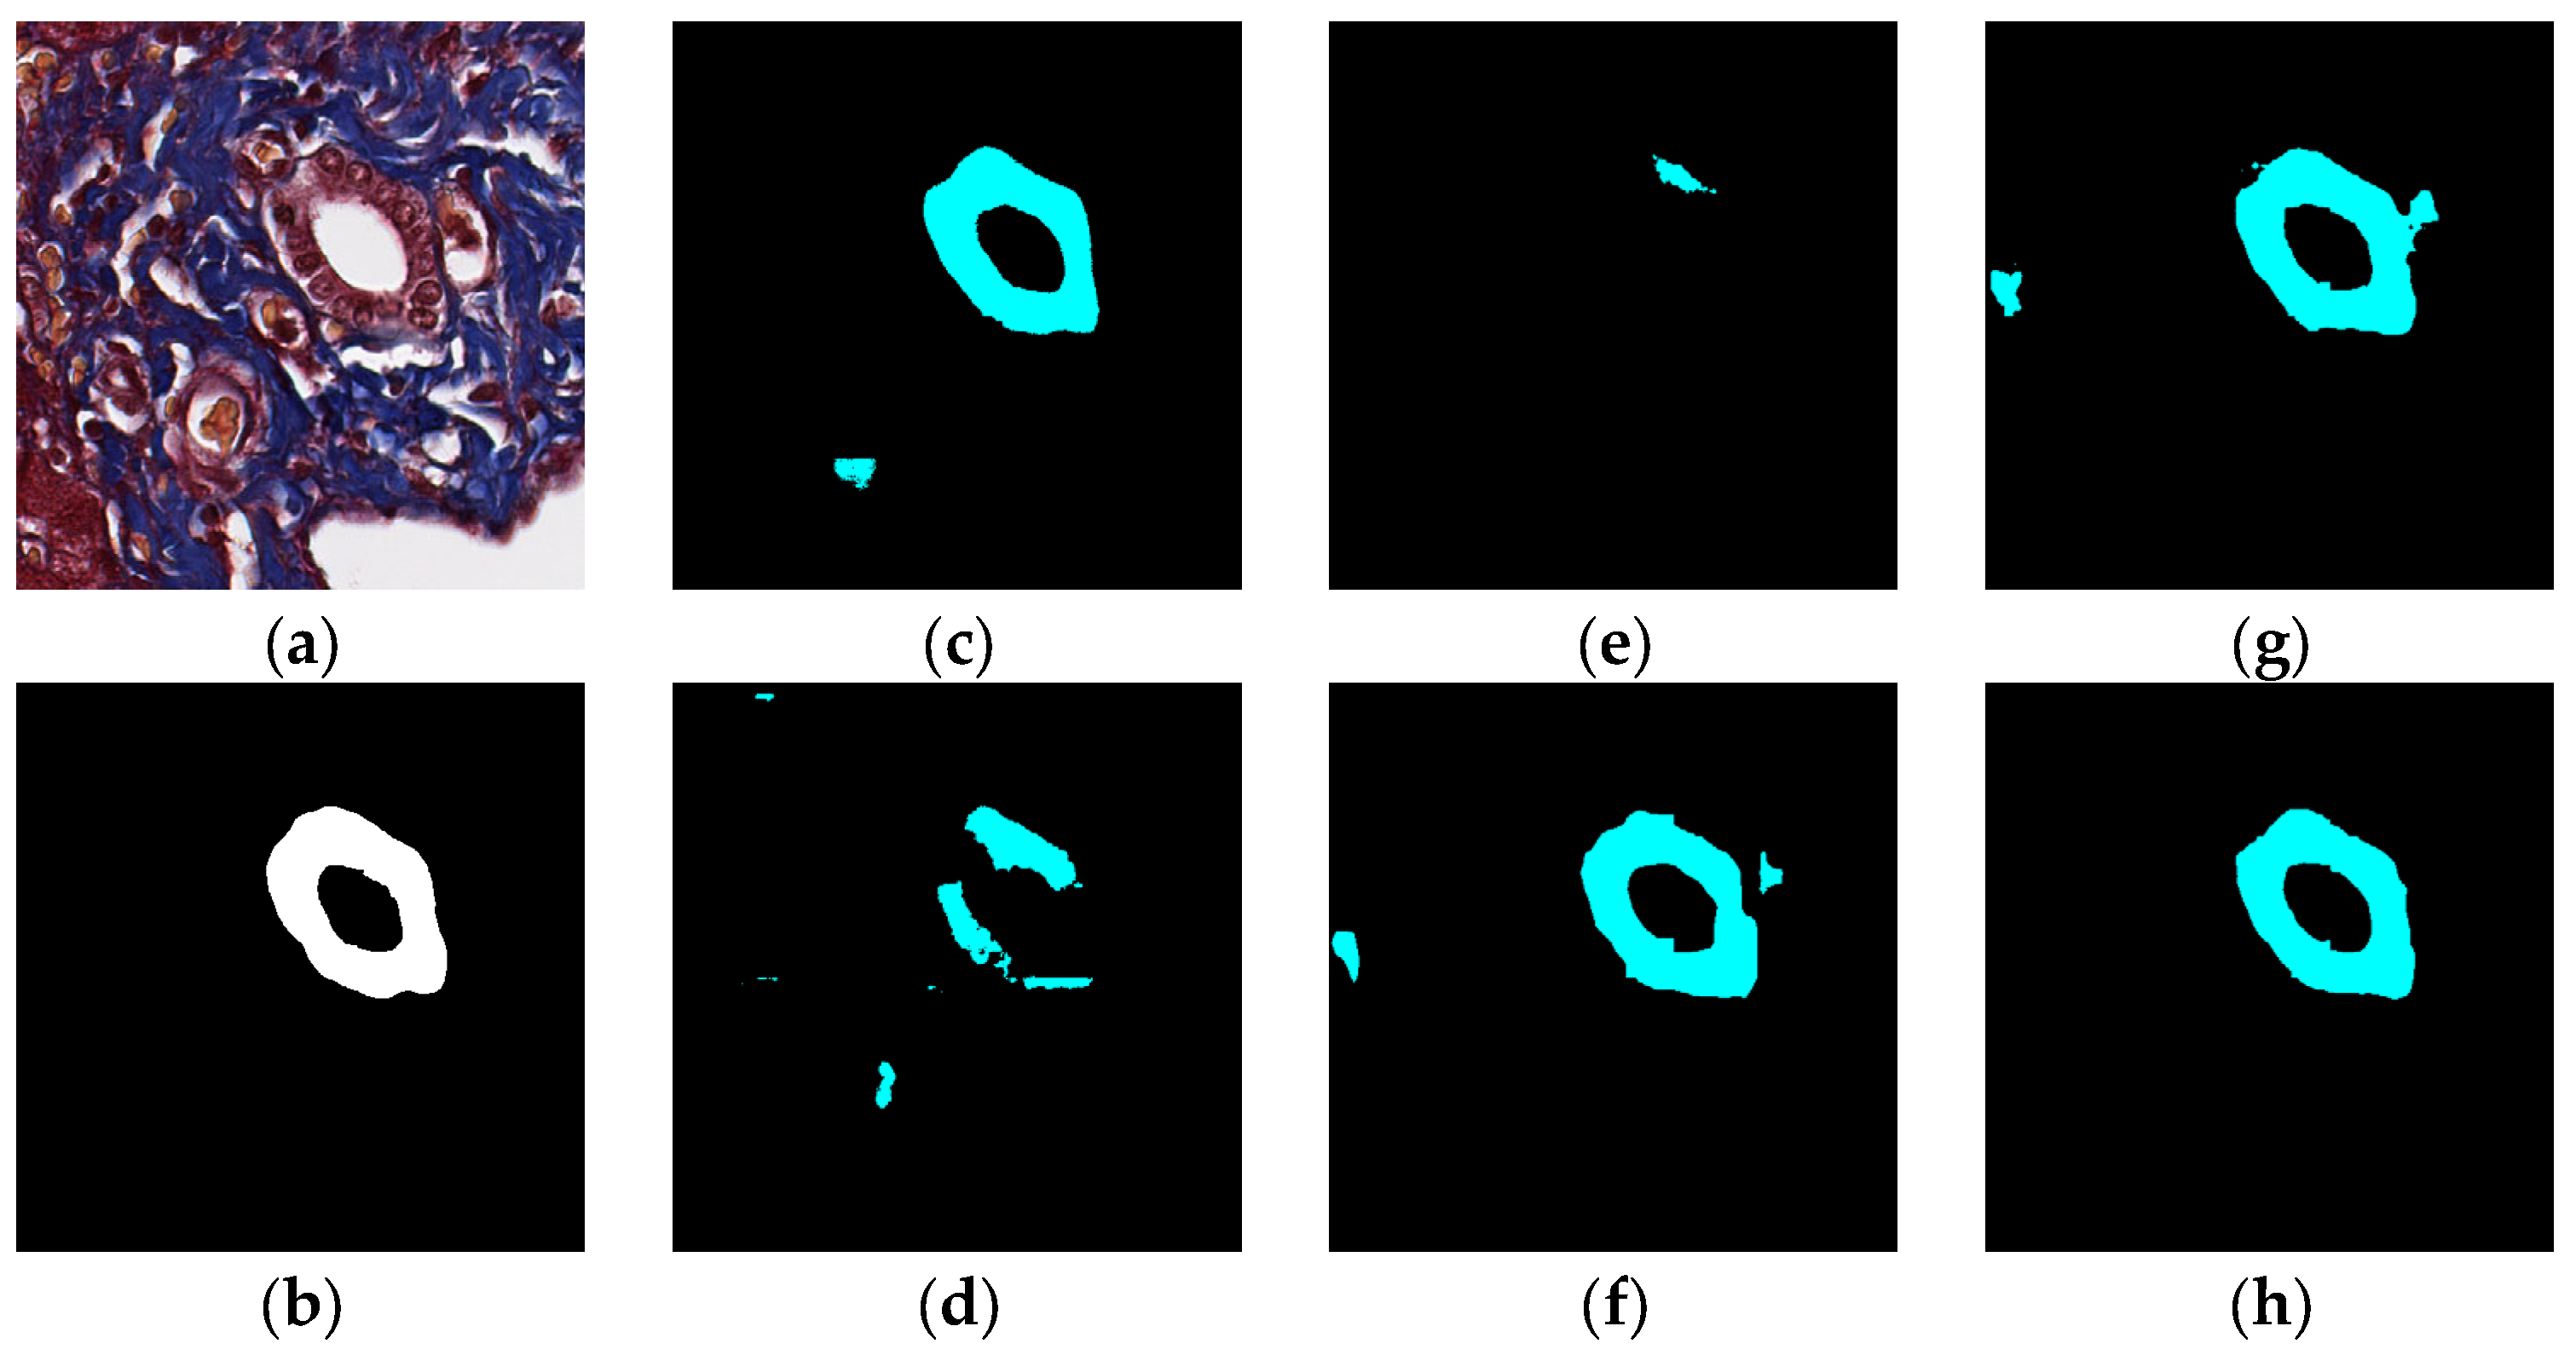
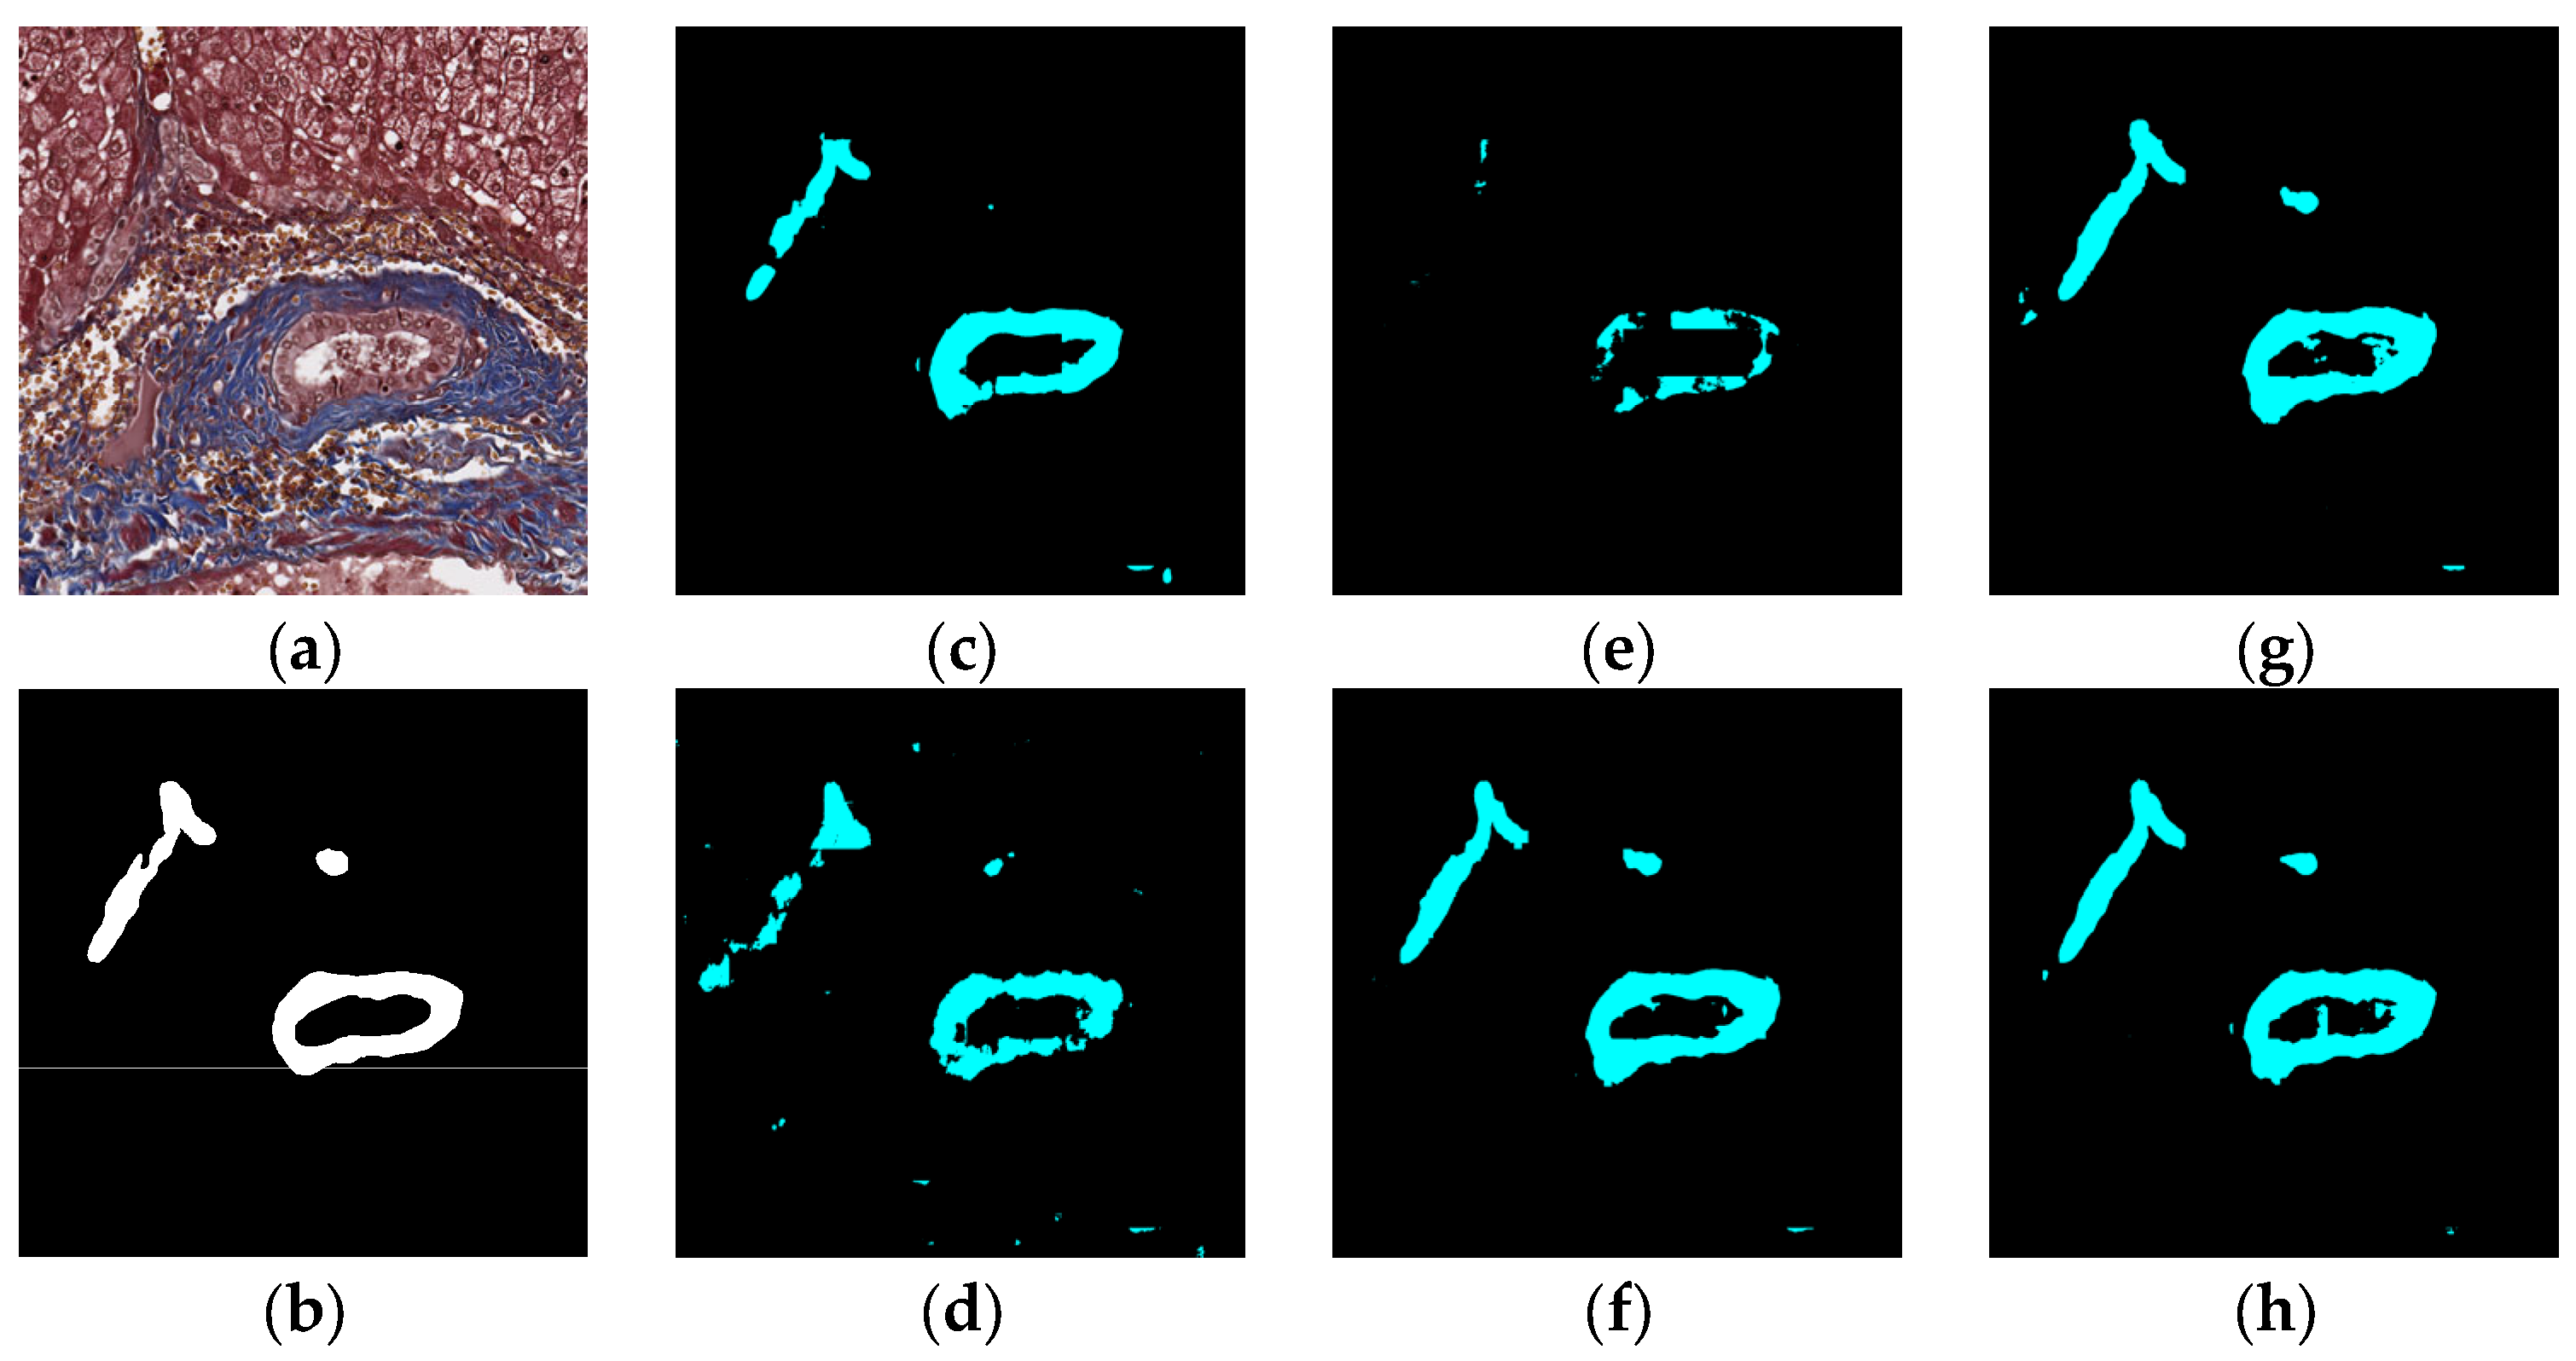
Figure 7.
Segmentation results for clearly visible bile ducts: original (a), GT (b), FCN (c), SegNet (d), U-Net (e), Deeplabv3 (f), Deeplabv3-plus (g), and the proposed network (h).
Figure 7.
Segmentation results for clearly visible bile ducts: original (a), GT (b), FCN (c), SegNet (d), U-Net (e), Deeplabv3 (f), Deeplabv3-plus (g), and the proposed network (h).
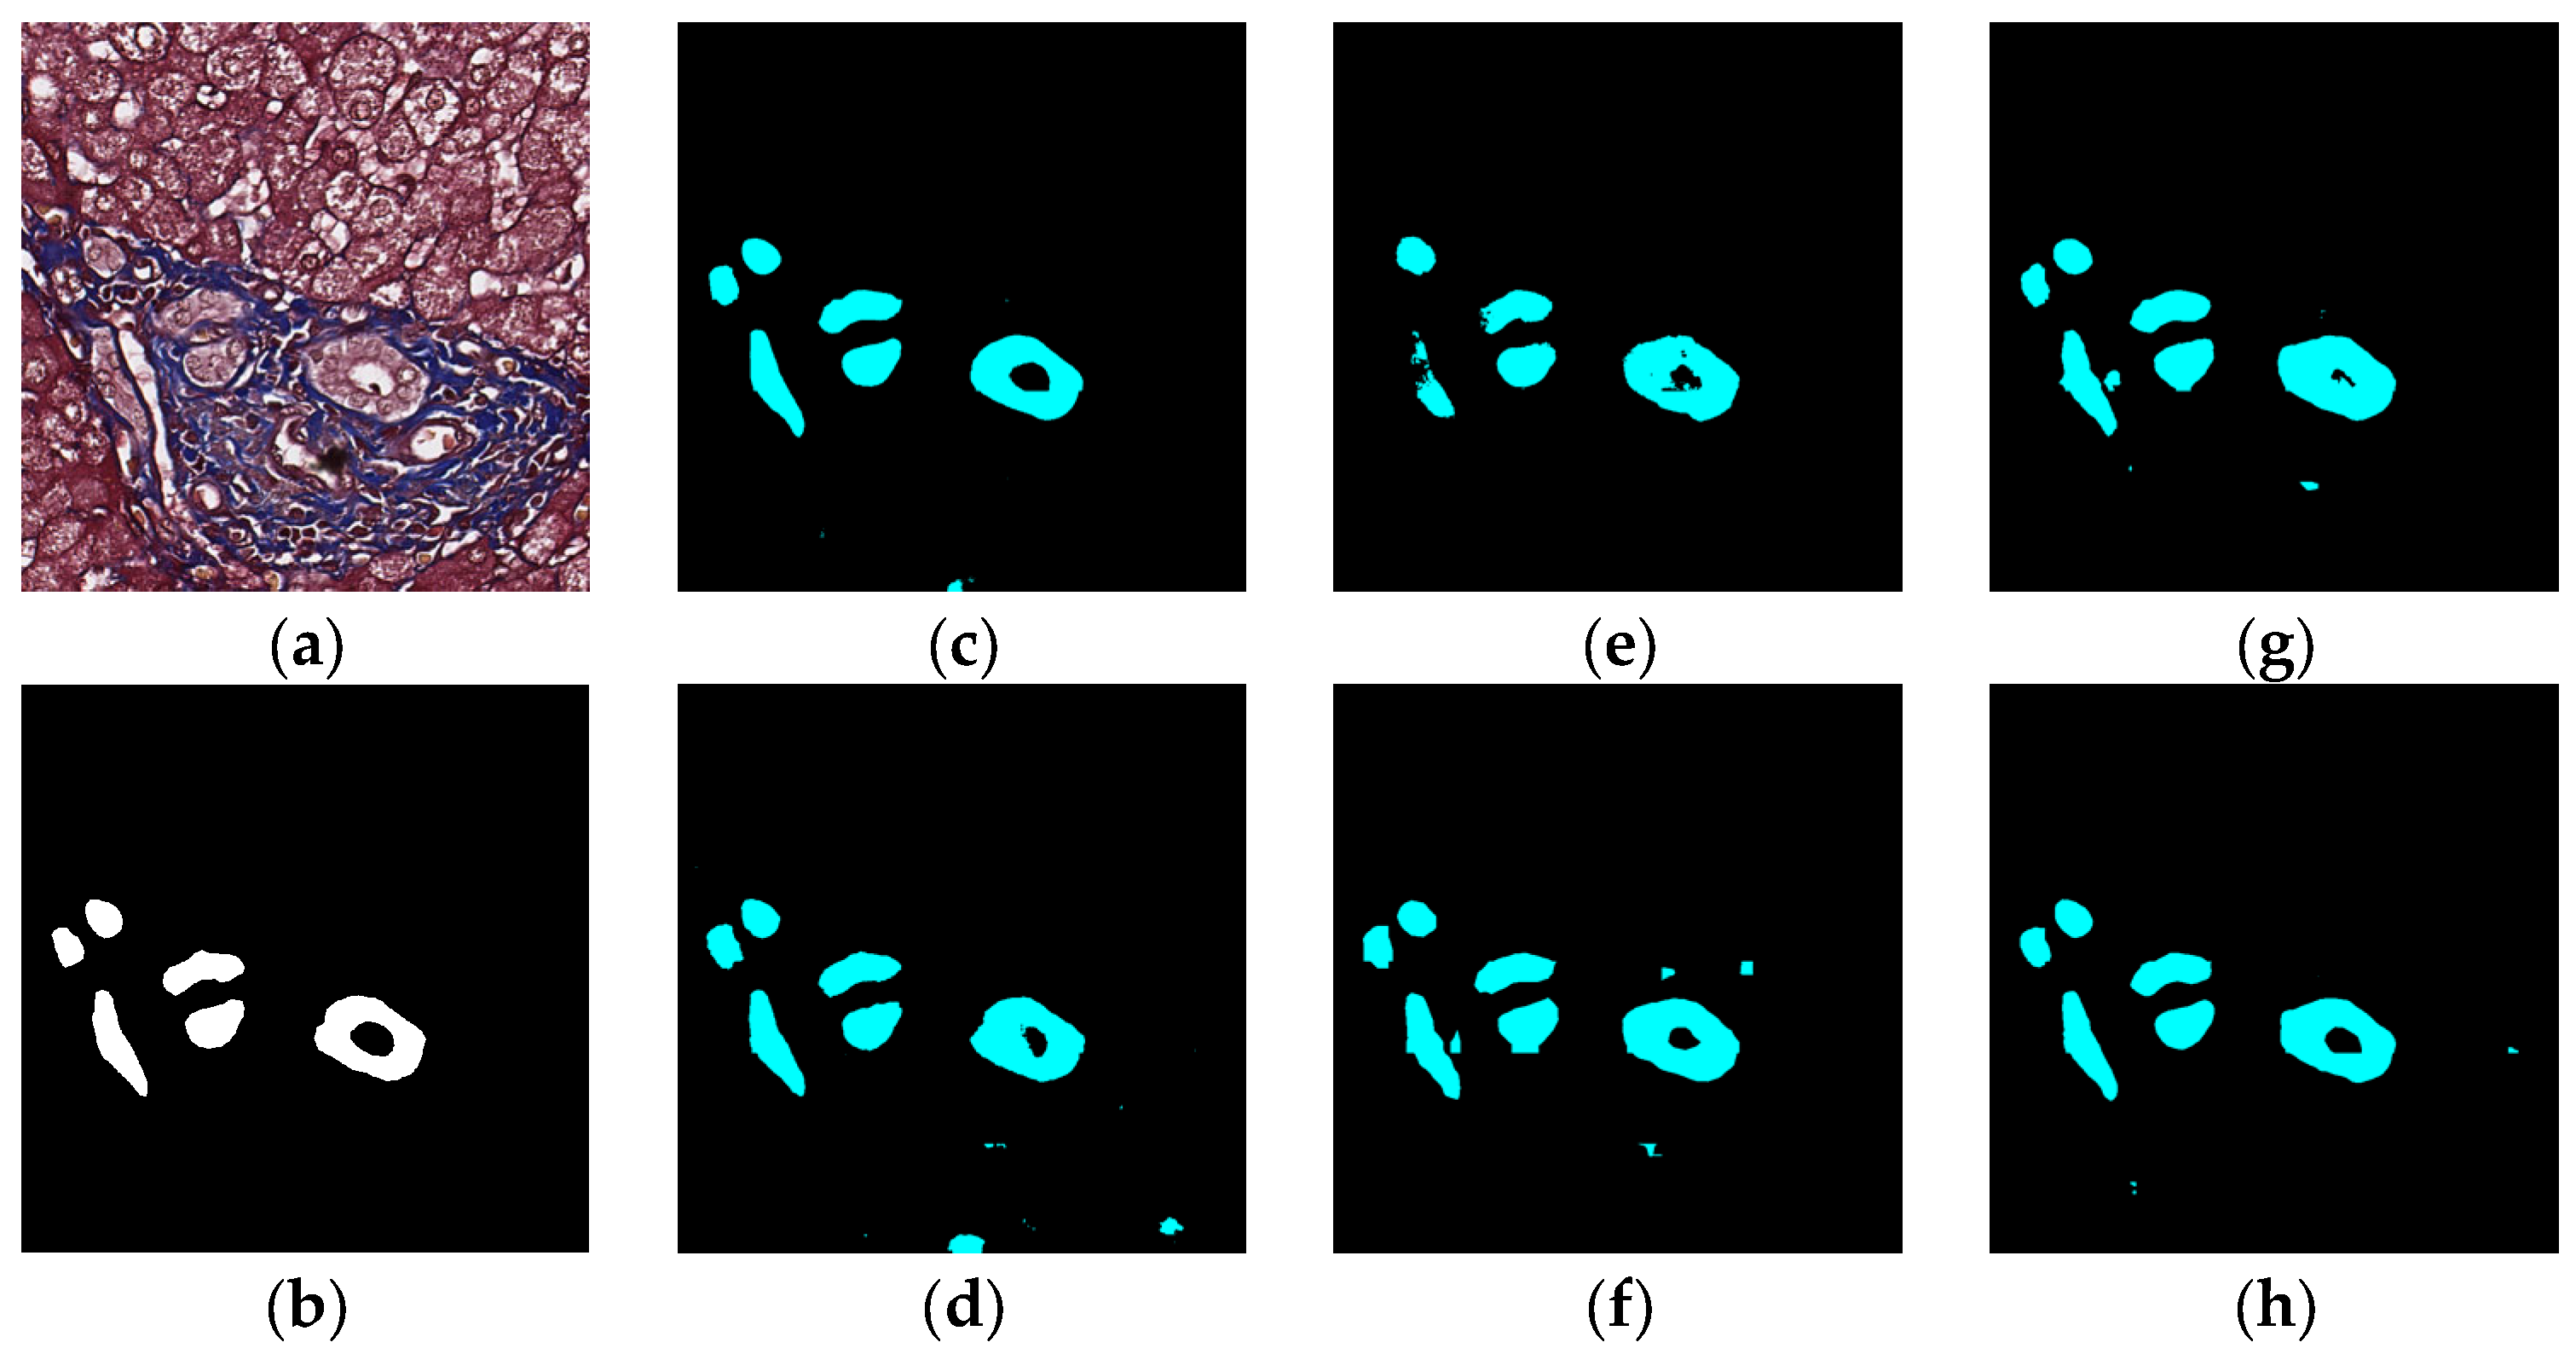
Figure 8.
Segmentation results for small bile ducts: original (a), GT (b), FCN (c), SegNet (d), U-Net (e), Deeplabv3 (f), Deeplabv3-plus (g), and the proposed network (h).
Figure 8.
Segmentation results for small bile ducts: original (a), GT (b), FCN (c), SegNet (d), U-Net (e), Deeplabv3 (f), Deeplabv3-plus (g), and the proposed network (h).
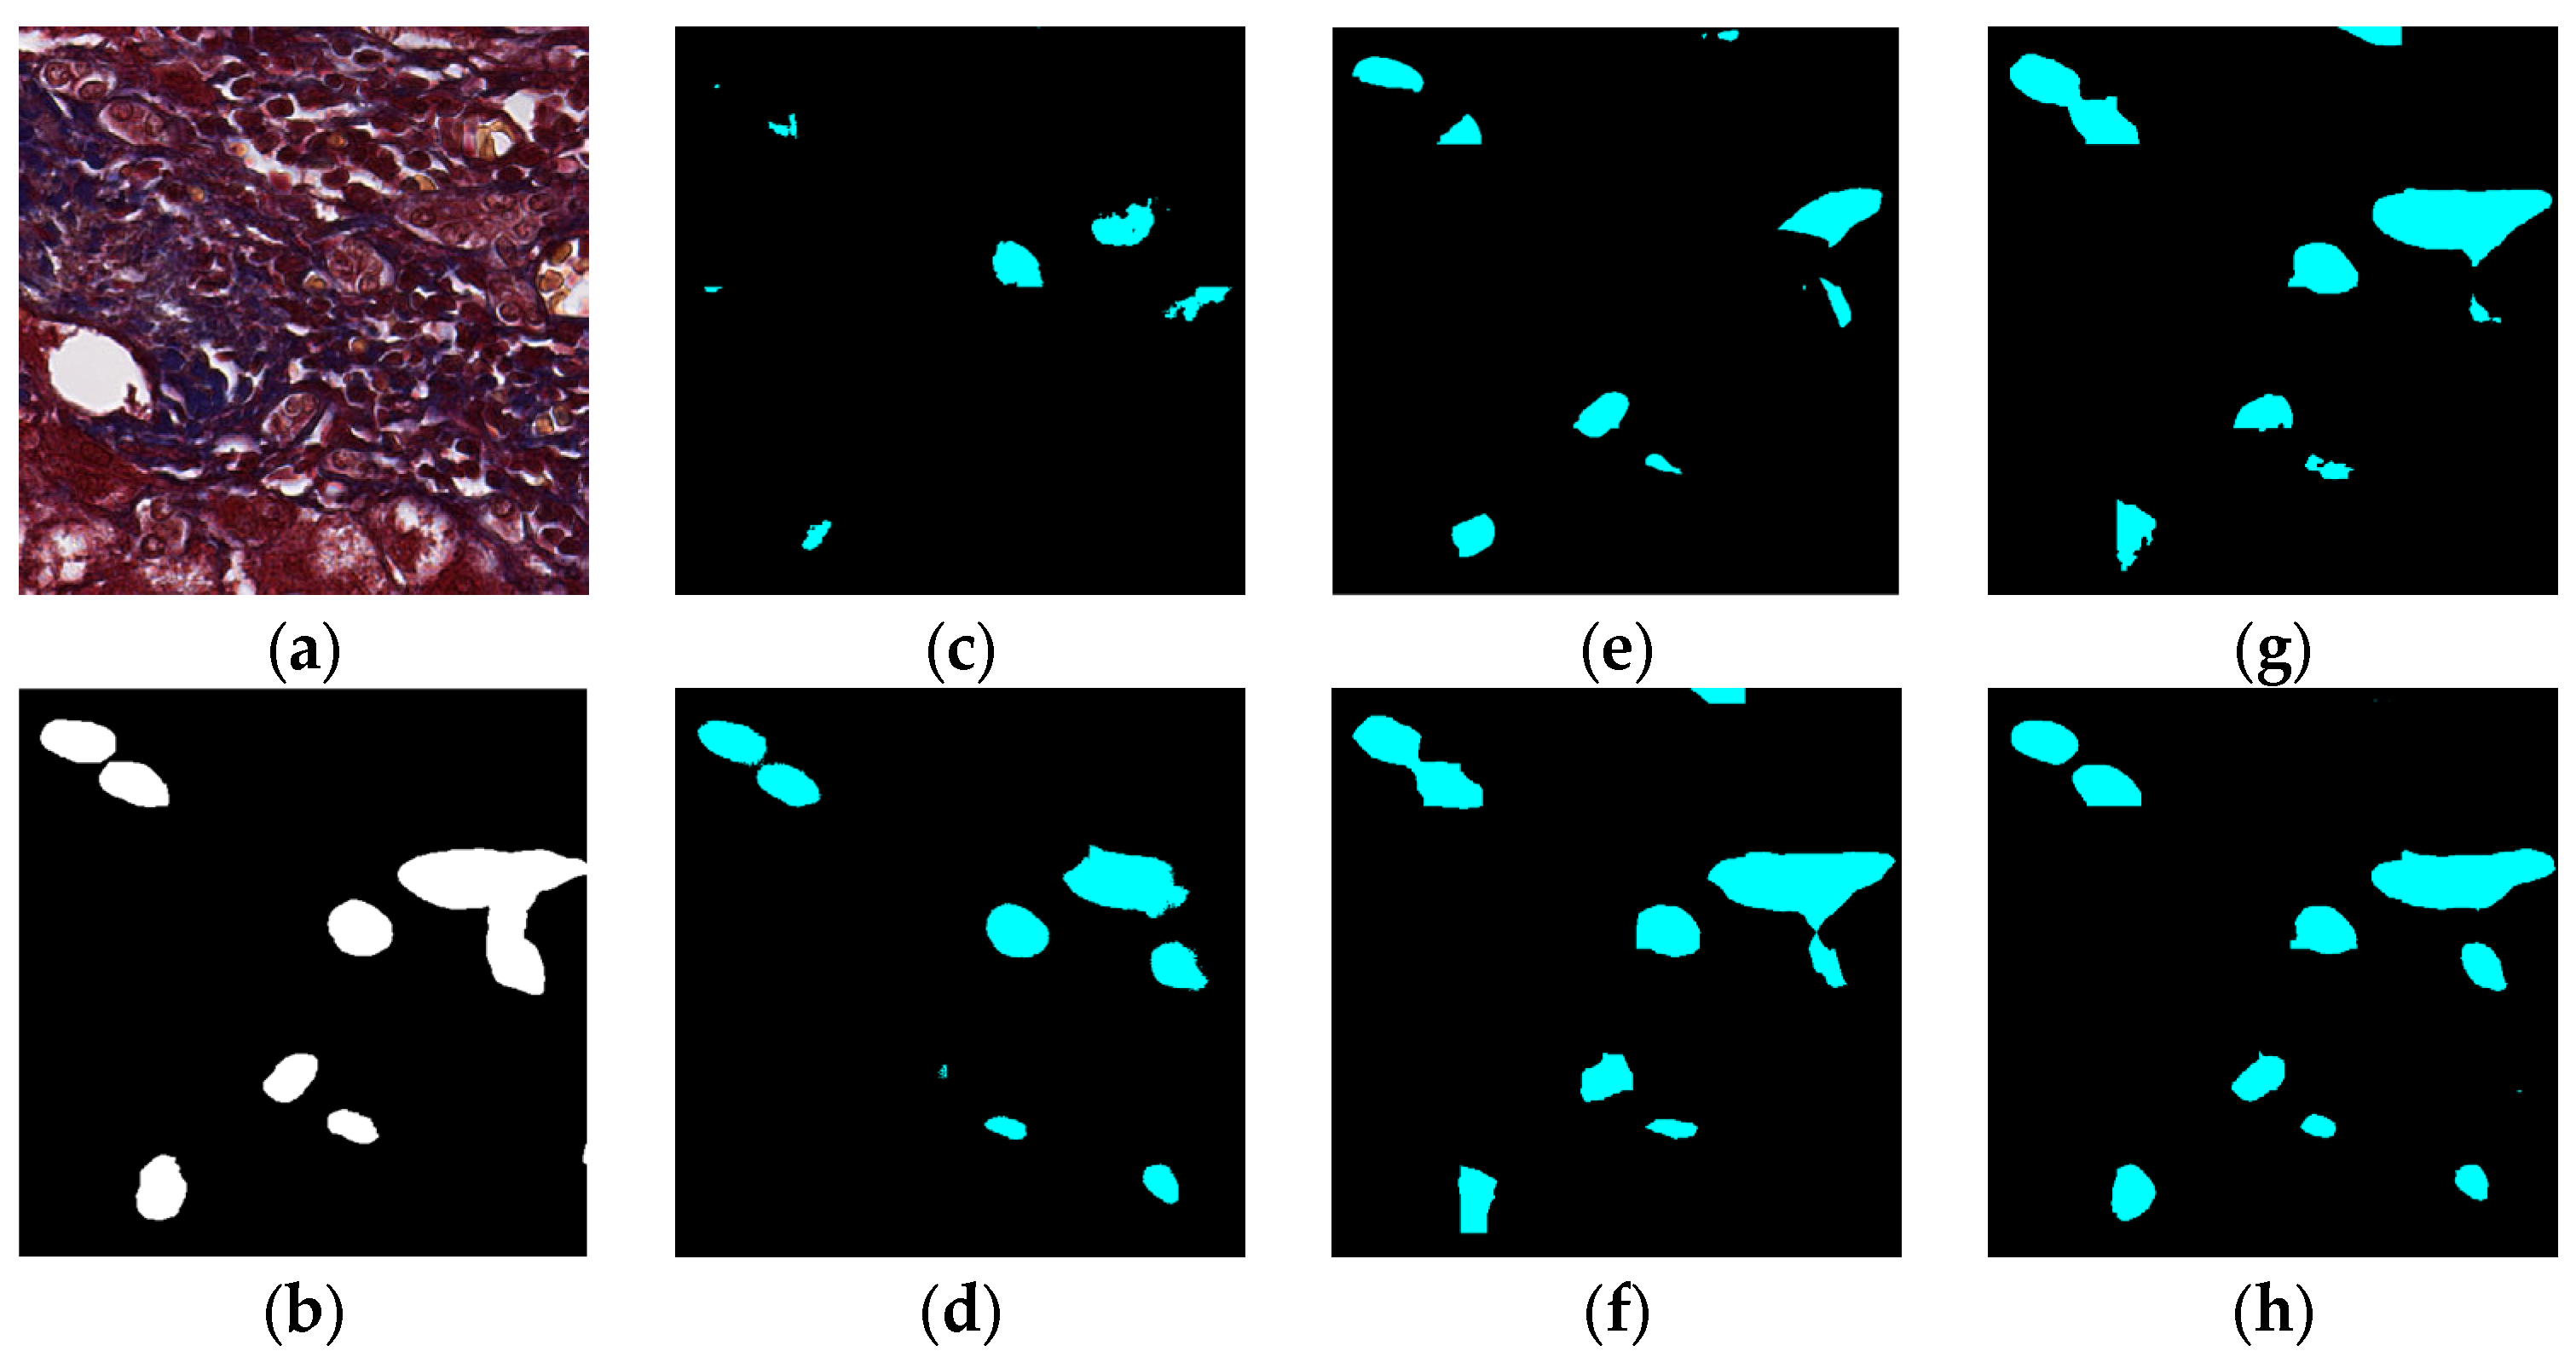
Figure 9.
Segmentation results for small ductules stained similar to hepatocyte area: original (a), GT (b), FCN (c), SegNet (d), U-Net (e), Deeplabv3 (f), Deeplabv3-plus (g), and the proposed network (h).
Figure 9.
Segmentation results for small ductules stained similar to hepatocyte area: original (a), GT (b), FCN (c), SegNet (d), U-Net (e), Deeplabv3 (f), Deeplabv3-plus (g), and the proposed network (h).
Figure 10.
Segmentation results for the case in which cells in arteries are much similar to real bile ducts: original (a), GT (b), FCN (c), SegNet (d), U-Net (e), Deeplabv3 (f), Deeplabv3-plus (g), and the proposed network (h).
Figure 10.
Segmentation results for the case in which cells in arteries are much similar to real bile ducts: original (a), GT (b), FCN (c), SegNet (d), U-Net (e), Deeplabv3 (f), Deeplabv3-plus (g), and the proposed network (h).
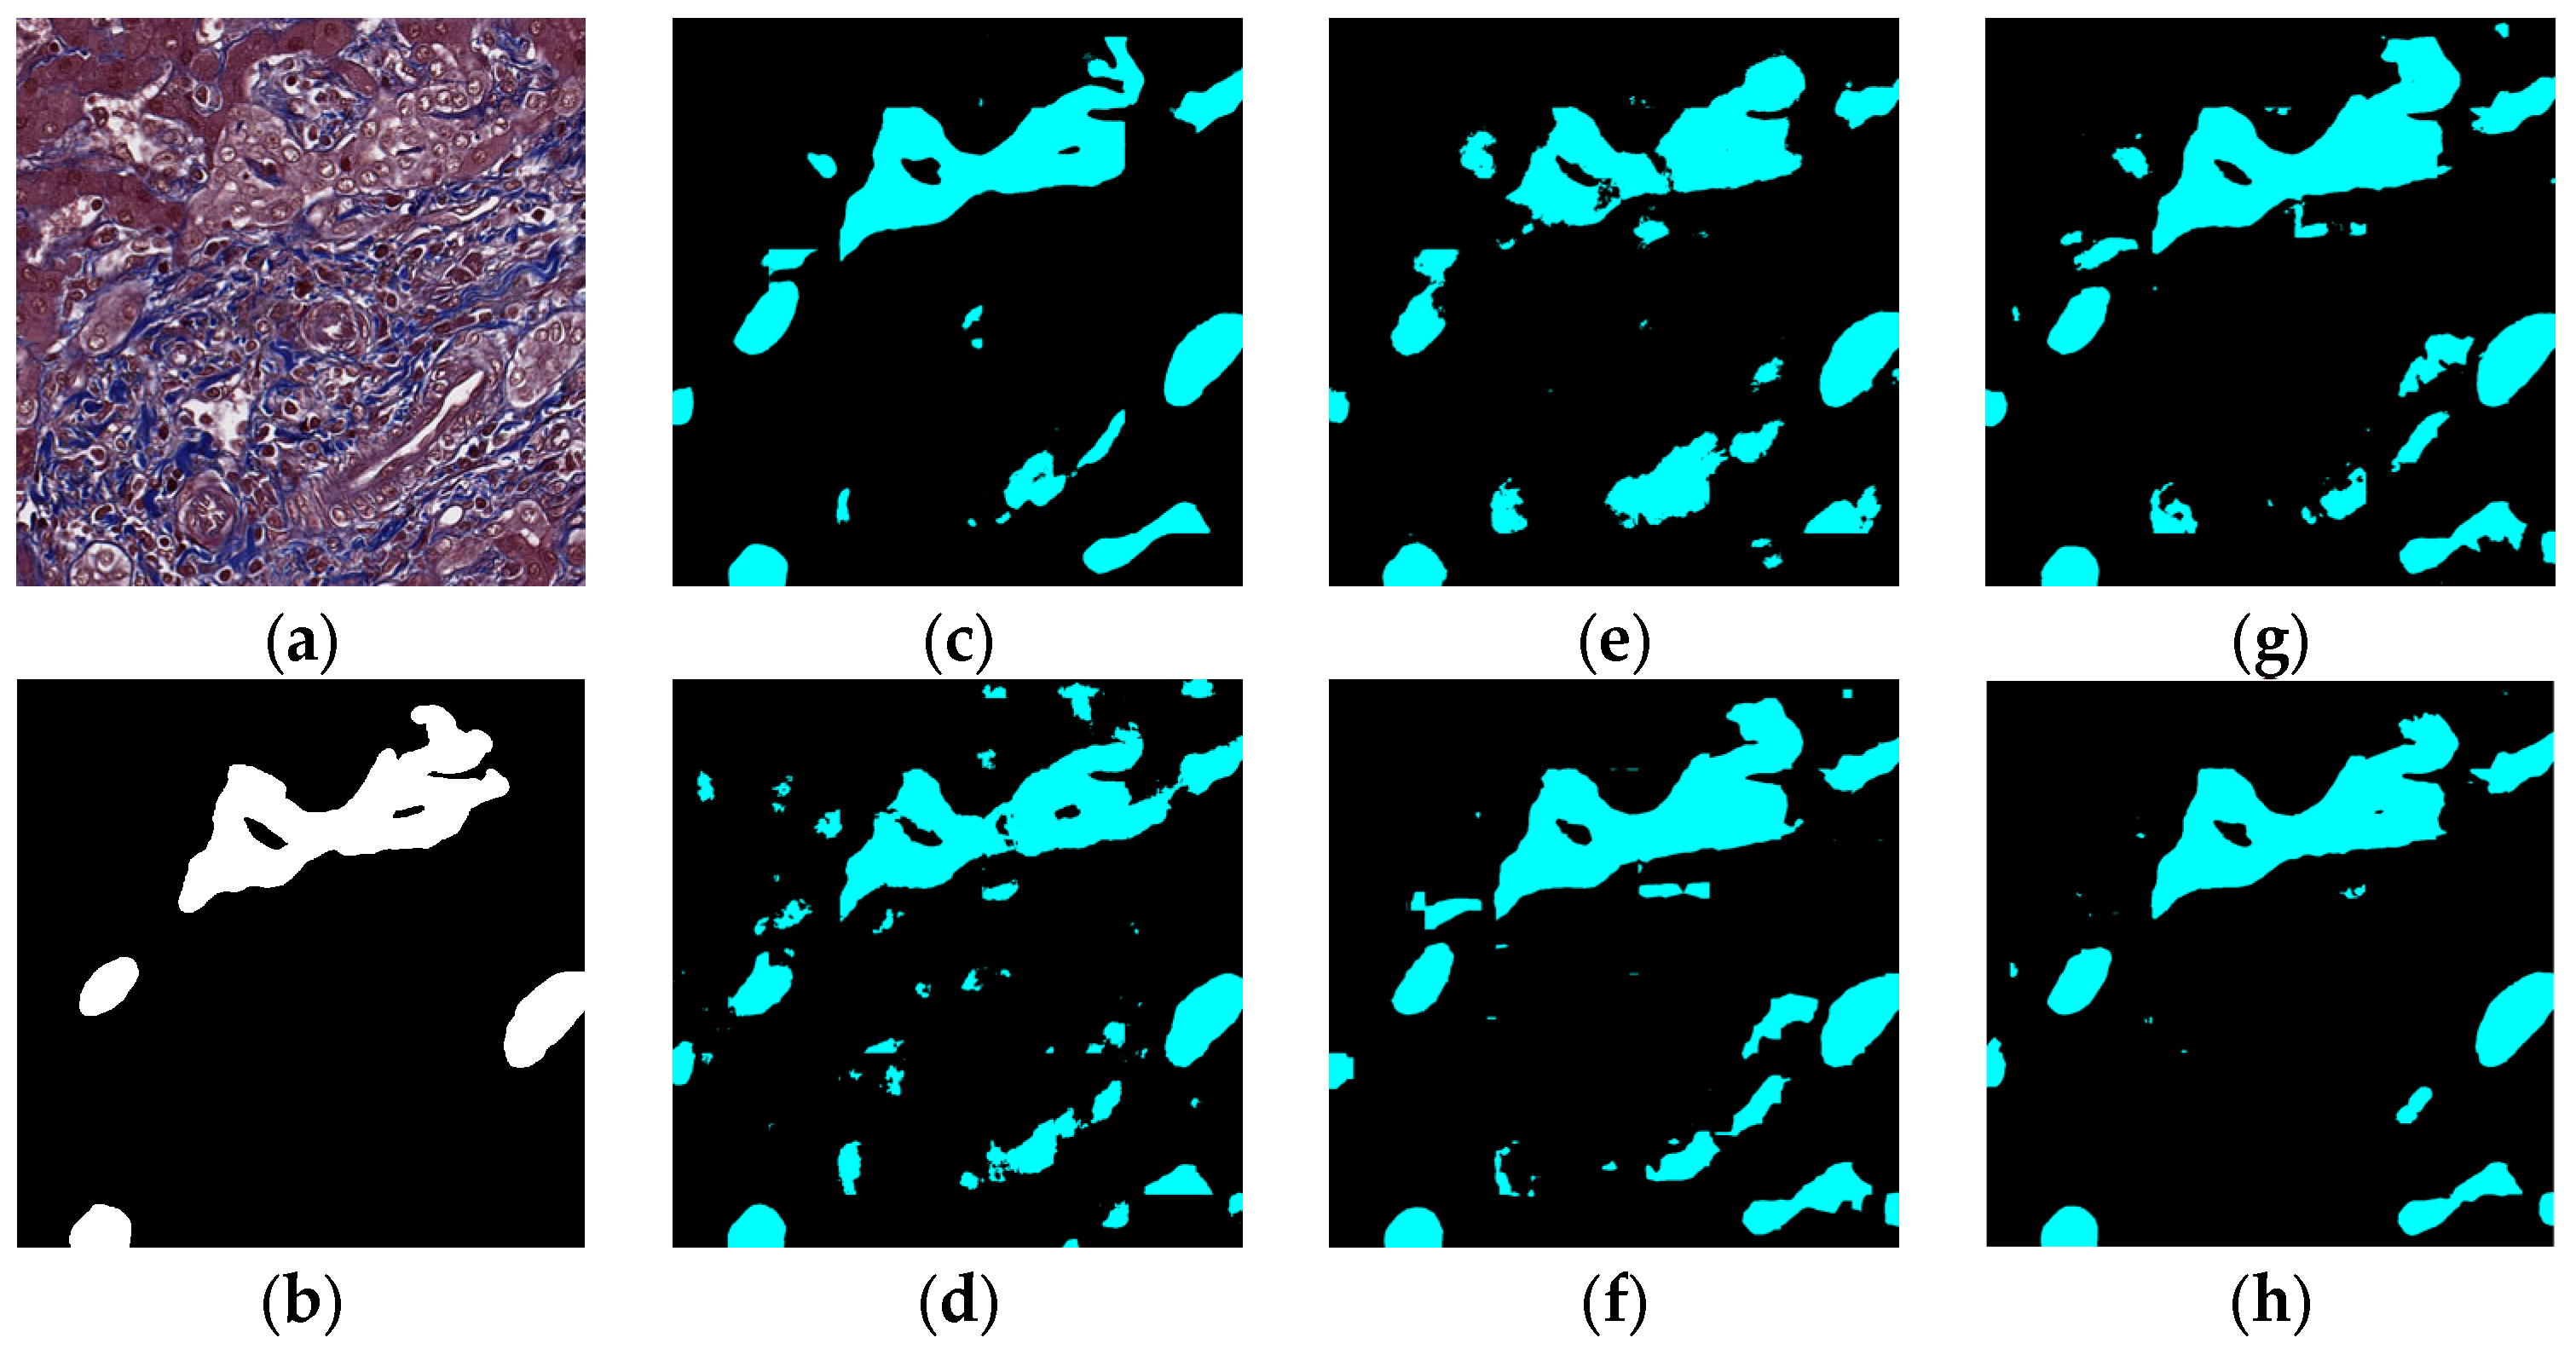
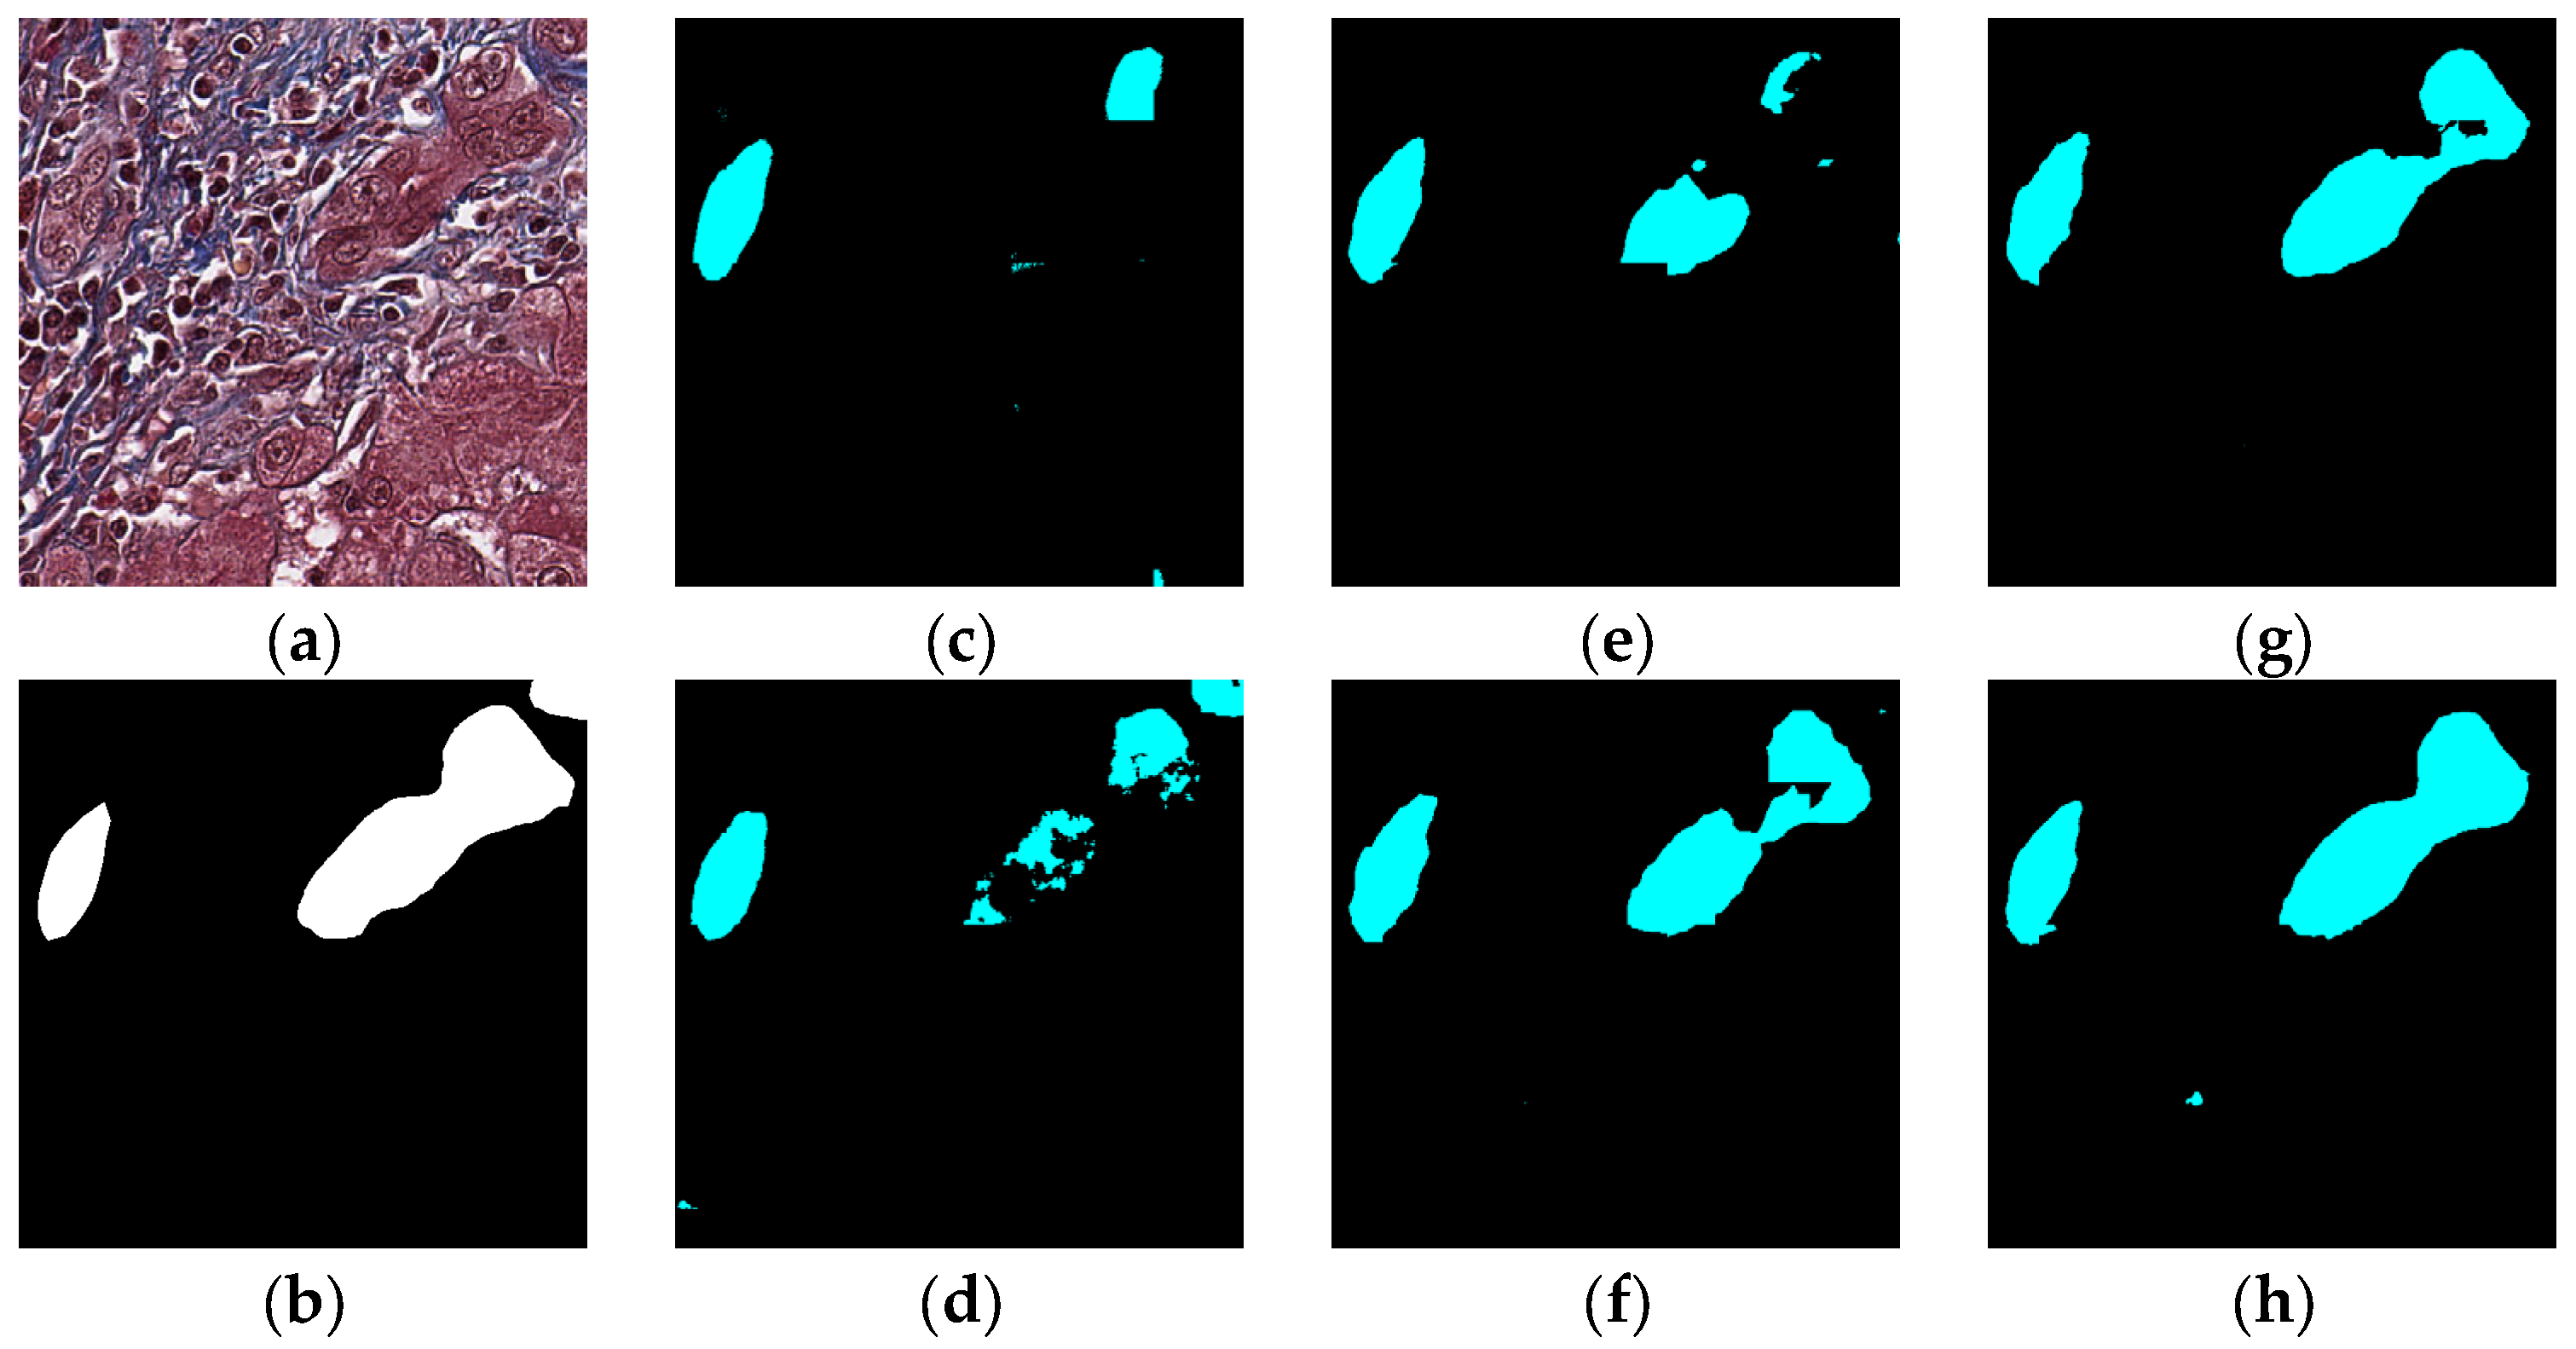
Figure 11.
Segmentation results for big bile ducts and bile ductules near hepatocyte area: original (a), GT (b), FCN (c), SegNet (d), U-Net (e), Deeplabv3 (f), Deeplabv3-plus (g), and the proposed network (h).
Figure 11.
Segmentation results for big bile ducts and bile ductules near hepatocyte area: original (a), GT (b), FCN (c), SegNet (d), U-Net (e), Deeplabv3 (f), Deeplabv3-plus (g), and the proposed network (h).
Figure 12.
Segmentation results for the case in which the bile duct is between the hepatocyte area and the classic bile ducts: original (a), GT (b), FCN (c), SegNet (d), U-Net (e), Deeplabv3 (f), Deeplabv3-plus (g), and the proposed network (h).
Figure 12.
Segmentation results for the case in which the bile duct is between the hepatocyte area and the classic bile ducts: original (a), GT (b), FCN (c), SegNet (d), U-Net (e), Deeplabv3 (f), Deeplabv3-plus (g), and the proposed network (h).
Table 1.
Ishak fibrosis staging.
Table 1.
Ishak fibrosis staging.
| Status | Score |
|---|
| No fibrosis | 0 |
| Fibrous expansion of some portal areas, with or without short fibrous septa | 1 |
| Fibrous expansion of most portal areas, with or without short fibrous septa | 2 |
| Fibrous expansion of most portal areas with occasional portal to portal (P-P) bridging | 3 |
| Fibrous expansion of portal areas with marked bridging; portal to portal (P-P) as well as portal to central (P-C) | 4 |
| Marked bridging (P-P and/or P-C) with occasional nodules (incomplete cirrhosis) | 5 |
| Cirrhosis probable or definite | 6 |
Table 2.
Comparison of related works and proposed model.
Table 2.
Comparison of related works and proposed model.
| | Comparison | Strengths | Weaknesses |
|---|
| Model | |
|---|
| FCN | fast learning and inference | segmentation performance |
| U-net | finer segmentation boundary; training with very few images | high computational resources |
| SegNet | low computational memory | high computational time |
| DeepLabv3 | augmenting ASPP for better performance | poor segmentation boundary |
| DeepLabv3-plus | finer segmentation boundary | high computational resources |
| proposed | finer segmentation boundary; high segmentation performance | high computational resources |
Table 3.
TP, FP, TN and FN performance metrics.
Table 3.
TP, FP, TN and FN performance metrics.
| | Ground Truth | Positive | Negative |
|---|
| Prediction | |
|---|
| Positive | True positive (TP) | False positive (FP) |
| Negative | False negative (FN) | True negative (TN) |
Table 4.
Performance between semantic segmentation networks.
Table 4.
Performance between semantic segmentation networks.
| | Evaluation | Precision | Recall | F1-Score | IOU |
|---|
| Model | |
|---|
| FCN [7] | 0.818 | 0.770 | 0.793 | 0.657 |
| SegNet [14] | 0.637 | 0.678 | 0.657 | 0.489 |
| U-net [13] | 0.590 | 0.723 | 0.651 | 0.482 |
| DeepLabv3 [17] | 0.769 | 0.857 | 0.810 | 0.681 |
| DeepLabv3-plus [18] | 0.775 | 0.855 | 0.813 | 0.685 |
| Proposed | 0.824 | 0.858 | 0.841 | 0.725 |
Table 5.
Performance between model with crop and without crop.
Table 5.
Performance between model with crop and without crop.
| | Evaluation | Precision | Recall | F1-Score | IOU |
|---|
| Method | |
|---|
| With crop (Proposed) | 0.824 | 0.858 | 0.841 | 0.725 |
| Without crop | 0.760 | 0.866 | 0.810 | 0.680 |
Table 6.
Performance between model with attention and with concatenation.
Table 6.
Performance between model with attention and with concatenation.
| | Evaluation | Precision | Recall | F1-Score | IOU |
|---|
| Method | |
|---|
| Attention (Proposed) | 0.824 | 0.858 | 0.841 | 0.725 |
| Concatenation | 0.772 | 0.850 | 0.809 | 0.680 |
Table 7.
Performance between model with DenseASPP and with ASPP.
Table 7.
Performance between model with DenseASPP and with ASPP.
| | Evaluation | Precision | Recall | F1-Score | IOU |
|---|
| Method | |
|---|
| DenseASPP (Proposed) | 0.824 | 0.858 | 0.841 | 0.725 |
| ASPP | 0.838 | 0.838 | 0.838 | 0.722 |
Table 8.
Performance between model with decoder and without decoder.
Table 8.
Performance between model with decoder and without decoder.
| | Evaluation | Precision | Recall | F1-Score | IOU |
|---|
| Method | |
|---|
| With decoder (Proposed) | 0.824 | 0.858 | 0.841 | 0.725 |
| Without decoder | 0.822 | 0.852 | 0.837 | 0.720 |
Table 9.
Performance of focal loss between different gamma values.
Table 9.
Performance of focal loss between different gamma values.
| | Evaluation | Precision | Recall | F1-Score | IOU |
|---|
| Method | |
|---|
| gamma=0 (Cross Entropy) | 0.806 | 0.852 | 0.829 | 0.707 |
| gamma = 1 (Proposed) | 0.824 | 0.858 | 0.841 | 0.725 |
| gamma = 2 | 0.823 | 0.840 | 0.832 | 0.712 |
| gamma = 3 | 0.807 | 0.837 | 0.822 | 0.698 |
| gamma = 4 | 0.775 | 0.839 | 0.806 | 0.675 |


