Abstract
Levodopa administration is currently the most common treatment to alleviate Parkinson’s Disease (PD) symptoms. Nevertheless, prolonged use of Levodopa leads to a wearing-off (WO) phenomenon, causing symptoms to reappear. To build a personalized treatment plan aiming to manage PD and its symptoms effectively, there is a need for a technological system able to continuously and objectively assess the WO phenomenon during daily life. In this context, this paper proposes a WO tracker able to exploit neuromuscular data acquired by a dedicated wireless sensor network to discriminate between a Levodopa benefit phase and the reappearance of symptoms. The proposed architecture has been implemented on a heterogeneous computing platform, that statistically analyzes neural and muscular features to identify the best set of features to train the classifier model. Eight models among shallow and deep learning approaches are analyzed in terms of performance, timing and complexity metrics to identify the best inference engine. Experimental results on five subjects experiencing WO, showed that, in the best case, the proposed WO tracker can achieve an accuracy of ~84%, providing the inference in less than 41 ms. It is possible by employing a simple fully-connected neural network with 1 hidden layer and 32 units.
1. Introduction
Parkinson’s disease (PD) is a progressive disorder of the nervous system, which is related to the reduction of dopamine production in brain cells. It translates to some characteristic motor symptoms such as muscle stiffness, tremors, balance, gait, speech and sleep disorders [1]. To address the PD-related dopamine reduction and relief of PD symptoms, currently, one of the most common approaches is the Levodopa (L-dopa) administration [1,2].
Nevertheless, within a few years from diagnosis, the therapeutic effect of L-dopa starts shortening. In this situation, there is a clear fluctuation between L-dopa benefits immediately after the administration (ON phase), and their disappearance (OFF phase). This phenomenon is known as Wearing Off (WO) [2].
Typically, WO starts occurring after 2 years from the diagnosis, but within 5 years about 40% of PD patients experience this phenomenon [3].
Currently, the standard for WO identification consists of an ambulatorial visit, and a report provided by the patient, by using self-rated diaries and clinical interviews [3,4]. This approach shows some shortcomings because most of the non-demented PD patients (30–50% [3]) demonstrated to be not self-aware of motor complications. Moreover, up to 25% of WO cases remain undetected [3,5].
Identifying the rising of the WO phenomenon, as well as its specific features, is crucial to allow a timely intervention in treatment by adapting it for an improvement in the quality of life.
In this context, the present paper proposes a WO tracker, which analyzes neuromuscular data, wirelessly gathered during gait, to provide an objective measurement employable as support during clinical assessment.
The proposed WO detector employs a heterogeneous computing platform, realized, and described in our previous work [6]. The platform in [6], born to assess cortico-muscular implications in PD stratification and loss of balance risk assessment, has been here exploited to identify significant features to discriminate between the ON and OFF phases of the WO phenomenon. Experimental results on five subjects experiencing WO showed that the proposed system is able to discriminate between the two WO phases with an accuracy of 83.72% by exploiting a simple dense neural network with a single hidden layer of 32 units/layer. The low complexity of the presented architecture makes the proposed model suitable for most of the embedded platforms currently available at low-cost. The system inference is ensured, in the worst case, in ~44 ms after each walking step, paving the way to real-life scenarios applicability of the proposed digital architecture.
2. Related Works
To date, several technological tools have been introduced to assess the symptoms, stratification, and neuromuscular implications of PD [7,8,9,10,11,12], and many of these technologies rely on gait and posture analysis. In this context, it is possible to find solutions that employ video system for gait monitoring as reported by Cimolin et al. in [7], which propose a non-invasive solution, based on a single camera to estimate specific features of gait patterns of PD on a reduced walking path compatible with domestic settings. The proposed platform was demonstrated to be useful in accurately investigating bradykinesia, rest tremor, rigidity, and postural instability. However, the proposed solution would require all environments involved in the patient’s daily routine activities to be equipped with a set of dedicated cameras and a gateway. Solutions that take advantage of wearable sensors are also proposed at state-of-the-art for the same purpose. One example is the system implemented by Zhang et al. in [11], which consists of a wireless gait monitoring system detecting plantar bend and impact force to assess various gait indices such as asymmetry and stride cycle length. The gait monitoring and analysis technological solutions can employ motion and physiological sensors, as per the device proposed in [12]. To this aim, gyroscopes and surface electromyography have been embedded in wearable devices that sense simultaneous movements and action potentials of antagonist leg muscles to detect Freezing of Gait (FOG) and to automatically discriminate the FOG phenotypes.
Many of the above solutions, however cutting-edge, are geared toward identifying general neuromuscular implications or symptoms related to PD. However, only a few state-of-the-art solutions [13,14,15,16,17,18] ensure the use of technologies aimed at providing real-time WO detection and objective measurement of the specific phenomenon in PD, which constitute the focus of the present paper.
A possible solution has been proposed by Victorino et al. in [13]. They propose the use of a smart band Garmin vivosmart4 fitness tracker to extract the built-in heart rate, step cadence, stress score, and a sleep classification parameter to discriminate between the ON and OFF phases of WO. However, the statistical analysis conducted on 2 PD patients led the authors to conclude that the monitored parameters are subjectively different, and, for this reason, an individual-level analysis should be conducted to develop more general classification models. Moreover, although the manuscript provides an interesting analysis of the statistical significance of the analyzed parameters by emphasizing the differences in the ON state and OFF state, it does not implement a WO detection step based on a classification model. It is, therefore, not possible to define the system’s performance metrics.
Another solution in the WO detection framework, is the one proposed by Ijima et al. in [14]. Authors in [14] focus on the periodicity of walking in patients with PD, equipped with a belt embedding an accelerometer. Acceleration time series acquired during walking are analyzed through a Long Short-Term Memory (LSTM) network, that extracts the error between the current series and the ON state one. The model calculates the Mahalanobis distance between them to examine anomalies. Anomalies in this distance can be used to identify the WO. Although the authors propose a new set of features with prospective potential, they do not evaluate the actual impact on a classification system. Objective metrics about the detection of the WO phenomenon cannot be extracted from [14]. Another solution in the real-time WO detection context is provided by Pierce et al. [15]. Patients have been equipped with a smartphone attached to the right side of the pelvis using a common smartphone belt pouch. Triaxial accelerometer and gyroscope data from the smartphone are used to identify dysfunctional gait patterns. The extracted features have been employed to train generalized linear models with regularization (RGLM), neural networks (NN), and random forest (RF) classification models. Across all subjects, RGLM, NN and RF achieved accuracies of 72.4%, 80.2% and 86.8% respectively [15].
Moreover, medical fluctuations due to L-dopa have been also investigated by [16]. The authors acquired gyroscope data via two wearable inertial measurement units (IMU). Gathered time series are then analyzed offline via Matlab® to extract 40 segment-based features and 22 time-frequency domain ones. The system demonstrated to be able in discriminating between ON and OFF states with an accuracy of 83.56% in the best case (Hierarchical features). Despite the proposed approach providing an interesting overview of several feature extraction methods, the main drawback of the proposed solution lies in the high computation load of this stage, which forced the authors in operating offline via Matlab®.
Two IMUs mounted on the insteps of patients’ feet have been also employed by Moradi et al. in [17] to detect the WO phenomenon. Each IMU, embedding a 3D-accelerometers and a 3D-gyroscopes, has been used to evaluate three temporal and eight spatial features from each stride on both feet. A Support Vector Machine (SVM) and an RF model have been extracted to test the feature set. RF returns the best performance by achieving the 77% of accuracy.
Kilinçalp et al. in [18] analyzed the need to obtain objective measures for the WO phenomenon detection and the management of L-dopa intestinal gel infusion. Specifically, the analysis concerns the use of a device widely employed in clinical practice, the Parkinson’s KinetiGraph (PKG by Global Kinetics CorporationTM, Australia) [9,12,19,20]. PKG consists of a smartwatch that monitors motions during activities of daily living. At the end of the recording period, data are uploaded to a computer for offline processing. The PKG provides scores for dyskinesia and bradykinesia to identify WO-related motor fluctuations, immobility, and tremor. The authors’ experience with using the PKG suggests that motor fluctuations are detected roughly in 50–60% of cases.
Despite its use for WO assessment in the clinical framework, as demonstrated by [3], PKG operates offline after long periods of recording. It excludes the possibility of operating dynamic change in L-dopa treatments in the dependence of a real-time analysis. Moreover, it is a smartwatch and, thus, as wrist-worn device, PKG is not oriented to identify WO-related, leg symptoms.
As previously stated, the here proposed WO detector employs a heterogeneous computing platform, implemented, and described in our previous work [6]. The developed device analyzes neuromuscular implications of PD patients in real-life scenarios, providing real-time computation in the context of PD stratification and loss of balance risk assessment by leveraging the synchronous analysis of cortical signals and EMG ones.
This paper aims to characterize an innovative set of neuromuscular features in a way that expands the potential of a device already employed in the analyses.
The breakthrough points of the proposed overall system relate to (i) the possibility of having a single device capable of monitoring various symptoms and detecting, in real-time, L-dopa-related motor fluctuations; (ii) the ability to monitor symptom asymmetry by assessing both limbs and not a single side as is the case of PKG; and (iii) providing details about the cognitive processes of movement programming and muscle status of the lower limbs in clinical support, simultaneous with detection.
3. Overall Architecture
A simplified overview of the here proposed system is shown in Figure 1. The employed platform consists of two main blocks: (i) a sensing and (ii) a computation system.
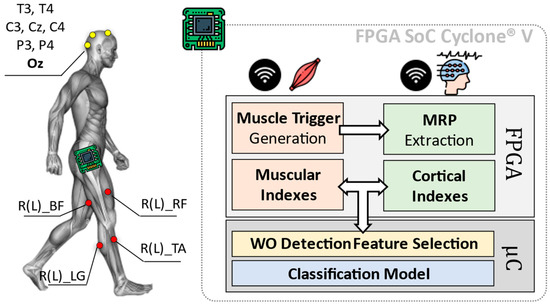
Figure 1.
Overall architecture of the Wearing Off (WO) detector, considering an implementation of the heterogeneous computing platform by [6]. The here-proposed approach implements on a Field Programmable Gate Array (FPGA) the feature extraction phase concerning the diagnostic indexes from muscles and brain, via Movement Related Potentials (MRP) as in [6]. The classification phase is instead entrusted to the device microcontroller (μC).
The first block (i.e., sensing system) consists of a wireless sensor network including electroencephalographic (EEG) signals and surface EMG.
While the computation system is in charge of analyzing EEG and EMG data from involved sensors, to extract useful cortical and muscular indexes. These indexes are subjected to a statistic-based feature selection step, which is optimized for the identification of the WO phenomenon (WO Detection Feature Selection in Figure 1). Resulting features are, thus, used to train a classification model designed to discriminate between the ON and OFF phases of the L-dopa treatment.
3.1. Sensing System
Eight cortical sites from a 32-channels wireless EEG headset (g.Nautilus Research by g.Tec medical engineering GmBH, Austria) have been monitored: T3, C3, Cz, C4, T4, P3, P4 (10–20 system notation). Oz, AFz and A2 are used for noise reduction, as reference and ground, respectively.
Muscular signals are gathered through eight wireless nodes distributed all over the lower limbs (MiniWave by Cometa System, Italy). Sensors are placed bilaterally (four per leg) on Lateral Gastrocnemius (R(L)_LG in Figure 1), Tibialis Anterior (R(L)_TA in Figure 1), Bicep Femoris (R(L)_BF in Figure 1) and Rectus Femoris (R(L)_RF in Figure 1). EEG and EMG data have been acquired at a sampling frequency fs = 500 Hz with 24 bits and 16 bits of resolution, respectively.
Gathered data are sent via Bluetooth to the computation system, which is realized via the platform proposed in [6] and based on the FPGA SoC Cyclone® V architecture by Intel (FPGA Cyclone® V + ARM Cortex-A9 Dual-core).
3.2. Muscular and Cortical Indexes Extraction
The computation system is in charge of analyzing EEG and EMG data, extracting some useful cortical and muscular indexes that can be successfully used to characterize gait, PD stratification and losses of balance according to [6].
The indexes extraction runs on the FPGA and consists of two parallel processing branches. The EMG branch works in two steps: (i) Muscle Trigger Generation and (ii) Muscular Indexes extraction. During the first step (i.e., Muscle Trigger Generation), a dynamic threshold approach is used to convert the 16-bits EMG signals into 1-bit equivalent ones. The resulting binary signals (triggers in the following) are 0 when the related muscles are relaxed, while become 1 when they are contracted. More details about the dynamic thresholding method and its FPGA implementation are available at [6,14].
The binary representation of the muscular signals permits the computation of the following muscular indexes:
- Stride time. The time between two-foot plant strikes (Initial Simple Support in Stance Phase) of the same leg. The parameter is expressed in milliseconds (resolution 2 ms).
- Contraction and Relaxation times. Contraction/relaxation duration in milliseconds (resolution 2 ms). Data are extracted at the end of the stride to complete a gait cycle.
- Duty cycle (DC). The ratio between single muscle contraction time and stride time.
- Co-contraction time. Time of parallel contraction of agonist and antagonist muscle (resolution 2 ms).
The EEG branch is normally “inactive” and operates as a First-In-First-Out (FIFO) buffer, collecting the last ~500 ms of EEG data (256 samples @ 500 Hz). Once one of the lateral Gastrocnemii contracts (Initial Simple Support in Stance Phase), leading the related trigger to 1, the EEG branch activates the computation. It consists of the extraction of some indexes related to Movement-related Potentials (MRPs).
Roughly, MRPs are cortical potentials actively involved in the cerebral preparation of voluntary movements. Typically, they are detectable within specific frequency bands starting from 1 s before the movement actuation.
According to related experimental studies [21,22,23,24] and the platform settings [6], three MRPs have been assessed:
- Bereitschafts potential (BP). It presents as a positive component that peaks at 100–200 ms before the onset of movement. It is assessed in the frequency band ranges between 2 and 5 Hz.
- μ-rhythm. Detectable in a frequency band between 9 and 11 Hz and 400–500 ms before performing a motor action. The μ-rhythm suppresses when movement onset occurs.
- β-rhythm. This rhythm reveals in the frequency range of 12–30 Hz.
The cortical features are extracted by means of a Short-Term Fourier Transform (STFT) approach and extracting the maximum spectral content in the bands of interest. More details about the STFT and MRPs extraction FPGA implementation are available at [6].
3.3. Statistical Significance–Based Feature Selection
Measurement Sessions and Protocol. The above-described muscular and cortical features have been collected from three out of five randomly selected subjects, which are involved in the measurement sessions. This subset of subjects is identified as Training Set in Section 4.1, while data from the two not selected ones are used to realizing the Testing Set.
All involved subjects underwent two measurement sessions. Each measurement session consists of a standardized clinical protocol from the unified PD rating scale (UPDRS) guidelines [25], which is easily transferrable to daily-life scenarios: the 10-m walk. The test consists of asking subjects to walk for a distance of 10 m, adopting a comfortable walking speed.
Statistical Sample Extraction. One measurement session is carried out ~30 min before the planned L-dopa administration (>4h from the last administration), during a recognized OFF phase. In the following, we will refer to this session as Pre L-dopa. The second measurements session is carried out ~1 h after the planned administration, during a recognized ON phase. Similarly, in the following, we will refer to this session as Post L-dopa.
The two samples Pre and Post L-dopa are analyzed via paired sample t-test to identify the statistical significance of the involved features (α = 0.05).
Table 1 reports the mean values of both populations considering all the subjects in the Training Set and the related p-values.

Table 1.
Statistical significance analysis for extracted cortico-muscular features.
Paired t-test on data from different subjects showed that the most significant features, in a generalized WO detection context, are all and only the muscular ones. No relevant variations have been recorded in cortical features.
For this reason, only the EMG branch can be kept active for the specific application, with a subsequent reduction in the power consumption of the device. Figure 2 shows a bar plot (with error bars) concerning the selected muscular features.
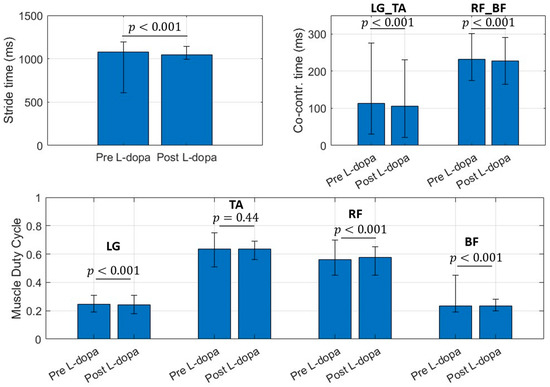
Figure 2.
Bar chart for selected muscular features. Bar values identify the mean value for the considered parameter. Error bar limits represent the 95th percentile (upper bound) and 5th percentile (lower bound). LG_TA is the co-contraction time (ms) between Lateral Gatrocnemius (LG) and Tibialis Anterior (TA), RF_BF identifies the co-contraction time (ms) between Rectus Femoris (RF) and Bicep Femoris (BF) regardless the involved side.
3.4. Classification Model
Starting from the selected muscular features, eight types of classifiers have been offline trained and employed for onboard inference via the dedicated microcontroller.
Specifically, four both shallow learning approaches and neural networks compatible with the μC resources have been analyzed. Table 2 reports the analyzed classification model.
Table 2.
Analyzed Classification Models.
The first four models proposed in Table 2 were trained via MATLAB® 2021b and coded via a dedicated library in C language.
The best neural network (NN) models have been identified by KerasTuner [26], trained via Keras with Tensorflow backend, and C-coded exploiting X-CUBE.AI by STMicroelectronics. The tuning ranges/values of the NN parameters set in KerasTuner are reported in the following:
- Tuner: Hyperband [27]
- NN Type: Fully Connected Neural Network
- Number of Layers (excluding the output): 1–3
- Number of units/layer: 8, 16, 32, 64 (pow of 2 for parallel optimization)
- Activation function: Rectified Linear Unit (ReLU), Scaled Exponential Linear (SeLU), Tanh
- Objective: Average Validation Loss (k-fold Validation with k = 4) → Loss function: Binary Crossentropy
- Compilation setting—Optimizer: Nadam [28], RMSProp
The four NN models extracted via KerasTuner have been considered for the microcontroller implementation and reported in Table 2.
The optimization ranges of parameters for both shallow and deep learning approaches consider design constraints on the resources of the target microcontroller.
4. Results
4.1. Datasets
Data used for the following computations refer to the measurement sessions carried out in the context of our previous works [6,29]. Overall, five subjects (Mean Age: 71.4, M:F = 5:0) were enrolled for the study. Three of them were classified as mild PD (3rd Hoen and Yahr stage), and n = 2 subjects were classified as severe PD (4th stage of Hoen and Yahr stage). The patients were characterized in this way by specialized medical staff who supervised the standard protocol. The patients received a PD diagnosis 9–11 years before the measurement sessions. They started L-dopa treatment contextually [28]. Data from three out of the five involved subjects have been used to realize the Training Set, while data from the remaining two subjects constituted the Testing Set.
As previously stated, the measurement session consists of a standardized clinical protocol from UPDRS guidelines [17]: the 10-m walk. The protocol is carried out as prescribed by UPDRS III by the sections: III.10 March, III.14 Bradykinesia, and in UPDRS-IV as IV.1 Dyskinesia time, IV.3 Motor Fluctuations. The protocol is repeated eight times collecting 150 steps per run for a total of 1200 steps per session. The steps carried out to curve the trajectories are excluded from further computation.
A detailed description of the employed datasets is reported in Table 3.
Table 3.
Training and Test Datasets description and distribution.
4.2. WO Tracker Performance
The eight classifiers, reported in Table 2, were offline trained and validated according to the procedures explained in Section 3.4. The extracted models have been instantiated on the microcontroller and tabular data from Testing Set have been streamed to the proposed system for testing purposes.
4.2.1. Population Distribution
Figure 3 shows the input distribution of every feature composing the Testing Set with respect to the Training Set one.
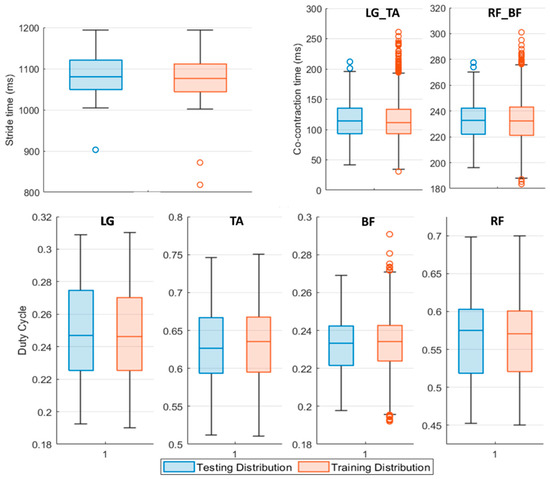
Figure 3.
Boxplot representation of the Testing (blue boxplot) and Training (red boxplot) Set features distribution. The middle line of the boxplot represents the median value of the distribution, upper and lower boundaries of the boxplot are respectively the 75th and the 25th percentile of the considered sample. The upper and lower limits of the bar are the maximum and minimum adjacent, while the circles denote outliers. LG_TA identifies the co-contraction time (ms) between Lateral Gatrocnemius (LG) and Tibialis Anterior (TA), similarly, RF_BF concerns Rectus Femoris (RF) and Bicep Femoris (BF) muscles regardless of the involved side.
Data reported in Figure 3 refer to the features population for Pre L-dopa measurement sessions. The 25th and 75th percentile of the testing population distribution fall within the same boundaries of the dataset used to train the classifiers, except for the LG and RF duty cycle values. On average, subjects in the Pre L-dopa session show a stride time of 1092 ± 72.01 ms, and a Co-contraction time on LG-TA and RF-BF of 113.5 ± 32.12 ms and 232.5 ± 50.04 ms, respectively. The duty cycle on LG is 24.81 ± 3.7 %, on TA 56.33 ± 5.44 %, on RF 63.48 ± 5.49 %, and 23.32 ± 2.42 % on BF. During the Post L-dopa session, stride time decreased to 1044 ± 34.49 ms, and co-contraction times on LG-TA and RF-BF also reduced to 96.2 ± 29.19 ms and 202.14 ± 17 ms, respectively.
4.2.2. Performance Metrics
A test session per each analyzed classifier in Table 2 has been carried out. For every model, a confusion matrix, the Receiver operating characteristic (ROC) curve, the Area Under Curve (AUC) and four standard metrics derived according to Equations (1)–(4) are extracted:
where is the true positive parameter, is the true negative, is the false positive, is the false negative, considering the Pre L-dopa as the positive class.
Figure 4 shows the confusion matrix and ROC curve for Tree, QD, SVM and KNN model classifiers considering the Testing Set. Figure 5 is, instead, dedicated to the dense NNs (DNN#) whose characteristics are proposed in Table 2. Table 4 summarizes the performance metrics for each implemented classifier. The category of classifiers that overcome the threshold of 80% for all the considered metrics is the DNN. Proposed DNNs also ensure a limited complexity in implementation and minimum resource consumption. Tree classifier also performs well, overcoming 92% in Precision metric by exploiting 129 threshold comparisons. Due to the tradeoff between implementation easiness (low memory and resources consumption) and achieved performance, DNNs are considered the best choice for embedded systems applications, and will be considered for further analysis. Tree classifier also performs well, overcoming 92% in Precision metric by exploiting 129 threshold comparisons.
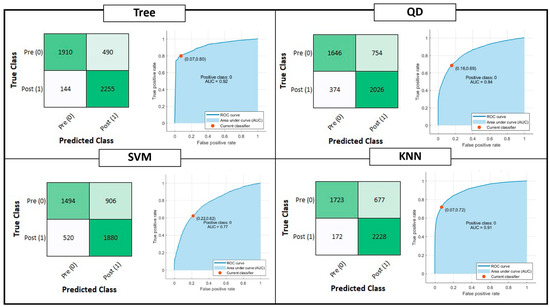
Figure 4.
Shallow Learning Classification model performances: Confusion matrix, Receiver Operating Characteristic (ROC) curves and Area Under Curve (AUC) parameter. The positive class selected for the reported computation is the OFF phenomenon of Wearing Off (WO). The red dot on the ROC denotes the selected and analyzed classifier, minimizing the distance among the True Positive Rate (TPR) and False Positive Rate (FPR) values of the ROC curve and {FPR, TPR} = {0,1}.
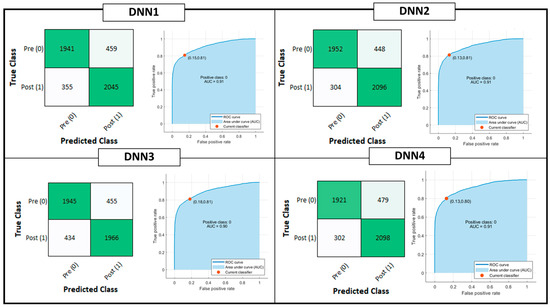
Figure 5.
Deep Learning Classification model performances: Confusion matrix, Receiver Operating Characteristic (ROC) curves and Area Under Curve (AUC) parameter. The positive class selected for the reported computation is the OFF phenomenon of Wearing Off (WO). The red dot on the ROC denotes the selected and analyzed classifier, minimizing the distance among the True Positive Rate (TPR) and False Positive Rate (FPR) values of the ROC curve and {FPR, TPR} = {0,1}.
Table 4.
Performance metrics for implemented classification models.
Due to the tradeoff between implementation easiness (low memory and resources consumption) and achieved performance, DNNs are considered the best choice for embedding classification steps on the heterogeneous computing device microcontroller. Indeed, the NN considering the highest number of parameters is DNN#1 with only 3 hidden layers with 32 units per layer. For this reason, only DNNs are considered for further analysis.
Table 5 summarizes a comparison of the proposed system with the state-of-the-art solutions analyzed in Section 2, in terms of classification performance. Technological proposals for WO detection outlined in [13,14] have been excluded during the comparison, because they do not implement a classification step for the proposed features. Moreover, no details about the number of units per each of the 15 hidden layers composing the NN are provided in [15]. On average, the proposed solution performance is found to be perfectly in line with those related to the state of the art.
Table 5.
Performance metrics: State-of-the-Art Comparison.
However, it should be pointed out that, although the results are interesting and promising, the metrics are not directly comparable. In fact, the system proposed in this paper provides a generalized classification model (based on data collection from 3 subjects and tested on 2 different subjects), rather than a subjective one. The use of a generalized model rather than a user-tailored approach leads to an underestimation of the performance of the proposed system, which remains competitive, allowing its wider application with a reduction of relative training time.
4.3. WO Tracker Timing
The here proposed system, supplied with the DNN4 has been tested in terms of prediction timing. In this frame, the FPGA-implemented EMG trigger extraction block requires 40 ms to activate the trigger starting from the actual contraction [6], leading to a static delay in index assessment. When the stride is formally completed, the Muscular indexes block is enabled. It requires 0.2 ms to extract and pass features from programmable logic (FPGA) to the processing system (microcontroller) that implements the classifier. Once the features are available at DNN1, it needs 2.8 ms (@ 8 MHz clock) to complete inference, resulting in a total timing of about 43 ms after the completion of the step. If DNN2 is employed the inference time results to be 1.57 ms (41.8 ms total). With DNN3 and DNN4 inference times are 3.12 ms (43.32 ms total) and ~350 μs (40.55 ms total), respectively.
4.4. WO Tracker Complexity
In this section, the proposed NNs are analyzed in terms of implementation complexity, by extracting three main metrics: RAM, ROM/Flash, Multiply and ACCumulate (MACC). RAM indicates the size (in bytes) of the expected R/W memory used to store the intermediate inference computing values and the dedicated library, ROM/Flash indicates the size of the generated read-only memory to store weight and bias parameters, while MACC operations define the functional complexity of the imported NN. Table 6 summarizes the implementation complexity metrics for implemented DNNs.
Table 6.
Implementation complexity metrics for implemented DNNs.
Considering the complexity, accuracy and timing parameters, the best choice seems to be DNN4. It allows, on average, to speed up the inference system of a factor 7, reducing the flash occupancy of the 7.6 factor, without affecting accuracy on Testing Set (−0.61% w.r.t. DNN2).
4.5. WO Tracker Power Consumption
In terms of power consumption, the proposed system must be divided into two subsystems: the sensors set and the computing unit. Consider the first one, the wireless EMG sensors employ a 3.7 V lithium battery of 28 × 20 × 12 mm and absorb 40 mW with a sampling rate of 2 kHz and apparent radiated power (ARP) of 0.45 mW at 2.4 MHz. In a continuous-mode operation, the EMG nodes can last up to 12 h. The EEG uses a Lithium-Ion Prismatic 523,450 3.7 V and presents a power consumption of 500 mW. A typical continuous acquisition reaches about 8 h. In the specific application, this last module is not employed. The PowerPlay power analyzer tool used to provide the power consumption values related to the computing unit reported that the overall implementation consumes 519.57 mW (453.24 mW if the EEG branch is turned off) without heat sink with still air, of which 416.64 mW is a core static thermal power dissipation. The power dissipation caused by signal transitions (dynamically dissipated) is estimated as 88.89 mW with the EEG branch turned on. Turning off the EEG branch, as per our case, the overall dynamic consumption reduces to 28.60 mW mainly divided into 3.60 mW for the I/O, 1.04 mW for the register cells, and 0.04 mW, and finally, 11.55 mW for the PLL unit consumption. The remaining power consumption quote is due to microcontroller computation.
5. Conclusions
To date, L-dopa treatment is still the most used dopamine replacement therapy for the treatment of PD. However, excessive and extensive use of L-dopa leads, within 3–5 years, to the onset of the WO phenomenon. This phenomenon, although widespread among patients with PD, is often undiagnosed. In addition, the onset of symptoms between one administration and another does not allow the patient a continuously good quality of life. In the personalized medicine era, technological support to allow clinicians a release of personalized treatment plans based on WO phenomenon detection is needed. In this context, this paper presented a wearable WO tracker that exploits the feature extraction capabilities of a preexisting embedded platform, which is born for PD stratification and postural assessment. The proposed technological solution analyzes cortical and muscular data wirelessly gathered by an EEG headset and a set of eight surface EMG sensors to identify the neuromuscular involvement during the ON/OFF phase typical of WO fluctuations. The proposed architecture, implemented on a heterogeneous computing platform, statistically analyzes neural and muscular features through a statistical significance-based approach, in order to find a highly descriptive set of features employable for the classification step. An analysis concerning the best classification model has been conducted on four shallow learning and four deep learning approaches. Each model has been assessed in terms of accuracy performance, inference timing, and implementation ease. The selected classifier consists of a 1-layer dense NN. The hidden layer embeds 32 units and a ReLU activation function. With 311 MACC operations (~350 μs/inference), 1.05 kB of ROM, and 3.13 kB of RAM, the proposed NN is able to reach an accuracy of 83.72%, with a precision on the OFF state recognition of 86.41 % on a Testing Set based on two subjects. The proposed embedded platform is demonstrated to be easily employed as a daily life monitoring system to record WO-related symptom fluctuations. These system features are useful to support physicians in providing continuous and progressive adaption of L-dopa treatment plans.
Although the experimental results are promising in terms of performance and ease of implementation of the WO detector, some implementation details remain to be investigated.
The proposed system has been optimized and evaluated only on standardized walks and never interspersed with ordinary life actions that may introduce high variability in the neuromuscular patterns. Therefore, the system should be also verified in an ordinary life scenario introducing a dedicated rejection strategy, if needed.
In addition, to improve the performance of the proposed WO detection system, data from IMU sensors, integrated into the EMGs used for the application, could be exploited. However, this step must consider the data stream to be analyzed, which adversely affects the memory resources of the employed device.
Author Contributions
Conceptualization, G.M. and D.D.V.; methodology, G.M. and D.D.V.; software, G.M.; validation, G.M. and D.D.V.; formal analysis, G.M. and D.D.V.; investigation, G.M. and D.D.V.; resources, D.D.V.; data curation, G.M.; writing—original draft preparation, G.M. and D.D.V.; supervision, D.D.V. All authors have read and agreed to the published version of the manuscript.
Funding
This research received no external funding.
Informed Consent Statement
Not applicable.
Data Availability Statement
More details concerning analyzed dataset are provided in [6,29].
Conflicts of Interest
The authors declare no conflict of interest.
References
- Kim, Y.E.; Jeon, B.; Yun, J.Y.; Yang, H.J.; Kim, H.J. Chronological View of Peak and Diphasic Dyskinesia, Wearing off and Freezing of Gait in Parkinson’s Disease. J. Park. Dis. 2019, 9, 741–747. [Google Scholar] [CrossRef] [PubMed]
- Stacy, M.; Bowron, A.; Guttman, M.; Hauser, R.; Hughes, K.; Larsen, j.; LeWitt, P.; Oertel, W.; Quinn, N.; Sethi, K.; et al. Identification of motor and nonmotor wearing-off in Parkinson’s disease: Comparison of a patient questionnaire versus a clinician assessment. Mov. Disord. Off. J. Mov. Disord. Soc. 2005, 20, 726–733. [Google Scholar] [CrossRef] [PubMed]
- Farzanehfar, P.; Woodrow, H.; Horne, M. Assessment of Wearing Off in Parkinson’s disease using objective measurement. J. Neurol. 2021, 268, 914–922. [Google Scholar] [CrossRef] [PubMed]
- Antonini, A.; Martinez-Martin, P.; Chaudhuri, R.K.; Merello, M.; Hauser, R.; Katzenschlager, R.; Odin, P.; Stacy, M.; Stocchi, F.; Poewe, W.; et al. Wearing-off scales in Parkinson’s disease: Critique and recommendations. Mov. Disord. 2011, 26, 2169–2175. [Google Scholar] [CrossRef] [PubMed]
- Woodrow, H.; Horne, M.K.; Fernando, C.V.; Kotschet, K.E.; Treat to Target Study Group. A blinded, controlled trial of objective measurement in Parkinson’s disease. Npj Park. Dis. 2020, 6, 1–10. [Google Scholar] [CrossRef] [PubMed]
- De Venuto, D.; Annese, V.F.; Mezzina, G.; Defazio, G. FPGA-Based Embedded Cyber-Physical Platform to Assess Gait and Postural Stability in Parkinson’s Disease. IEEE Trans. Compon. Packag. Manuf. Technol. 2018, 8, 1167–1179. [Google Scholar] [CrossRef]
- Cimolin, V.; Vismara, L.; Ferraris, C.; Amprimo, G.; Pettiti, G.; Lopez, R.; Galli, M.; Cremascoli, R.; Sinagra, S.; Mauro, A.; et al. Computation of Gait Parameters in Post Stroke and Parkinson’s Disease: A Comparative Study Using RGB-D Sensors and Optoelectronic Systems. Sensors 2022, 22, 824. [Google Scholar] [CrossRef]
- De Venuto, D.; Stikvoort, E.; Tio Castro, D.; Ponomarev, Y. Ultra low-power 12-bit SAR ADC for RFID applications. In Proceedings of the 2010 Design, Automation & Test in Europe Conference & Exhibition (DATE), Dresden, Germany, 8–12 March 2010; IEEE: Piscataway Township, NJ, USA, 2010. [Google Scholar]
- Pahwa, R.; Isaacso, S.H.; Torres-Russott, D.; Naha, F.B.; Lynch, P.M.; Kotschet, K.E. Role of the Personal KinetiGraph in the routine clinical assessment of Parkinson’s disease: Recommendations from an expert panel. Expert Rev. Neurother. 2018, 18, 669–680. [Google Scholar] [CrossRef]
- Pursiainen, V.; Korpelainen, J.T.; Haapaniemi, T.H.; Sotaniemi, K.A.; Myllylä, V.V. Blood pressure and heart rate in parkinsonian patients with and without wearing-off. Eur. J. Neurol. 2007, 14, 373–378. [Google Scholar] [CrossRef]
- Zhao, H.; Wang, R.; Qi, D.; Xie, J.; Cao, J.; Liao, W.-H. Wearable gait monitoring for diagnosis of neurodegenerative diseases. Measurement 2022, 202, 111839. [Google Scholar] [CrossRef]
- Mazzetta, I.; Zampogna, A.; Suppa, A.; Gumiero, A.; Pessione, M.; Irrera, F. Wearable Sensors System for an Improved Analysis of Freezing of Gait in Parkinson’s Disease Using Electromyography and Inertial Signals. Sensors 2019, 19, 948. [Google Scholar] [CrossRef] [PubMed]
- Victorino, J.N.; Shibata, Y.; Inoue, S.; Shibata, T. Predicting Wearing-Off of Parkinson’s Disease Patients Using a Wrist-Worn Fitness Tracker and a Smartphone: A Case Study. Appl. Sci. 2021, 11, 7354. [Google Scholar] [CrossRef]
- Ijima, Y.; Furudate, Y.; Chiba, K.; Ishida, Y.; Mikami, S. Automated Recognition of Off Phenomenon in Parkinson’s Disease During Walking: Measurement in Daily Life with Wearable Device. In Proceedings of the 2022 IEEE 4th Global Conference on Life Sciences and Technologies (LifeTech), Osaka, Japan, 7–9 March 2022; IEEE: Piscataway Township, NJ, USA, 2022; pp. 273–275. [Google Scholar]
- Pierce, A.; Ignasiak, N.; Eiteman-Pang, W.K.; Rakovski, C.; Berardi, V. Mobile phone sensors can discern medication-related gait quality changes in Parkinson’s patients in the home environment. Comput. Methods Programs Biomed. Update 2021, 1, 100028. [Google Scholar] [CrossRef]
- Ghoraani, B.; Hssayeni, M.D.; Bruack, M.M.; Jimenez-Shahed, J. Multilevel Features for Sensor-Based Assessment of Motor Fluctuation in Parkinson’s Disease Subjects. IEEE J. Biomed. Health Inform. 2020, 24, 1284–1295. [Google Scholar] [CrossRef] [PubMed]
- Moradi, H.; Roth, N.; Seifer, A.; Eskofier, B.M. Detection of distorted gait and wearing-off phenomenon in Parkinson’s disease patients during Levodopa therapy. In Proceedings of the 2022 IEEE-EMBS International Conference on Biomedical and Health Informatics (BHI), Ioannina, Greece, 27–30 September 2022; pp. 01–04. [Google Scholar] [CrossRef]
- Kilinçalp, G.; Sjöström, A.-C.; Eriksson, B.; Holmberg, B.; Constantinescu, R.; Bergquist, F. Predictive Value of Ambulatory Objective Movement Measurement for Outcomes of Levodopa/Carbidopa Intestinal Gel Infusion. J. Pers. Med. 2022, 12, 27. [Google Scholar] [CrossRef] [PubMed]
- Lubik, S.; Fogel, W.; Tronnier, V.; Krause, M.; König, J.; Jost, W.H. Gait analysis in patients with advanced Parkinson disease: Different or additive effects on gait induced by levodopa and chronic STN stimulation. J. Neural Transm. 2006, 113, 163–173. [Google Scholar] [CrossRef] [PubMed]
- PKG by Global Kinetics CorporationTM. Available online: https://pkgcare.com/healthcare-professionals/ (accessed on 26 September 2022).
- Annese, V.F.; De Venuto, D. Fall-risk assessment by combined movement related potentials and co-contraction index monitoring. In Proceedings of the 2015 IEEE Biomedical Circuits and Systems Conference (BioCAS), Atlanta, GA, USA, 22–24 October 2015; pp. 1–4. [Google Scholar]
- de Tommaso, M.; Vecchio, E.; Ricci, K.; Montemurno, A.; De Venuto, D.; Annese, V.F. Combined EEG/EMG evaluation during a novel dual task paradigm for gait analysis. In Proceedings of the 2015 6th International Workshop on Advances in Sensors and Interfaces (IWASI), Gallipoli, Italy, 18–19 June 2015; pp. 181–186. [Google Scholar] [CrossRef]
- De Venuto, D.; Tio Castro, D.; Ponomarev, Y.; Stikvoort, E. Low power 12-bit SAR ADC for autonomous wireless sensors network interface. In Proceedings of the 2009 3rd International Workshop on Advances in sensors and Interfaces (IWASI), Trani, Italy, 25–26 June 2009; IEEE: Piscataway Township, NJ, USA, 2009. [Google Scholar]
- Kornhuber, H.H.; Deecke, L. Brain potential changes in voluntary and passive movements in humans: Readiness potential and reafferent potentials. Pflügers Arch.—Eur. J. Physiol. 2016, 468, 1115–1124. [Google Scholar] [CrossRef] [PubMed]
- Vassar, S.D.; Bordelon, Y.M.; Hays, R.D.; Diaz, N.; Rausch, R.; Mao, C.; Vickrey, B.G. Confirmatory factor analysis of the motor unified Parkinson’s disease rating scale. Park. Dis. 2012, 2012, 1–10. [Google Scholar] [CrossRef] [PubMed]
- O’Malley, T.; Bursztein, E.; Long, J.; Chollet, F.; Haifeng Jin, L.I.; Invernizzi, L. Keras Tuner. 2019. Available online: https://github.com/keras-team/keras-tuner (accessed on 1 November 2022).
- Li, L.; Jamieson, K.; DeSalvo, G.; Rostamizadeh, A.; Talwalkar, A. Hyperband: A novel bandit-based approach to hyperparameter optimization. J. Mach. Learn. Res. 2017, 18, 6765–6816. [Google Scholar]
- Cheng, C.; Wang, Z.; Fan, Y.; Zhang, X.; Li, D.; Lu, Q. Nesterov Adam Iterative Fast Gradient Method for Adversarial Attacks. In International Conference on Artificial Neural Networks; Springer: Cham, Switzerland, 2022. [Google Scholar]
- De Venuto, D.; Mezzina, G. Multisensing System for Parkinson’s Disease Stage Assessment Based on FPGA-Embedded Serial SVM Classifier. IEEE Des. Test 2021, 38, 44–51. [Google Scholar] [CrossRef]


Publisher’s Note: MDPI stays neutral with regard to jurisdictional claims in published maps and institutional affiliations. |
© 2022 by the authors. Licensee MDPI, Basel, Switzerland. This article is an open access article distributed under the terms and conditions of the Creative Commons Attribution (CC BY) license (https://creativecommons.org/licenses/by/4.0/).