
Deep Q-Learning and Preference Based Multi-Agent System for Sustainable Agricultural Market

 ,
,  ,
,  ,
,  and
and 
Abstract
:1. Introduction
2. Related Work
2.1. Edge Computing
2.2. Multi-Agent Systems
- 1
- Social aspects refer to the description of the set of roles, groups (role associations), and the relationship between them. Regarding the existing relationships between roles and groups (recursively), some authors have defined a set of social structures that allow to model the interactions between members. Among the main structures, the following stand out: hierarchies, coalitions, teams, congregations, societies, federations, markets, matrices, and composite organizations. Some studies have simply defined possible relationships between members [46] such as dependency, hierarchy, use, etc.
- 2
- The communication aspects refer to the means that makes the exchange of information possible. That is, a knowledge representation language (usually represented by an ontology) and a communication language. The communication sequence between two agents is called illocution [47], communication act [46], or link [48].
- 3
- Interaction aspects refer to how roles collaborate to achieve common goals. There might be objectives that cannot be achieved individually, and that require the combination of several agents for achievement, and it is necessary to describe an interaction structure that allows to articulate or regulate the achievement of individual sub-objectives that in turn make the achievement of higher-level objectives possible [46].
- 4
Multi-Objective Optimization Problem
2.3. Deep Q-Learning Algorithm
| Algorithm 1:Algorithm adapted from the work in [71]. |
 |
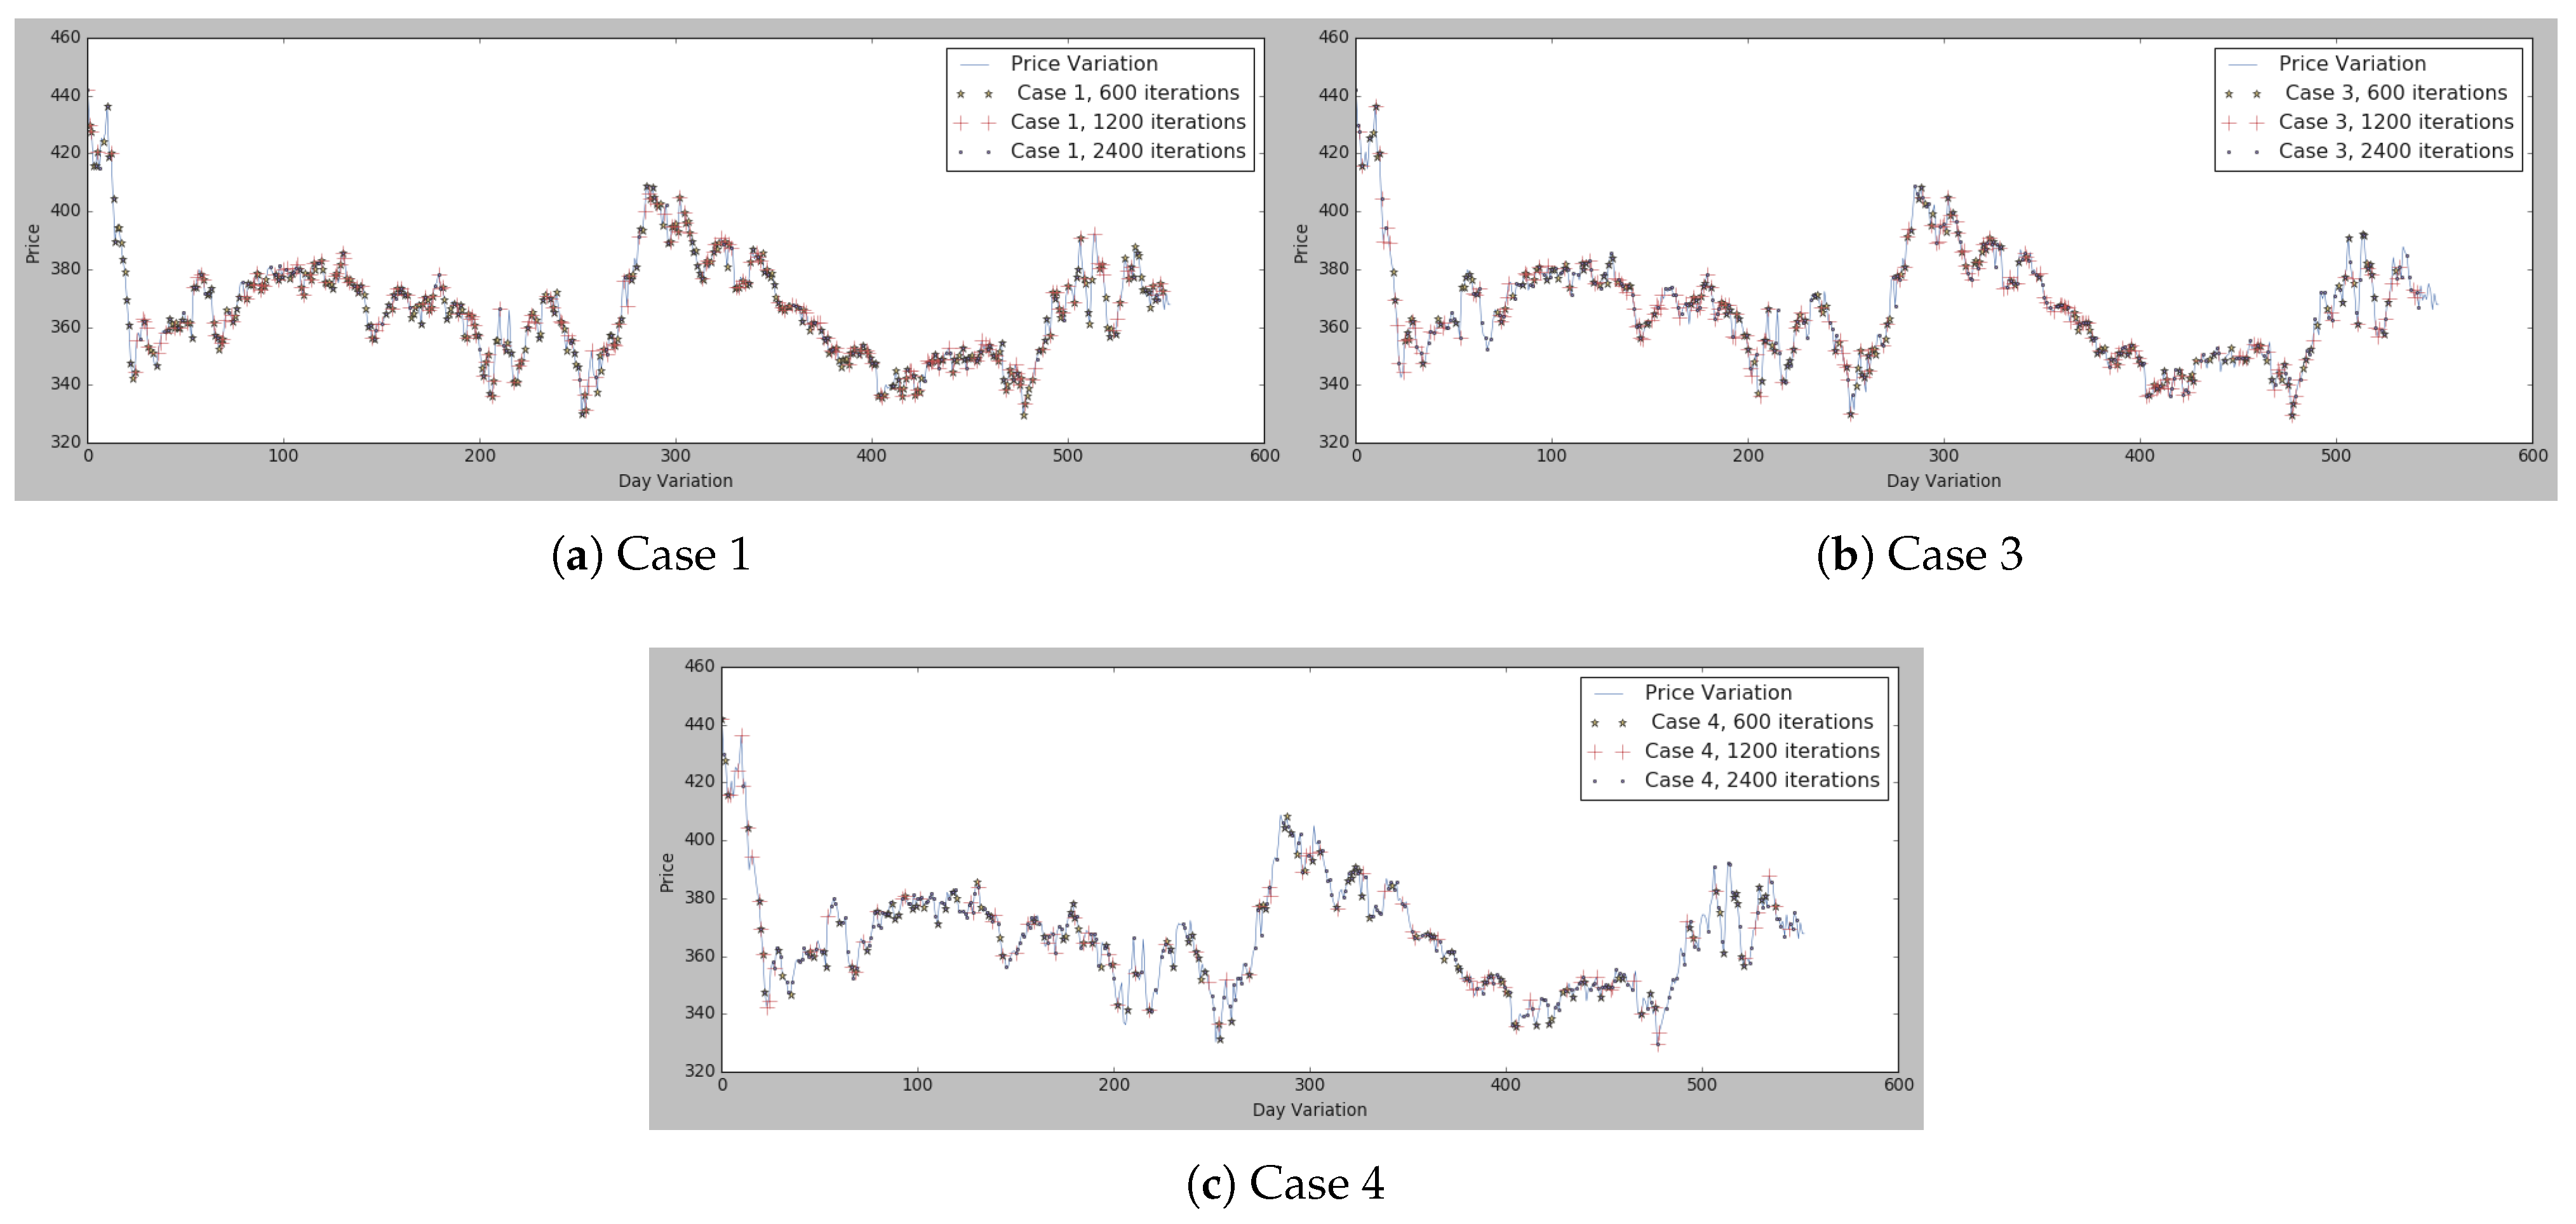
3. Case Study
3.1. Architecture
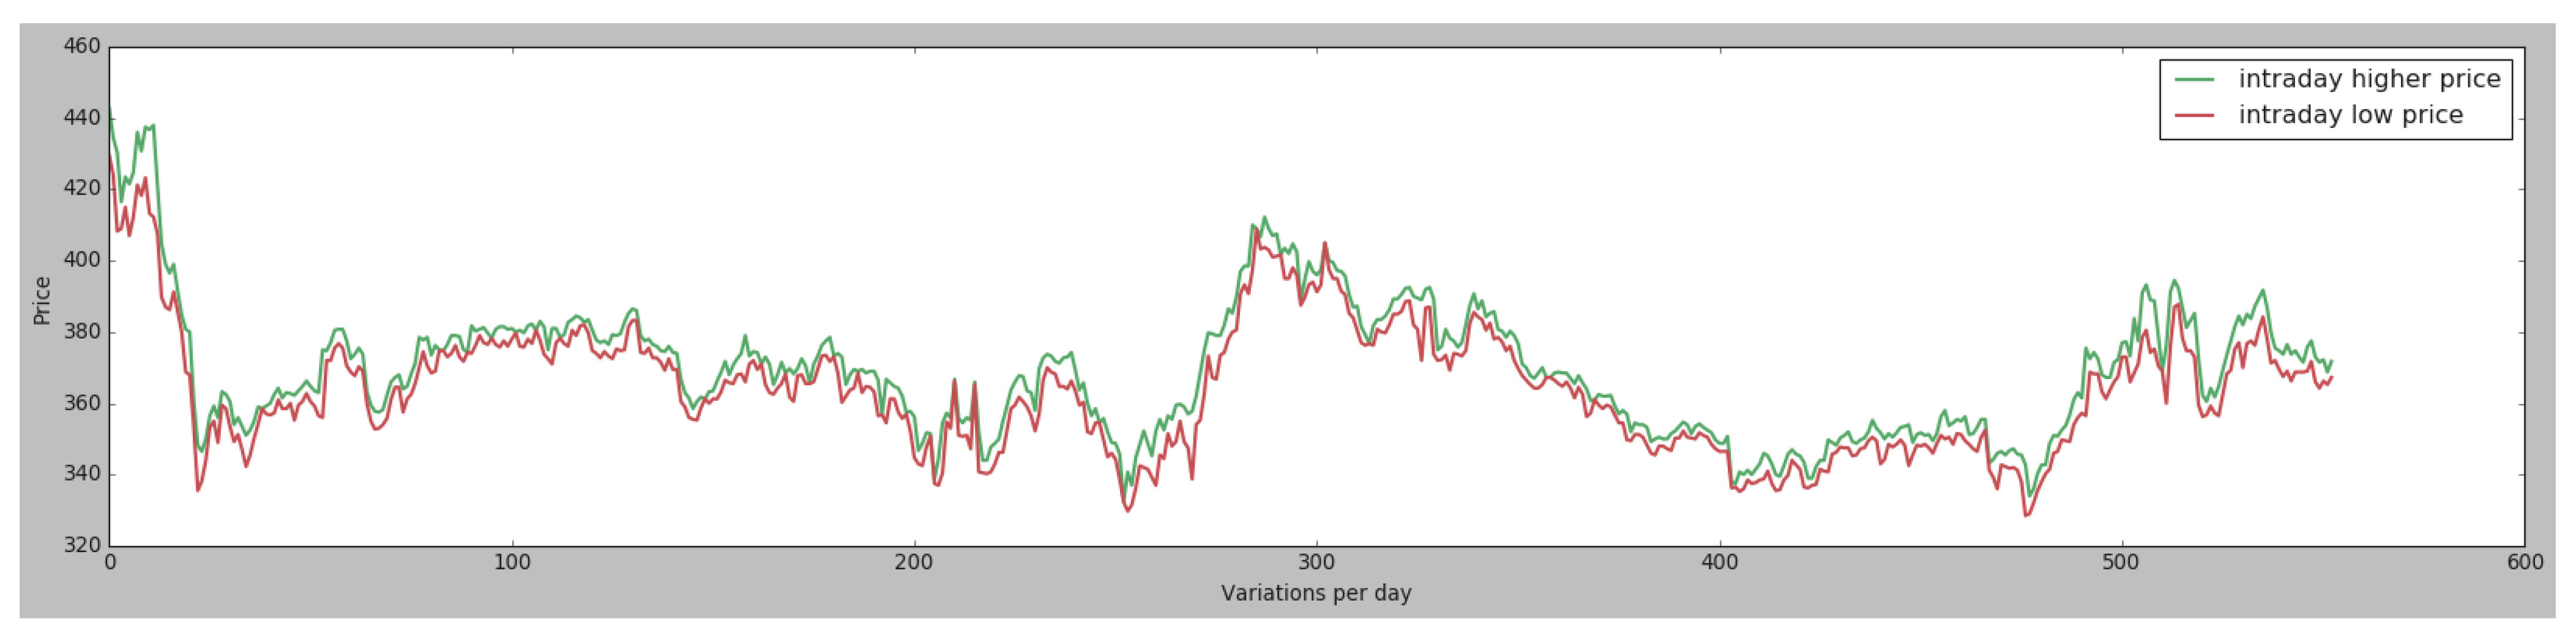
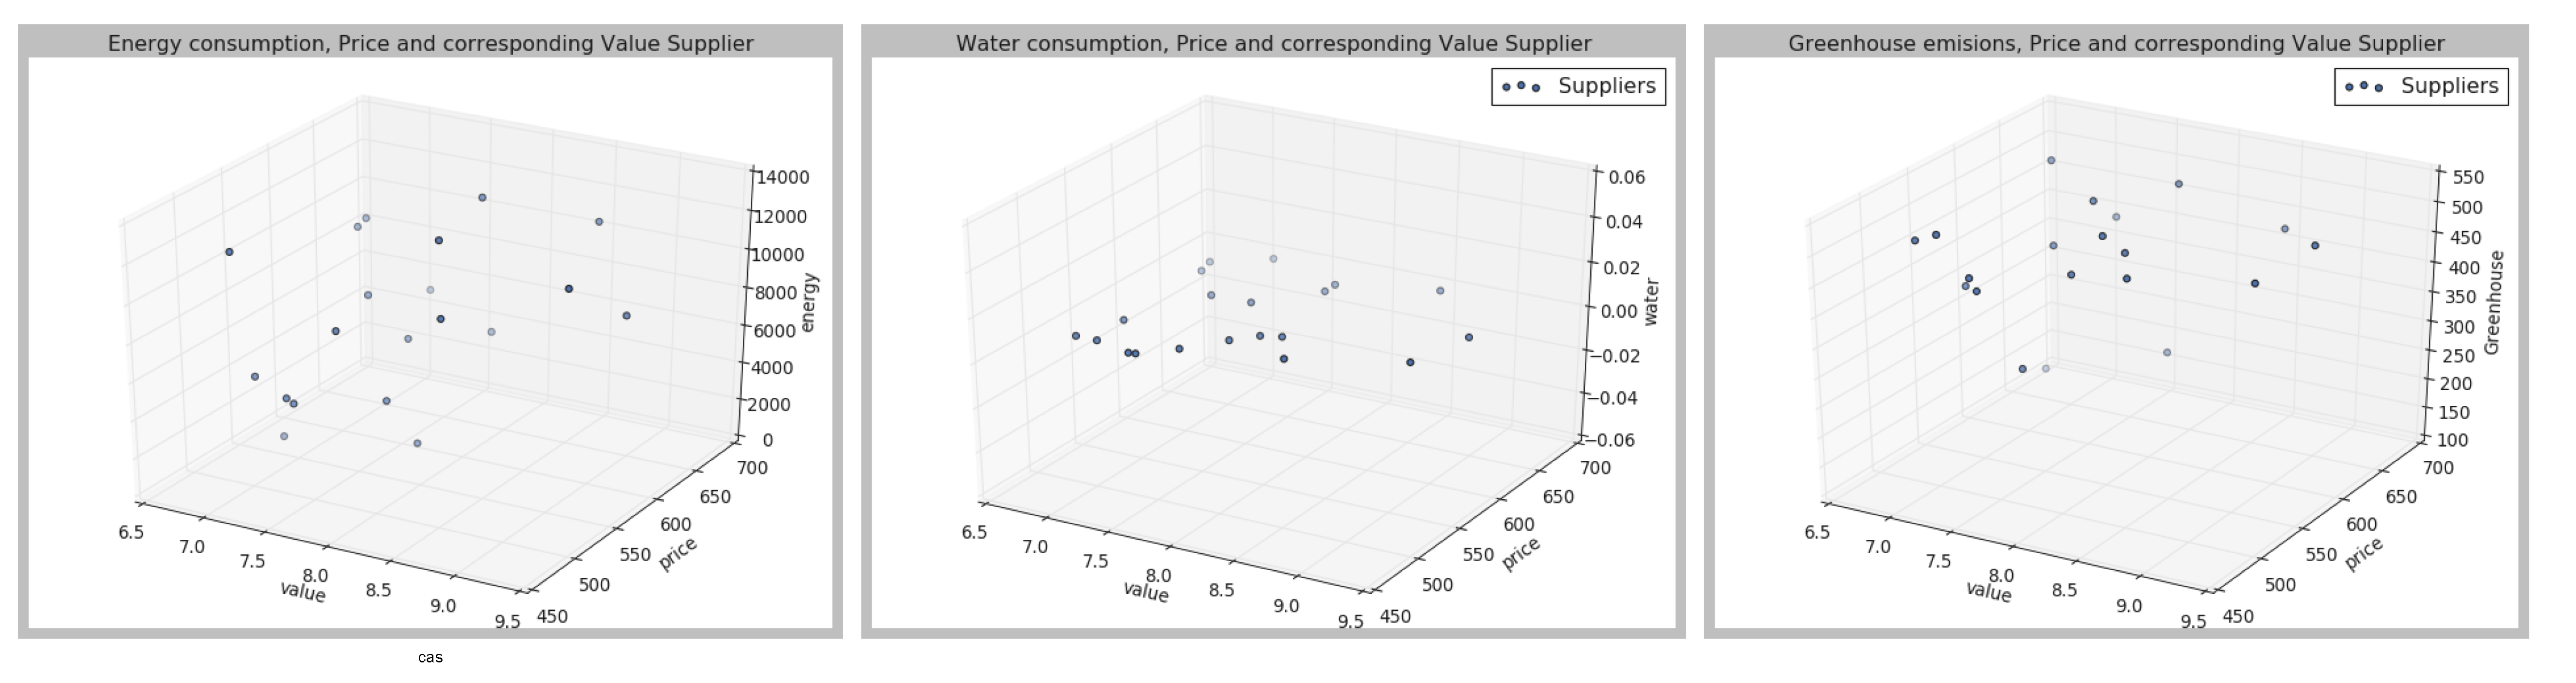
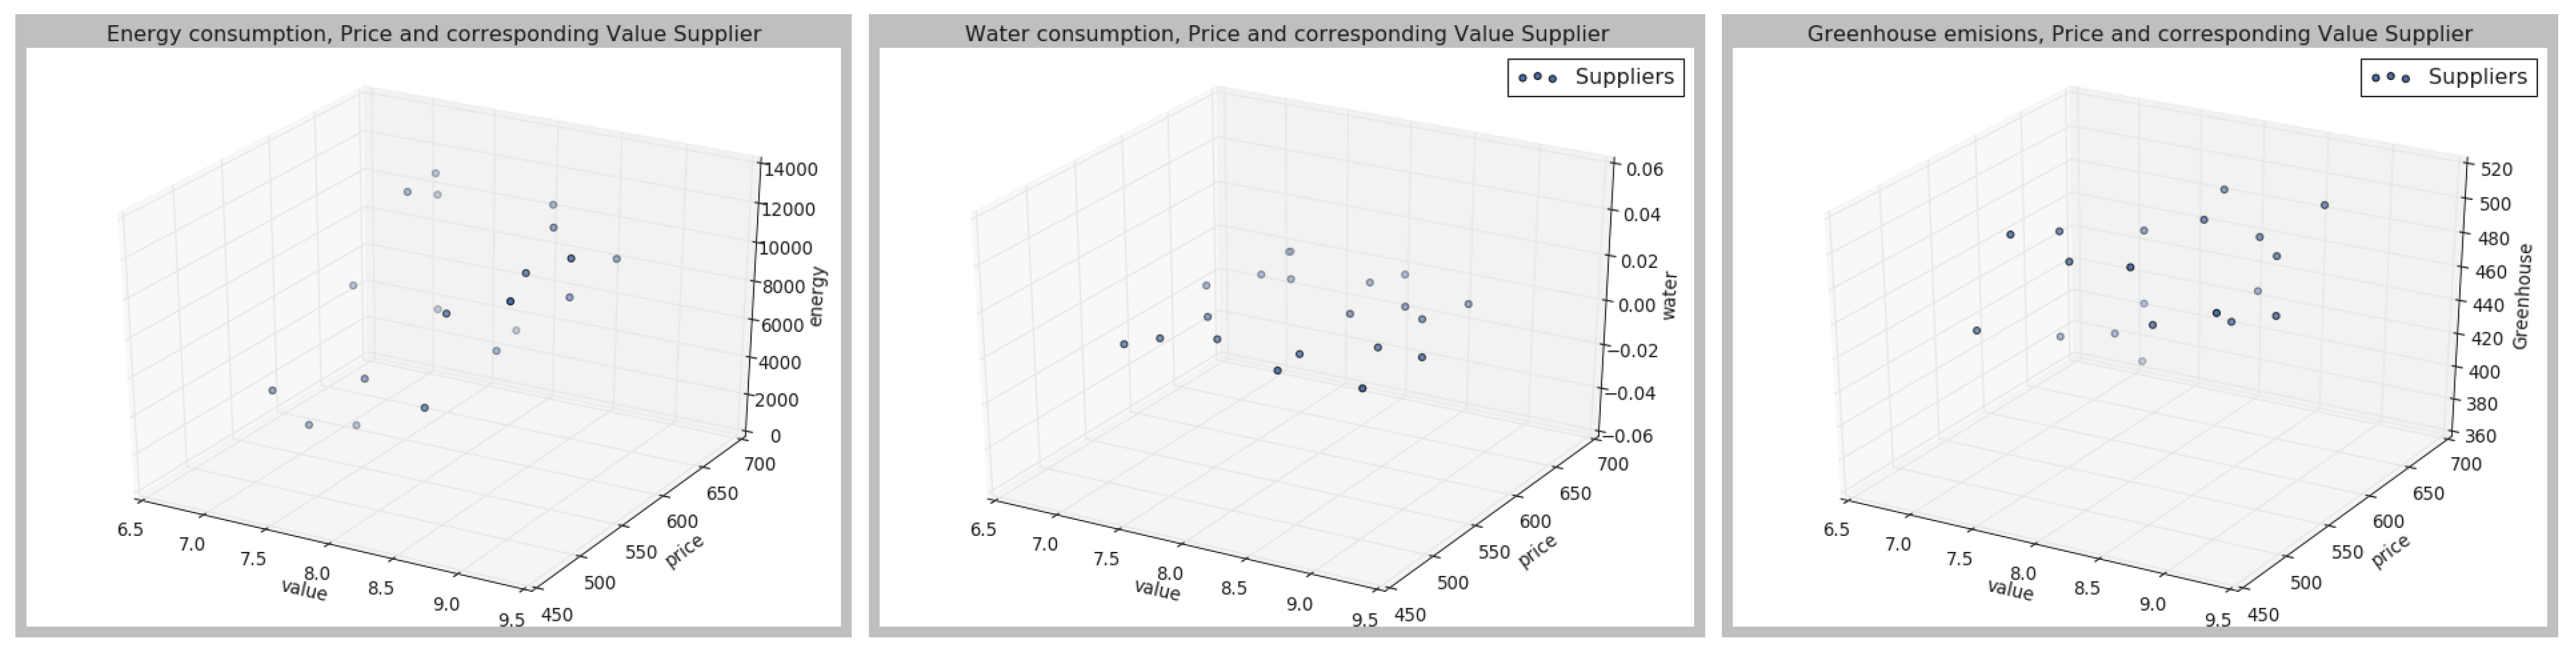
3.2. Data
4. Results
5. Discussion
Author Contributions
Funding
Conflicts of Interest
References
- Nelson, G.C.; Rosegrant, M.W.; Koo, J.; Robertson, R.; Sulser, T.; Zhu, T.; Ringler, C.; Msangi, S.; Palazzo, A.; Batka, M.; et al. Climate Change: Impact on Agriculture and Costs of Adaptation; International Food Policy Research Institute: Washington, DC, USA, 2009; Volume 21. [Google Scholar]
- Stevanovic, M.; Popp, A.; Bodirsky, B.L.; Humpenöder, F.; Müller, C.; Weindl, I.; Dietrich, J.P.; Lotze-Campen, H.; Kreidenweis, U.; Rolinski, S.; et al. Mitigation strategies for greenhouse gas emissions from agriculture and land-use change: Consequences for food prices. Environ. Sci. Technol. 2017, 51, 365–374. [Google Scholar] [CrossRef]
- Bellmann, C.; Hepburn, J. The decline of commodity prices and global agricultural trade negotiations: A game changer? Int. Dev. Policy Rev. Int. Polit. Dev. 2017. [Google Scholar] [CrossRef]
- D’Adamo, I.; Falcone, P.M.; Morone, P. A new socio-economic indicator to measure the performance of bioeconomy sectors in Europe. Ecol. Econ. 2020, 176, 106724. [Google Scholar] [CrossRef]
- De Gorter, H.; Drabik, D.; Just, D.R. The Economics of Biofuel Policies: Impacts on Price Volatility in Grain and Oilseed Markets; Springer: Berlin/Heidelberg, Germany, 2015. [Google Scholar]
- Du, X.; Cindy, L.Y.; Hayes, D.J. Speculation and volatility spillover in the crude oil and agricultural commodity markets: A Bayesian analysis. Energy Econ. 2011, 33, 497–503. [Google Scholar] [CrossRef]
- Kuruppuarachchi, D.; Premachandra, I. Information spillover dynamics of the energy futures market sector: A novel common factor approach. Energy Econ. 2016, 57, 277–294. [Google Scholar] [CrossRef]
- Kang, S.H.; McIver, R.; Yoon, S.M. Dynamic spillover effects among crude oil, precious metal, and agricultural commodity futures markets. Energy Econ. 2017, 62, 19–32. [Google Scholar] [CrossRef]
- Agovino, M.; Casaccia, M.; Ciommi, M.; Ferrara, M.; Marchesano, K. Agriculture, climate change and sustainability: The case of EU-28. Ecol. Indic. 2019, 105, 525–543. [Google Scholar] [CrossRef]
- Eshel, G.; Shepon, A.; Makov, T.; Milo, R. Land, irrigation water, greenhouse gas, and reactive nitrogen burdens of meat, eggs, and dairy production in the United States. Proc. Natl. Acad. Sci. USA 2014, 111, 11996–12001. [Google Scholar] [CrossRef] [Green Version]
- Sisinni, E.; Saifullah, A.; Han, S.; Jennehag, U.; Gidlund, M. Industrial Internet of Things: Challenges, Opportunities, and Directions. IEEE Trans. Ind. Inform. 2018, 14, 4724–4734. [Google Scholar] [CrossRef]
- Skobelev, P.; Budaev, D.; Gusev, N.; Voschuk, G. Designing Multi-Agent Swarm of UAV for Precise Agriculture. In Proceedings of the International Conference on Practical Applications of Agents and Multi-Agent Systems (PAAMS 2018), Toledo, Spain, 20–22 June 2018; pp. 47–59. [Google Scholar]
- Zhang, N.; Wang, M.; Wang, N. Precision agriculture—A worldwide overview. Comput. Electron. Agric. 2002, 36, 113–132. [Google Scholar] [CrossRef]
- Sittón-Candanedo, I.; Alonso, R.S.; García, Ó.; Muñoz, L.; Rodríguez-González, S. Edge computing, iot and social computing in smart energy scenarios. Sensors 2019, 19, 3353. [Google Scholar] [CrossRef] [Green Version]
- Alonso, R.S.; Sittón-Candanedo, I.; García, Ó.; Prieto, J.; Rodríguez-González, S. An intelligent Edge-IoT platform for monitoring livestock and crops in a dairy farming scenario. Ad Hoc Netw. 2020, 98, 102047. [Google Scholar] [CrossRef]
- Pérez-Pons, M.E.; Plaza-Hernández, M.; Alonso, R.S.; Parra-Domínguez, J.; Prieto, J. Increasing Profitability and Monitoring Environmental Performance: A Case Study in the Agri-Food Industry through an Edge-IoT Platform. Sustainability 2021, 13, 283. [Google Scholar] [CrossRef]
- Schreinemachers, P.; Berger, T. Land use decisions in developing countries and their representation in multi-agent systems. J. Land Use Sci. 2006, 1, 29–44. [Google Scholar] [CrossRef]
- Gaudou, B.; Sibertin-Blanc, C.; Therond, O.; Amblard, F.; Auda, Y.; Arcangeli, J.P.; Balestrat, M.; Charron-Moirez, M.H.; Gondet, E.; Hong, Y.; et al. The MAELIA multi-agent platform for integrated analysis of interactions between agricultural land-use and low-water management strategies. In Proceedings of the International Workshop on Multi-Agent Systems and Agent-Based Simulation, Saint Paul, MN, USA, 6–7 May 2013; pp. 85–100. [Google Scholar]
- García, L.; Parra, L.; Jimenez, J.M.; Lloret, J.; Lorenz, P. IoT-based smart irrigation systems: An overview on the recent trends on sensors and IoT systems for irrigation in precision agriculture. Sensors 2020, 20, 1042. [Google Scholar] [CrossRef] [Green Version]
- González-Briones, A.; Castellanos-Garzón, J.A.; Mezquita-Martín, Y.; Prieto, J.; Corchado, J.M. A multi-agent system framework for autonomous crop irrigation. In Proceedings of the 2nd International Conference on Computer Applications & Information Security (ICCAIS 2019), Riyadh, Saudi Arabia, 1–3 May 2019; pp. 1–6. [Google Scholar]
- González-Briones, A.; De La Prieta, F.; Mohamad, M.S.; Omatu, S.; Corchado, J.M. Multi-agent systems applications in energy optimization problems: A state-of-the-art review. Energies 2018, 11, 1928. [Google Scholar] [CrossRef] [Green Version]
- Wang, L.; Feng, J.; Sui, X.; Chu, X.; Mu, W. Agricultural product price forecasting methods: Research advances and trend. Br. Food J. 2020, 122, 2121–2138. [Google Scholar] [CrossRef]
- Valluri, A.; Croson, D.C. Agent learning in supplier selection models. Decis. Support Syst. 2005, 39, 219–240. [Google Scholar] [CrossRef]
- Thies, C.; Kieckhäfer, K.; Spengler, T.S.; Sodhi, M.S. Operations research for sustainability assessment of products: A review. Eur. J. Oper. Res. 2019, 274, 1–21. [Google Scholar] [CrossRef]
- Camargo, G.G.; Ryan, M.R.; Richard, T.L. Energy use and greenhouse gas emissions from crop production using the farm energy analysis tool. BioScience 2013, 63, 263–273. [Google Scholar] [CrossRef] [Green Version]
- Ghadimi, P.; Toosi, F.G.; Heavey, C. A multi-agent systems approach for sustainable supplier selection and order allocation in a partnership supply chain. Eur. J. Oper. Res. 2018, 269, 286–301. [Google Scholar] [CrossRef] [Green Version]
- Azadnia, A.H.; Saman, M.Z.M.; Wong, K.Y. Sustainable supplier selection and order lot-sizing: An integrated multi-objective decision-making process. Int. J. Prod. Res. 2015, 53, 383–408. [Google Scholar] [CrossRef]
- Ghadimi, P.; Wang, C.; Lim, M.K.; Heavey, C. Intelligent sustainable supplier selection using multi-agent technology: Theory and application for Industry 4.0 supply chains. Comput. Ind. Eng. 2019, 127, 588–600. [Google Scholar] [CrossRef]
- Pardoe, D.; Stone, P. Tactex-05: A Champion Supply Chain Management Agent. In Proceedings of the 21st National Conference on Artificial Intelligence (AAAI 2006), Boston, MA, USA, 16 July 2006; pp. 1489–1494. [Google Scholar]
- Ganesh, S.; Vadori, N.; Xu, M.; Zheng, H.; Reddy, P.; Veloso, M. Reinforcement learning for market making in a multi-agent dealer market. arXiv 2019, arXiv:1911.05892. [Google Scholar]
- Ketter, W.; Collins, J.; Gini, M.; Gupta, A.; Schrater, P. Real-time tactical and strategic sales management for intelligent agents guided by economic regimes. Inf. Syst. Res. 2012, 23, 1263–1283. [Google Scholar] [CrossRef] [Green Version]
- Hogenboom, A.; Ketter, W.; Van Dalen, J.; Kaymak, U.; Collins, J.; Gupta, A. Adaptive Tactical Pricing in Multi-Agent Supply Chain Markets Using Economic Regimes. Decis. Sci. 2015, 46, 791–818. [Google Scholar] [CrossRef] [Green Version]
- Wellman, M.P.; Wurman, P.R. Market-aware agents for a multiagent world. Robot. Auton. Syst. 1998, 24, 115–125. [Google Scholar] [CrossRef]
- Wooldridge, M.J.; Jennings, N.R. Intelligent agents: Theory and practice. Knowl. Eng. Rev. 1995, 10, 115–152. [Google Scholar] [CrossRef] [Green Version]
- Brusaferri, A.; Matteucci, M.; Portolani, P.; Vitali, A. Bayesian deep learning based method for probabilistic forecast of day-ahead electricity prices. Appl. Energy 2019, 250, 1158–1175. [Google Scholar] [CrossRef]
- Maes, P. The agent network architecture (ANA). ACM Sigart Bull. 1991, 2, 115–120. [Google Scholar] [CrossRef]
- Bockstaller, C.; Guichard, L.; Makowski, D.; Aveline, A.; Girardin, P.; Plantureux, S. Agri-environmental indicators to assess cropping and farming systems. A review. Agron. Sustain. Dev. 2008, 28, 139–149. [Google Scholar] [CrossRef]
- Ma, F.; Wei, Y.; Liu, L.; Huang, D. Forecasting realized volatility of oil futures market: A new insight. J. Forecast. 2018, 37, 419–436. [Google Scholar] [CrossRef]
- Tong, Q.; Anders, S.; Zhang, J.; Zhang, L. The roles of pollution concerns and environmental knowledge in making green food choices: Evidence from Chinese consumers. Food Res. Int. 2020, 130, 108881. [Google Scholar] [CrossRef]
- Asemani, M.; Abdollahei, F.; Jabbari, F. Understanding IoT platforms: Towards a comprehensive definition and main characteristic description. In Proceedings of the 5th International Conference on Web Research (ICWR 2019), Tehran, Iran, 24–25 April 2019; pp. 172–177. [Google Scholar]
- Mezquita, Y.; González-Briones, A.; Casado-Vara, R.; Chamoso, P.; Prieto, J.; Corchado, J.M. Blockchain-based architecture: A MAS proposal for efficient agri-food supply chains. In Proceedings of the 10th International Symposium on Ambient Intelligence, Ávila, Spain, 26–28 June 2019; pp. 89–96. [Google Scholar]
- Wu, C.; Toosi, A.N.; Buyya, R.; Ramamohanarao, K. Hedonic pricing of cloud computing services. IEEE Trans. Cloud Comput. 2018, 9, 182–196. [Google Scholar] [CrossRef] [Green Version]
- Wang, H.; Olhofer, M.; Jin, Y. A mini-review on preference modeling and articulation in multi-objective optimization: Current status and challenges. Complex Intell. Syst. 2017, 3, 233–245. [Google Scholar] [CrossRef]
- Jennings, N.R.; Sycara, K.; Wooldridge, M. A roadmap of agent research and development. Auton. Agents Multi Agent Syst. 1998, 1, 7–38. [Google Scholar] [CrossRef]
- Corchado, J.M.; Laza, R. Constructing deliberative agents with case-based reasoning technology. Int. J. Intell. Syst. 2003, 18, 1227–1241. [Google Scholar] [CrossRef] [Green Version]
- Dignum, V. A Model for Organizational Interaction: Based on Agents, Founded in Logic. SIKS. 2004. Available online: https://dspace.library.uu.nl/bitstream/handle/1874/890/full.pdf?sequence=2 (accessed on 1 May 2021).
- Esteva, M.; Rodriguez-Aguilar, J.A.; Sierra, C.; Garcia, P.; Arcos, J.L. On the formal specification of electronic institutions. In Agent Mediated Electronic Commerce; Springer: Berlin/Heidelberg, Germany, 2001; pp. 126–147. [Google Scholar]
- Hübner, J.F.; Sichman, J.S.; Boissier, O. A model for the structural, functional, and deontic specification of organizations in multiagent systems. In Proceedings of the Brazilian Symposium on Artificial Intelligence (SBIA 2002), Porto de Galinhas/Recife, Brazil, 11–14 November 2002; pp. 118–128. [Google Scholar]
- Vázquez-Salceda, J. The role of norms and electronic institutions in multi-agent systems applied to complex domains. The HARMONIA framework. Ai Commun. 2003, 16, 209–212. [Google Scholar]
- Zambonelli, F.; Jennings, N.R.; Wooldridge, M. Developing multiagent systems: The Gaia methodology. ACM Trans. Softw. Eng. Methodol. TOSEM 2003, 12, 317–370. [Google Scholar] [CrossRef]
- Kuhn, H.W.; Tucker, A.W. Contributions to the Theory of Games; Princeton University Press: Princeton, NJ, USA, 1953; Volume 2. [Google Scholar]
- Binmore, K. Foundations of game theory. In Advances in Economic Theory: Sixth World Congress; Cambridge University Press: Cambridge, UK, 1992; Volume 1, pp. 1–31. [Google Scholar]
- Smith, J.M. Evolutionary game theory. In Vito Volterra Symposium on Mathematical Models in Biology; Springer: Berlin/Heidelberg, Germany, 1980; pp. 73–81. [Google Scholar]
- Smith, J.M.; Price, G.R. The logic of animal conflict. Nature 1973, 246, 15–18. [Google Scholar] [CrossRef]
- Parkes, D.C.; Wellman, M.P. Economic reasoning and artificial intelligence. Science 2015, 349, 267–272. [Google Scholar] [CrossRef] [Green Version]
- Marreiros, G.; Novais, P.; Machado, J.; Ramos, C.; Neves, J. An agent-based approach to group decision simulation using argumentation. In Proceedings of the International MultiConference on Computer Science and Information Tecnology, Workshop Agent-Based Computing (ABC 2006), Wisla, Poland, 6–10 October 2006; pp. 225–232. [Google Scholar]
- Sadeghi, A.; Zandieh, M. A game theory-based model for product portfolio management in a competitive market. Expert Syst. Appl. 2011, 38, 7919–7923. [Google Scholar] [CrossRef]
- Ban, G.Y.; El Karoui, N.; Lim, A.E. Machine learning and portfolio optimization. Manag. Sci. 2018, 64, 1136–1154. [Google Scholar] [CrossRef] [Green Version]
- Balakrishnan, P.; Jacob, V.S. Genetic algorithms for product design. Manag. Sci. 1996, 42, 1105–1117. [Google Scholar] [CrossRef]
- Freitas, F.D.; De Souza, A.F.; de Almeida, A.R. Prediction-based portfolio optimization model using neural networks. Neurocomputing 2009, 72, 2155–2170. [Google Scholar] [CrossRef]
- Ma, Y.; Han, R.; Wang, W. Prediction-Based Portfolio Optimization Models Using Deep Neural Networks. IEEE Access 2020, 8, 115393–115405. [Google Scholar] [CrossRef]
- Almahdi, S.; Yang, S.Y. An adaptive portfolio trading system: A risk-return portfolio optimization using recurrent reinforcement learning with expected maximum drawdown. Expert Syst. Appl. 2017, 87, 267–279. [Google Scholar] [CrossRef]
- Van Calker, K.; Berentsen, P.; Romero, C.; Giesen, G.; Huirne, R. Development and application of a multi-attribute sustainability function for Dutch dairy farming systems. Ecol. Econ. 2006, 57, 640–658. [Google Scholar] [CrossRef]
- Sutton, R.S.; Barto, A.G. Reinforcement Learning: An Introduction; MIT Press: Cambridge, MA, USA, 2018. [Google Scholar]
- Watkins, C.J.; Dayan, P. Q-learning. Mach. Learn. 1992, 8, 279–292. [Google Scholar] [CrossRef]
- Arulkumaran, K.; Deisenroth, M.P.; Brundage, M.; Bharath, A.A. Deep reinforcement learning: A brief survey. IEEE Signal Process. Mag. 2017, 34, 26–38. [Google Scholar] [CrossRef] [Green Version]
- Watkins, C.J.C.H. Learning from Delayed Rewards. Ph.D. Thesis, University of Cambridge, UK, 1989. [Google Scholar]
- Mnih, V.; Kavukcuoglu, K.; Silver, D.; Graves, A.; Antonoglou, I.; Wierstra, D.; Riedmiller, M. Playing atari with deep reinforcement learning. arXiv 2013, arXiv:1312.5602. [Google Scholar]
- Mnih, V.; Kavukcuoglu, K.; Silver, D.; Rusu, A.A.; Veness, J.; Bellemare, M.G.; Graves, A.; Riedmiller, M.; Fidjeland, A.K.; Ostrovski, G.; et al. Human-level control through deep reinforcement learning. Nature 2015, 518, 529–533. [Google Scholar] [CrossRef]
- Bradtke, S.J.; Duff, M.O. Reinforcement learning methods for continuous-time Markov decision problems. Adv. Neural Inf. Process. Syst. 1995, 7, 393–400. [Google Scholar]
- Sutton, R.S. Learning to predict by the methods of temporal differences. Mach. Learn. 1988, 3, 9–44. [Google Scholar] [CrossRef]
- Hasselt, H. Double Q-learning. Adv. Neural Inf. Process. Syst. 2010, 23, 2613–2621. [Google Scholar]
- Oliveira, E.; Fischer, K.; Stepankova, O. Multi-agent systems: Which research for which applications. Robot. Auton. Syst. 1999, 27, 91–106. [Google Scholar] [CrossRef]
- Gregori, M.E.; Cámara, J.P.; Bada, G.A. A jabber-based multi-agent system platform. In Proceedings of the 5th International Joint Conference on Autonomous Agents and Multiagent Systems, Hakodate, Japan, 8–12 May 2006; pp. 1282–1284. [Google Scholar]
- Atsalakis, G.S.; Valavanis, K.P. Surveying stock market forecasting techniques–Part II: Soft computing methods. Expert Syst. Appl. 2009, 36, 5932–5941. [Google Scholar] [CrossRef]
- Schmidt-Hieber, J. Nonparametric regression using deep neural networks with ReLU activation function. Ann. Stat. 2020, 48, 1875–1897. [Google Scholar]
- Gurel, O.; Acar, A.Z.; Onden, I.; Gumus, I. Determinants of the green supplier selection. Procedia Soc. Behav. Sci. 2015, 181, 131–139. [Google Scholar] [CrossRef] [Green Version]
- Liu, H.; Zhang, J.; Zhou, C.; Ru, Y. Optimal purchase and inventory retrieval policies for perishable seasonal agricultural products. Omega 2018, 79, 133–145. [Google Scholar] [CrossRef]
- Villarrubia, G.; Paz, J.F.D.; Iglesia, D.H.; Bajo, J. Combining multi-agent systems and wireless sensor networks for monitoring crop irrigation. Sensors 2017, 17, 1775. [Google Scholar] [CrossRef] [Green Version]
- Shi, J.; Zhao, Y.; Kiwanuka, R.B.K.; Chang, J. Optimal Selling Policies for Farmer Cooperatives. Prod. Oper. Manag. 2019, 28, 3060–3080. [Google Scholar] [CrossRef]


| Attribute | Description | Measure Units |
|---|---|---|
| Energy consumption | Energy consumed | kWh |
| Greenhouse | is produced mostly from excess nitrogen in soils; one way to suppress emissions of this gas is to apply fertilizer judiciously: adding just enough, at the right place and time, to meet crop demands, but avoiding excess amounts. This can reduce fertilizer costs for producers and reduce the amount of nitrogen lost through excess fertilizer application | |
| Water consumption | Amount of water consumed per year for the irrigation of crops | mL/ha |
| Edge Computing Techniques | Whether edge computer techniques are used to reduce the cost of using the cloud and make their sensors communications more robust and scalable with the cloud | Boolean (Yes/No) |
| Attribute | Description |
|---|---|
| Date | The information regarding price variations is considered per day |
| Price | Stock price |
| Open | Stock price at the opening |
| High | Highest price within a concrete day |
| Low | Lowest price within a concrete day |
| Vol. | Number of stocks |
| Change % | Variation regarding previous date |
| Greenhouse | Water | Energy | |
|---|---|---|---|
| Case 1 | 3 | 5 | 2 |
| Case 2 | 0 | 8 | 2 |
| Case 3 | 8 | 1 | 3 |
| Parameter | Description | Value |
|---|---|---|
| Maximizes the current reward | 0.950 | |
| Either taking random actions or using the trained actions | 0.500 | |
| decay | The decrease over time in the use of the random and trained actions | 0.999 |
| Actions | The actions that can be taken by the agent, which is either selecting a buying price or do nothing | 2 |
| Replay memory size | Agent’s experiences at each time step in a data set | 1000 |
| Case Number | Window Size | Batch Size |
|---|---|---|
| 1 | 8 | 32 |
| 2 | 10 | 32 |
| 3 | 20 | 32 |
| 4 | 8 | 64 |
| 5 | 10 | 64 |
| 6 | 20 | 64 |
Publisher’s Note: MDPI stays neutral with regard to jurisdictional claims in published maps and institutional affiliations. |
© 2021 by the authors. Licensee MDPI, Basel, Switzerland. This article is an open access article distributed under the terms and conditions of the Creative Commons Attribution (CC BY) license (https://creativecommons.org/licenses/by/4.0/).
Share and Cite
Pérez-Pons, M.E.; Alonso, R.S.; García, O.; Marreiros, G.; Corchado, J.M. Deep Q-Learning and Preference Based Multi-Agent System for Sustainable Agricultural Market. Sensors 2021, 21, 5276. https://doi.org/10.3390/s21165276
Pérez-Pons ME, Alonso RS, García O, Marreiros G, Corchado JM. Deep Q-Learning and Preference Based Multi-Agent System for Sustainable Agricultural Market. Sensors. 2021; 21(16):5276. https://doi.org/10.3390/s21165276
Chicago/Turabian StylePérez-Pons, María E., Ricardo S. Alonso, Oscar García, Goreti Marreiros, and Juan Manuel Corchado. 2021. "Deep Q-Learning and Preference Based Multi-Agent System for Sustainable Agricultural Market" Sensors 21, no. 16: 5276. https://doi.org/10.3390/s21165276
APA StylePérez-Pons, M. E., Alonso, R. S., García, O., Marreiros, G., & Corchado, J. M. (2021). Deep Q-Learning and Preference Based Multi-Agent System for Sustainable Agricultural Market. Sensors, 21(16), 5276. https://doi.org/10.3390/s21165276