
Calculation of AeroMACS Spectrum Requirements Based on Traffic Simulator


Abstract
1. Introduction
2. AeroMACS Data Traffic Model
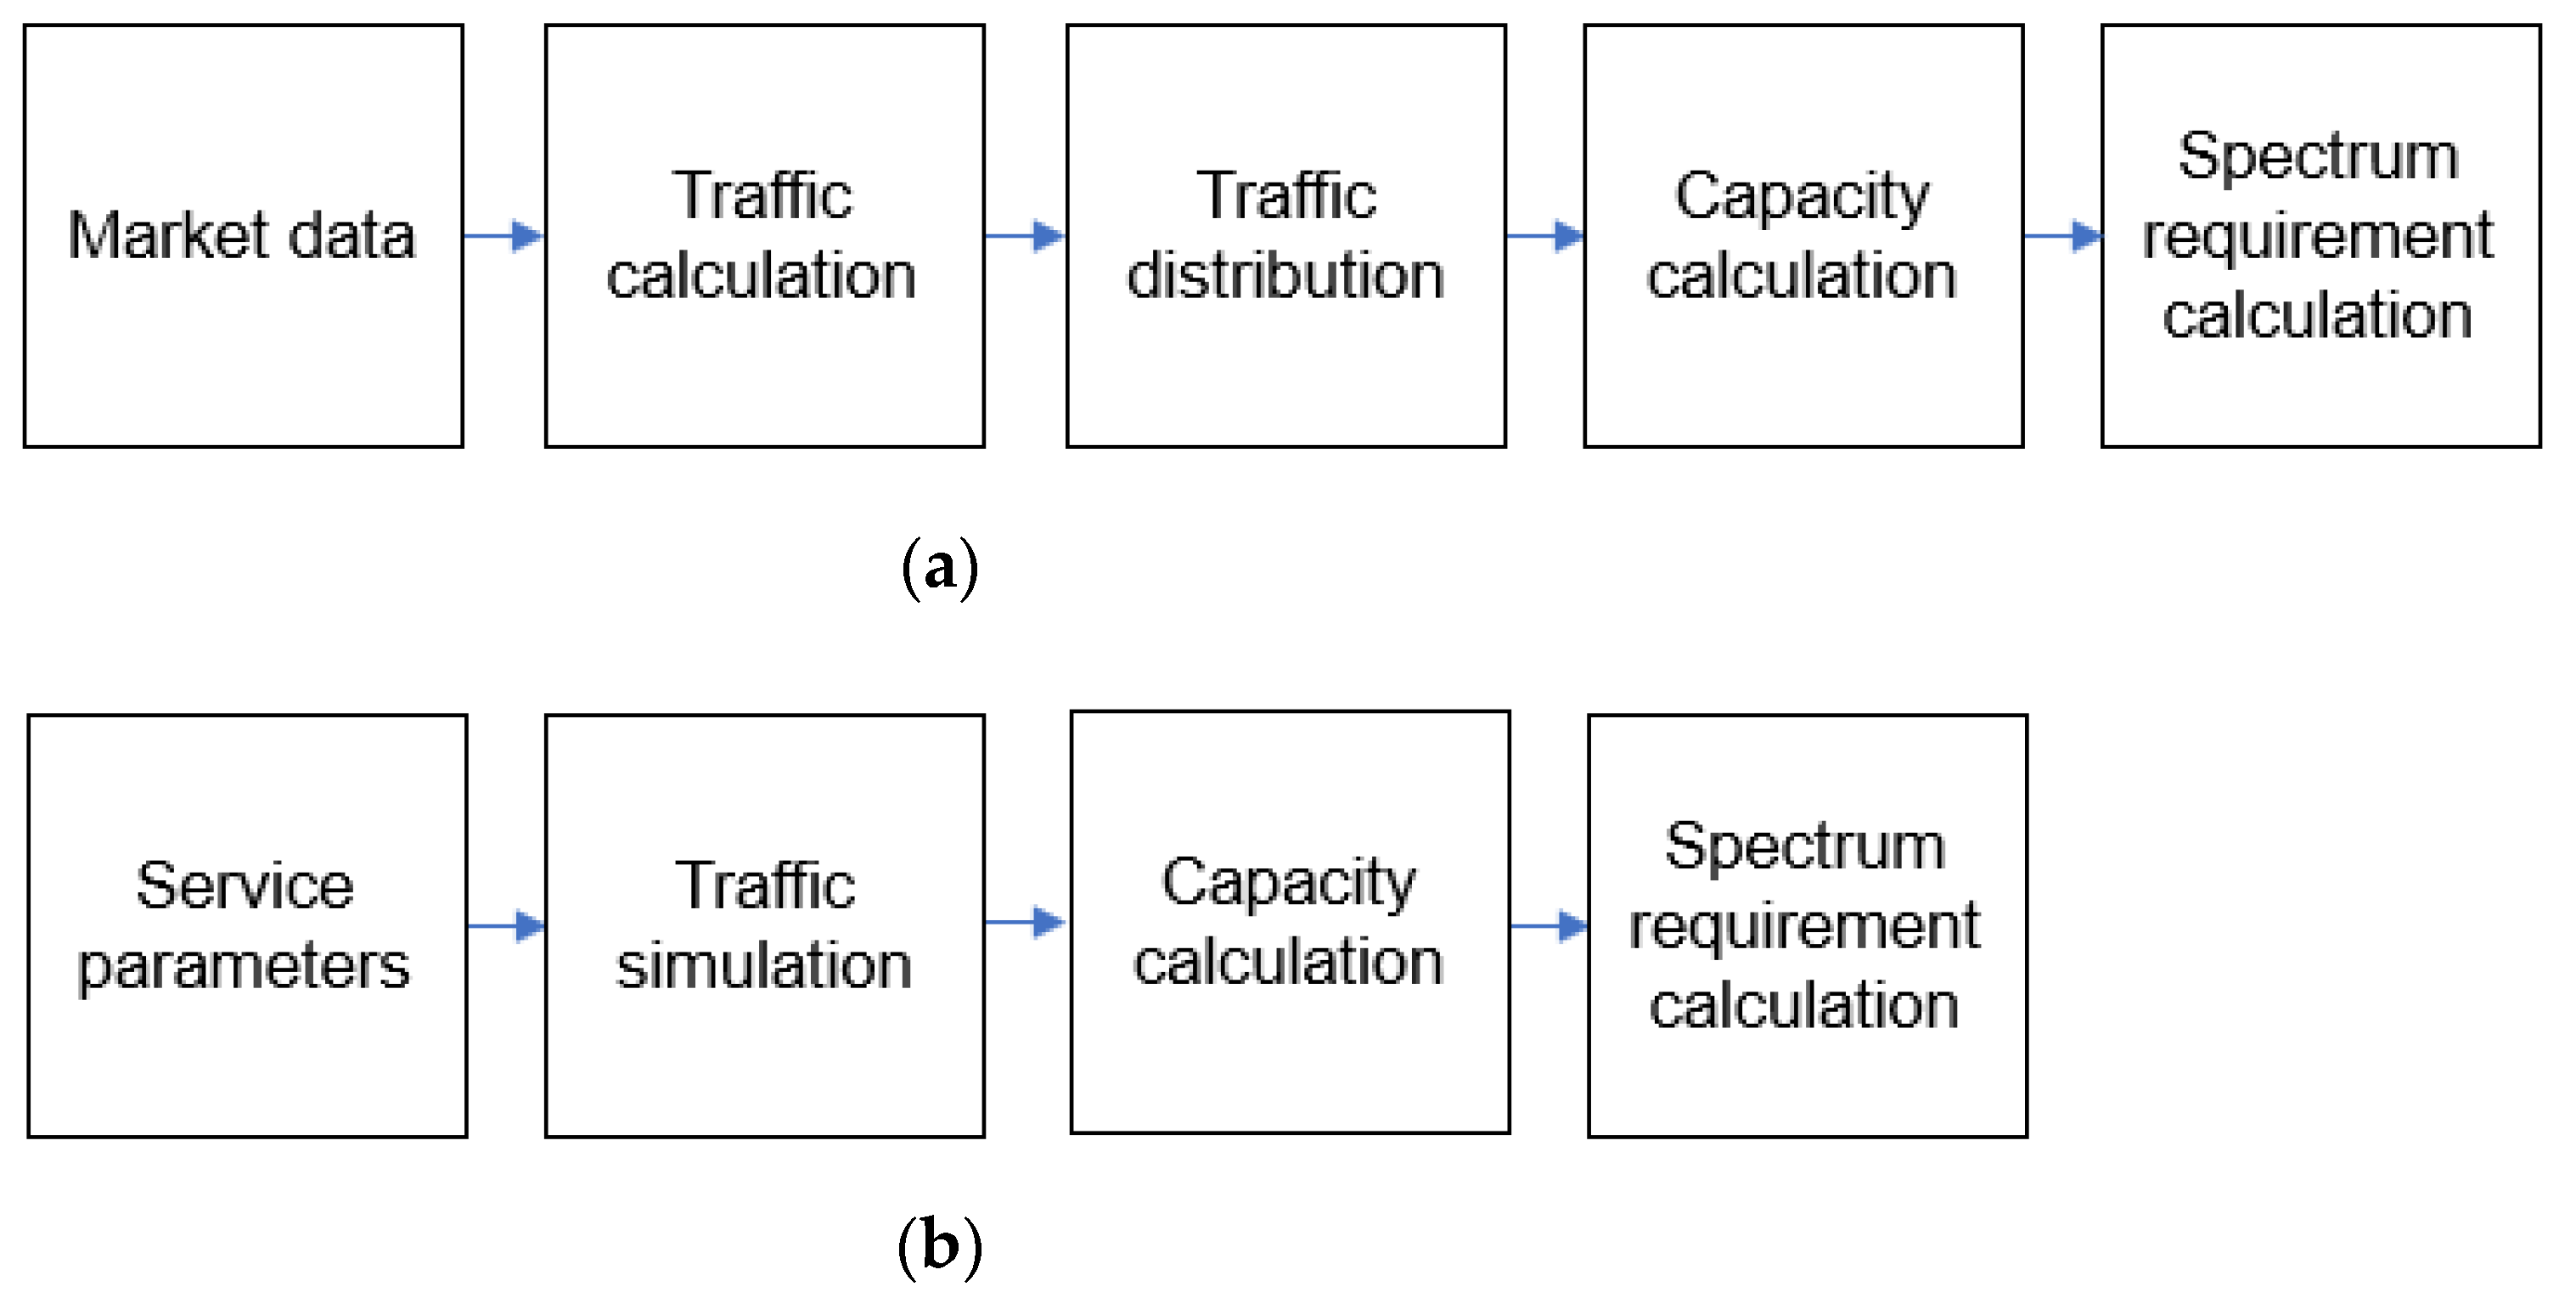
3. Proposed Methodology
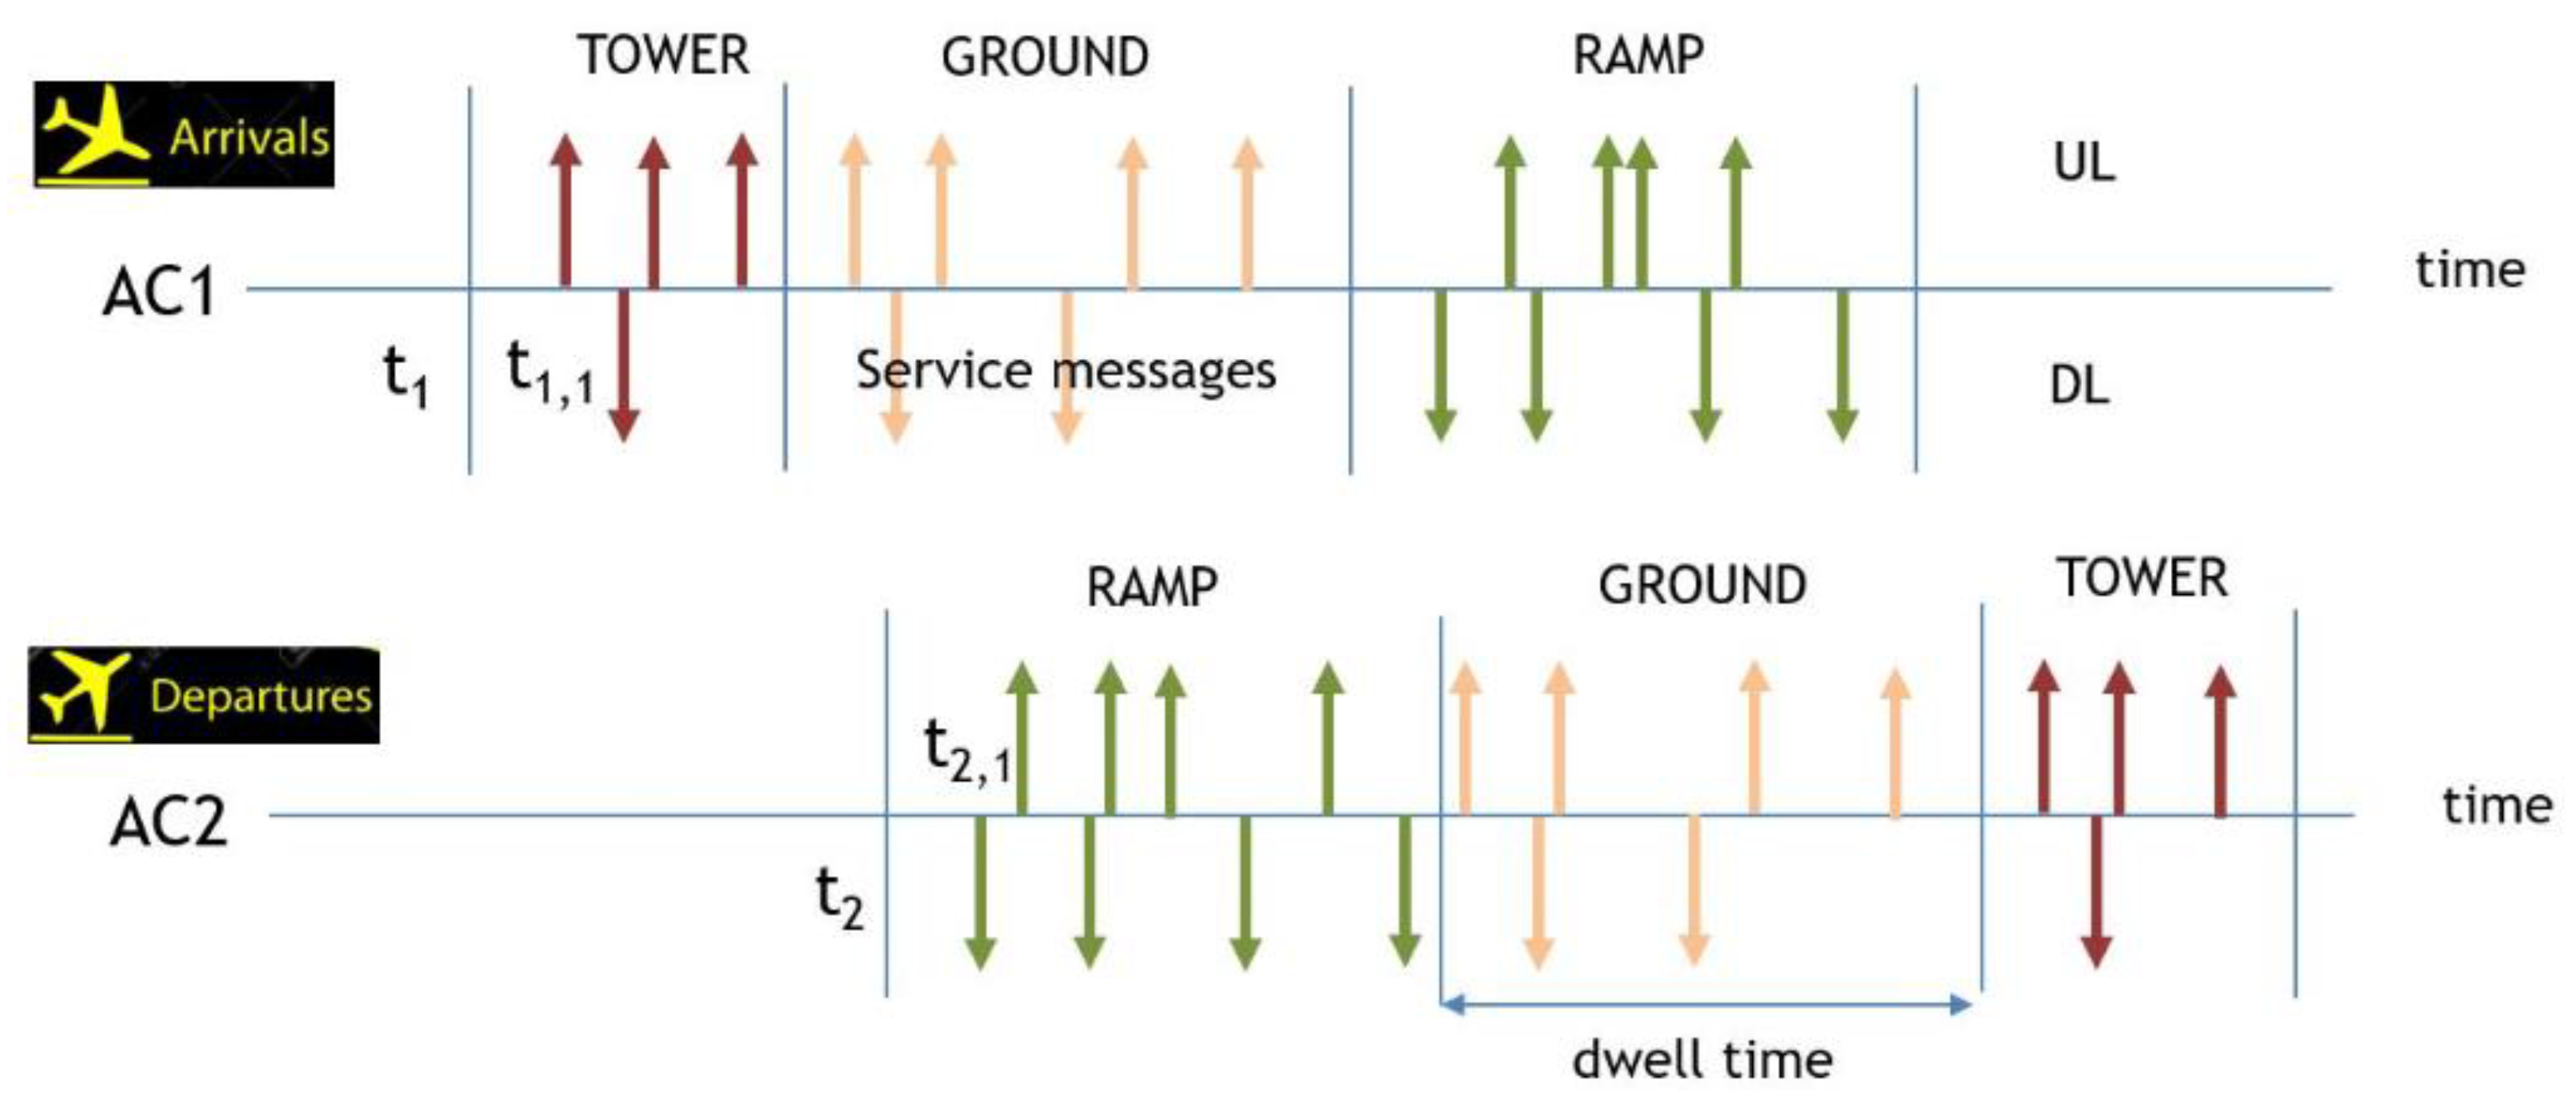
3.1. Traffic Simulation
- The number of aircraft in the airport should be a Poisson distribution.
- Each arrival and departure phase length (in seconds) should be a uniform distribution ±10% of the mean value.
- Arrival and departure rates are an exponential distribution to model the aircraft arrival and departure processes.
- The message generation time, , denoted by the kth message generation time of the nth aircraft should be a uniform distribution.
3.2. Calculation of Required System Capacity
- : the offered load for service category (SC) n.
- and : The mean and the second moment of the IP packet size distribution of each SC.
- The required mean delay of each SC.
- The priority ranking of all service categories n with . It is assumed that the service category has the highest priority.
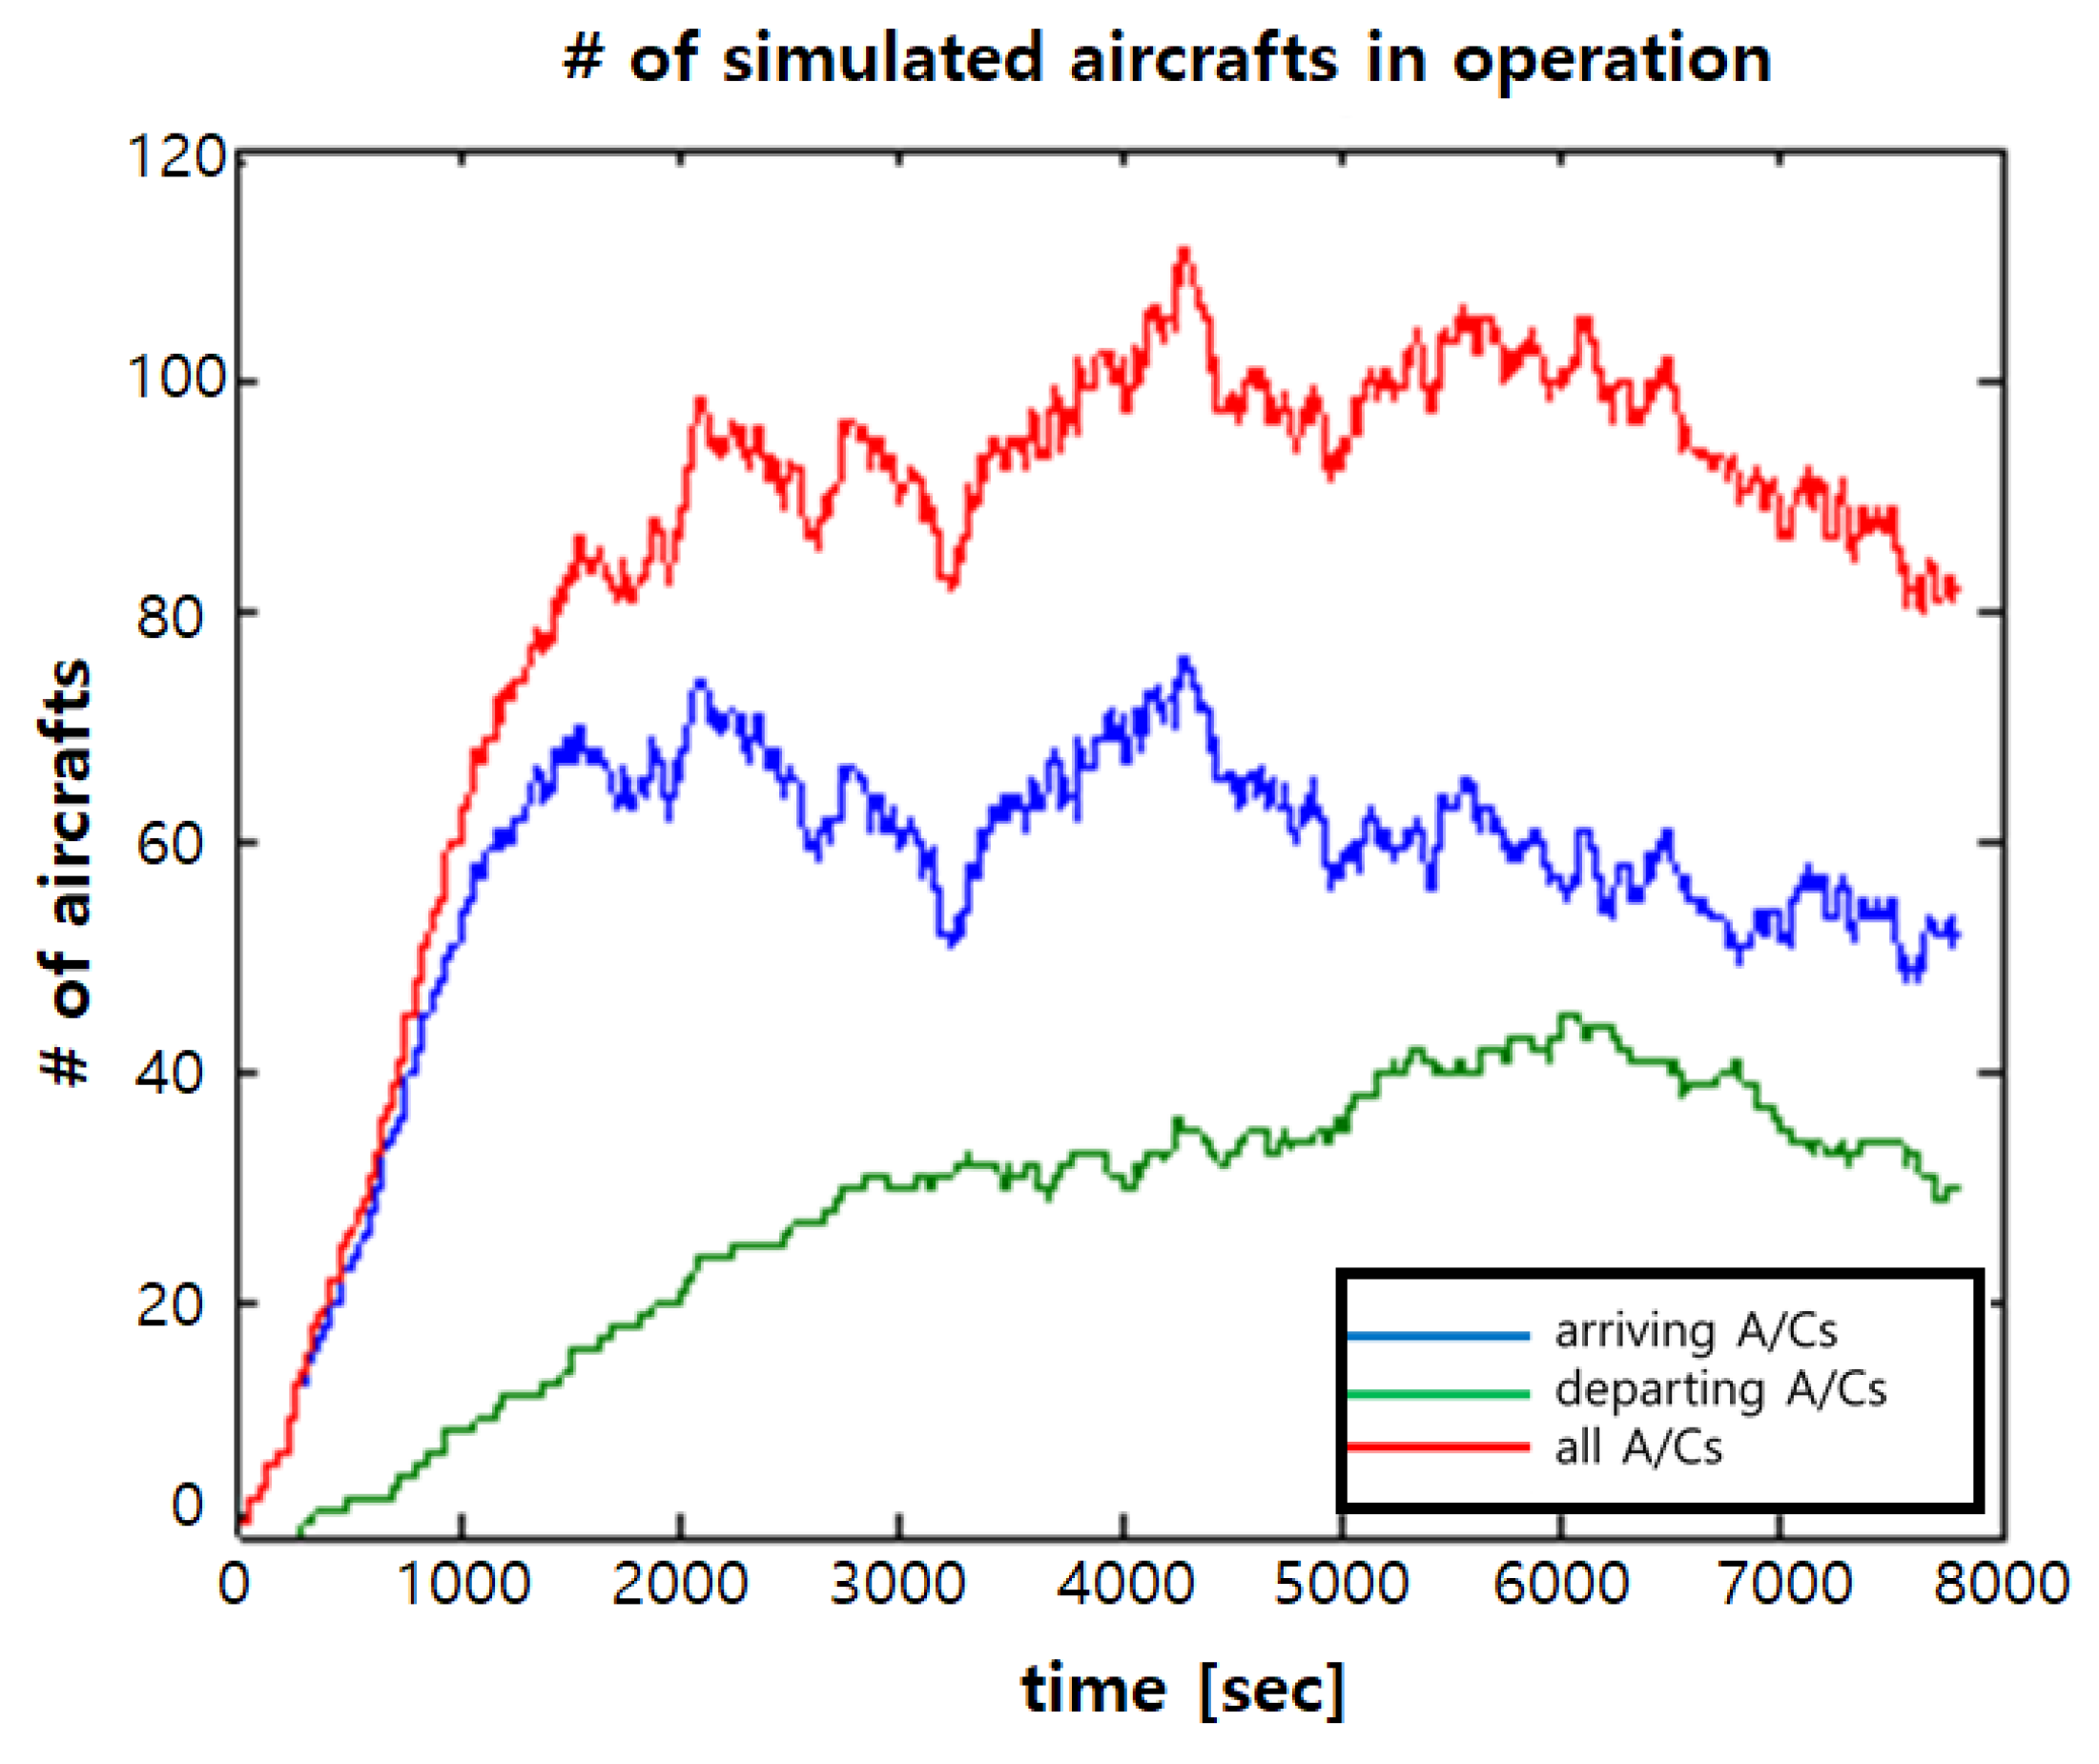
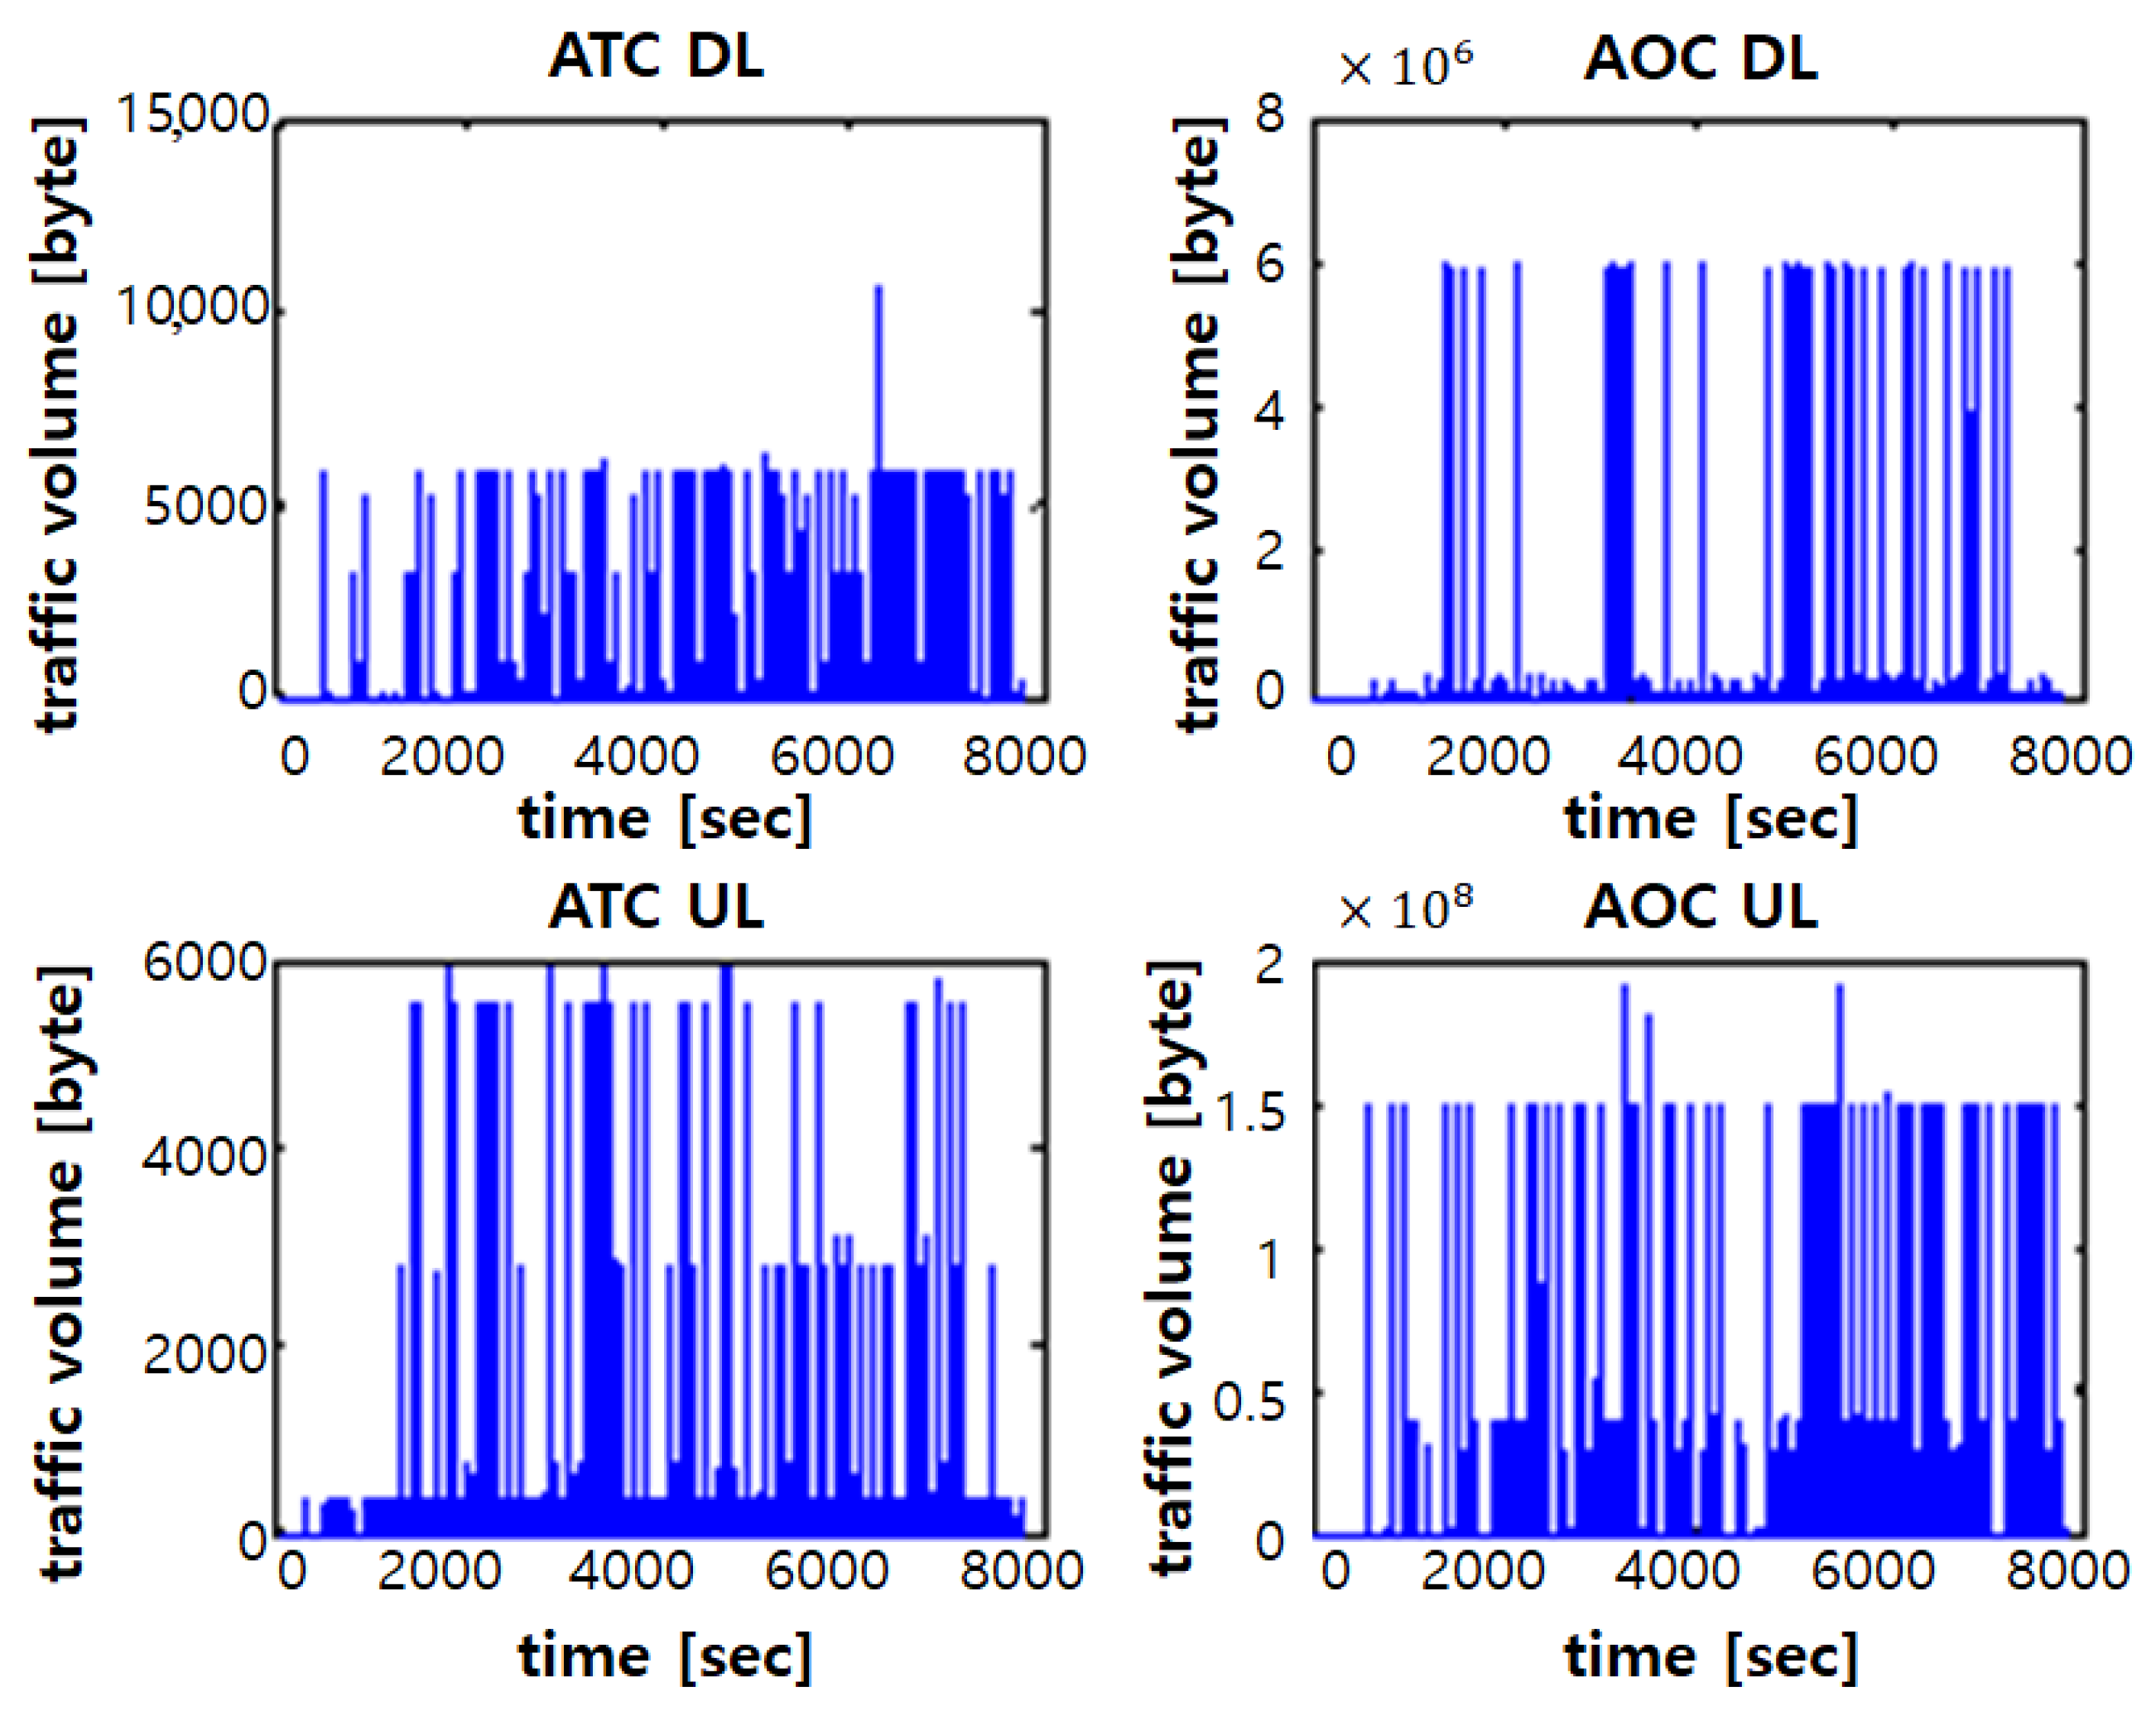
4. Simulation Study
4.1. Simulation Scenario
4.2. Results and Discussion
5. Conclusions
Author Contributions
Funding
Institutional Review Board Statement
Informed Consent Statement
Data Availability Statement
Conflicts of Interest
References
- WiMAX Forum. Mobile Protocol Implementation Conformance Statement (PICS) Proforma. WMF-T24-001-R010v09. 2012. Available online: https://wimaxforum.org/Document/Download/WMF-T24-001-R010v09_PICS (accessed on 11 May 2021).
- WiMAX Forum. Delivering Next Generation Communications to the Airport Surface; WiMAX Forum: Clackamas, OR, USA, 2015. [Google Scholar]
- EUROCAE. Ed-233 Minimum Operational Performance Standards (MOPS) for the Aeronautical Mobile Airport Communication System; European Organization for Civil Aviation Equipment (EUROCAE): Saint-Denis, France, 2013. [Google Scholar]
- EUROCAE. Ed-227 Minimum Aviation System Performance Standards (MASPS) AeroMACS; European Organization for Civil Aviation Equipment (EUROCAE): Saint-Denis, France, 2016. [Google Scholar]
- SARPs. ACP WG-S/6 13th-14th, Proposed aeronautical mobile airport communications system (AeroMACS) SARPs, final draft AeroMACS. Tech. Rep. 2014, 44, 433–443. [Google Scholar]
- Kang, J.; Jung, Y.; Kim, M.; Kim, Y. The next-generation airport communication systems building operation plan study report. Tech. Rep. Hankuk Aviation Univ. 2015, 1, 1–212. [Google Scholar]
- Kamali, B. “Introduction to AeroMACS,” in AeroMACS: An IEEE 802.16 Standard-Based Technology for the Next Generation of Air Transportation Systems. IEEE 2018, 259–304. [Google Scholar] [CrossRef]
- Zhang, Y.; He, L.; Liu, A. AeroMACS Application at HongQiao Airport of China. In Proceedings of the IEEE 2nd International Conference on Civil Aviation Safety and Information Technology (ICCASIT 2020), Weihai, China, 14–16 October 2020; pp. 1088–1093. [Google Scholar] [CrossRef]
- Liu, A.; Zhang, Y.; He, L. AeroMACS Field Trial at Guilin Airport of China. In Proceedings of the IEEE 1st International Conference on Civil Aviation Safety and Information Technology (ICCASIT 2019), Kunming, China, 17–19 October 2019; pp. 49–53. [Google Scholar] [CrossRef]
- Korowajczuk, L. AeroMACS Airport Network Design. In Proceedings of the Integrated Communications Navigation and Surveillance (ICNS 2016), Herndon, VA, USA, 19–21 April 2016; pp. 1–36. [Google Scholar] [CrossRef]
- Korowajczuk, L. AEROMACS Airport Network Design. In Proceedings of the Integrated Communications, Navigation and Surveillance Conference (ICNS 2019), Herndon, VA, USA, 9–11 April 2019; pp. 1–37. [Google Scholar] [CrossRef]
- Morioka, K.; Lu, X.; Kanada, N.; Futatsumori, S.; Yonemoto, N.; Sumiya, Y.; Kohmura, A. Field Taxing Experiments of Aircraft Access to SWIM over AeroMACS. In Proceedings of the IEEE Conference on Antenna Measurements & Applications (CAMA 2018), Vasteras, Sweden, 3–6 September 2018; pp. 1–4. [Google Scholar] [CrossRef]
- Morioka, K.; Naganawa, J.; Lu, X.; Miyazaki, N.; Kohmura, A.; Yonemoto, N.; Sumiya, Y. QoS validation tests for Aircraft Access to SWIM by Ground Taxiing Experiments. In Proceedings of the IEEE 14th International Symposium on Autonomous Decentralized System (ISADS 2019), Utrecht, The Netherlands, 8–10 April 2019; pp. 1–6. [Google Scholar] [CrossRef]
- ITU. Methodology for the calculation of IMT-2000 terrestrial spectrum requirements. Recommend. ITU 1999, 1, 1–23. [Google Scholar]
- ITU. Methodology for calculation of spectrum requirements for the terrestrial component of International Mobile Telecommunications. ITU-R Rec. M.1768-1 2013, 1, 1–40. [Google Scholar]
- Naganawa, J.; Morioka, K.; Kanada, N.; Honda, J.; Tomita, T.; Tajima, H.; Futatsumori, S.; Kohmura, A.; Yonemoto, N.; Sumiya, Y. An experimental evaluation on handover performance of AeroMACS prototype. In Proceedings of the Integrated Communications Navigation and Surveillance (ICNS 2016), Herndon, VA, USA, 19–21 April 2016; pp. 2C1-1–2C1-10. [Google Scholar] [CrossRef]
- Hu, Y.; Abdo, K.; BenSlama, F.; Ali, M.; Cormbe, Q.; Benamrane, F.; Luong, D.; Barossi, R. An SDN-based Aeronautical Communications Network Architecture. In Proceedings of the IEEE/AIAA 37th Digital Avionics Systems Conference (DASC 2018), London, UK, 23–27 September 2018; pp. 1–10. [Google Scholar] [CrossRef]
- Byrne, D. AeroMACS secure broadband connectivity for aviation D-Taxi via AeroMACS. In Proceedings of the Integrated Communications, Navigation and Surveillance Conference (ICNS 2017), Herndon, VA, USA, 18–20 April 2017; pp. 1–43. [Google Scholar] [CrossRef]
- Marcia, O. AeroMACS PKI. In Proceedings of the Integrated Communications, Navigation, Surveillance Conference (ICNS 2018), Herndon, VA, USA, 10–12 April 2018; pp. 1–15. [Google Scholar] [CrossRef]
- Mäurer, N.; Schmitt, C. Towards Successful Realization of the LDACS Cybersecurity Architecture: An Updated Datalink Security Threat- and Risk Analysis. In Proceedings of the Integrated Communications, Navigation and Surveillance Conference (ICNS 2019), Herndon, VA, USA, 9–11 April 2019; pp. 1–13. [Google Scholar] [CrossRef]
- Kamali, B. Adaptive Modulation-Coding Scheme for Link Adaptation in Aeronautical Mobile Airport Communications Systems (Aeromacs). In Proceedings of the Integrated Communications, Navigation and Surveillance Conference (ICNS 2019), Herndon, VA, USA, 9–11 April 2019; pp. 1–9. [Google Scholar] [CrossRef]
- Zolanvari, M.; Teixeira, M.A.; Jain, R. Analysis of AeroMACS Data Link for Unmanned Aircraft Vehicles. In Proceedings of the International Conference on Unmanned Aircraft Systems (ICUAS 2018), Dallas, TX, USA, 12–15 June 2018; pp. 752–759. [Google Scholar] [CrossRef]
- Naganawa, J.; Morioka, K.; Honda, J.; Kanada, N.; Yonemoto, N.; Sumiya, Y. Antenna configuration mitigating ground reflection fading on airport surface for AeroMACS. In Proceedings of the IEEE Conference on Antenna Measurements & Applications (CAMA 2017), Tsukuba, Japan, 4–6 December 2017; pp. 91–94. [Google Scholar] [CrossRef]
- SESAR. Study and characterization of the traffic model in the airport. Tech. Rep. SESAR 2011, 1, 1–40. [Google Scholar]
- SESAR. Study and characterization of the traffic model in the airport-Appendices. Tech. Rep. SESAR 2011, 1, 1–197. [Google Scholar]
- Ehammer, M.; Graupl, T.; Polo, E. AeroMACS data traffic model. In Proceedings of the Integrated Communications, Navigation, and Surveillance Conference (ICNS 2011), Herndon, VA, USA, 10–12 May 2011; pp. G5-1–G5-10. [Google Scholar] [CrossRef]
- Gheorghisor, I.; Lakshminarayan, V.; Globus, L.; Box, F. AeroMACS Analyses and Simulations for Spectrum Planning. In Proceedings of the Integrated Communications, Navigation, and Surveillance Conference (ICNS 2017), Herndon, VA, USA, 18–20 April 2017; pp. 2A3-1–2A3-12. [Google Scholar] [CrossRef]
- Gheorghisor, I.; Lakshminarayan, V.; Globus, L.; Arnstein, D.; Box, F. Analyses and Simulations for Aeronautical Mobile Airport Communications System. In Proceedings of the Integrated Communications, Navigation, and Surveillance Conference (ICNS 2016), Herndon, VA, USA, 19–21 April 2016; pp. 2C2-1–2C2-13. [Google Scholar] [CrossRef]
- Cobham, A. Priority assignments in waiting line problems. J. Oper. Res. Soc. Am. 1954, 2, 70–76. [Google Scholar] [CrossRef]


| Phase | Area | Services | ||
|---|---|---|---|---|
| NET | ATC | AOC | ||
| Arrival | Tower | NETKEEP | ACM | OOOI, AUTOLAND-REG |
| Ground | SURV, ACL, D-SIG, D-TAXI | EFFU, FLT-JOURNAL, TECHLOG, CREW-TIME | ||
| Ramp | ACM | OOOI, FOQA, FLTLOG, CABINLOG, ETS-REPORT, REFUEL | ||
| Departure | Ramp | NETCONN, NETKEEP | DLL, COTRAC, DOTIS, D-SIGMET, DCL, FLIPCY, FLIPINT, D-RVR, D-SIG, D-FLUP, PPD, D-TAXI | AOCDLL, LOADSHT, E-CHARTS, UPLIB, SWCONF, SWLOAD25, SWLOAD, BRFCD, ACLOG, TECHLOG, AIRWORTH, WXTEXT, PASSENGER, CREW-RPS, CREW-BUL, CREW-REG, FLTPLAN, NOTAM, EFF, WXGRAPH, CREW-L, HANDLING, CATERING, BAGGAGE, NOTOC, LOADDOC, PREFLT-INS, DOOR, FLOWCON, EFFU, TAKEOFF-CALC, OOOI |
| Ground | SURV, ACL, ACM | |||
| Tower | ACM | WXRT, OOOI | ||
| Area | SC | DL Traffic Volume [Kbps] | UL Traffic Volume [Kbps] | ||
|---|---|---|---|---|---|
| Arrival | Departure | Arrival | Departure | ||
| Tower | ATC | 0 | 0 | 0.13 | 0.09 |
| AOC | 2.69 | 2.01 | 0.06 | 0.12 | |
| Ramp | ATC | 1.68 | 1.18 | 0.92 | 0.64 |
| AOC | 1.10 | 0.67 | 0.14 | 0.15 | |
| Ground | ATC | 0.41 | 0.86 | 0.35 | 0.58 |
| AOC | 163.94 | 336.00 | 7691.73 | 16,280.31 | |
| Area | Tower | Ramp | Ground | ||||
|---|---|---|---|---|---|---|---|
| SC | ATC | AOC | ATC | AOC | ATC | AOC | |
| Arrival | DL [Kbps] | 0.034 | 0 | 0.282 | 0.522 | 0.034 | 0.086 |
| UL [Kbps] | 0.123 | 0.522 | 0.241 | 0.299 | 0.149 | 0.523 | |
| Departure | DL [Kbps] | 0.034 | 0 | 0.307 | 0.523 | 0.035 | 0.086 |
| UL [Kbps] | 0.123 | 0.523 | 0.234 | 0.501 | 0.149 | 0.523 | |
| Area | Tower | Ramp | Ground | ||||
|---|---|---|---|---|---|---|---|
| SC | ATC | AOC | ATC | AOC | ATC | AOC | |
| Arrival | DL [Kbps] | 1.175 | 0 | 120.67 | 279.68 | 1.20 | 7.56 |
| UL [Kbps] | 15.504 | 279.74 | 91.60 | 104.96 | 23.43 | 280.56 | |
| Departure | DL [Kbps] | 1.175 | 0 | 135.80 | 280.50 | 1.39 | 7.56 |
| UL [Kbps] | 15.504 | 280.29 | 89.52 | 262.91 | 23.42 | 280.56 | |
| Maximum Coverage [%] | Spectral Efficiency [bps/Hz] | |
|---|---|---|
| UL | 3 | |
| 2 | ||
| 1.5 | ||
| 1 | ||
| 0.5 | ||
| DL | 4.5 | |
| 4 | ||
| 3 | ||
| 2 | ||
| 1.5 | ||
| 1 |
| Maximum Coverage [%] | Spectral Efficiency [bps/Hz] | |
|---|---|---|
| UL | 3 | |
| 2 | ||
| 1.5 | ||
| 1 | ||
| 0.5 | ||
| DL | 4.5 | |
| 4 | ||
| 3 | ||
| 2 | ||
| 1.5 | ||
| 1 |
| Area | Ramp | Tower | Ground |
|---|---|---|---|
| Number of sectors | 3 | 1 | 3 |
| Number of sectors per site | 2 | 1 | 3 |
| Total number of sectors | 6 | 1 | 9 |
| Cell radius [km] | 0.7 | 2.5 | 1.44 |
| Maximum coverage area [%] | 73.7 | 100 | 57.7 |
| DL Spectral efficiency [bps/Hz] | 0.5 | 0.5 | 1.0 |
| UL Spectral efficiency [bps/Hz] | 1.5 | 0.5 | 1.0 |
| Area | Spectrum Requirement [MHz] | |
|---|---|---|
| Arrival | Departure | |
| Tower | 0.00512 | 0.00685 |
| Ramp | 0.01694 | 0.01153 |
| Ground | 0.94152 | 1.89747 |
Publisher’s Note: MDPI stays neutral with regard to jurisdictional claims in published maps and institutional affiliations. |
© 2021 by the authors. Licensee MDPI, Basel, Switzerland. This article is an open access article distributed under the terms and conditions of the Creative Commons Attribution (CC BY) license (https://creativecommons.org/licenses/by/4.0/).
Share and Cite
Shin, H.-G.; Kim, H.-J.; Lee, S.-W.; Yoon, H.-G.; Choi, Y.-H. Calculation of AeroMACS Spectrum Requirements Based on Traffic Simulator. Sensors 2021, 21, 3343. https://doi.org/10.3390/s21103343
Shin H-G, Kim H-J, Lee S-W, Yoon H-G, Choi Y-H. Calculation of AeroMACS Spectrum Requirements Based on Traffic Simulator. Sensors. 2021; 21(10):3343. https://doi.org/10.3390/s21103343
Chicago/Turabian StyleShin, Hong-Gi, Hyung-Jung Kim, Sang-Wook Lee, Hyun-Goo Yoon, and Yong-Hoon Choi. 2021. "Calculation of AeroMACS Spectrum Requirements Based on Traffic Simulator" Sensors 21, no. 10: 3343. https://doi.org/10.3390/s21103343
APA StyleShin, H.-G., Kim, H.-J., Lee, S.-W., Yoon, H.-G., & Choi, Y.-H. (2021). Calculation of AeroMACS Spectrum Requirements Based on Traffic Simulator. Sensors, 21(10), 3343. https://doi.org/10.3390/s21103343