Article

Parametric Study of Bolt Clamping Effect on Resonance Characteristics of Langevin Transducers with Lumped Circuit Models

Department of Electronic Engineering, Kwangwoon University, Seoul 01897, Korea
*
Author to whom correspondence should be addressed.
Sensors 2020, 20(7), 1952; https://doi.org/10.3390/s20071952
Submission received: 29 February 2020 / Revised: 24 March 2020 / Accepted: 30 March 2020 / Published: 31 March 2020

Abstract

:
We recently proposed a numerical model using equivalent circuit models to analyze the resonance characteristics of Langevin transducers and design them in a systematic manner. However, no pre-load torque biased by a metal bolt was considered in the model. Here, a parametric study is, therefore, carried out to reveal how model parameters are adapted to incorporate the pre-compression effect into our existing model. Analytical results are compared with corresponding experimental data, particularly regarding the input electrical impedance and effective electromechanical coupling coefficient for the transducer at resonance modes. The frequency response of input impedance is presented as a function of torque, both theoretically and experimentally. For 10.0 N·m bias, for instance, both resonance and anti-resonance frequencies are calculated as 38.64 kHz and 39.78 kHz, while these are measured as 38.62 kHz and 39.77 kHz by the impedance analyzer. The impedance difference between these cases is 14 Ω at resonance and 9 kΩ at anti-resonance, while the coupling coefficients in both cases become 0.238 and 0.239, respectively. Hence, these test results are closely matched with their theoretical values. Consequently, this study provides a quantitative guideline that specifies the pre-loading condition of bolt clamps with proper parameter settings to predict the intended resonance characteristics of Langevin transducers.

1. Introduction

Bolt-clamped transducers, also known as Langevin transducers, are widely used, giving rise to a boosted ultrasound transmission for various industrial or medical applications including welding [1], cleaning [2], and liposuction [3]. In many cases, mechanical energy carried by acoustic waves in a frequency range of tens of kHz often disrupts the molecular integrity of metal or fatty structures by interrogating a highly focused ultrasound beam at their specified areas. Several analytical studies were, thus, carried out to propose design methods of Langevin transducers for such uses [4,5,6].
The typical transducer structure is composed of piezoelectric layers, front/back masses, a horn, and a metal bolt. A pre-stressed central bolt clamps one or more pairs of piezo-rings, particularly made of lead zirconate titanate (PZT), with other acoustically passive elements in order to apply mechanical bias to the whole transducer. Recently, we devised a systematic design approach based on equivalent circuit models to examine the resonance characteristics of therapeutic Langevin transducers [7]. In that study, Mason’s model consisting of two mechanical ports and one electrical port separated through an ideal transformer was used to describe the complex behavior of piezoelectric ceramics, while the T-network model was used to represent other passive parts of the transducer. Design variables were inherent material properties of each element, e.g. their physical dimension, acoustic impedance, dielectric constant, etc., Simulation results regarding input impedance and electromechanical coupling coefficient were presented under various conditions, demonstrating that our model was capable of specifying the desired resonance feature within an acceptable margin.
Although the piezoelectric layer is sandwiched between front and back masses by a bolt of high tensile strength, little attention was paid to the proposed model to accommodate pre-compressive bias or the pre-load applied by the bolt. In order to withstand higher loads and guarantee effective energy transfer, the piezoelement needs to be placed under a compressive stress through the pre-loading process. In this paper, therefore, the loading effect of the bolt clamp is further investigated with our aforementioned model. Since the pre-loaded stress may give rise to changes in electrical quantities, the intrinsic properties of piezo-layers, such as sound speed, are varied to calculate the magnitude of input electrical impedance as a function of frequency. Resonance and anti-resonance frequencies are identified from the impedance curve, and its effective electromechanical coupling coefficient is subsequently estimated. A comparison between simulation and experimental results is undertaken, and a relevant discussion is presented in the following sections.

2. Materials and Methods

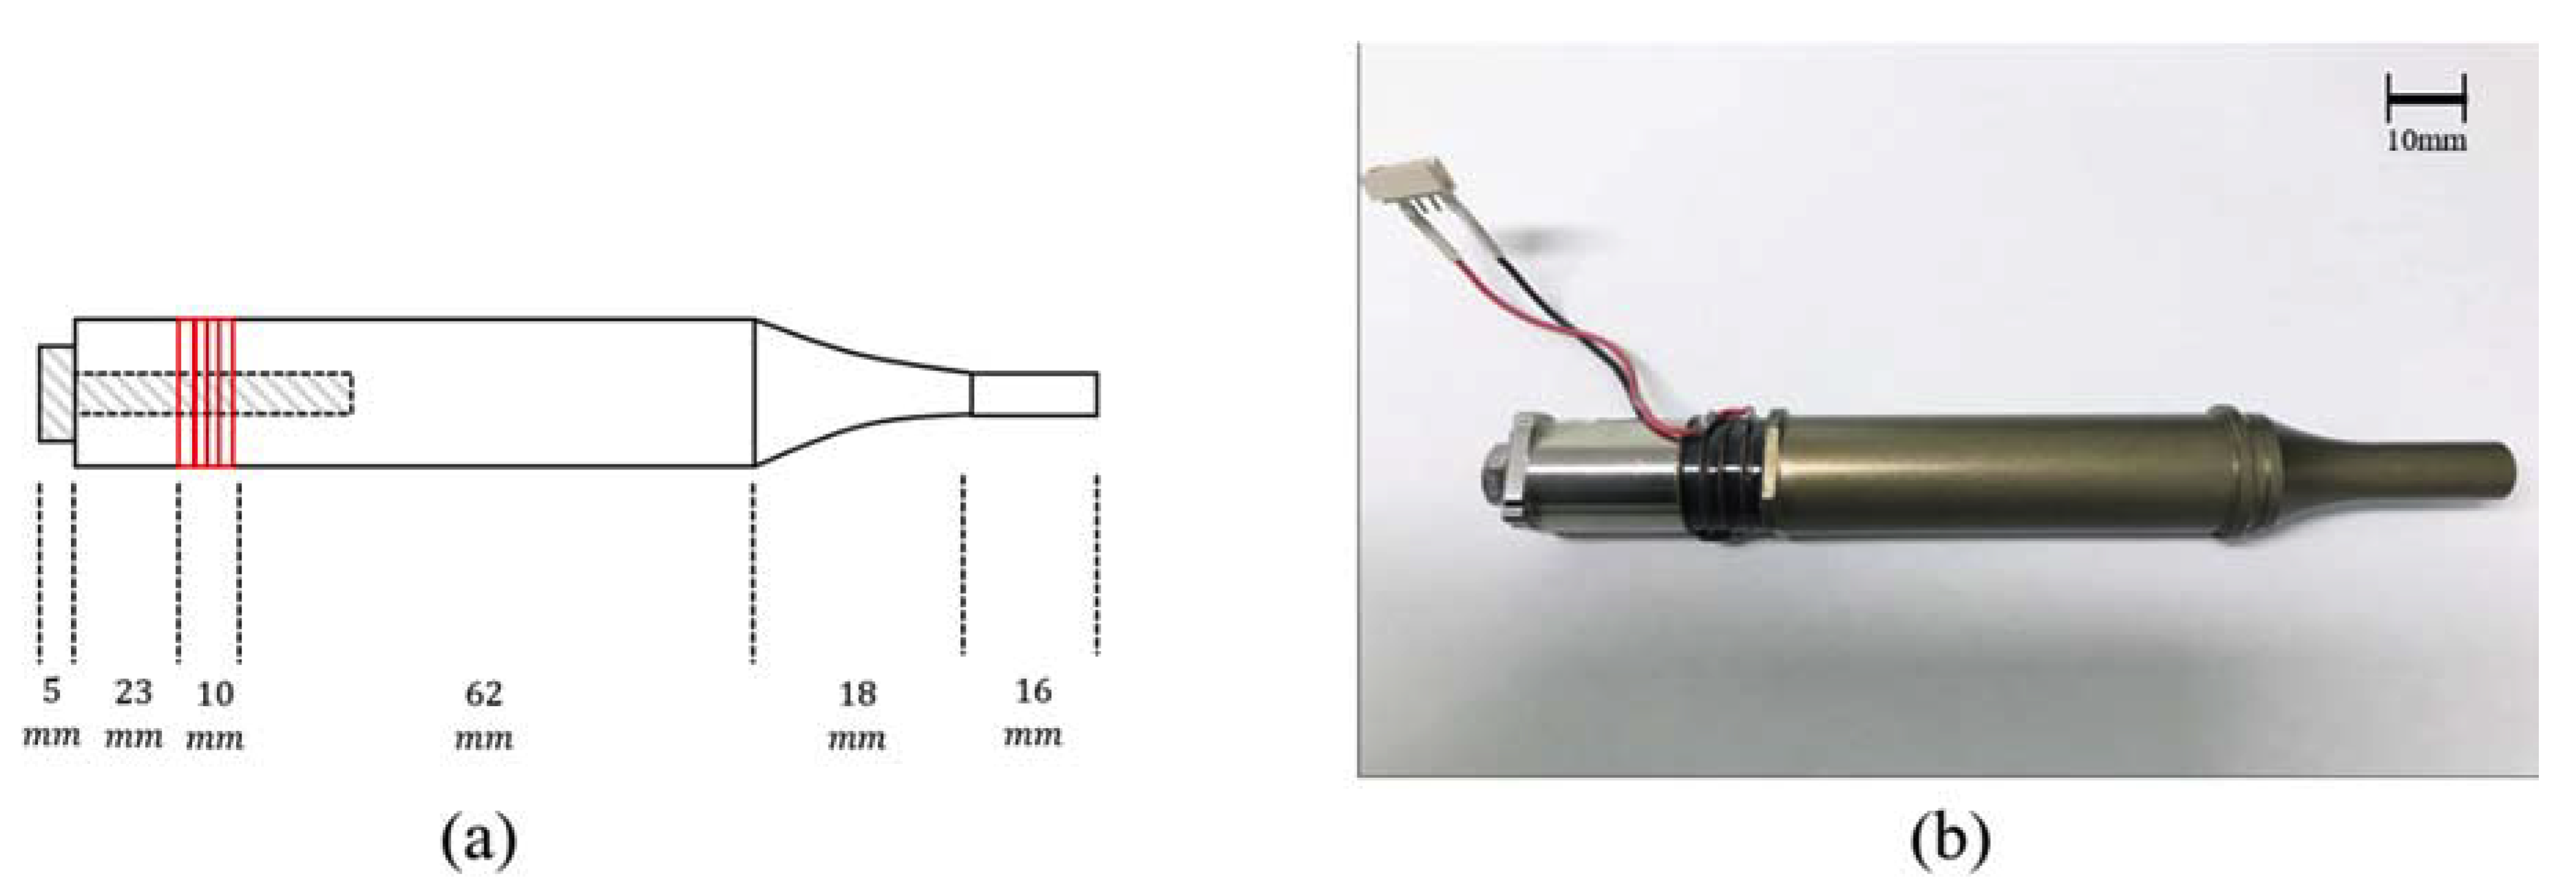
2.1. Structure of Langevin Transducers

Typical Langevin transducers comprise a piezoelectric stack, metal mass, central bolt, and ultrasonic horn booster, as illustrated in Figure 1. The piezoelectric layer is sandwiched between back and front masses which are clamped together by the bolt, and the transducer parts are entirely mechanically assembled in series.
The diagonally lined area represents the pre-loaded bolt that goes through the back mass, piezoelectric layer, and front mass at once. Stainless steel of high fatigue strength and low mechanical loss is most commonly preferred for the bolt material. One or more PZT-4 pairs are used to fabricate high-power transducers since PZT has a high mechanical Q-factor and low mechanical and dielectric losses. The back mass reflects longitudinal waves from piezoelectric elements in the forward direction, and the appropriate material for this is also stainless steel due to its high acoustic impedance and mass density. The front mass, such as aluminum, facilitates forward acoustic energy transmission and is required to meet lower acoustic impedance than that of piezoelectric layers. The horn-shaped element serves as a power booster to amplify the acoustic energy and may have various auxiliary tools attached—e.g., a welding tool and surgical instrument—to the front end.
In order to specify the longitudinal dimension of a Langevin transducer, the half-wavelength principle is exploited to determine each length of the transducer part that requires integer multiples of half wavelength λr/2 at resonance frequency fr. This constraint is employed to make sure of the free stress boundary condition at both ends of each part. Individual elements are then assembled and finally form a complete resonating device [8].

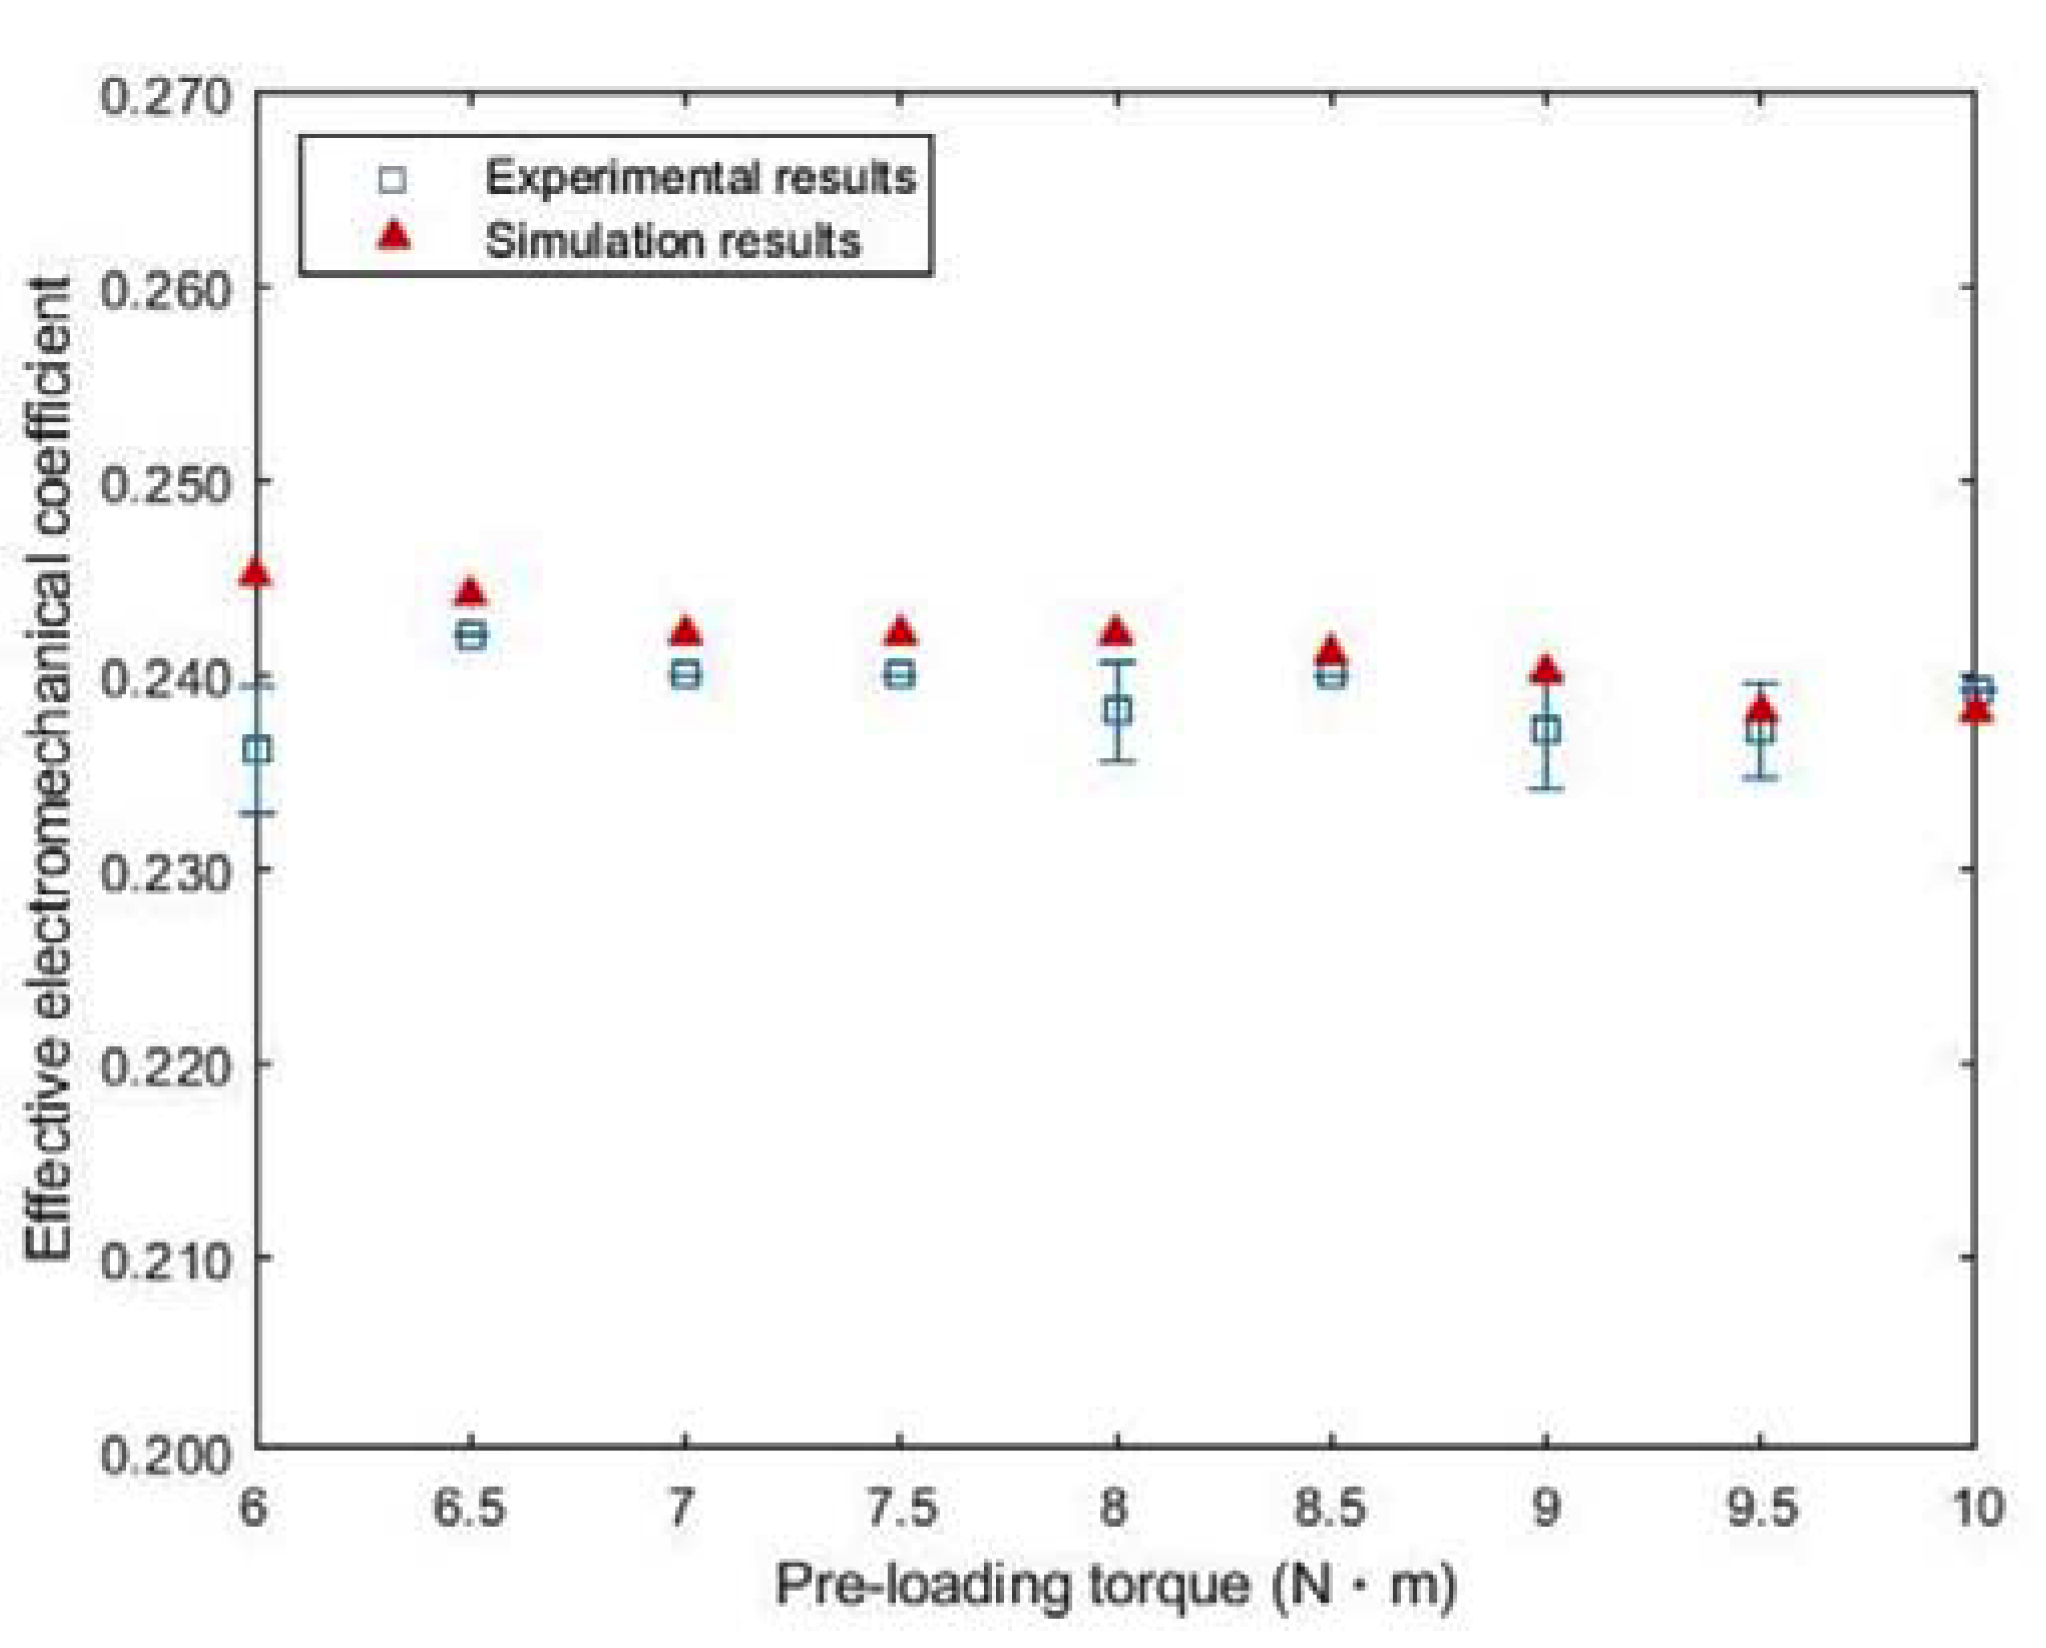
2.2. Metal Bolt vs. Electromechanical Coupling Coefficient

The piezoelectric tensile stress needs to be reinforced to maximize the magnitude of longitudinal oscillation by providing piezoelectric elements with consistent compressive torque. In this regard, a metal bolt plays a crucial role in clamping through the front and back masses as it prevents the transducer from operation failures, such as depolarization and the structural distortion of piezoelectric materials. Proper pre-load torque maintains the solid contact of each interface between the acoustic stacks, and, in turn, longitudinal pressure transmits throughout the transducer with minimal mechanical loss. However, the piezoelectrical constant is decreased when the compressive stress becomes excessive [9]. Such a decrease may adversely affect both the polarization and mechanical loss of piezo-layers, leading to unexpected temperature surges [10].
Along with the conversion ratio between the mechanical and electrical energy applied to or from the piezoelectric element in thickness mode, the electromechanical coupling coefficient kt is expressed in Equation (1), where fr is the resonance frequency and fa is the anti-resonance frequency of a piezoelectric part. Other studies already showed that such a compression of the piezoelement by a stiff metal component may influence the transducer’s resonance feature, with kt being the result [11,12].
k t = ( π 2 f r f a ) cot ( π 2 f r f a )
In addition, the clamped capacitance C0 of a piezo-material is dependent on kt, as expressed in Equation (2). A is the area, ε0 is the relative dielectric constant, εr is the relative dielectric constant, L is the length, and n is the number of piezoelectric layers.
C 0 = ( n A ε 0 ε r ) ( 1 k t 2 ) L
In practice, the effective coupling coefficient keff is used with Equation (3) to evaluate the sensitivity of the transducer.
k e f f = 1 f r 2 f a 2

2.3. Equivalent Circuit Model

A numerical model is formulated to calculate the electrical input impedance of Langevin transducers over a certain frequency range. There are various equivalent models for representing the complex behavior of the piezoelectric material including Krimholtz, Leedom, and Matthae (KLM), Mason, Van Dyke, and Leach models [13,14,15]. Among them, the Mason model exhibits simpler electrical analogy than the others, consisting of two terminal impedances, a cross-impedance, and a clamped capacitance separated through an ideal transformer. Passive components including front/back masses and booster horns are then described with a T-shaped equivalent circuit [16]. This T-circuit model is capable of considering a variety of cross-sections and, therefore, the effect of curved profiles such as exponentially shaped horns can be reflected by the electrical impedance of the transducer. Finally, these two lumped circuits are connected in series to form a complete analytical model of the transducer. More details on our analytical model can be found in Reference [7].

2.4. Fabrication of Langevin Transducers

The transducer architecture is given in Figure 2a, where the length of each component is indicated. Lathe work is done to process cylinder-shaped stainless steel with a hole for the insertion of a pre-loading bolt. The number of piezoelectric elements used in the design depends on the application of the transducer, target resonance frequency, and electrical loading condition [17]. As in typical medical devices [18], four PZT-4 (c-203, Fuji Ceramic Corporation, Fujinomiya, Japan) rings are positioned between two metal masses. Each thickness of 2.5 mm is determined to meet the constraint of the half-wavelength rule at 38 kHz. To excite the transducer with a sinusoidal signal, 0.1-mm copper–nickel plates are inserted between adjacent PZT-4 layers, where the plate thickness is considered negligible in our model. Electrical contact is set by wires attached to the side of PZT-4 layers with conductive paste.
For efficient transmission, aluminum is employed as the front mass due to its durability, ease of manufacture, and lower acoustic impedance than PZT-4. Both back and front masses are electrically grounded via a black lead line, as shown in Figure 2b. There are a variety of booster shapes, including stepped horn, conical horn, Gaussian-curved horn, and so on. We use an exponentially shaped horn here because it allows structural stability, a proper amplification ratio, and design simplicity through lumped circuit models [19]. The decaying rate at which the horn’s cross-sectional area decreases is 34.7 m−1 in the axial direction. Front/back masses and PZT-4 stacks are clamped at once with stainless steel bolt through a center hole. In general, part of the transducer including the front mass and horn is immersed in liquid media during operation, and the corrosion resistance needs to be enhanced by proceeding with the anodizing treatment on the front surface. Finally, the individual material properties and physical dimensions for each transducer part are summarized in Table 1.

3. Results

Based on the equivalent circuit model derived so far, a MATLAB simulation was carried out to calculate the electrical input impedance with a target resonance frequency at 38 kHz. To verify our analytical results, the magnitude of the input impedance was measured with an impedance analyzer (4294A, Agilent, Santa Clara, CA, USA), while the pre-loaded torque ranging from 6.0 N·m to 10.0 N·m was produced with increment of 0.5 N·m by a digital torque-wrench (WPC3-030, Bluetec, Taichung, Taiwan). Here, it was observed that the torque increment led to a nonlinear change in the strain–stress relationship of PZT-4 and, in turn, the Young’s modulus. The tangential slope of the strain–stress curve varied from 5.16 to 5.99 × 10¹⁰ N/m2, depending on the applied torque. Sound speed in materials—one of our model parameters—explicitly influences other parameters such as terminal and cross-impedances in the Mason model and T-circuits. Note that the square of the sound speed is proportional to the modulus. Under the saturation of Young’s modulus toward stronger torque, the sound speed in PZT-4 was, thus, adjusted from 2591 m/s to 2791 m/s and linearly increased by 25 m/s for the sake of simplicity. Each torque–resonance test was repeated twice to provide statistical measurements. The number of test rounds was carefully chosen, since the excessive repetition of a compression–release procedure leads to metal fatigue, which adversely affects the mechanical integrity of the transducer. A one-hour aging period after bolt clamping is necessary to make sure that the torque fully settles throughout the transducer.
The impedance curves from simulation and measurement data are depicted in Figure 3. fr and fa were computed at 37.96 kHz and 39.15 kHz in simulation, where their corresponding impedances were 23 Ω and 55 kΩ, respectively. The resultant keff was then 0.245. According to the impedance analyzer test, in contrast, these frequencies were found at 37.71 kHz and 38.83 kHz, respectively, where the measured average keff was 0.236. The measured impedances were 35 Ω and 18 kΩ. The difference in keff between the model and experimental results was 2.5%.
However, a relatively marked discrepancy in both the resonance location and the impedance was observed under weak clamping condition. This may occur when a resonance component is unexpectedly introduced to the PZT-4 stack due to insufficient compression. An earlier work showed that additional anti-resonance can reduce the overall frequency response of vibration by the equivalently cascading supplementary series impedance, which represents the inertial and elastic lumped elements with the sandwiched stack [23].
Similarly, the pre-loading effect of the bolt clamp on resonance characteristics is further examined in 8.0 N·m and 10.0 N·m cases. For 8.0 N∙m compression in Figure 4a, fr, fa, and keff were 38.30 kHz, 39.47 kHz, and 0.242 in the model estimation, whereas these values were 38.32 kHz, 39.42 kHz, and 0.235 in the equipment test. The difference in keff was 2.9%. Input impedances were 27 Ω and 22 Ω at resonance, and 49 kΩ and 33 kΩ at anti-resonance. Impedance differences at these resonance peaks were, thus, 5 Ω and 16 kΩ, respectively. For 10.0 N·m stress, in addition, the same dataset was obtained in Figure 4b as 38.64 kHz, 39.78 kHz, and 0.238 for computation, while these values were 38.62 kHz, 39.77 kHz, and 0.239 for measurement. The error in keff was 0.4%. Impedances for simulation and test were 31 Ω and 17 Ω at resonance, and 43 kΩ and 34 kΩ at anti-resonance. The impedance differences in each resonance mode were then 14 Ω and 9 kΩ. Hence, the pre-loading condition was less correlated with keff than with impedance change as higher torque was applied.
The minimum impedance difference was achieved for 8 N·m at resonance and was suitable for driving the transducer with peripheral instruments which were electrically matched at 50 Ω. As the torque increased from 6 N·m to 10 N·m, the impedance discrepancy at anti-resonance rapidly dropped from 37 kΩ to 9 kΩ. This can be justified since series impedance terms that may be added to existing piezoelectric impedance are more likely to be neglected under stronger torque, as discussed in Reference [23].
The measured impedance spectrum is plotted in Figure 5 as a function of pre-loading torque. When the torque changed from 6.0 N·m to 10.0 N·m, the magnitude of the impedance at resonance reduced from 36 Ω to 18 Ω, while it increased from 19 kΩ to 40 kΩ at anti-resonance. Such distinct impedance characteristics can be explained by the presence of parasitic capacitances [24], which are considered to be connected to the piezoelement in parallel at resonance and in series at anti-resonance. These capacitive terms may have nonlinear dependence on the torque, as resulting from multiple capacitors formed by pairs of PZT-4 and electroplate. By adding these extra impedance terms, as a result, the total equivalent impedance of PZT-4 can decrease at resonance and conversely increase at anti-resonance. Both model estimates and experimental data regarding keff deviated within a narrow margin, as represented in Figure 6. In particular, the analytical results indicate that the maximum keff was 0.245 at 6.0 N∙m, and its minimum value was 0.238 for 9.5 N·m and 10 N·m. Meanwhile, the measured keff reached its maximum value at 0.242 for 6.5 N·m, and the minimum value was 0.236 for 6.0 N·m. Since, however, keff is computed with Equation (3) assuming a linear regime, our model may not exactly reflect the nonlinear resonance caused by compressive force. In fact, the keff value for simulation was greater than its measured result only when the applied torque was below 8 N·m. A slight decrease in keff beyond 8.5 N·m may have arisen from the depolarization of PZT-4 induced due to increased pressure on its surface [25].
As the bolt tightened, a frequency shift in resonance behavior noticeably occurs toward higher frequency, but the variation of keff was less apparent in test results. From 7.0 N·m to 8.5 N·m, for example, keff remained constant at 0.240 except for the value of 0.235 for 8.0 N·m in Table 2. In contrast, a similar experimental trend was seen in the same torque range, showing in Table 3 that keff was determined to be 0.242 except for the value of 0.241 in 8.5 N·m. This finding implies that it is possible for us to select a target resonance band without considerably compromising the transducer sensitivity.

4. Conclusions

This paper investigated the effect of mechanical bias on the resonance characteristics of Langevin transducers by comparing numerical estimates with experimental results. Both the Mason and T-shaped equivalent circuit models were employed to analyze the magnitude of input electrical impedance over a given torque range. It was assumed that bolt clamping gave rise to the change in the elastic property of transducers, which enabled us to vary the sound speed of piezoceramics in our theoretical model. As a function of pre-loaded torque by metal bolts, the impedance spectrum was acquired both numerically and experimentally along with its electromechanical coupling coefficient. This parametric study proposes an effective way to include a compressive stress factor in transducer design in association with physical size, material property, resonance bandwidth, and so on. The results obtained here do not fully justify the complex resonance behavior of transducers, since many parameters in our model are linked with each other and there is a restriction to assessing their collective behavior by using any single factor. However, this lumped-circuit based approach can still provide approximate solutions to the stress-involved resonance problem in a more simplified manner by selecting the most explicitly affected factor as a variable. In subsequent works, stress- or temperature-dependent parameters such as the piezoelectric constant and dielectric permittivity [26,27] may be incorporated into our existing model by supplementing relevant lumped elements to evaluate nonlinear piezoelectric characteristics.

Author Contributions

Conceptualization, J.K. and J.L.; investigation, J.K.; writing—original draft preparation, J.K.; writing—review and editing, J.L.; supervision, J.L. All authors read and agreed to the published version of the manuscript.

Funding

This research was supported by Korea Electric Power Corporation (Grant number: R17XA05-36) and the Research Grant of Kwangwoon University in 2017.

Conflicts of Interest

The authors declare no conflicts of interest.

References

  1. Parrini, L. Design of advanced ultrasonic transducers for welding devices. IEEE Trans. Ultrason. Ferrelectr. Freq. Control. 2001, 48, 1632–1639. [Google Scholar] [CrossRef]
  2. Lais, H.; Lowe, P.S.; Gan, T.H.; Wrobel, L.C. Numerical investigation of design parameters for optimization of the in-situ ultrasonic fouling removal technique for pipelines. Ultrason. Sonochem. 2019, 56, 94–104. [Google Scholar] [CrossRef] [PubMed]
  3. Bani, D.; Quattrini, A.; Freschi, G.; Lo Ruso, G. Histological and Ultrastructural Effects of Ultrasound-induced Cavitation on Human Skin Adipose Tissue. Plast. Reconstr. Surg. Glob. Open 2013, 1, e41. [Google Scholar] [CrossRef] [PubMed]
  4. Abdullah, A.; Shahini, M.; Pak, A. An approach to design a high power piezoelectric ultrasonic transducer. J. Electroceram. 2009, 22, 369–382. [Google Scholar] [CrossRef]
  5. Al-Budairi, H.; Lucas, M.; Harkness, P. A design approach for longitudinal-torsional ultrasonic transducers. Sens. Actuators A Phys. 2013, 198, 99–106. [Google Scholar] [CrossRef]
  6. Lin, J.; Lin, S.; Xu, J. Analysis and experimental validation of longitudinally composite ultrasonic transducers. J. Acoust. Soc. Am. 2019, 145, 263–271. [Google Scholar] [CrossRef]
  7. Kim, J.; Lee, J. Theoretical Resonance Analysis of Langevin Transducers with Equivalent Circuit Models for Therapeutic Ultrasound. J. Electr. Eng. Technol. 2019, 14, 2437–2445. [Google Scholar] [CrossRef]
  8. Sohn, C.H.; Park, J.H. A comparative study on acoustic damping induced by half-wave, quarter-wave, and Helmholtz resonators. Aerosp. Sci. Technol. 2011, 15, 606–614. [Google Scholar] [CrossRef]
  9. Yang, G.; Liu, S.F.; Ren, W.; Mukherjee, B.K. Effects of uniaxial stress on the piezoelectric, dielectric, and mechanical properties of lead zirconate titanate piezoceramics. Ferroelectrics 2001, 262, 207–212. [Google Scholar] [CrossRef]
  10. Choi, C.H.; Seo, I.T.; Song, D.; Jang, M.S.; Kim, B.Y.; Nahm, S.; Sung, T.H.; Song, H.C. Relation between piezoelectric properties of ceramics and output power density of energy harvester. J. Eur. Ceram. Soc. 2013, 33, 1343–1347. [Google Scholar] [CrossRef]
  11. Liu, X.; Paurobally, R.; Pan, J. The effect of prestress on vibration behavior of structures in impedance method damage detection. Adv. Mater. Res. 2008, 41–42, 401–406. [Google Scholar] [CrossRef]
  12. DeAngelis, D.A.; Schulze, G.W.; Wong, K.S. Optimizing Piezoelectric Stack Preload Bolts in Ultrasonic Transducers. Phys. Procedia 2015, 63, 11–20. [Google Scholar] [CrossRef] [Green Version]
  13. Sherrit, S.; Leary, S.P.; Dolgin, B.P.; Bar-Cohen, Y. Comparison of the Mason and KLM Equivalent Circuits for Piezoelectric Resonators in the Thickness Mode. In Proceedings of the 1999 IEEE Ultrasonics Symposium, Proceedings, International Symposium, Caesars Tahoe, NV, USA, 17–20 October 1999; Volume 2, pp. 921–926. [Google Scholar] [CrossRef] [Green Version]
  14. Wei, X.; Yang, Y.; Yao, W.; Zhang, L. PSpice modeling of a sandwich piezoelectric ceramic ultrasonic transducer in longitudinal vibration. Sensors 2017, 17, 2253. [Google Scholar] [CrossRef] [PubMed] [Green Version]
  15. Rathod, V.T. A review of electric impedance matching techniques for piezoelectric sensors, actuators and transducers. Electronics 2019, 8, 169. [Google Scholar] [CrossRef] [Green Version]
  16. Wang, F.; Zhang, H.; Liang, C.; Tian, Y.; Zhao, X.; Zhang, D. Design of High-Frequency Ultrasonic Transducers with Flexure Decoupling Flanges for Thermosonic Bonding. IEEE Trans. Ind. Electron. 2016, 63, 2304–2312. [Google Scholar] [CrossRef] [Green Version]
  17. Lin, S.; Xu, C. Analysis of the sandwich ultrasonic transducer with two sets of piezoelectric elements. Smart Mater. Struct. 2008, 17, 065008. [Google Scholar] [CrossRef]
  18. Meng, X.; Lin, S. Analysis of a cascaded piezoelectric ultrasonic transducer with three sets of piezoelectric ceramic stacks. Sensors 2019, 19, 580. [Google Scholar] [CrossRef] [Green Version]
  19. Lin, J.; Lin, S. Study on a Large-Scale Three-Dimensional Ultrasonic Plastic Welding Vibration System Based on a Quasi-Periodic Phononic Crystal Structure. Crystals 2020, 10, 21. [Google Scholar] [CrossRef] [Green Version]
  20. Fuji Ceramics Corporation. Available online: http://www.fujicera.co.jp/managed/wp-content/themes/fujicera/digitalbook/en/element/index_h5.html#1 (accessed on 19 December 2019).
  21. GE Sensing. Available online: http://www.instrumart.com/assests/ge-sound-speeds-and-pipe-size-data.pdf (accessed on 19 December 2019).
  22. Advanced UT. Available online: http://www.advanced-ndt.co.uk/index_htm_files/Reference%20Chart%20-%20Velocity%20Chart.pdf (accessed on 19 December 2019).
  23. Chen, J.S.; Sun, C.T. Reducing vibration of sandwich structures using antiresonance frequencies. Compos. Struct. 2012, 94, 2819–2826. [Google Scholar] [CrossRef]
  24. Kanda, K.; Saito, T.; Iga, Y.; Higuchi, K.; Maenaka, K. Influence of parasitic capacitance on output voltage for series-connected thin-film piezoelectric devices. Sensors 2012, 12, 16673–16684. [Google Scholar] [CrossRef]
  25. Dai, Z.; Xu, Z.; Yao, X. Effect of dc bias on pressure-induced depolarization of Pb (Nb, Zr, Sn, Ti) O3 ceramics. Appl. Phys. Lett. 2008, 92, 72904. [Google Scholar] [CrossRef]
  26. Guyomar, D.; Ducharne, B.; Sebald, G. High nonlinearities in Langevin transducer: A comprehensive model. Ultrasonics 2011, 51, 1006–1013. [Google Scholar] [CrossRef] [PubMed]
  27. Umeda, M.; Nakamura, K.; Ueha, S. Effects of vibration stress and temperature on the characteristics of piezoelectric ceramics under high vibration amplitude levels measured by electrical transient responses. Jpn. J. Appl. Phys. 1999, 38, 5581–5585. [Google Scholar] [CrossRef]
Figure 1. Structure of typical Langevin transducers.
Sensors 20 01952 g001
Figure 2. Transducer configuration used in this study: (a) simplified diagram; (b) actual transducer.
Sensors 20 01952 g002
Figure 3. Simulation vs. test result of input impedance for 6.0 N·m torque.
Sensors 20 01952 g003
Figure 4. Comparison between simulation and test results for (a) 8.0 N·m and (b) 10.0 N·m.
Sensors 20 01952 g004
Figure 5. Frequency response of impedance as a function of pre-loading torque.
Sensors 20 01952 g005
Figure 6. Simulation and experimental results regarding keff as a function of pre-load torque.
Sensors 20 01952 g006
Table 1. Material properties by transducer parts.
PartMaterialSound Speed (m/s)Density (kg/m3)Acoustic Impedance
(Mrayls)
Outer Diameter (mm)Inner Diameter (mm)
Metal boltStainless steel [20]592080004720
Back massStainless steel5920800047206.5
PiezoceramicsHard ceramic [21]2791770021206.5
Front massAluminum [22]6375270017206.5
HornAluminum637527001720
Table 2. Simulation results in the presence of pre-loading torque.
6.0 N∙m6.5 N∙m7.0 N∙m7.5 N∙m8.0 N∙m8.5 N∙m9.0 N∙m9.5 N∙m10.0 N∙m
fr (kHz)37.9638.0538.1338.2238.3038.3838.4638.5638.64
fa (kHz)39.1539.2439.3039.3939.4739.5539.6239.7039.78
keff0.2450.2440.2420.2420.2420.2410.2400.2380.238
Table 3. Measurement results under pre-loading condition.
6.0 N∙m6.5 N∙m7.0 N∙m7.5 N∙m8.0 N∙m8.5 N∙m9.0 N∙m9.5 N∙m10.0 N∙m
fr (kHz)37.7138.0738.1738.2238.3238.3738.5738.5738.62
fa (kHz)38.8339.1739.3239.3739.4239.5239.6739.7239.77
*keff0.236 (0.003)0.242 (0)0.240 (0)0.240 (0)0.238 (0.002)0.240 (0)0.237 (0.003)0.237 (0.002)0.239 (0)
* Note that each averaged keff is shown with its standard deviation in parentheses.

