Circumferential SH Wave Piezoelectric Transducer System for Monitoring Corrosion-Like Defect in Large-Diameter Pipes


Abstract
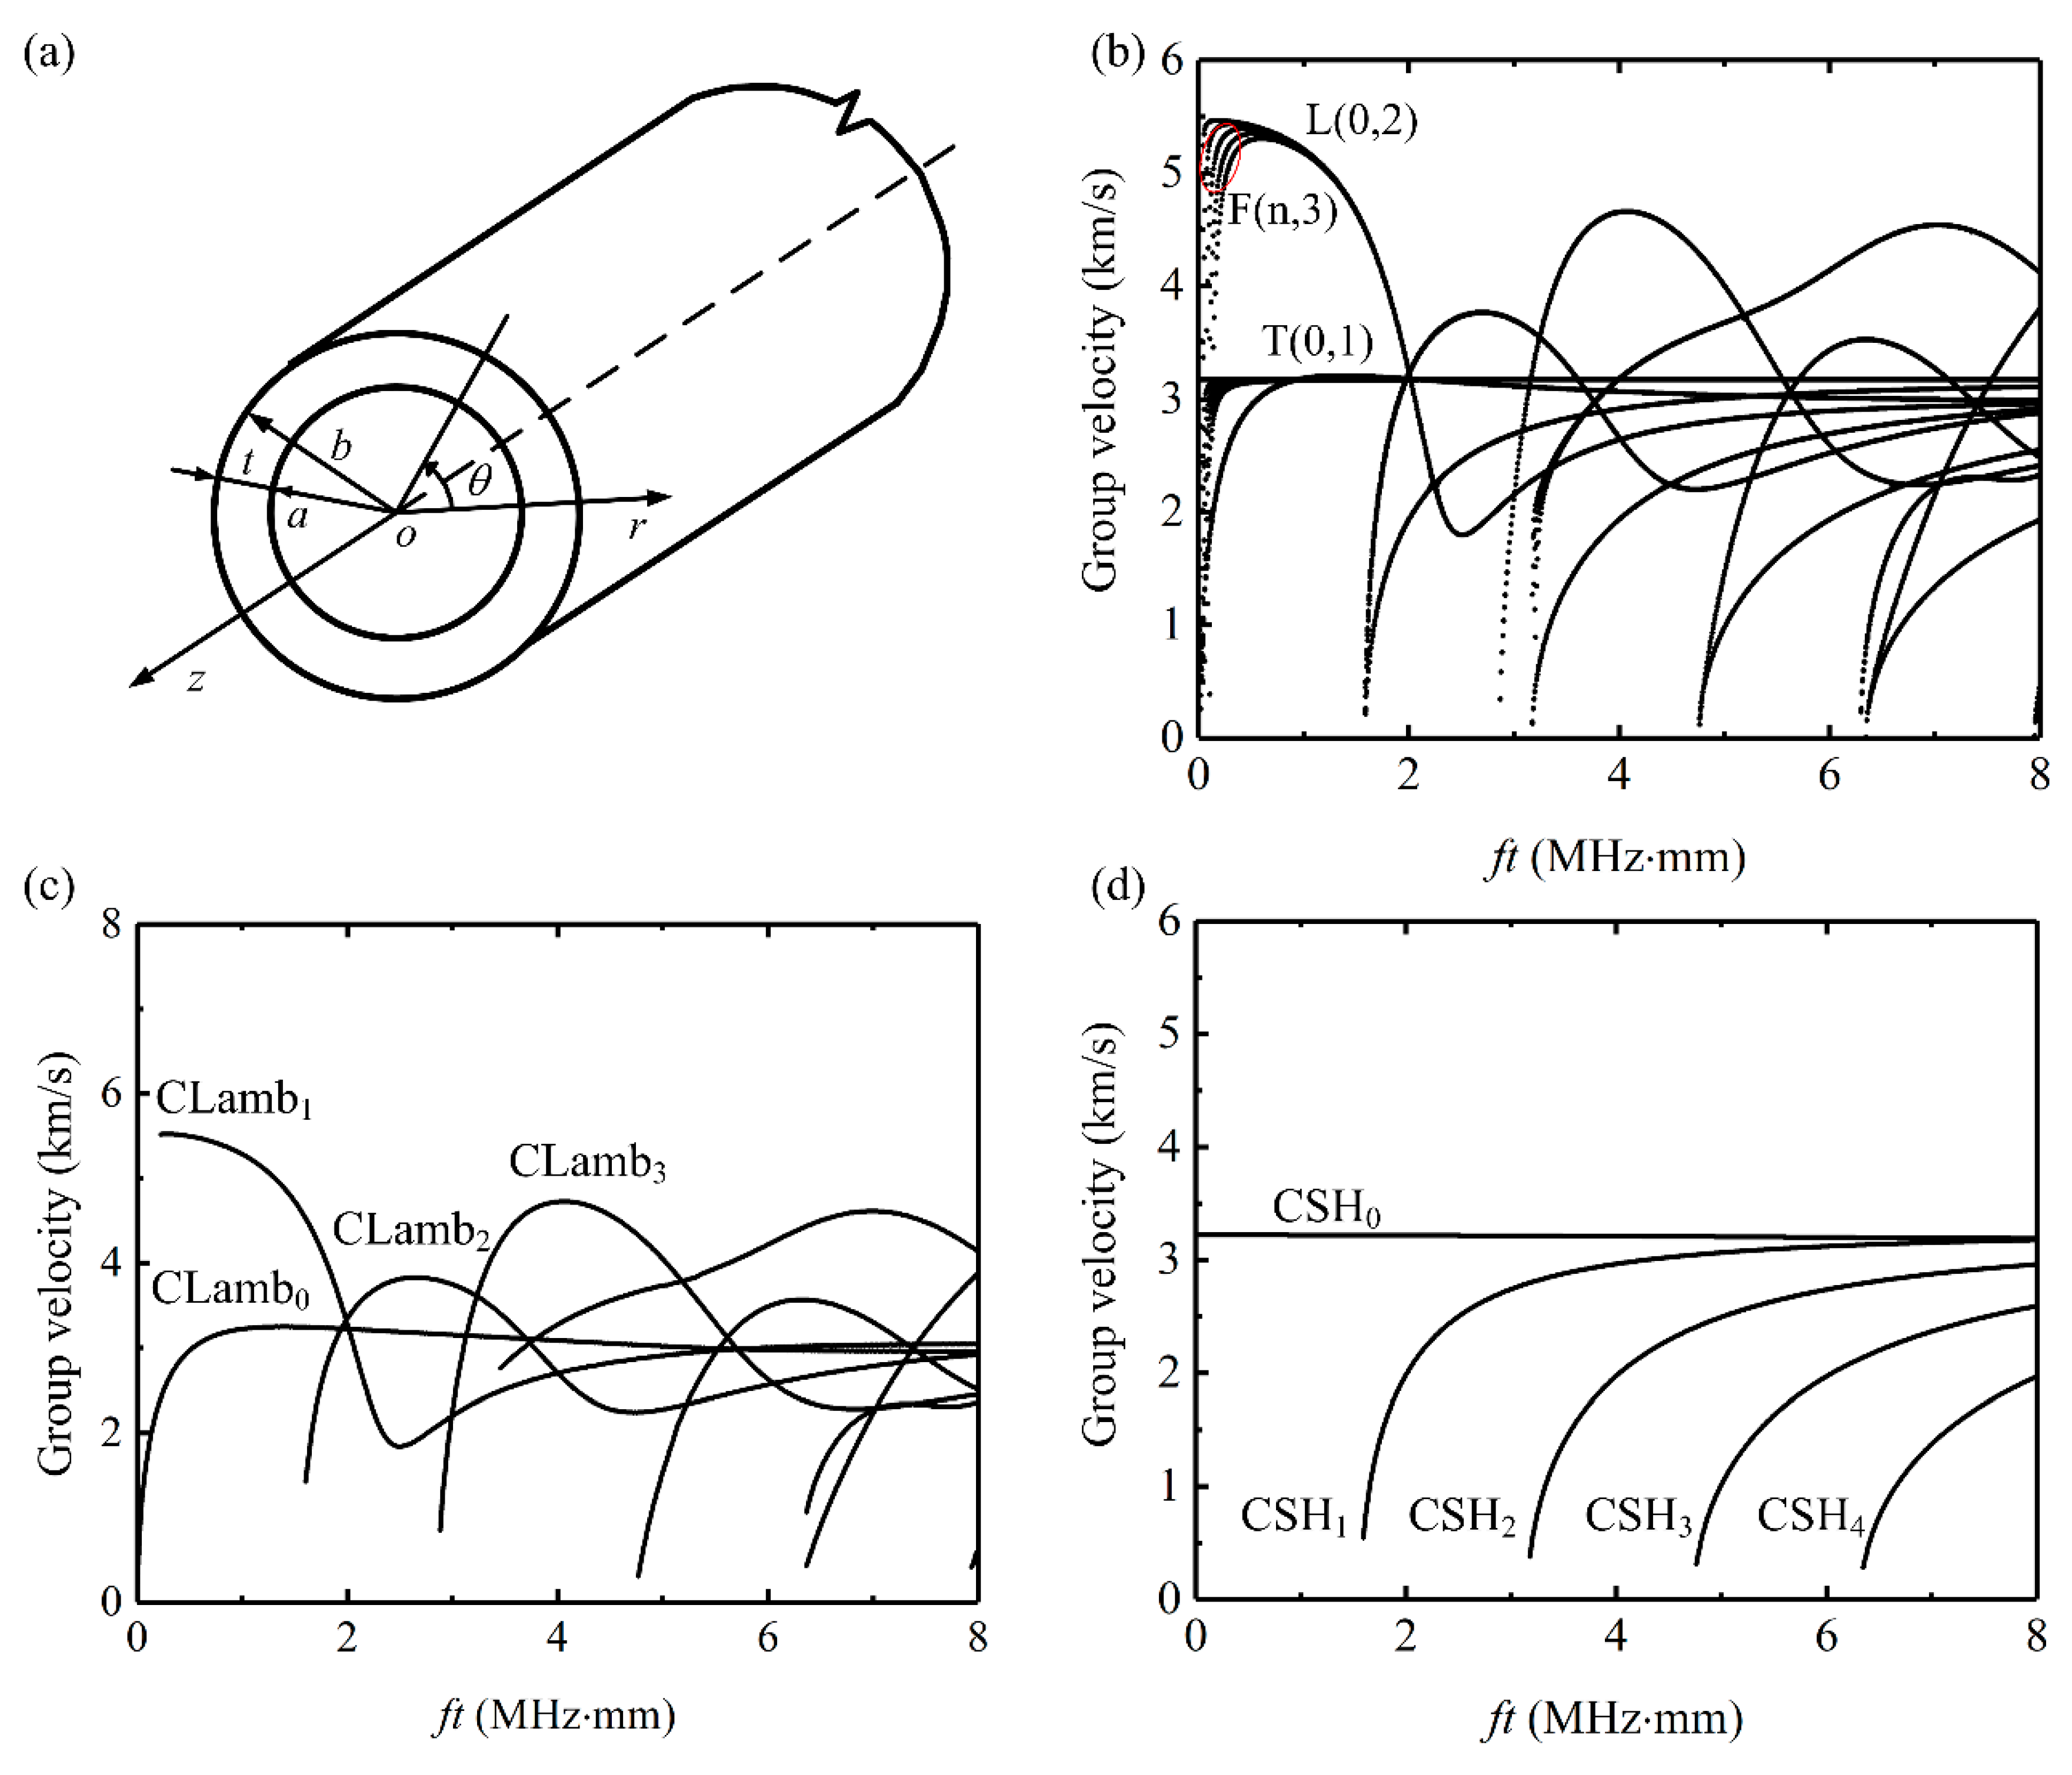
1. Introduction
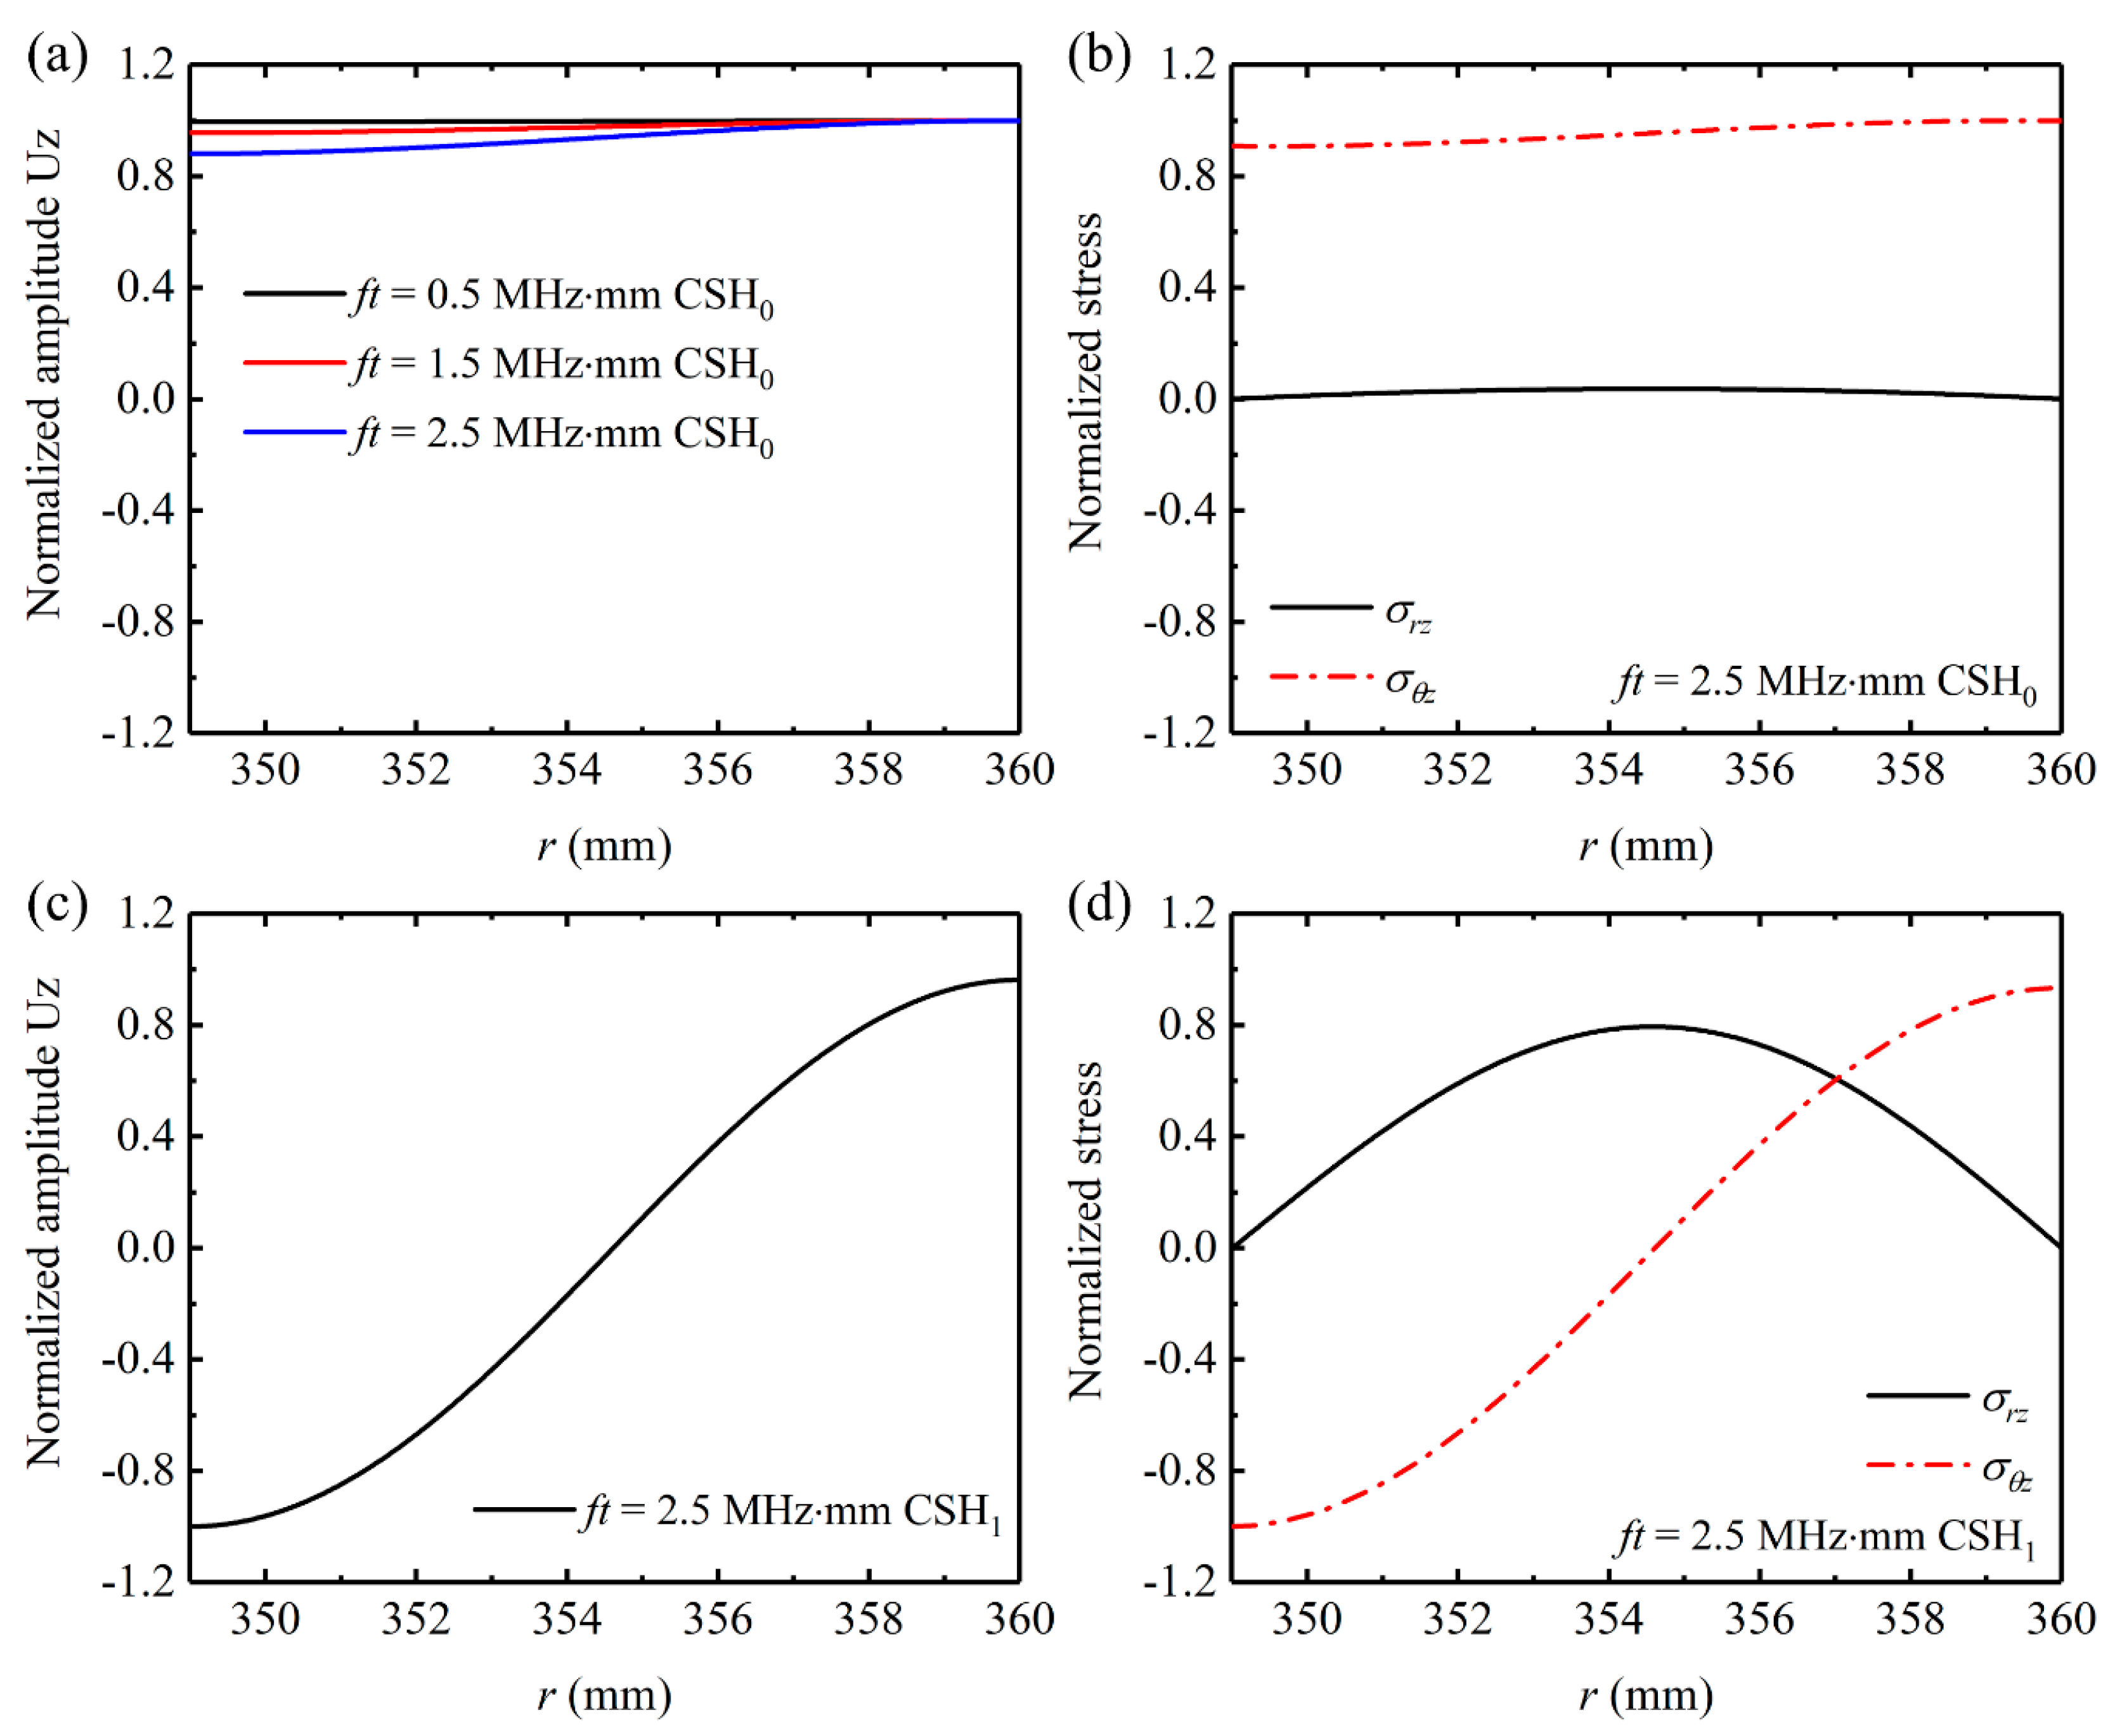
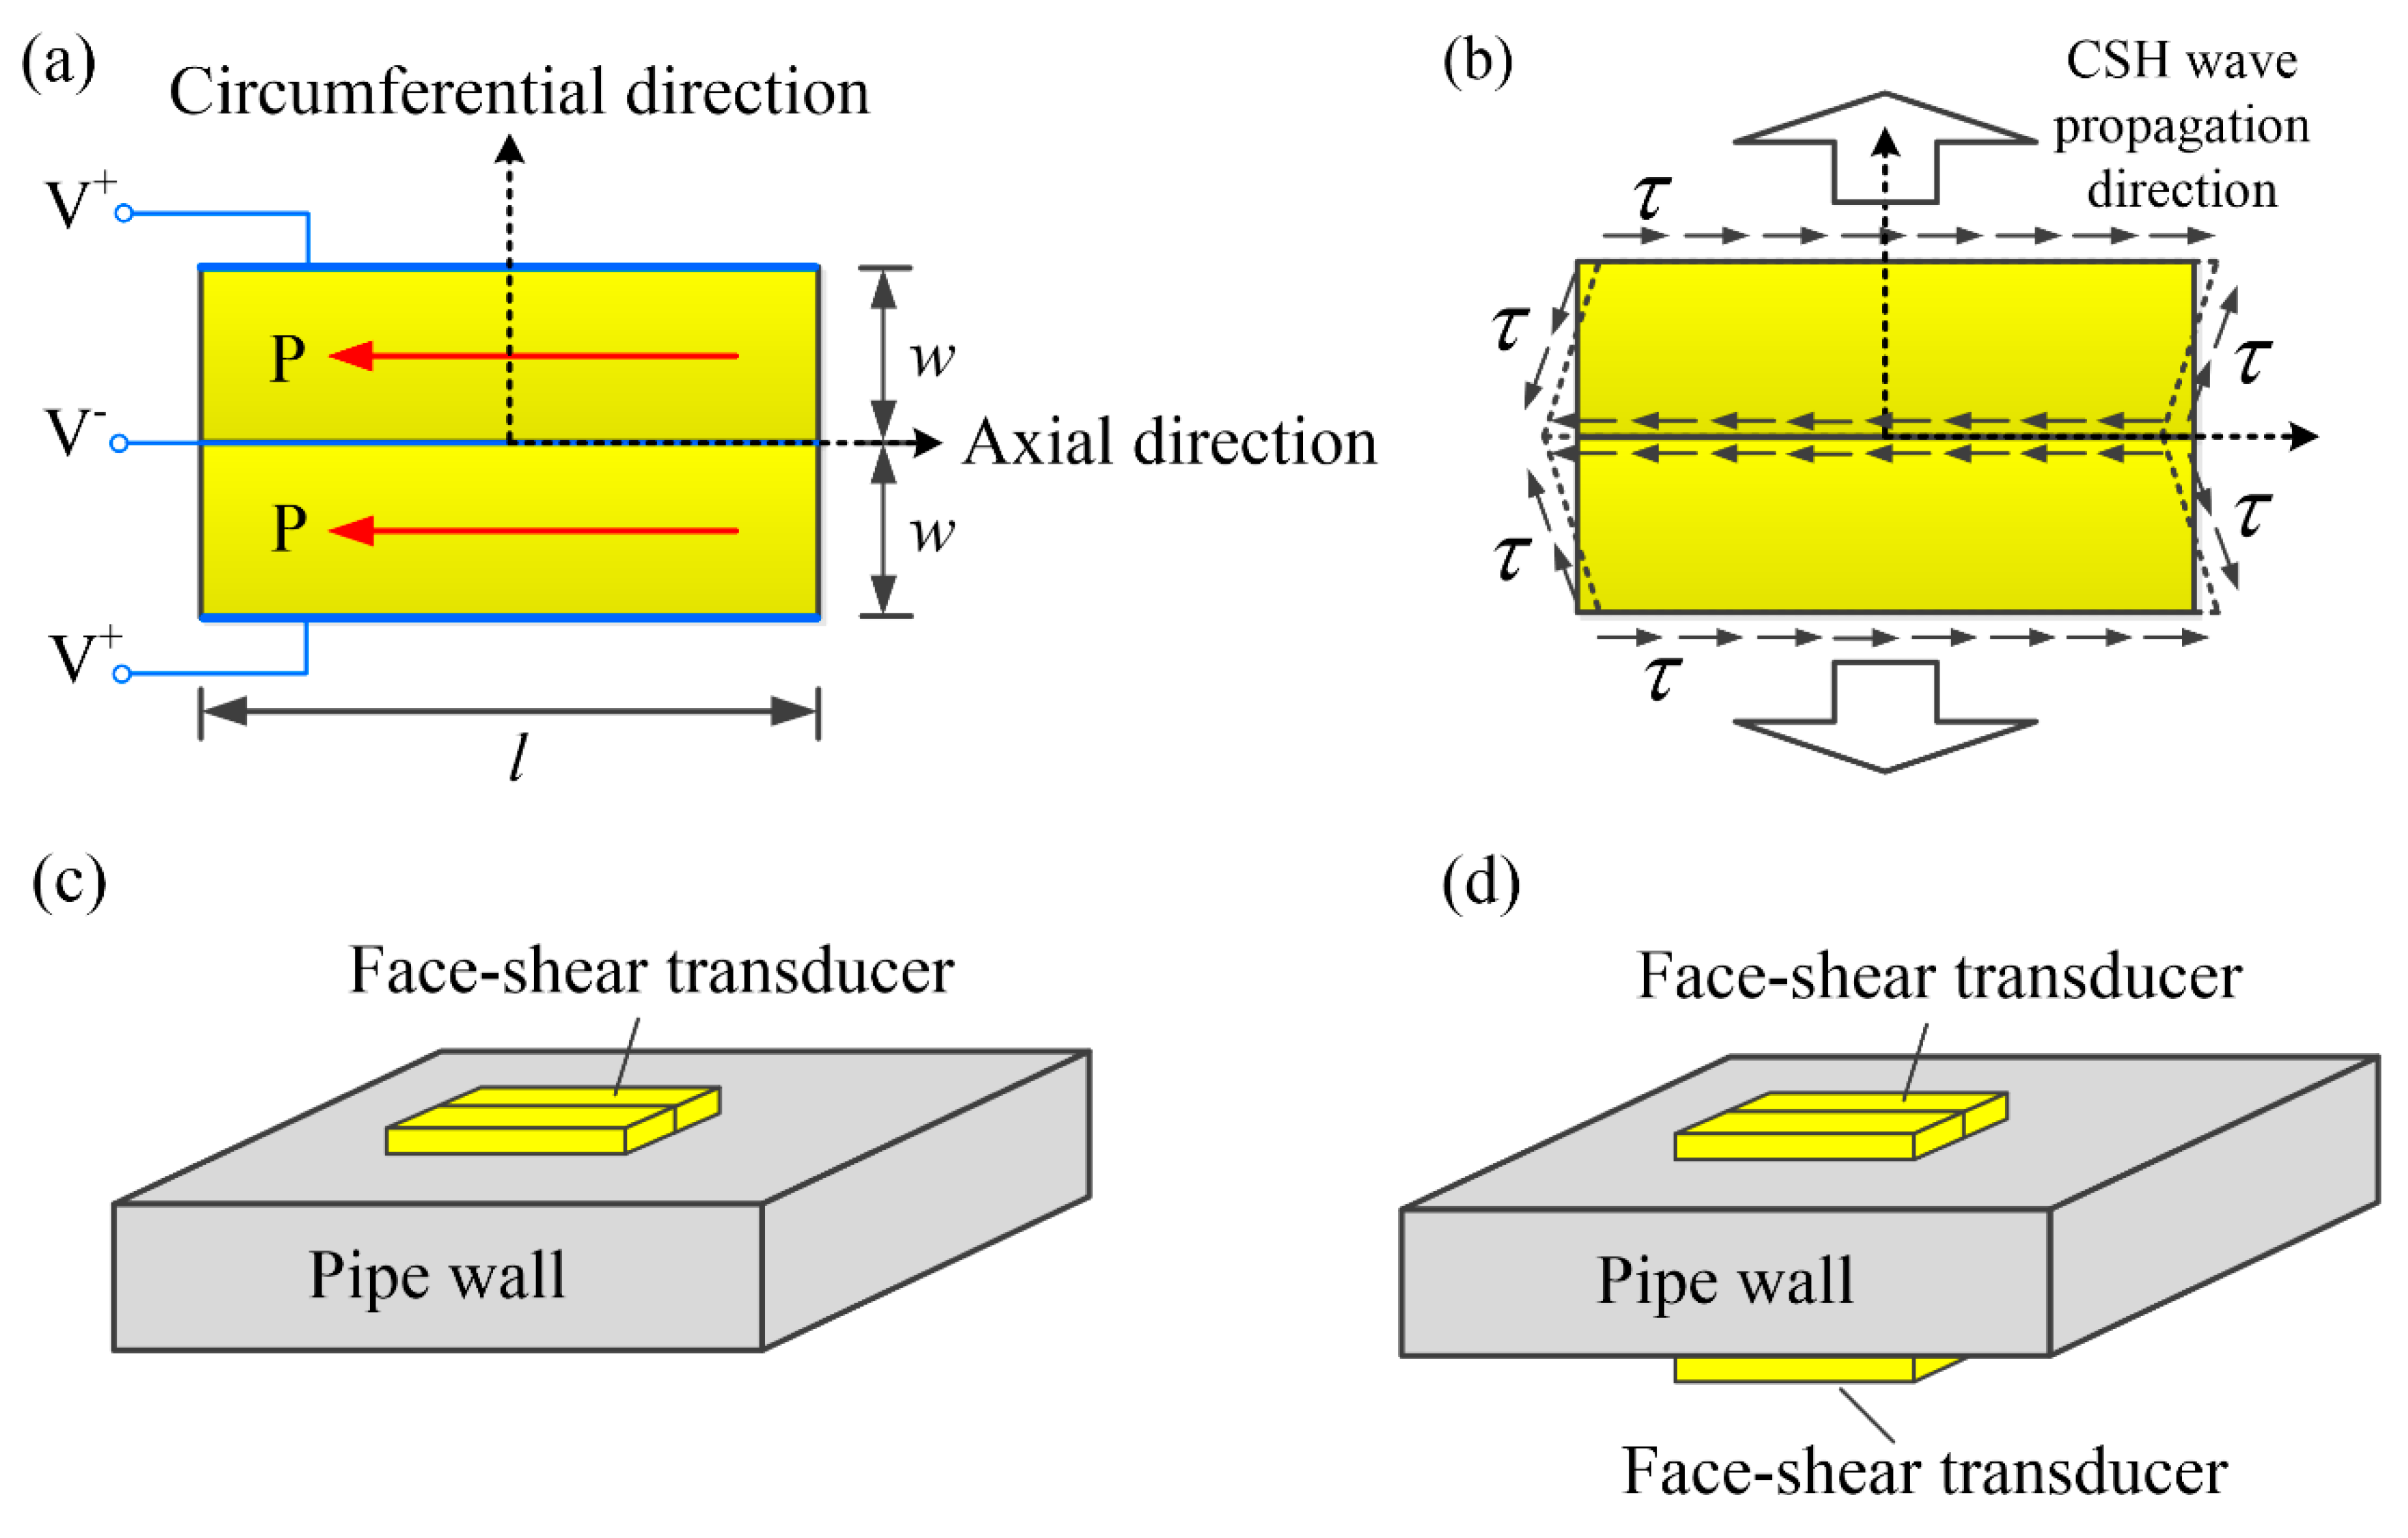
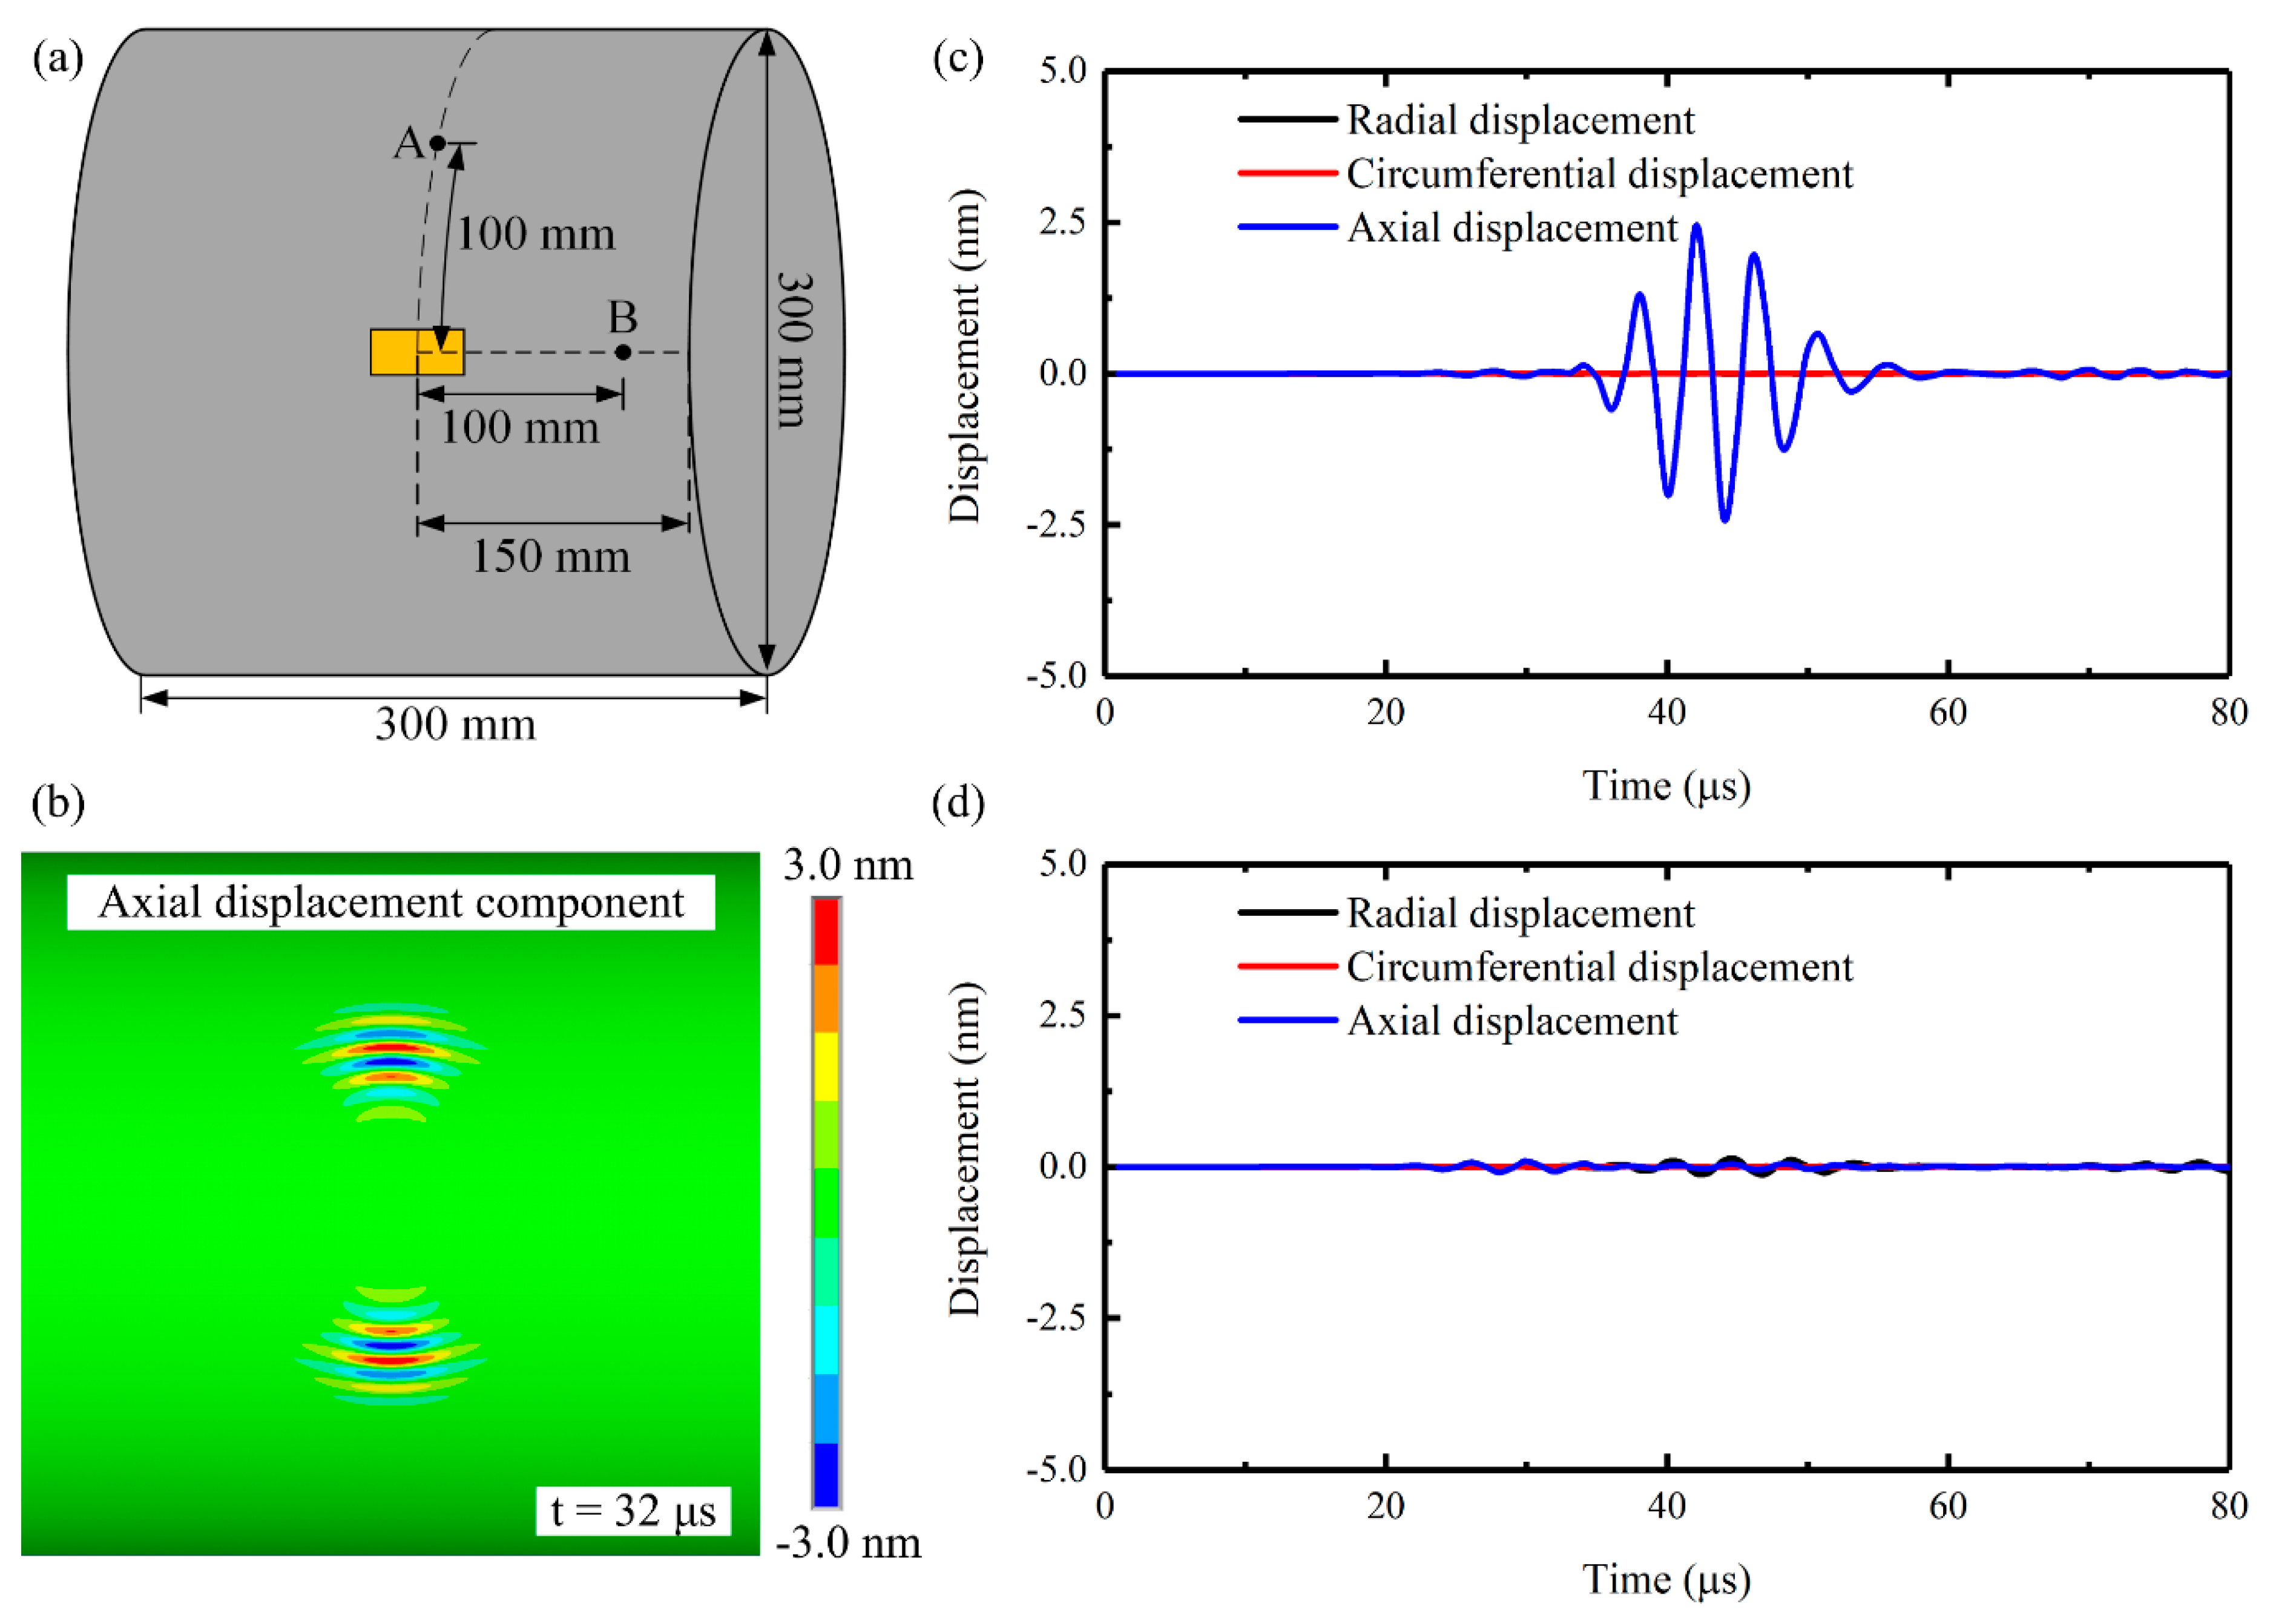
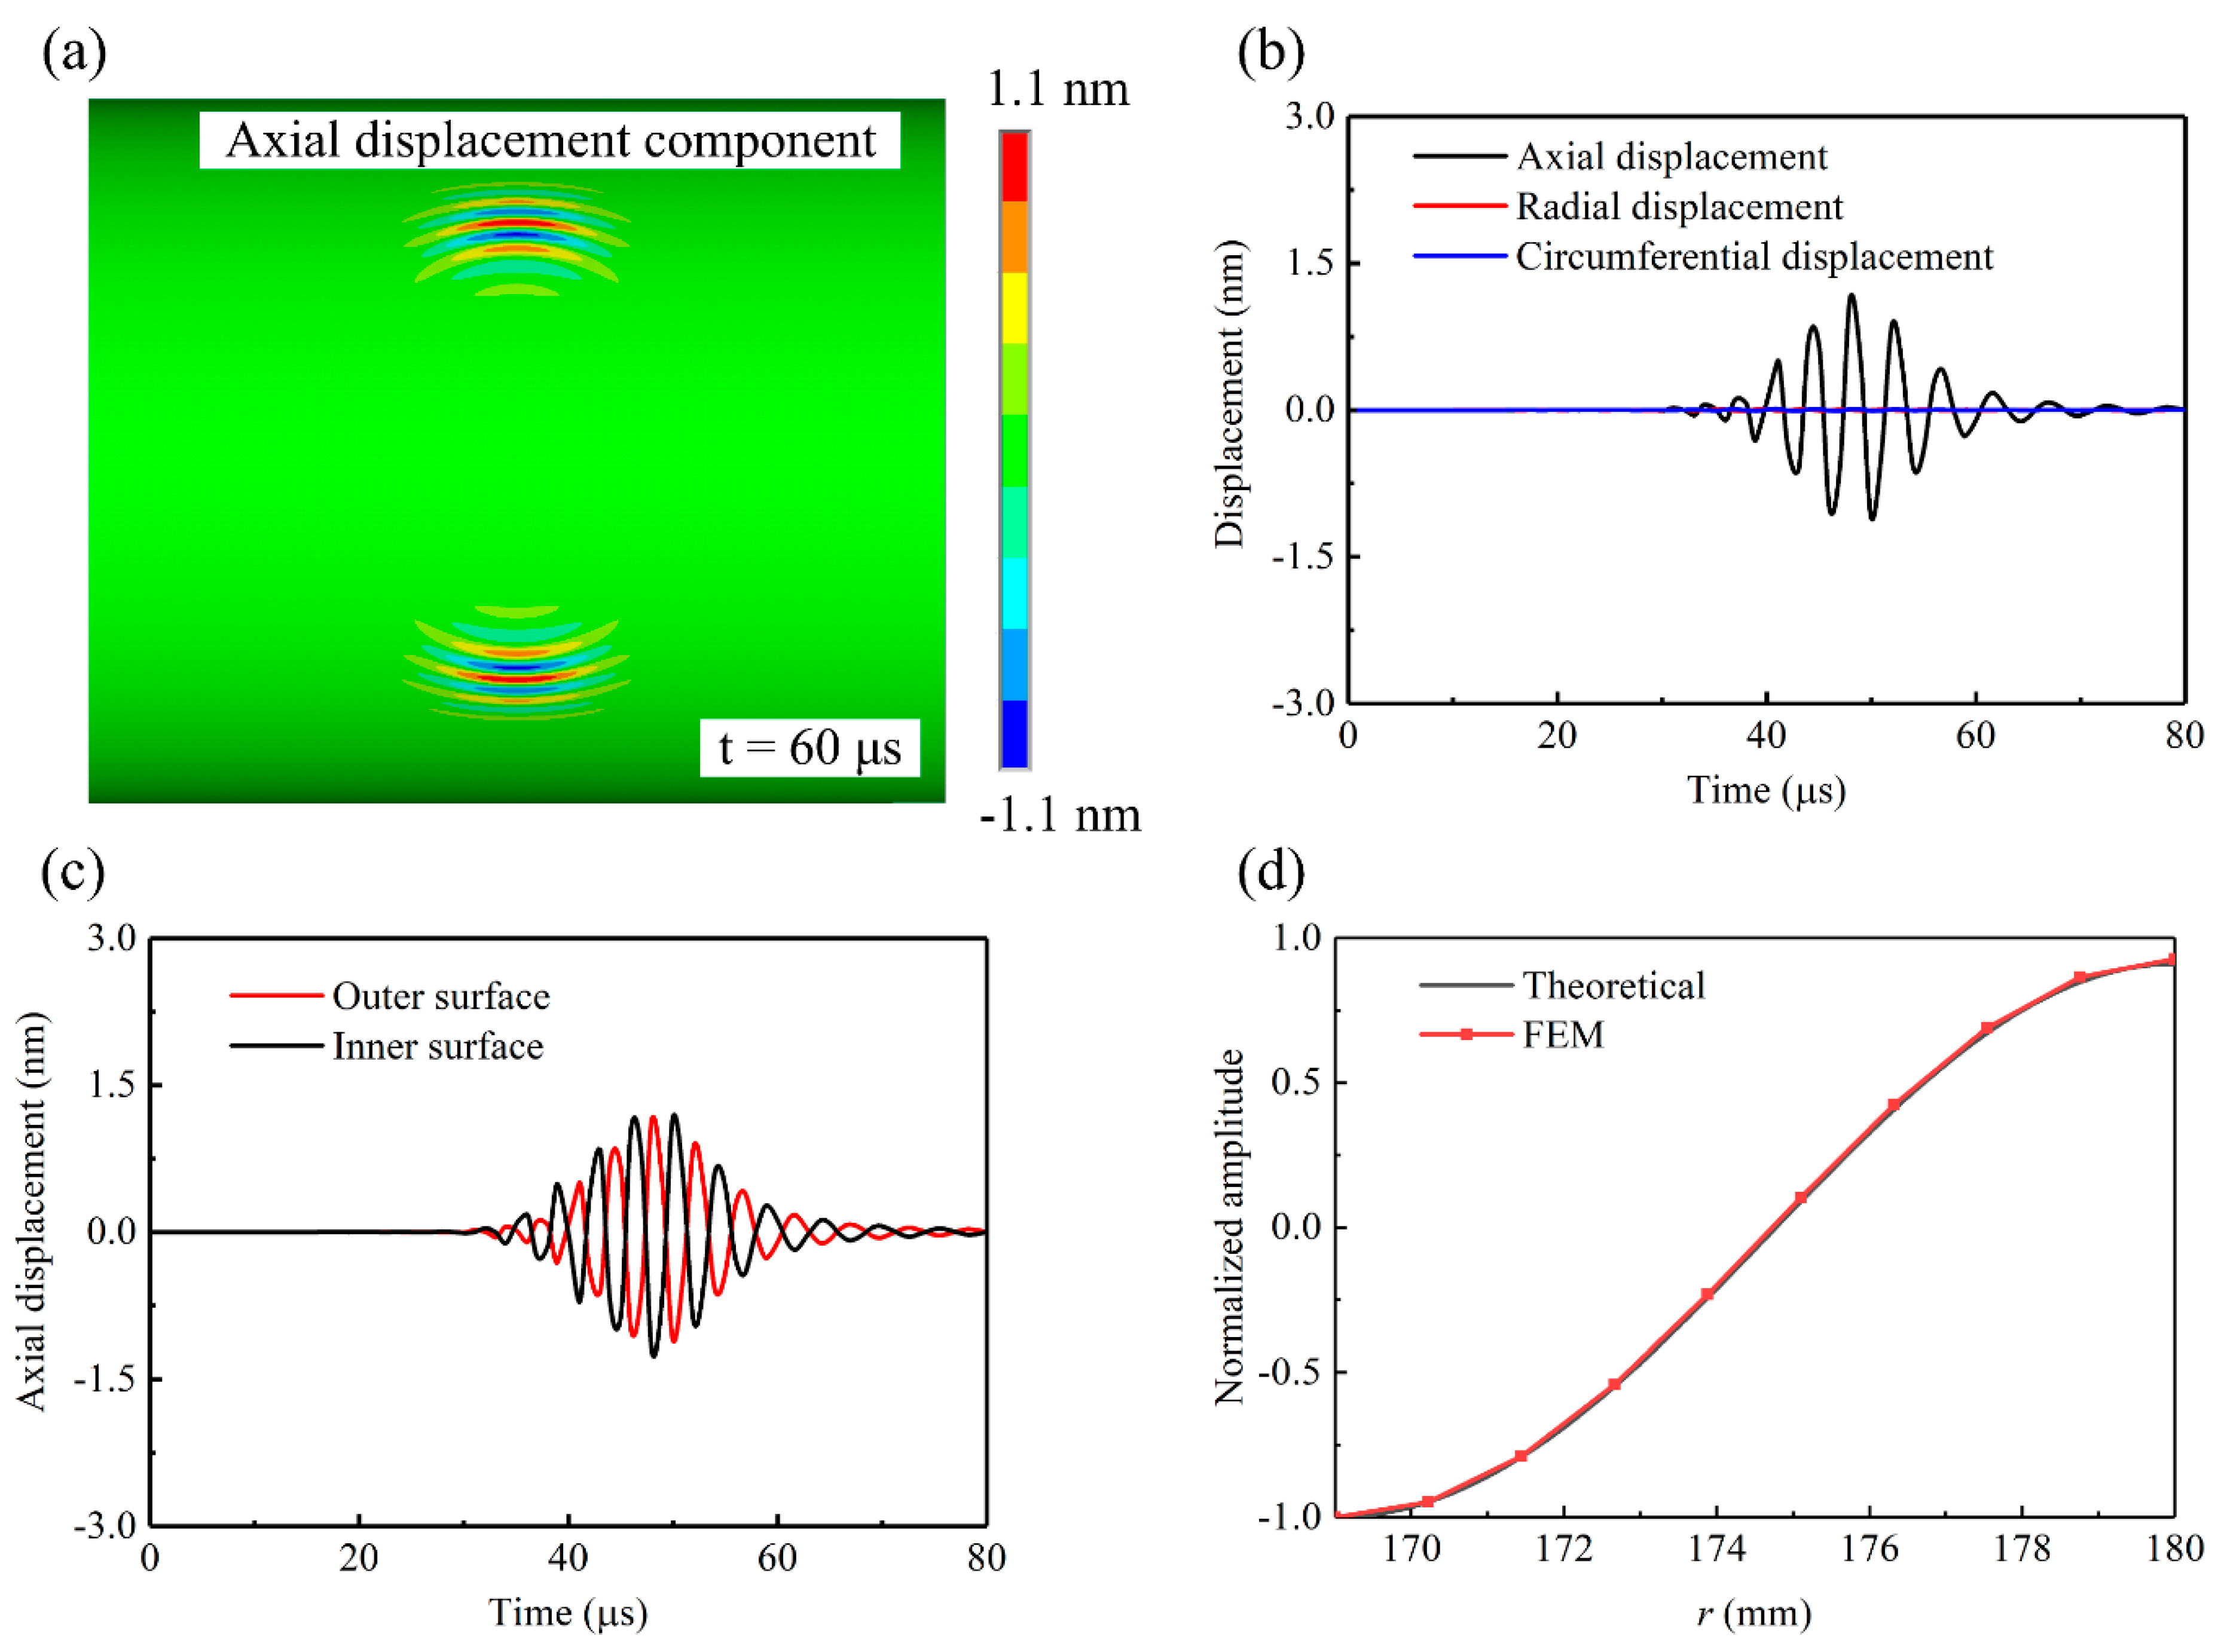
2. Mechanisms of Exciting CSH0 and CSH1 Waves
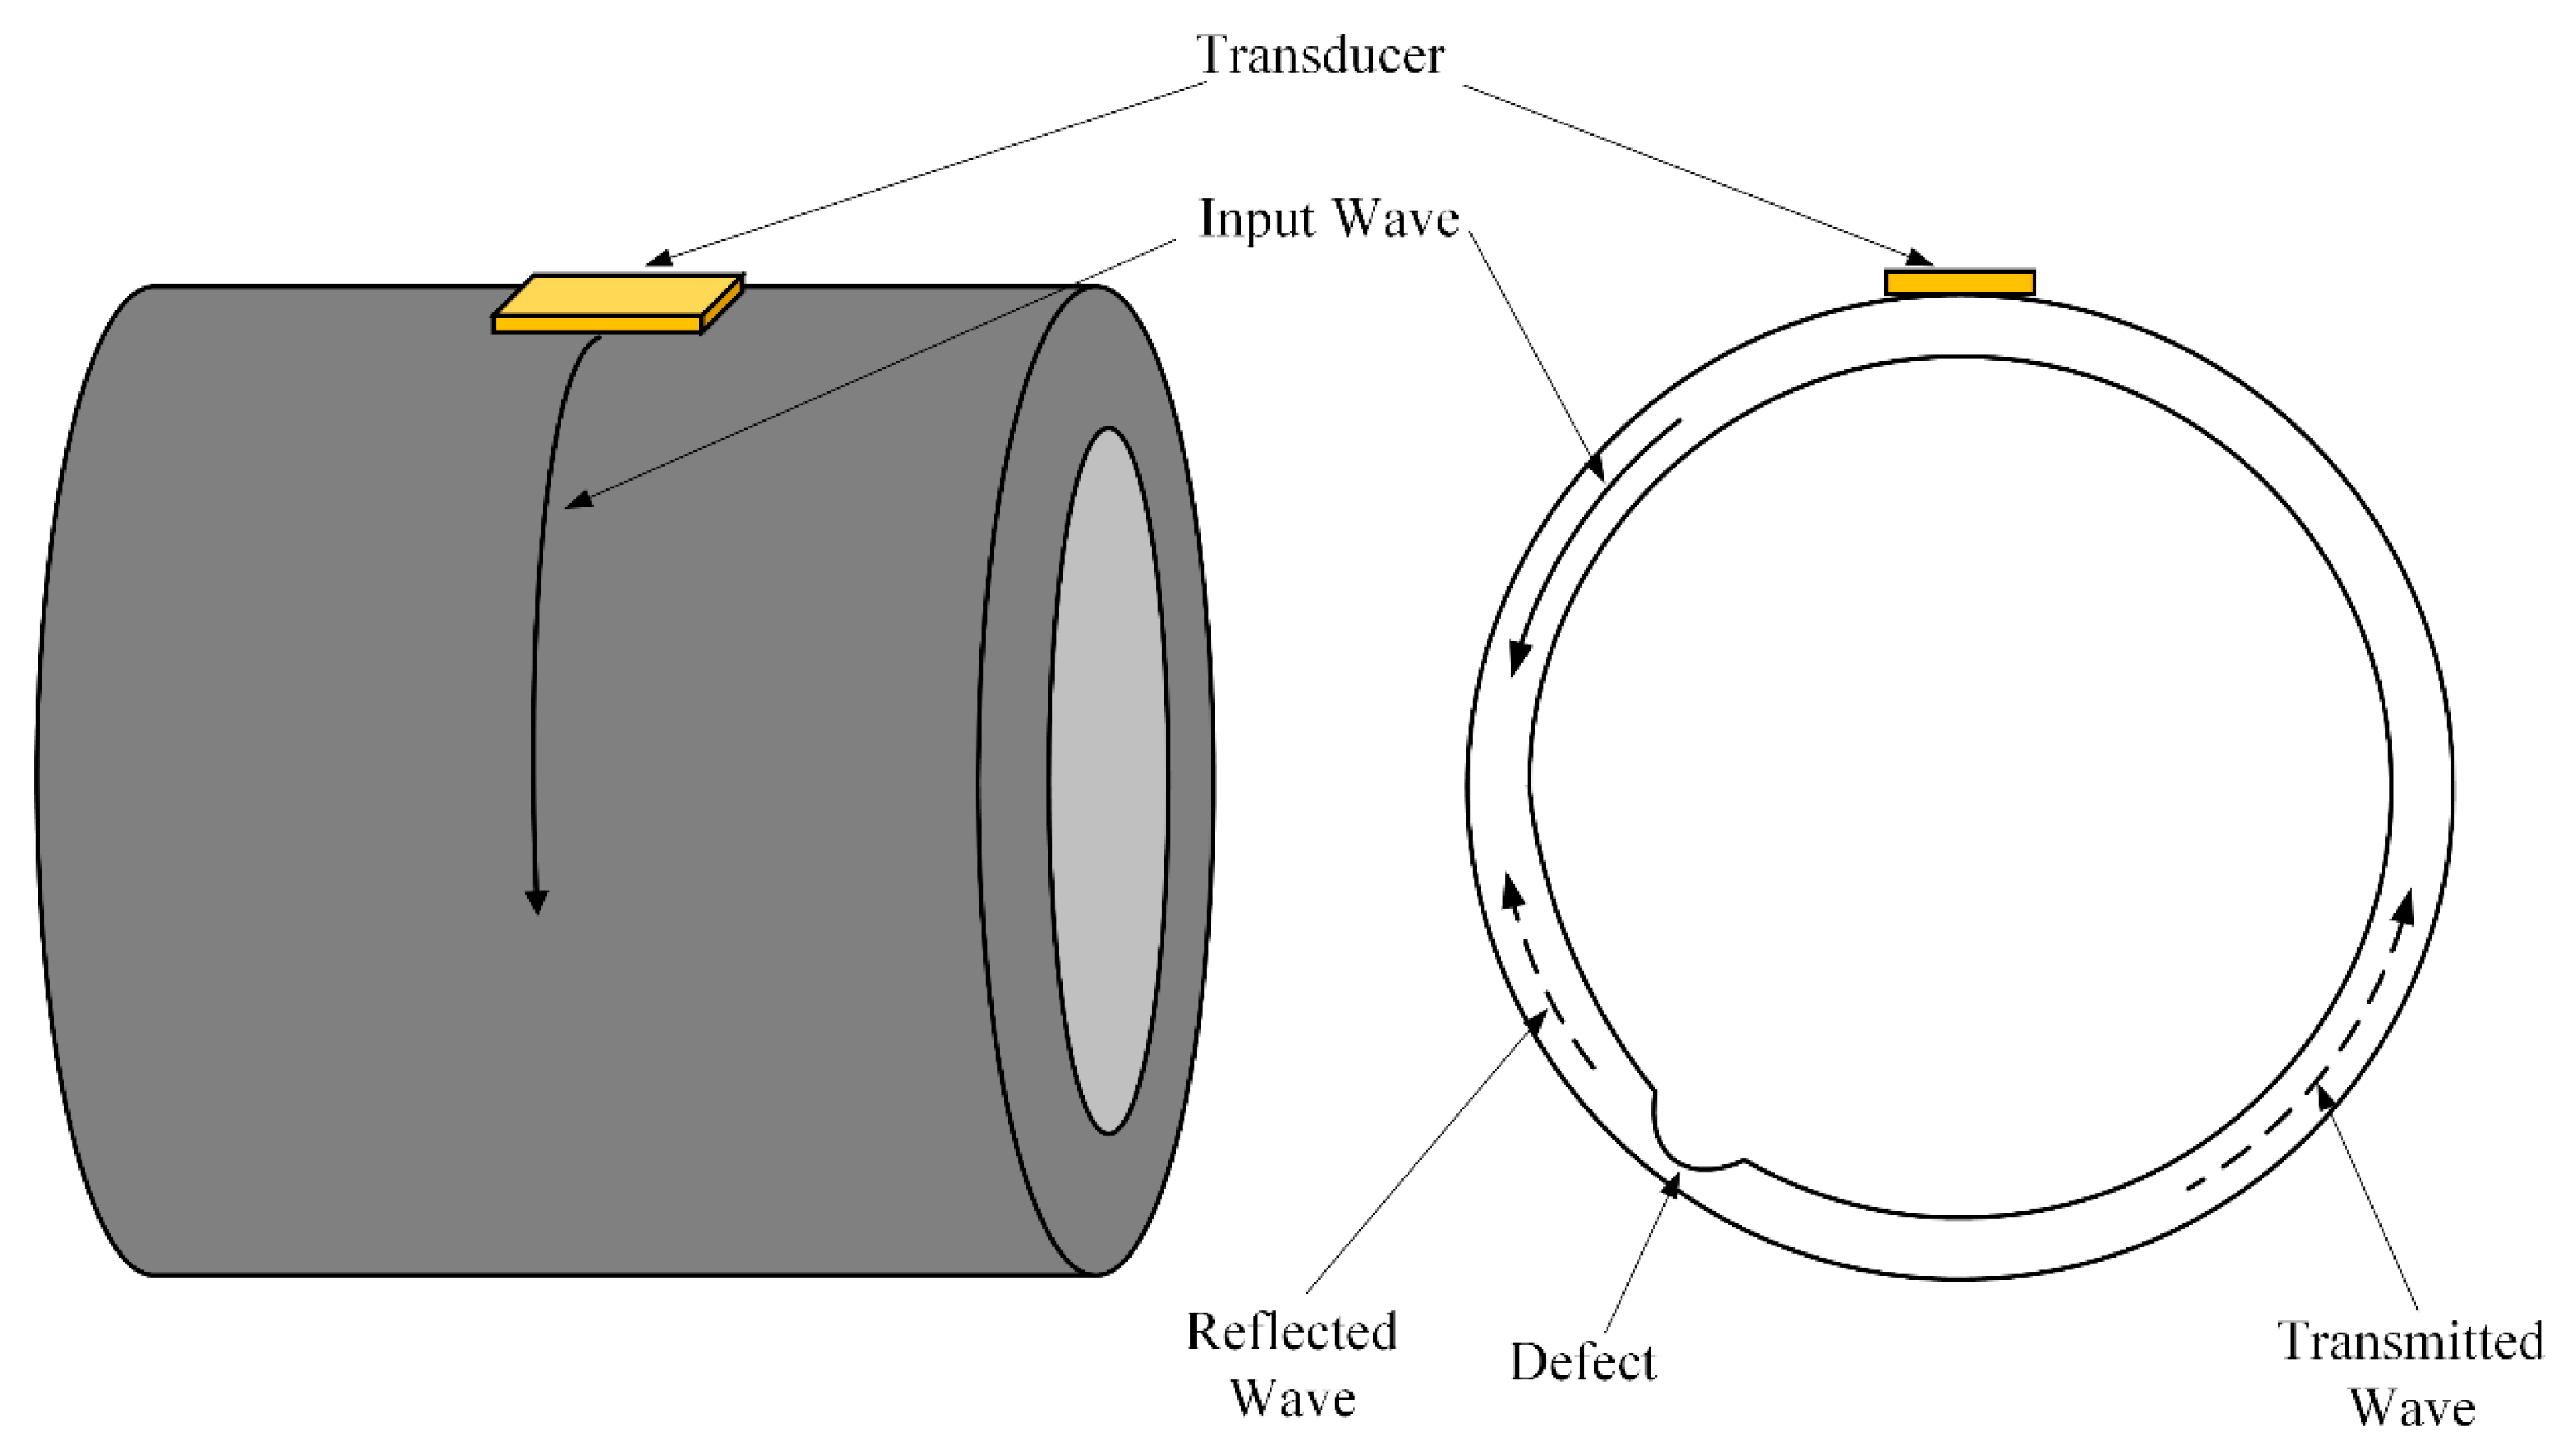
3. Experiments
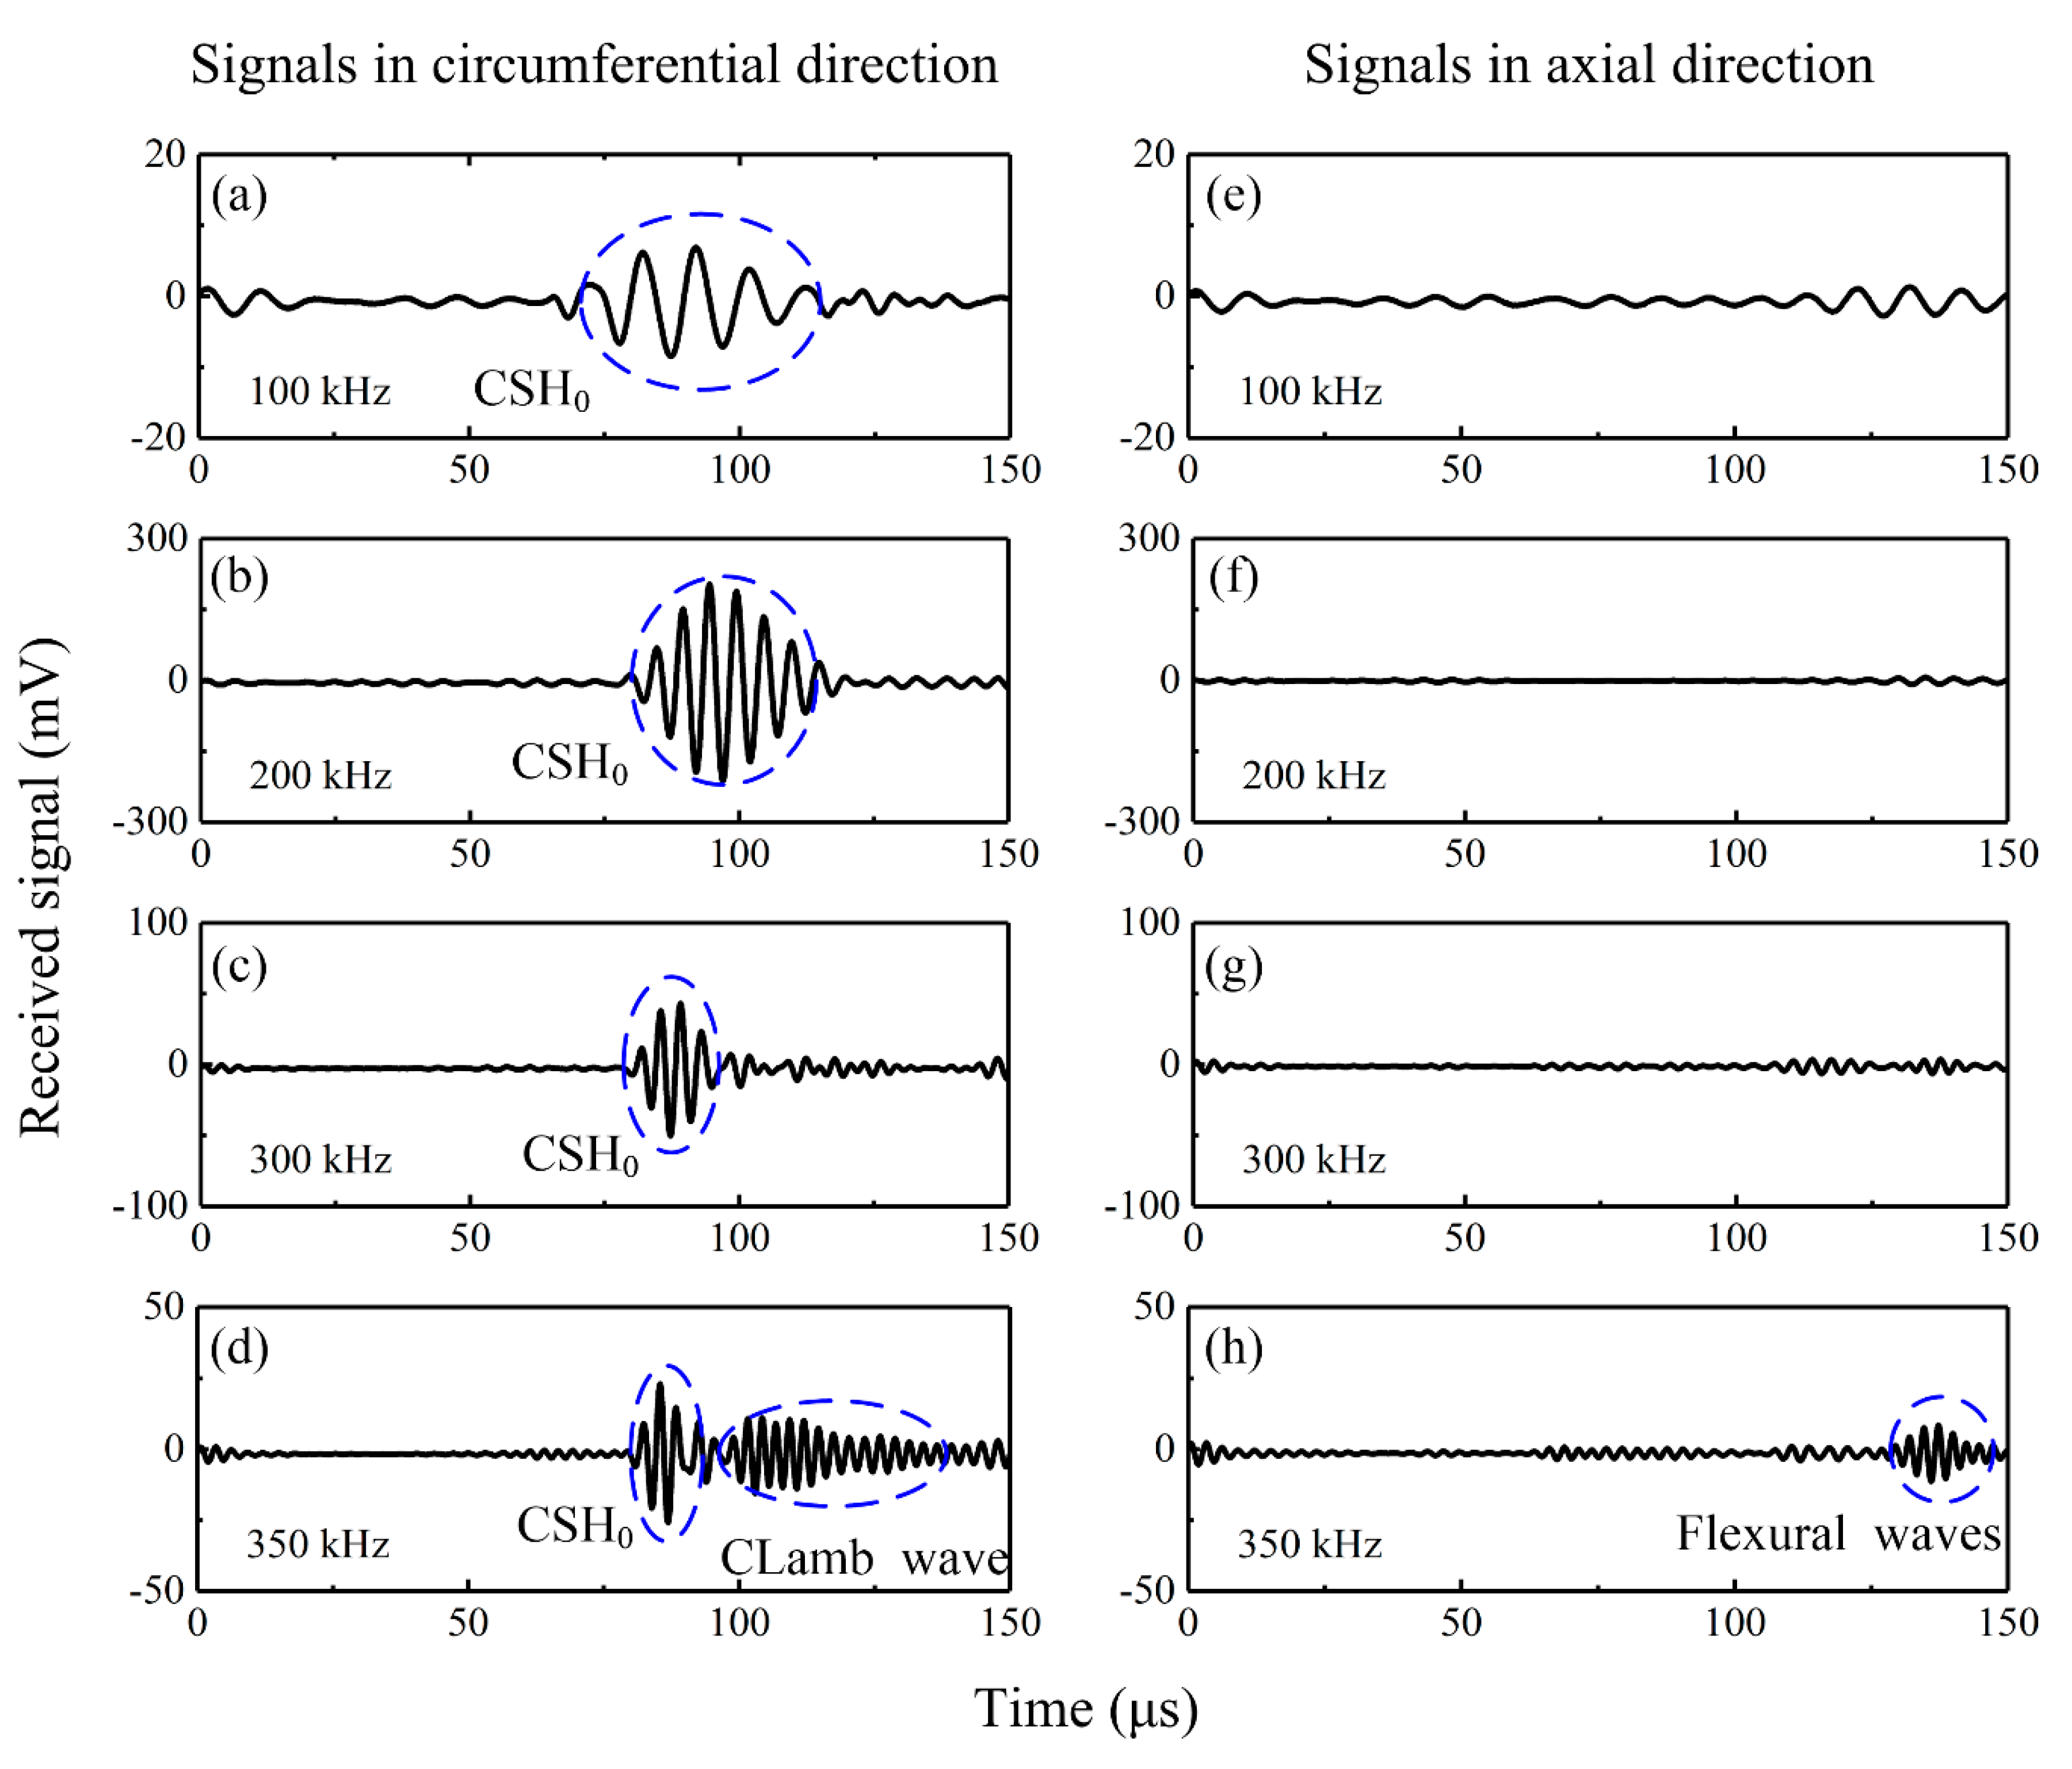
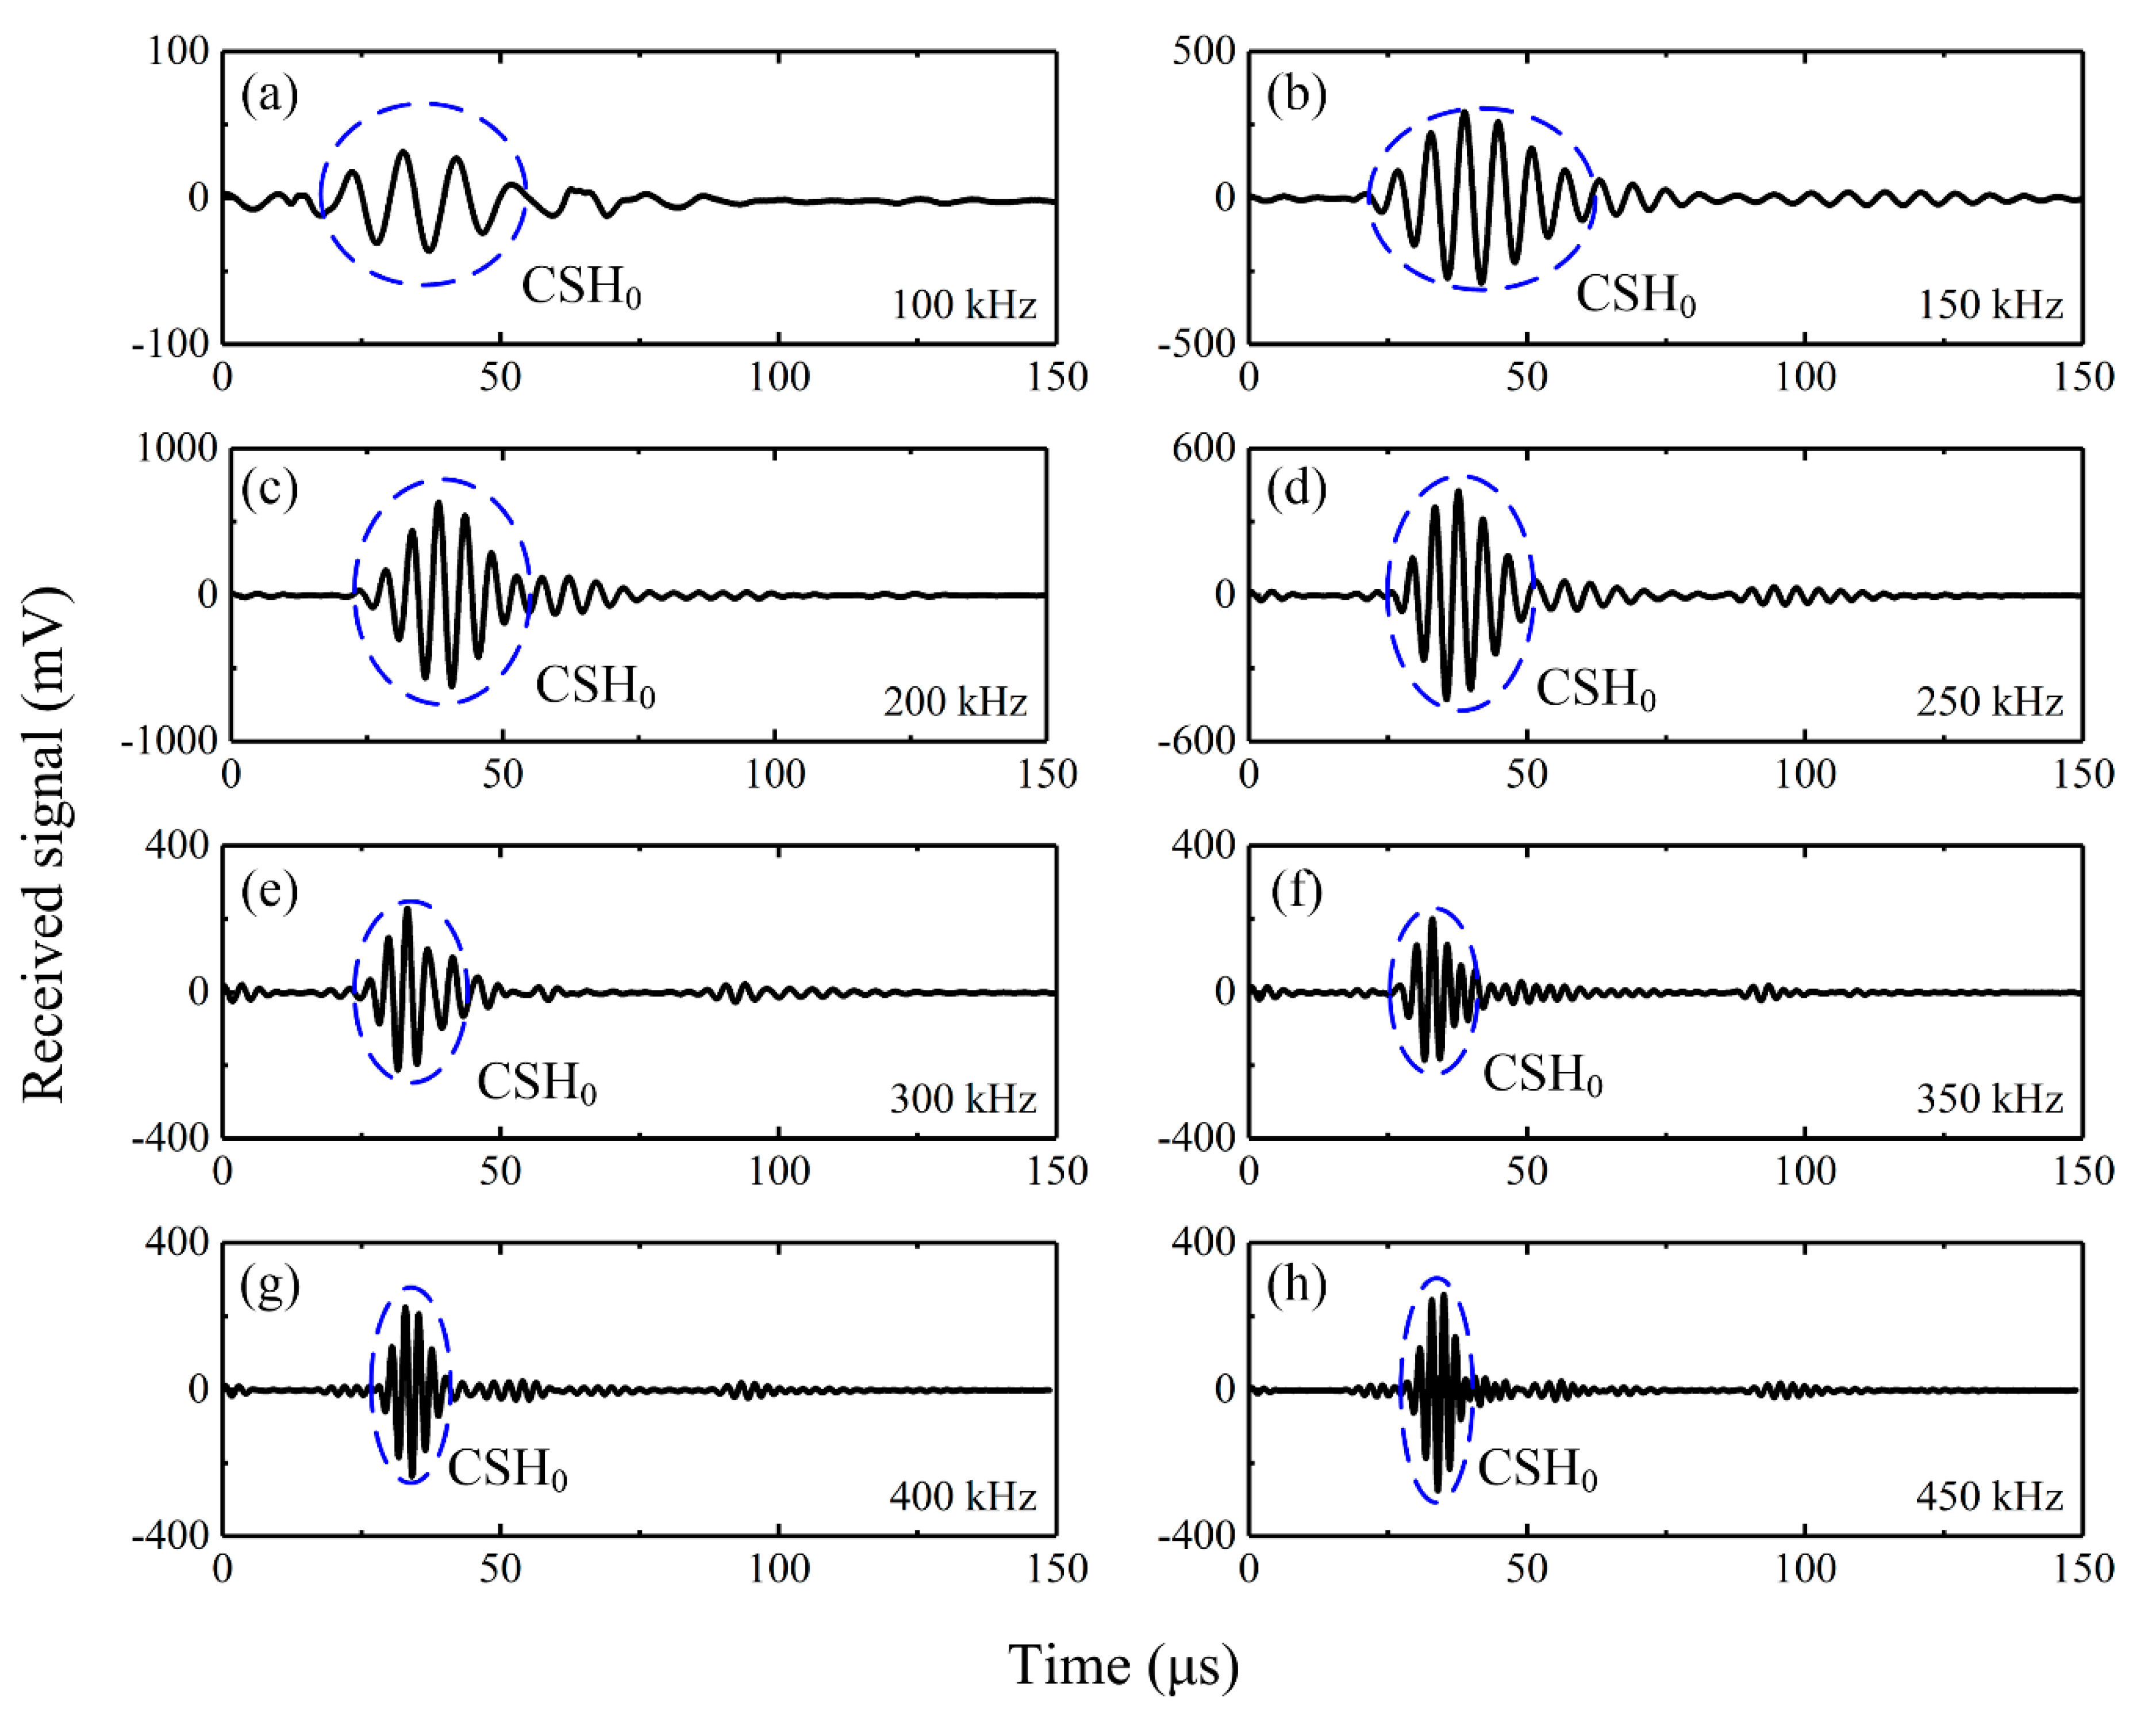
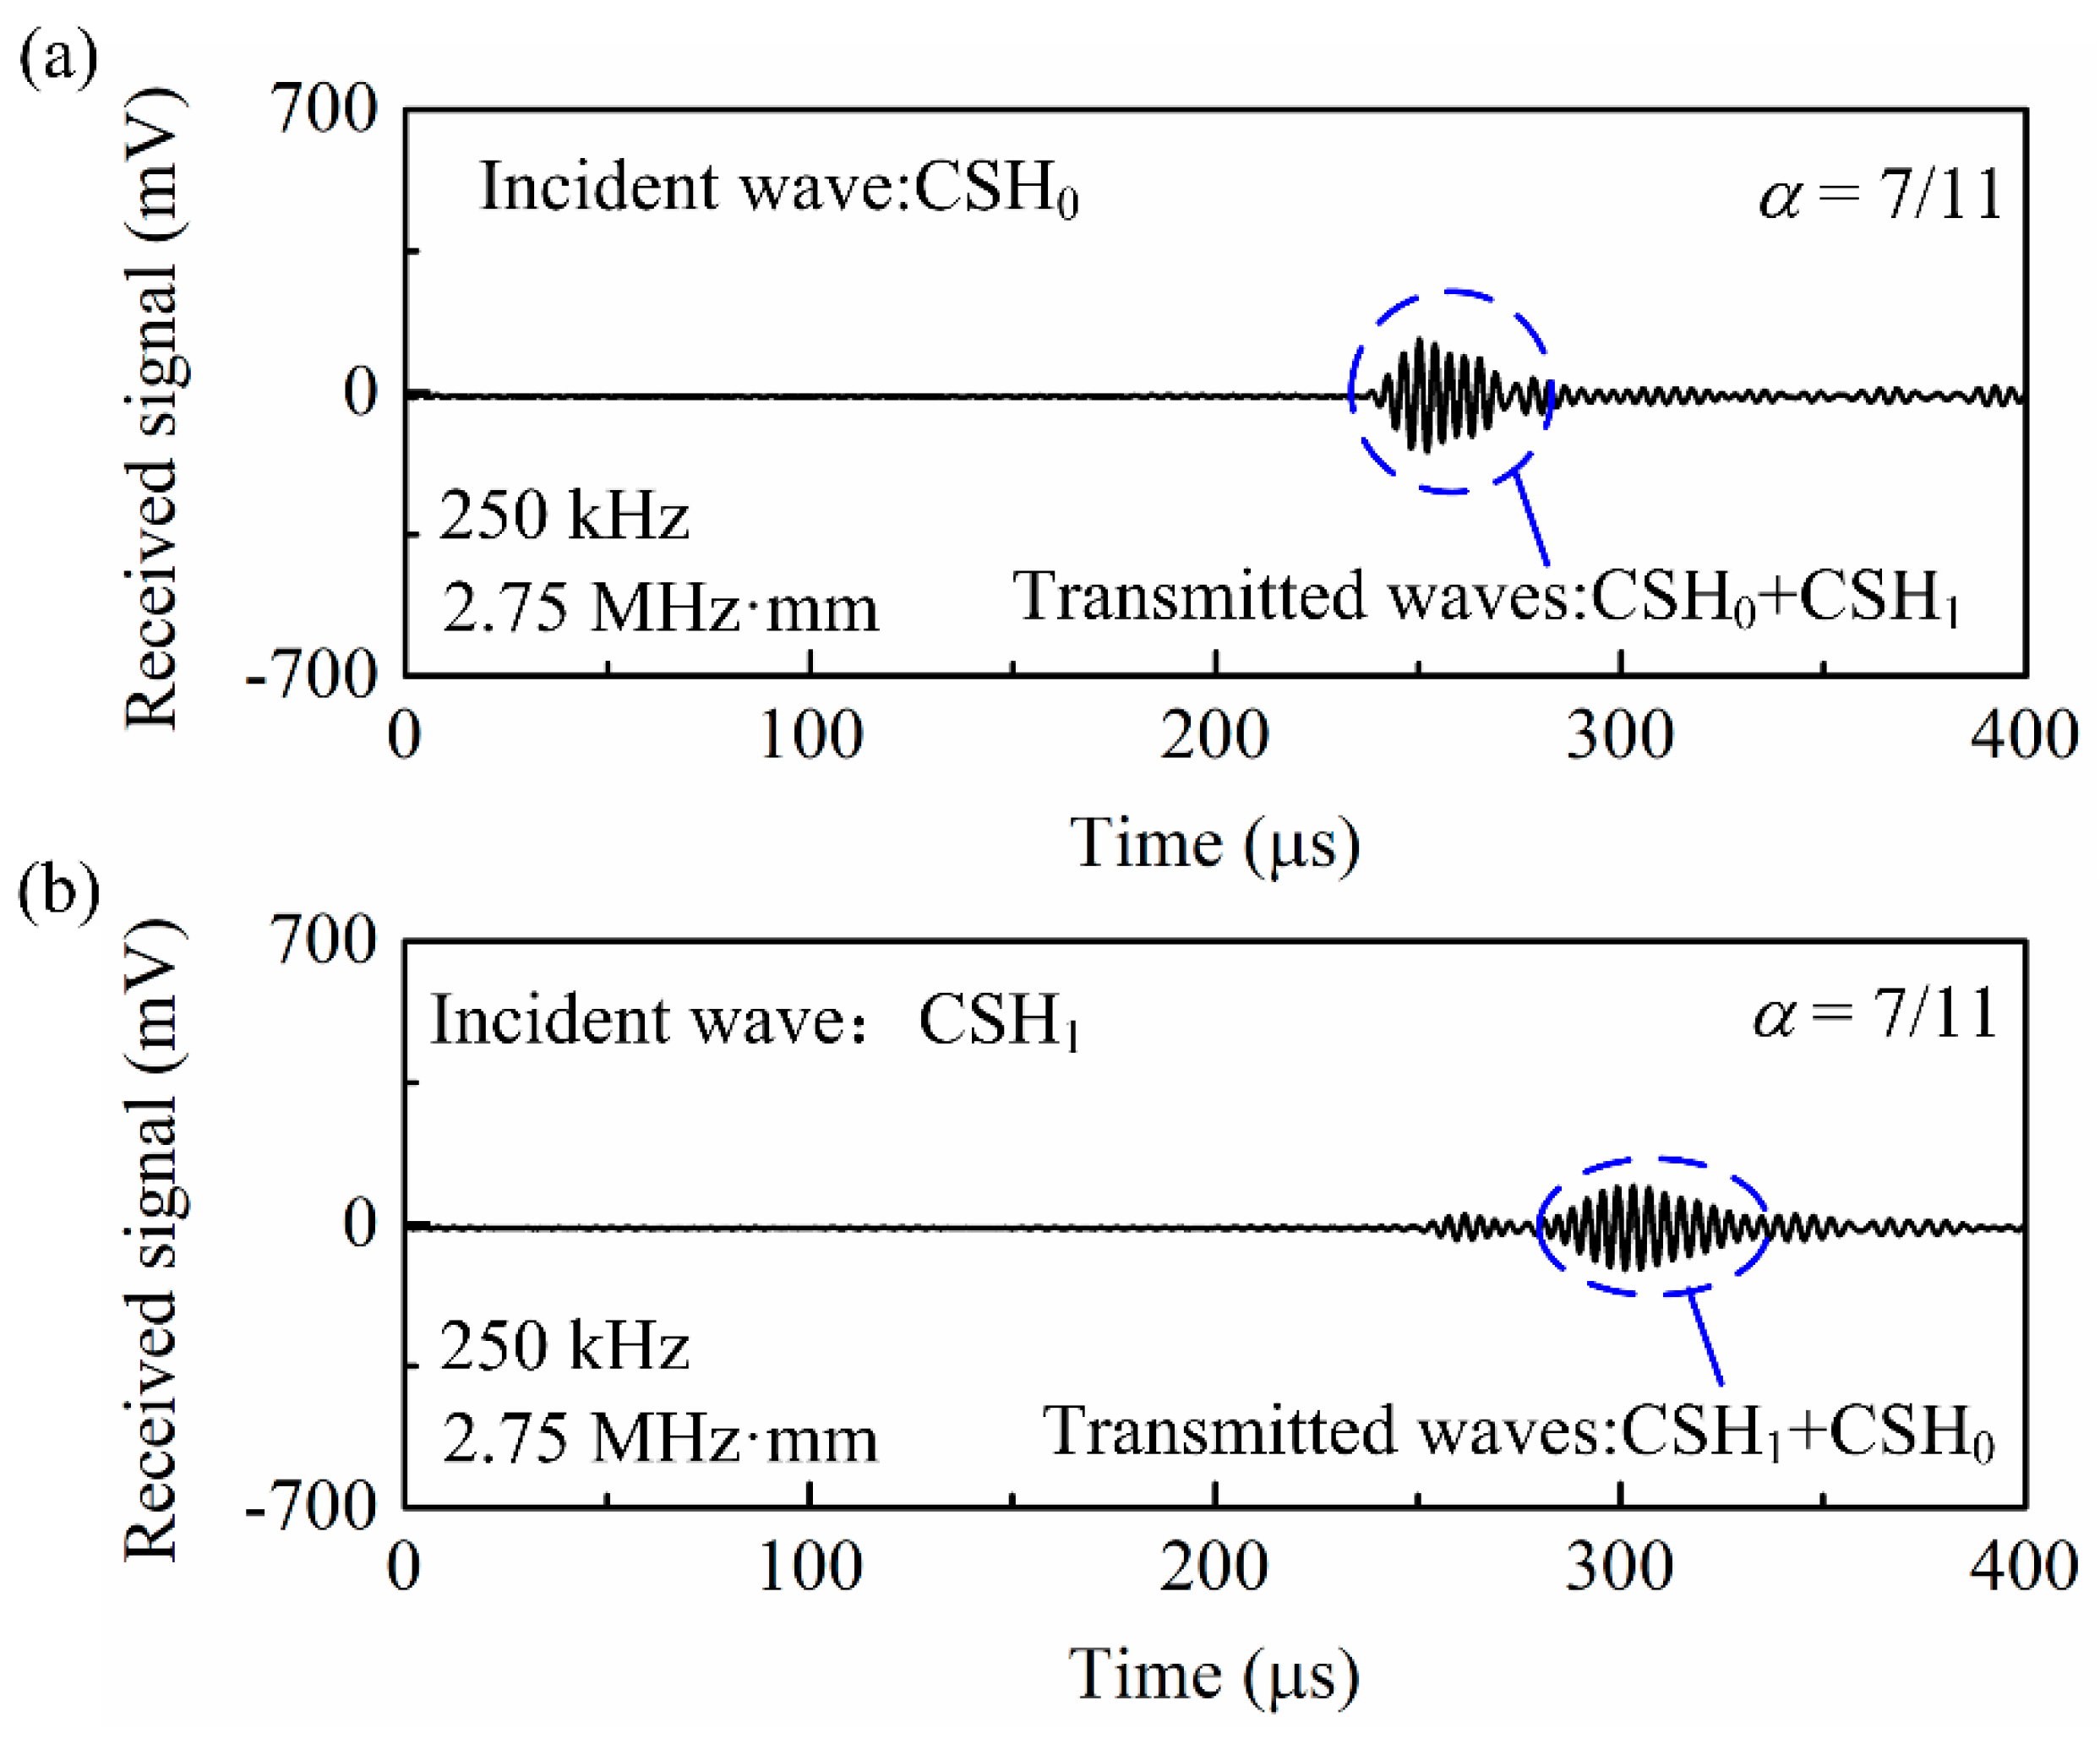
3.1. Excitation and Reception of CSH0 Wave by the Bidirectional Piezoelectric Transducer
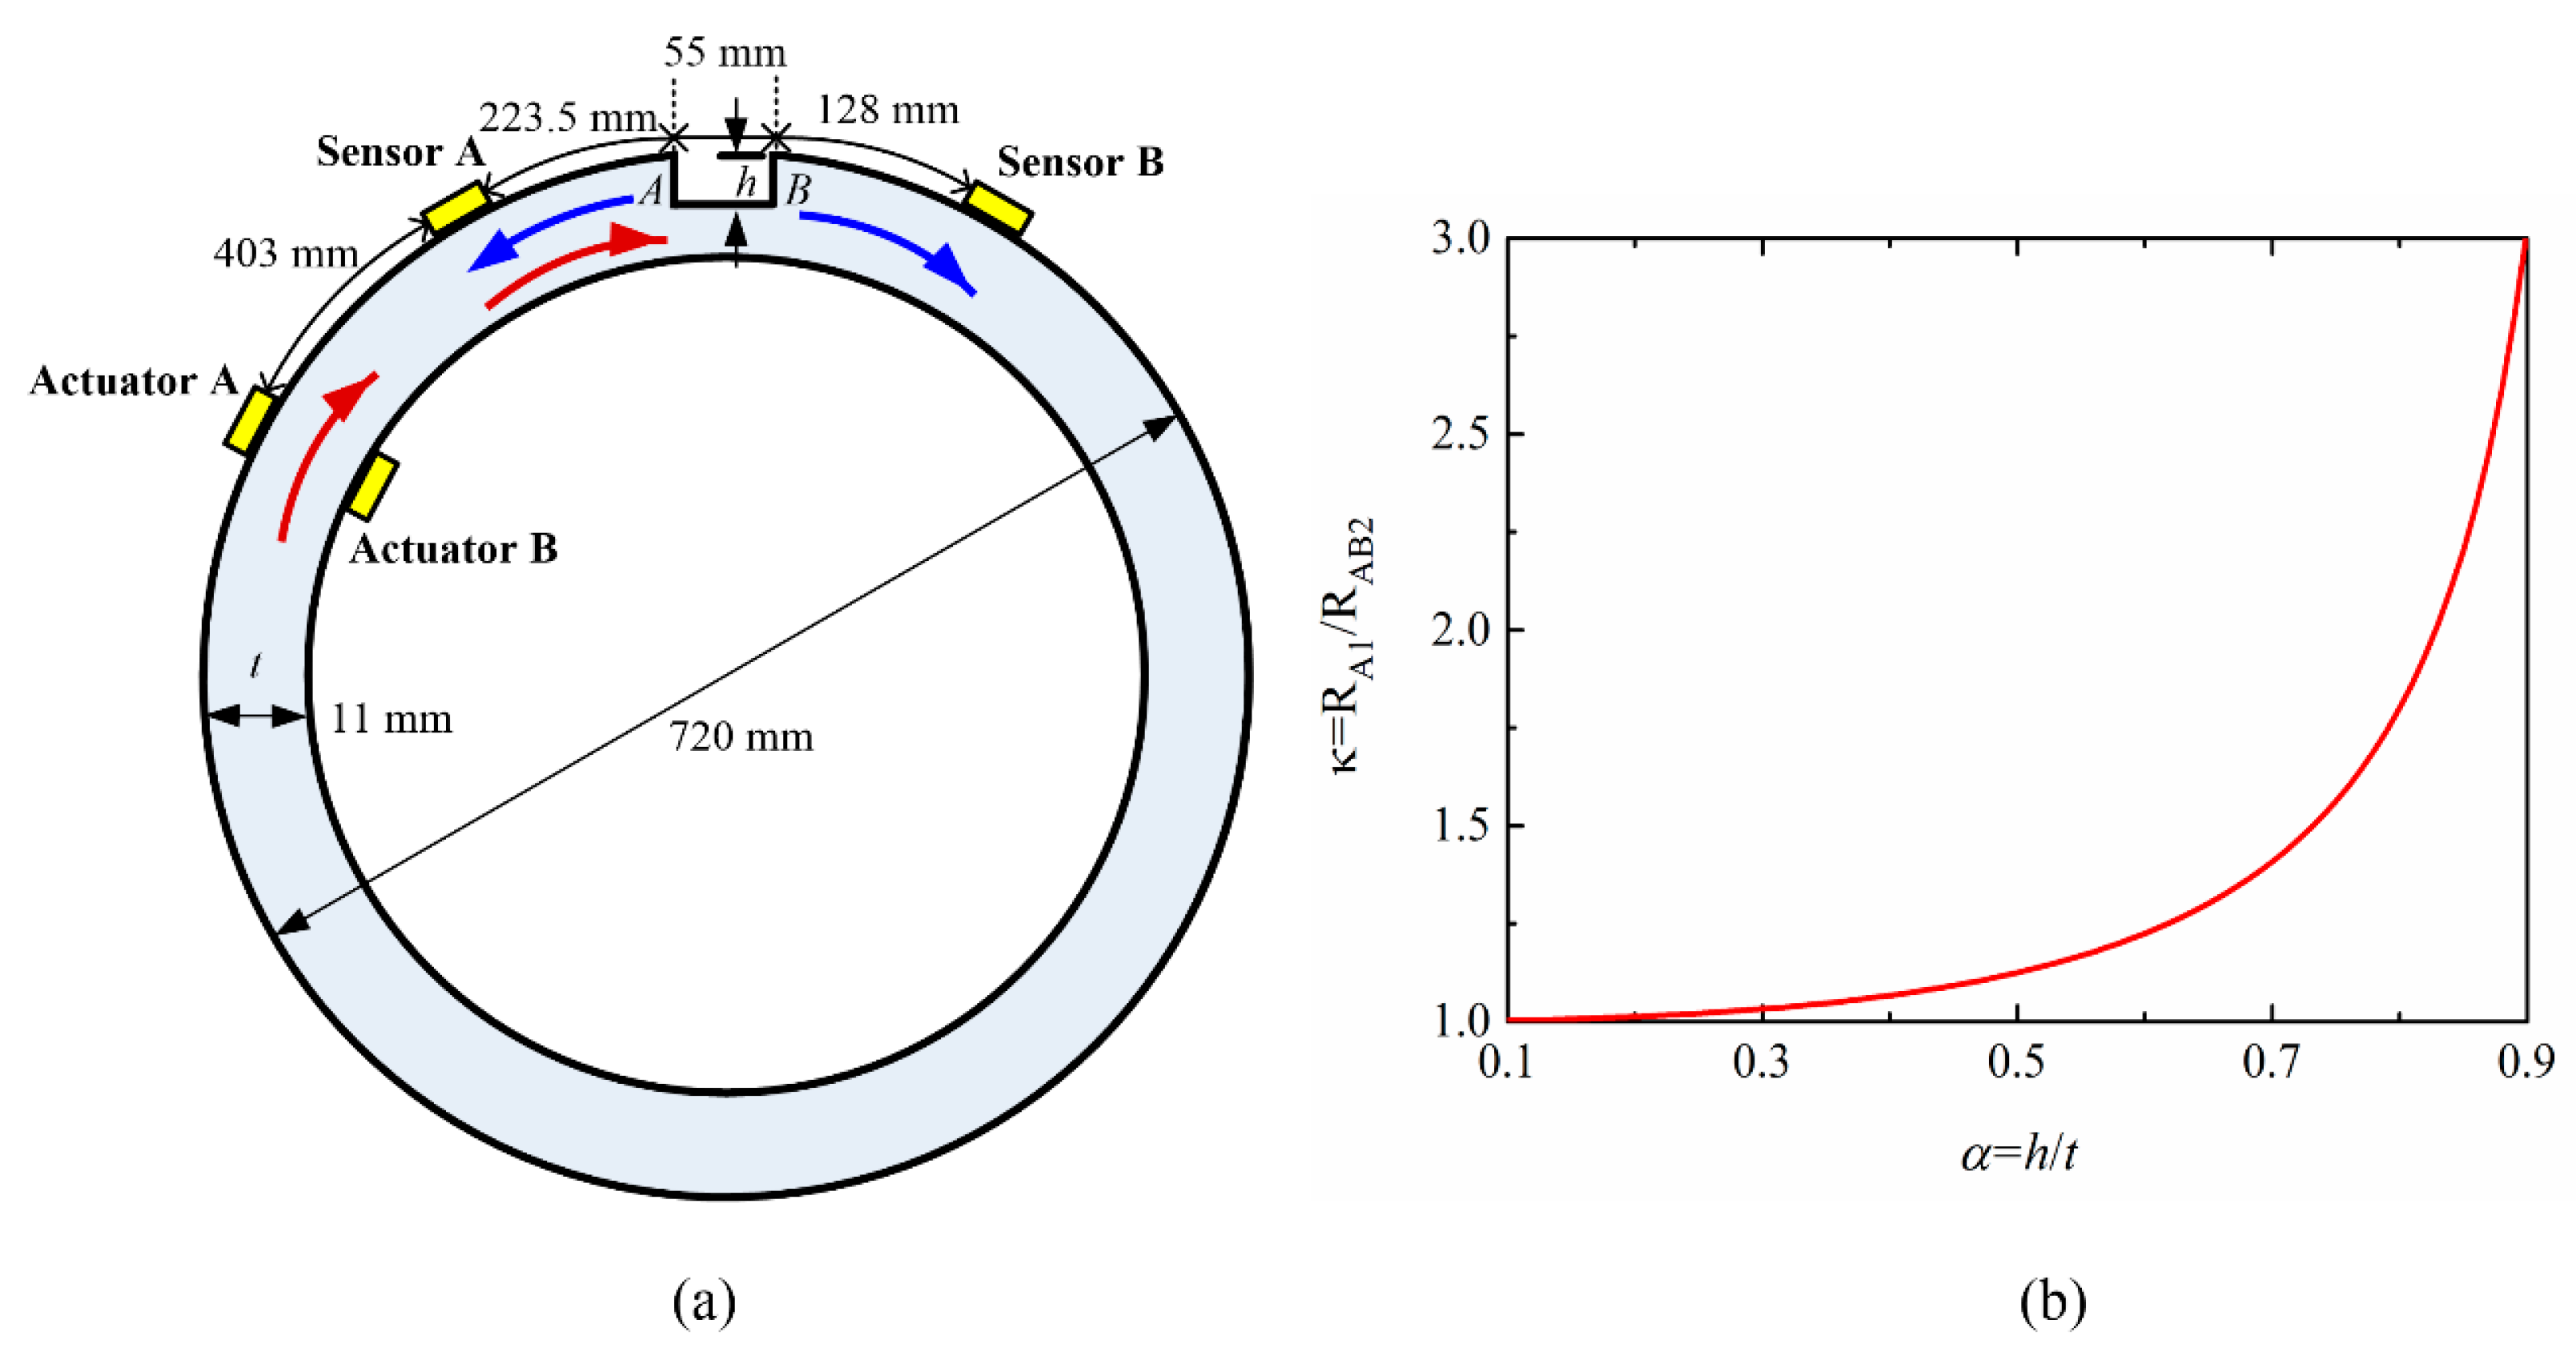
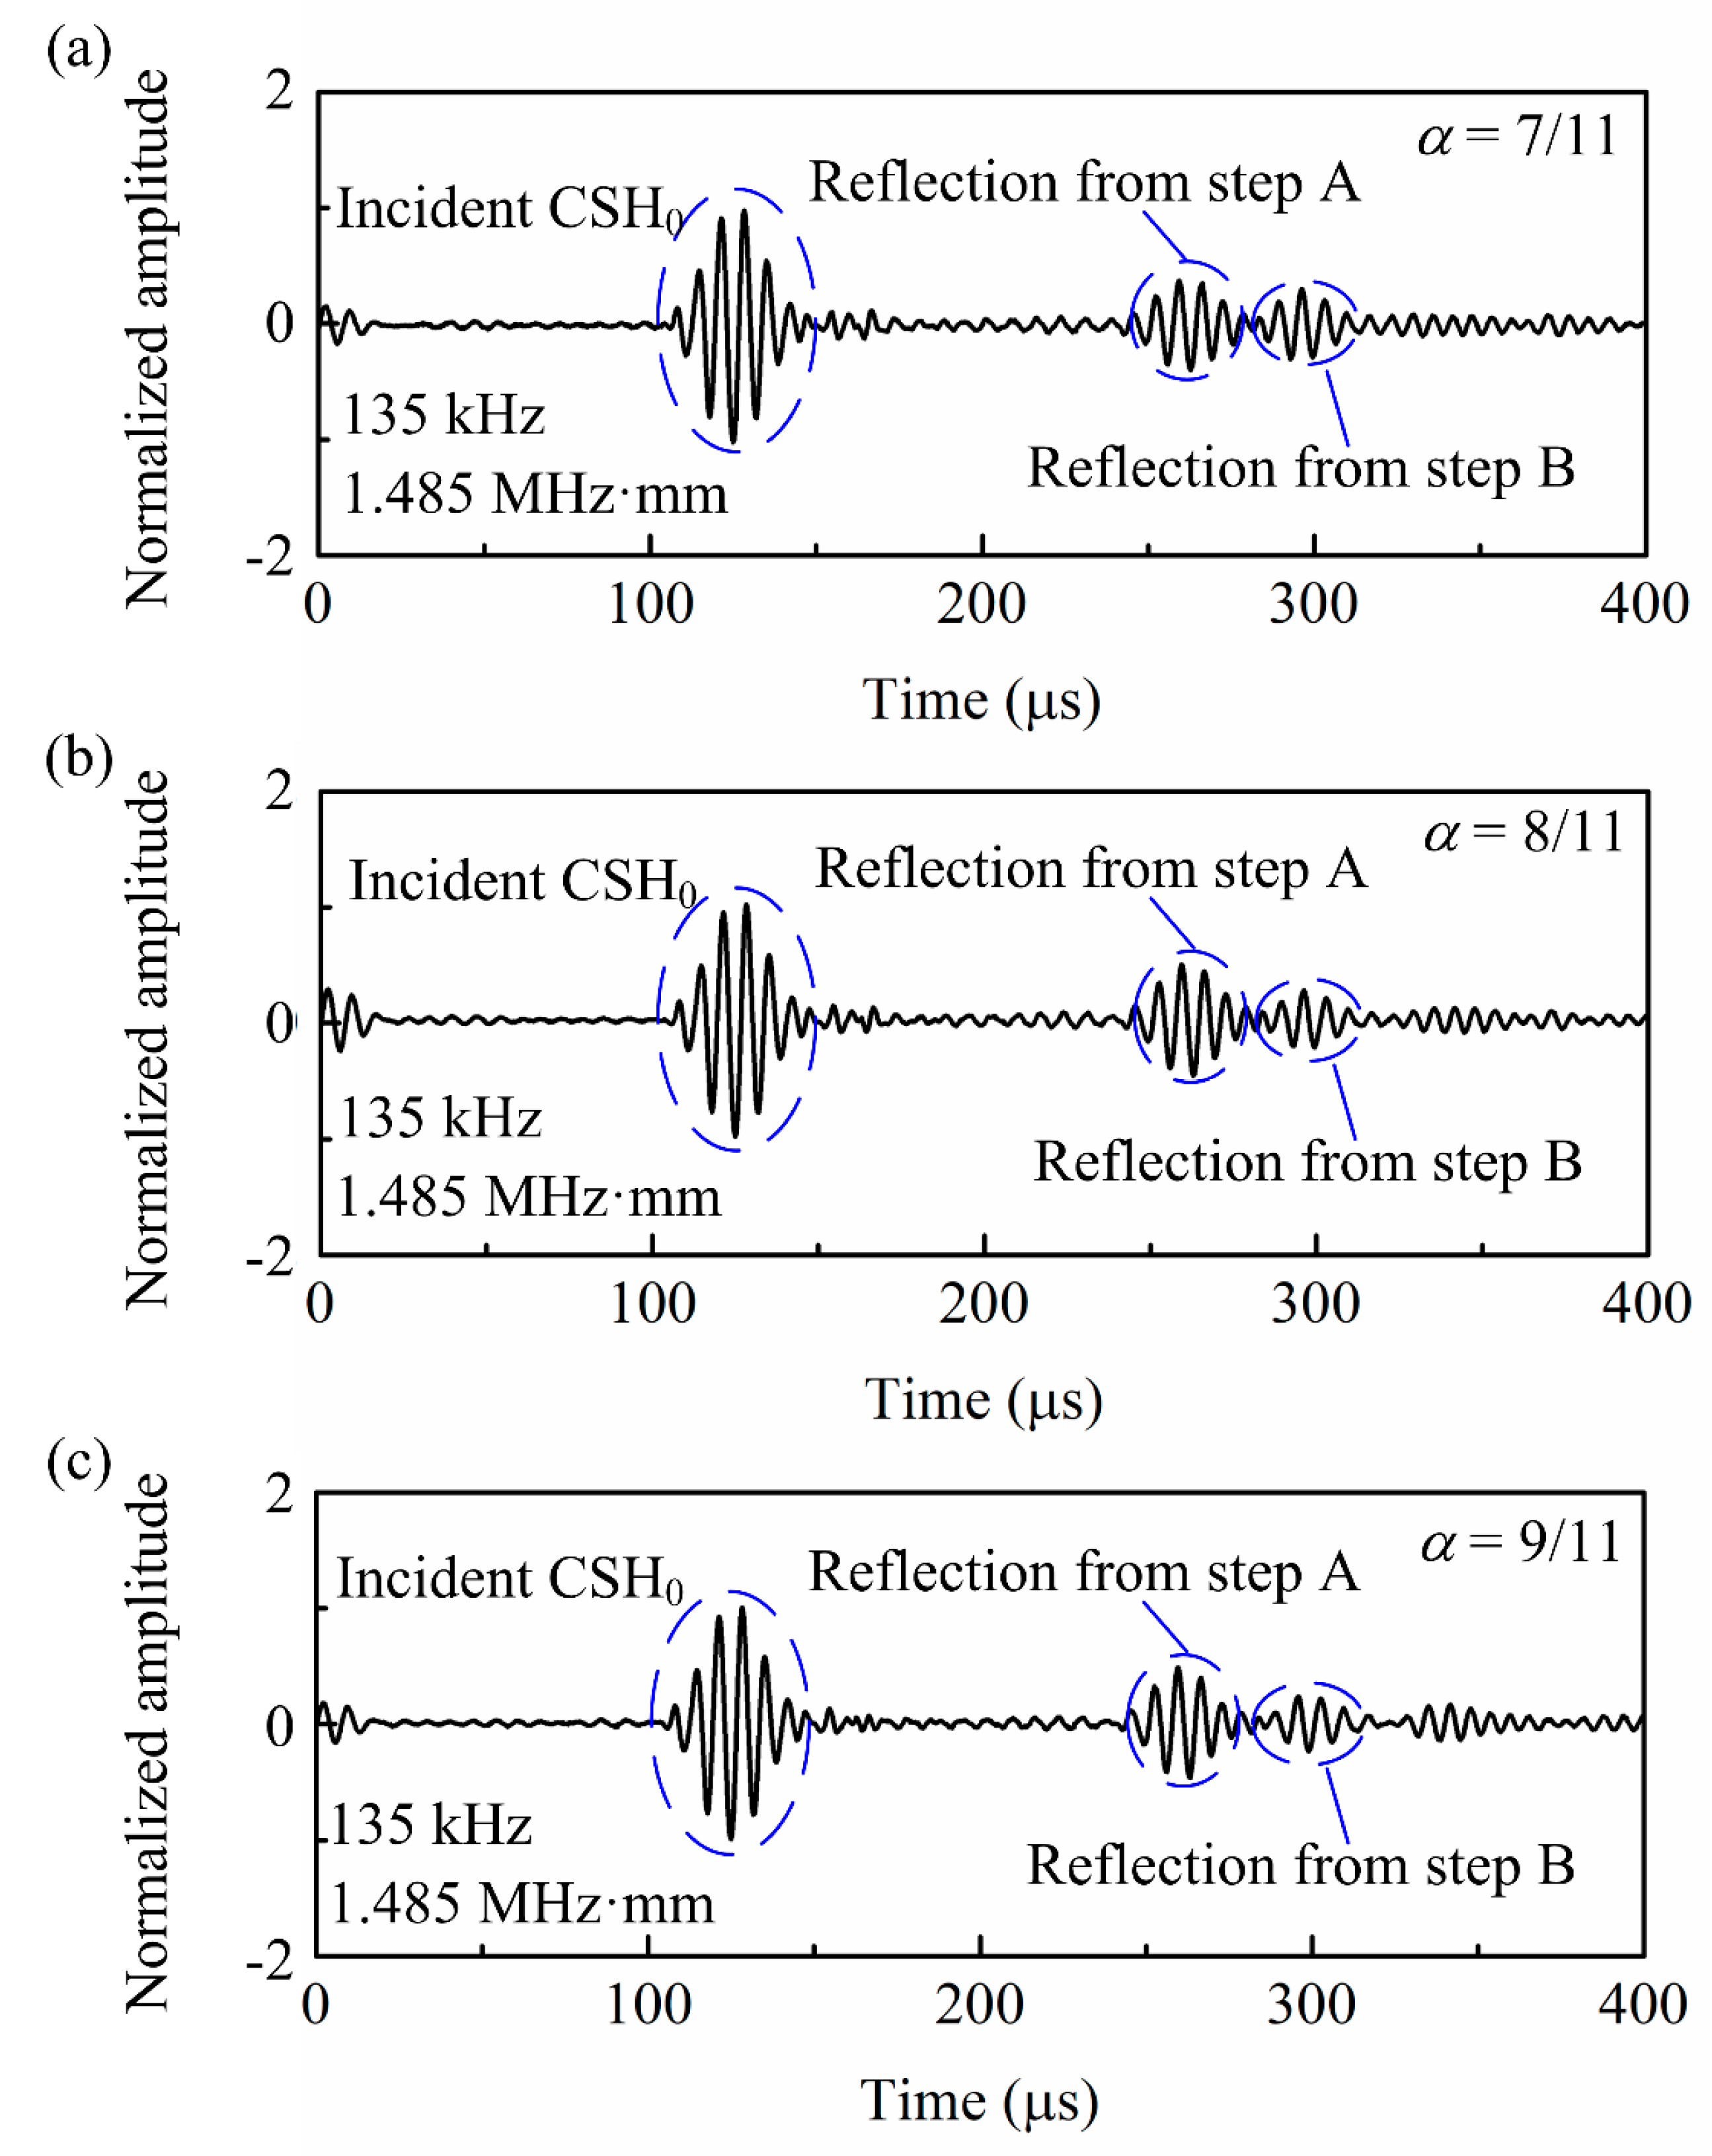
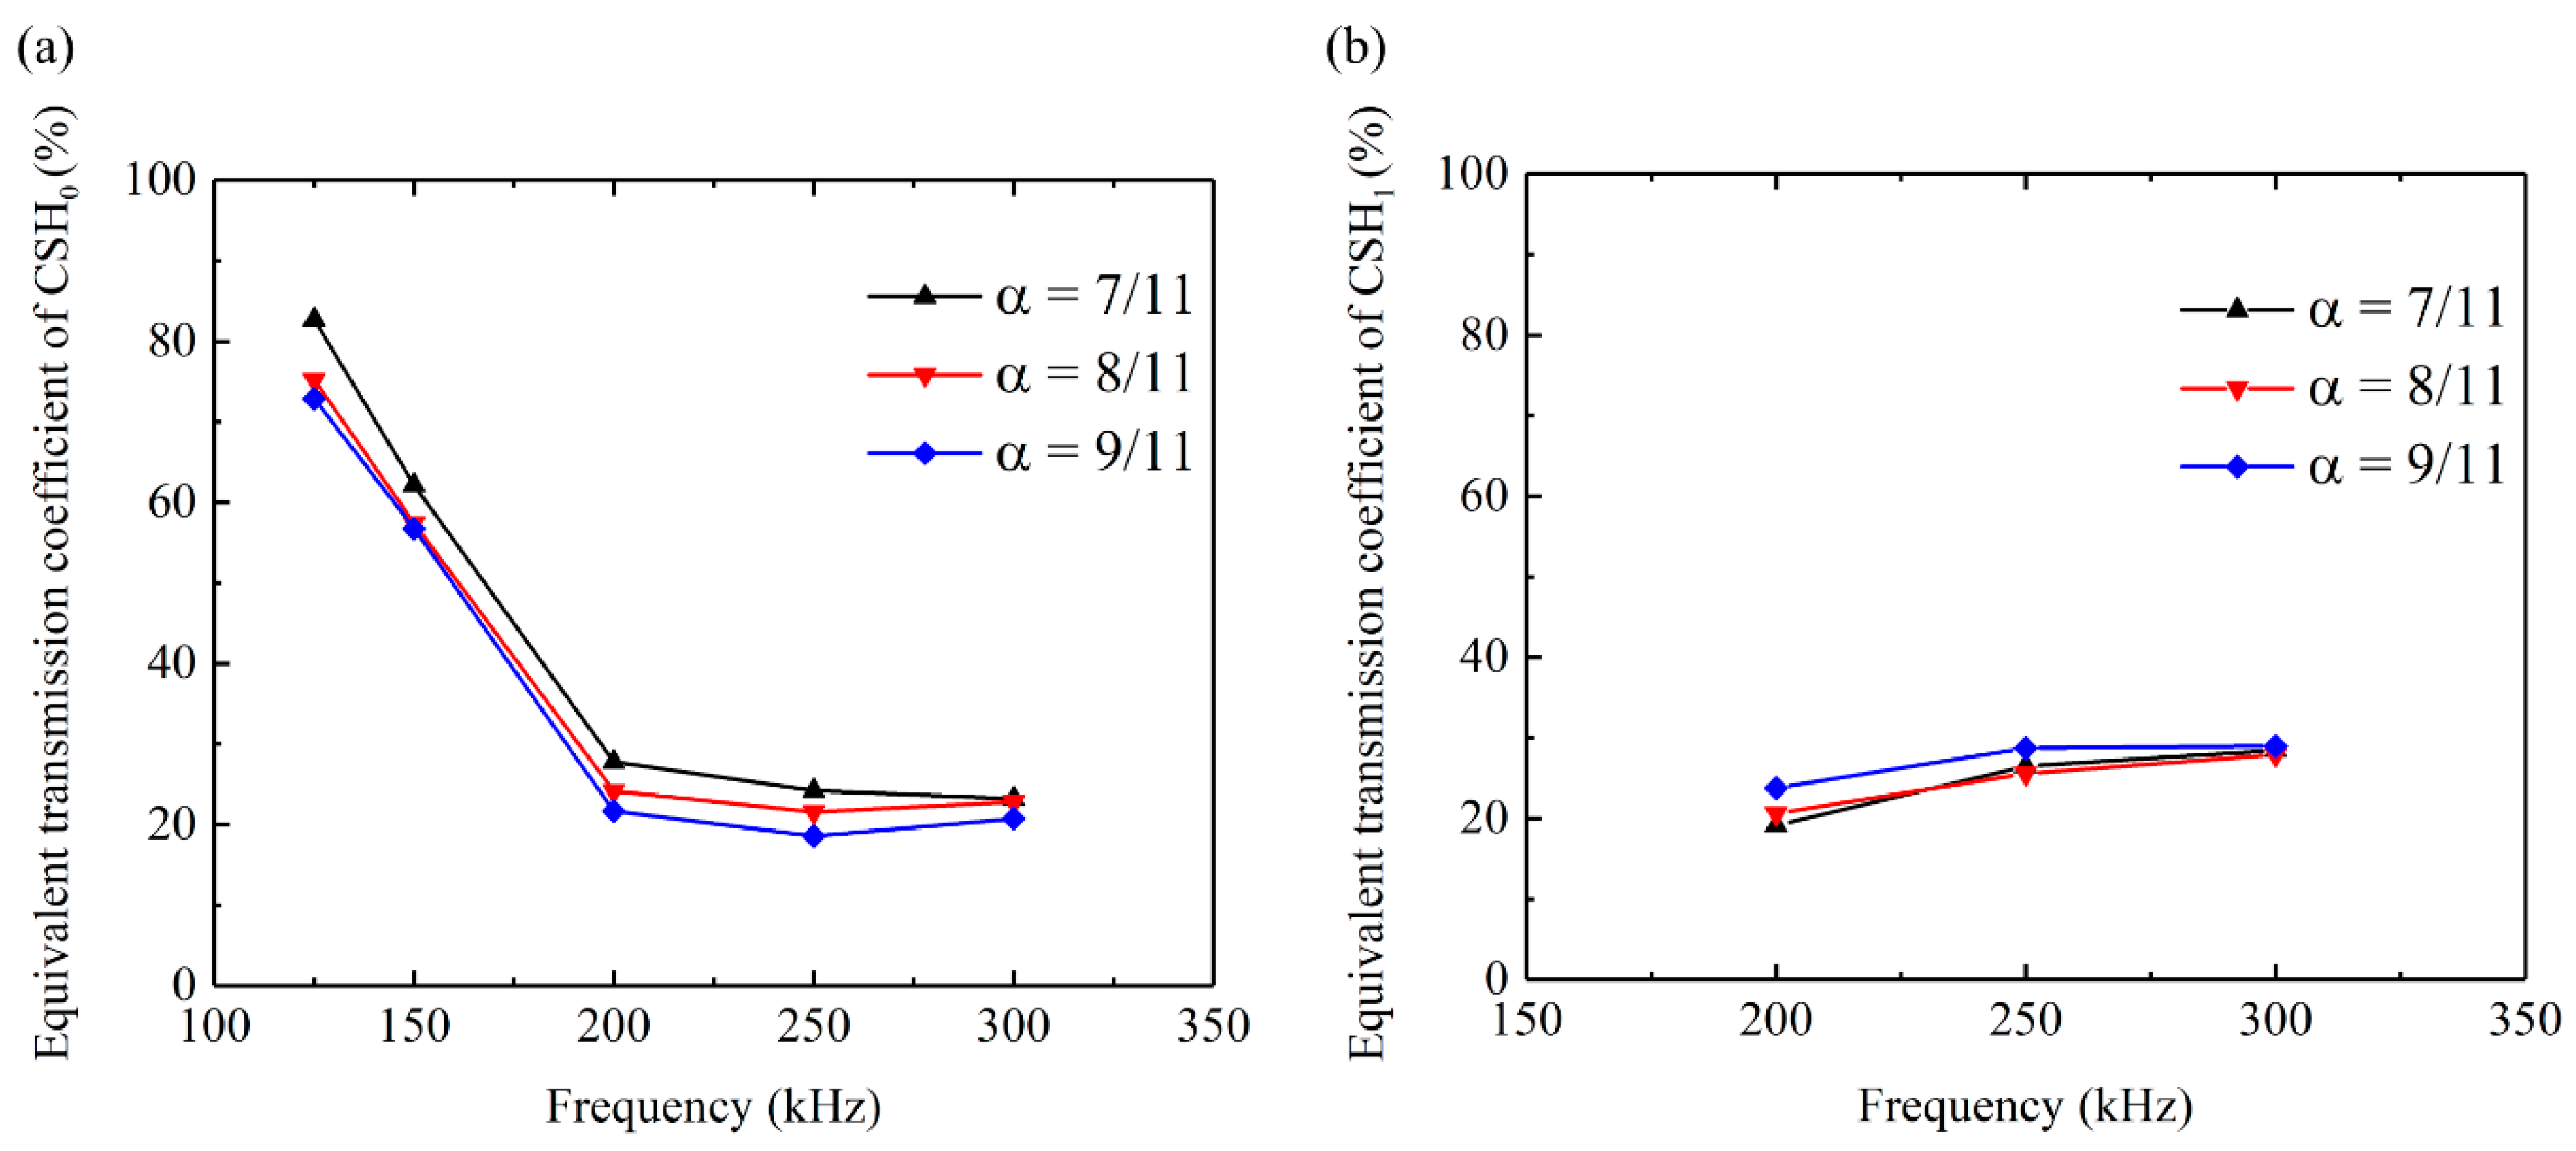
3.2. Sizing Corrosion-Like Defect with CSH0 Wave
4. Summary and Conclusions
Author Contributions
Funding
Conflicts of Interest
References
- Su, Z.Q.; Ye, L. Identification of Damage Using Lamb Waves: From Fundamentals to Applications; Springer Science & Business Media: Heidelberg, Germany, 2009; Volume 48. [Google Scholar]
- Guan, R.; Lu, Y.; Duan, W.; Wang, X. Guided waves for damage identification in pipeline structures: A review. Struct. Control Health Monit. 2017, 24, e2007. [Google Scholar] [CrossRef]
- Rose, J.L. Ultrasonic Guided Waves in Solid Media; Cambridge University Press: New York, NY, USA, 2014. [Google Scholar]
- Gazis, D.C. Three-Dimensional Investigation of the Propagation of Waves in Hollow Circular Cylinders. I. Analytical Foundation. J. Acoust. Soc. Am. 1959, 31, 568–573. [Google Scholar] [CrossRef]
- Gazis, D.C. Three-Dimensional Investigation of the Propagation of Waves in Hollow Circular Cylinders. II. Numerical Results. J. Acoust. Soc. Am. 1959, 31, 573–578. [Google Scholar] [CrossRef]
- Silk, M.G.; Bainton, K.F. The propagation in metal tubing of ultrasonic wave modes equivalent to Lamb waves. Ultrasonics 1979, 17, 11–19. [Google Scholar] [CrossRef]
- Alleyne, D.N.; Lowe, M.J.S.; Cawley, P. The Reflection of Guided Waves from Circumferential Notches in Pipes. J. Appl. Mech. 1998, 65, 635–641. [Google Scholar] [CrossRef]
- Kim, Y.Y.; Kwon, Y.E. Review of magnetostrictive patch transducers and applications in ultrasonic nondestructive testing of waveguides. Ultrasonics 2015, 62, 3–19. [Google Scholar] [CrossRef]
- Alleyne, D.N.; Cawley, P. The excitation of Lamb waves in pipes using dry-coupled piezoelectric transducers. J. Nondestruct. Eval. 1996, 15, 11–20. [Google Scholar] [CrossRef]
- Liu, Z.H.; He, C.F.; Wu, B.; Wang, X.M.; Yang, S.M. Circumferential and longitudinal defect detection using T (0, 1) mode excited by thickness shear mode piezoelectric elements. Ultrasonics 2006, 44, e1135–e1138. [Google Scholar] [CrossRef]
- Miao, H.C.; Huan, Q.; Wang, Q.Z.; Li, F.X. Excitation and reception of single torsional wave T (0,1) mode in pipes using face-shear d24 piezoelectric ring array. Smart Mater. Struct. 2017, 26, 025021. [Google Scholar] [CrossRef]
- Alleyne, D.N.; Vogt, T.; Cawley, P. The choice of torsional or longitudinal excitation in guided wave pipe inspection. Insight Non-Destr. Test. Cond. Monit. 2009, 51, 373–377. [Google Scholar] [CrossRef]
- Liu, Z.; Xie, X.; Wu, B.; Song, G.; He, C. Thick Wall Pipes Inspection by Using Circumferential Shear Horizontal Waves and Continuous Wavelet Transform Approach Tions. In Proceedings of the 2013 International Congress on Ultrasonics, Singapore, 2–5 May 2013; pp. 81–86. [Google Scholar]
- Clough, M.; Fleming, M.; Dixon, S. Circumferential guided wave EMAT system for pipeline screening using shear horizontal ultrasound. NDT E Int. 2017, 86, 20–27. [Google Scholar] [CrossRef]
- Howard, R.; Cegla, F. On the probability of detecting wall thinning defects with dispersive circumferential guided waves. NDT E Int. 2017, 86, 73–82. [Google Scholar] [CrossRef]
- Howard, R.; Cegla, F. Detectability of corrosion damage with circumferential guided waves in reflection and transmission. NDT E Int. 2017, 91, 108–119. [Google Scholar] [CrossRef]
- Luo, W.; Rose, J.L.; Van Velsor, J.K.; Avioli, M.; Spanner, J. Circumferential guided waves for defect detection in coated pipe. AIP Conf. Proc. 2006, 820, 165–172. [Google Scholar]
- Chua, C.A.; Alleyne, D.N.; Calva, M. Crack growth monitoring using low-frequency guided waves. Insight 2017, 59, 64–71. [Google Scholar] [CrossRef]
- Liu, G.L.; Qu, J.M. Guided circumferential waves in a circular annulus. J. Appl. Mech. Trans. ASME 1998, 65, 424–430. [Google Scholar] [CrossRef]
- Zhao, X.L.; Rose, J.L. Guided circumferential shear horizontal waves in an isotropic hollow cylinder. J. Acoust. Soc. Am. 2004, 115, 1912–1916. [Google Scholar] [CrossRef]
- Zhao, X.L.; Varma, V.K.; Mei, G.; Ayhan, B.; Kwan, C. In-line nondestructive inspection of mechanical dents on pipelines with guided shear horizontal wave electromagnetic acoustic transducers. J. Press. Vessel Technol. ASME 2005, 127, 304–309. [Google Scholar] [CrossRef]
- Luo, W.; Zhao, X.L.; Rose, J.L. A guided wave plate experiment for a pipe. J. Press. Vessel Technol. ASME 2005, 127, 345–350. [Google Scholar] [CrossRef]
- Kubrusly, A.C.; Freitas, M.A.; von der Weid, J.P.; Dixon, S. Interaction of SH guided waves with wall thinning. NDT E Int. 2019, 101, 94–103. [Google Scholar] [CrossRef]
- Demma, A.; Cawley, P.; Lowe, M. Scattering of the fundamental shear horizontal mode from steps and notches in plates. J. Acoust. Soc. Am. 2003, 113, 1880–1891. [Google Scholar] [CrossRef]
- Pau, A.; Capecchi, D.; Vestroni, F. Reciprocity principle for scattered fields from discontinuities in waveguides. Ultrasonics 2015, 55, 85–91. [Google Scholar] [CrossRef] [PubMed]
- Pau, A.; Achillopoulou, D.V. Interaction of Shear and Rayleigh-Lamb Waves with Notches and Voids in Plate Waveguides. Materials 2017, 10, 841. [Google Scholar] [CrossRef] [PubMed]
- Zhao, X.G.; Rose, J.L. Boundary element modeling for defect characterization potential in a wave guide. Int. J. Solids Struct. 2003, 40, 2645–2658. [Google Scholar] [CrossRef]
- Wang, S.; Huang, S.; Zhao, W.; Wei, Z. 3D modeling of circumferential SH guided waves in pipeline for axial cracking detection in ILI tools. Ultrasonics 2015, 56, 325–331. [Google Scholar] [CrossRef]
- Nakamura, N.; Ogi, H.; Hirao, M.; Nakahata, K. Mode conversion behavior of SH guided wave in a tapered plate. NDT E Int. 2012, 45, 156–161. [Google Scholar]
- Nurmalia, N.; Nakamura, N.; Ogi, H.; Hirao, M. Detection of Shear Horizontal Guided Waves Propagating in Aluminum Plate with Thinning Region. Jpn. J. Appl. Phys. 2011, 50, 07HC17. [Google Scholar] [CrossRef]
- Kubrusly, A.C.; von der Weid, J.P.; Dixon, S. Experimental and numerical investigation of the interaction of the first four SH guided wave modes with symmetric and non-symmetric discontinuities in plates. NDT E Int. 2019, 108, 102175. [Google Scholar] [CrossRef]
- Hirao, M.; Ogi, H. An SH-wave EMAT technique for gas pipeline inspection. NDT E Int. 1999, 32, 127–132. [Google Scholar] [CrossRef]
- Miao, H.C.; Dong, S.X.; Li, F.X. Excitation of fundamental shear horizontal wave by using face-shear (d36) piezoelectric ceramics. J. Appl. Phys. 2016, 119, 174101. [Google Scholar] [CrossRef]
- Miao, H.C.; Huan, Q.; Li, F.X. Excitation and reception of pure shear horizontal waves by using face-shear d (24) mode piezoelectric wafers. Smart Mater. Struct. 2016, 25, 11LT01. [Google Scholar] [CrossRef]
- Miao, H.C.; Xu, L.; Zhang, H. SH guided wave excitation by an apparent face-shear mode (d36) piezocomposite transducer: Experiments and theory. Smart Mater. Struct. 2019, 28, 115045. [Google Scholar] [CrossRef]
- Huan, Q.; Chen, M.; Li, F. A Comparative Study of Three Types Shear Mode Piezoelectric Wafers in Shear Horizontal Wave Generation and Reception. Sensors 2018, 18, 2681. [Google Scholar] [CrossRef] [PubMed]
- Zhou, W.; Yuan, F.G.; Shi, T. Guided torsional wave generation of a linear in-plane shear piezoelectric array in metallic pipes. Ultrasonics 2016, 65, 69–77. [Google Scholar] [CrossRef] [PubMed]
- Miao, H.C.; Huan, Q.; Li, F.X.; Kang, G.Z. A variable-frequency bidirectional shear horizontal (SH) wave transducer based on dual face-shear (d24) piezoelectric wafers. Ultrasonics 2018, 89, 13–21. [Google Scholar] [CrossRef] [PubMed]
- Su, Z.Q.; Ye, L. Selective generation of Lamb wave modes and their propagation characteristics in defective composite laminates. Proc. Inst. Mech. Eng. Part L J. Mater. Des. Appl. 2004, 218, 95–110. [Google Scholar] [CrossRef]
- Kubrusly, A.C.; Freitas, M.A.; von der Weid, J.P.; Dixon, S. Mode Selectivity of SH Guided Waves by Dual Excitation and Reception Applied to Mode Conversion Analysis. IEEE Trans. Ultrason. Ferroelectr. Freq. Control 2018, 65, 1239–1249. [Google Scholar] [CrossRef]


| Measured Depth (mm) | True Depth (mm) | Error | |
|---|---|---|---|
| 1.298 | 7.128 | 7 | 1.8% |
| 1.831 | 8.855 | 8 | 10.7% |
| 2.010 | 9.126 | 9 | 1.4% |
© 2020 by the authors. Licensee MDPI, Basel, Switzerland. This article is an open access article distributed under the terms and conditions of the Creative Commons Attribution (CC BY) license (http://creativecommons.org/licenses/by/4.0/).
Share and Cite
Zhang, H.; Du, Y.; Tang, J.; Kang, G.; Miao, H. Circumferential SH Wave Piezoelectric Transducer System for Monitoring Corrosion-Like Defect in Large-Diameter Pipes. Sensors 2020, 20, 460. https://doi.org/10.3390/s20020460
Zhang H, Du Y, Tang J, Kang G, Miao H. Circumferential SH Wave Piezoelectric Transducer System for Monitoring Corrosion-Like Defect in Large-Diameter Pipes. Sensors. 2020; 20(2):460. https://doi.org/10.3390/s20020460
Chicago/Turabian StyleZhang, Hao, Yuehao Du, Jihua Tang, Guozheng Kang, and Hongchen Miao. 2020. "Circumferential SH Wave Piezoelectric Transducer System for Monitoring Corrosion-Like Defect in Large-Diameter Pipes" Sensors 20, no. 2: 460. https://doi.org/10.3390/s20020460
APA StyleZhang, H., Du, Y., Tang, J., Kang, G., & Miao, H. (2020). Circumferential SH Wave Piezoelectric Transducer System for Monitoring Corrosion-Like Defect in Large-Diameter Pipes. Sensors, 20(2), 460. https://doi.org/10.3390/s20020460