Research on the Single-Value Indicators for Centrifugal Pump Based on Vibration Signals


Abstract
1. Introduction
2. Theory and Methodology
2.1. Vibration Features of Centrifugal Pump
2.2. Development of the Single-Value Indicators of Vibration for a Centrifugal Pump
3. Experiment
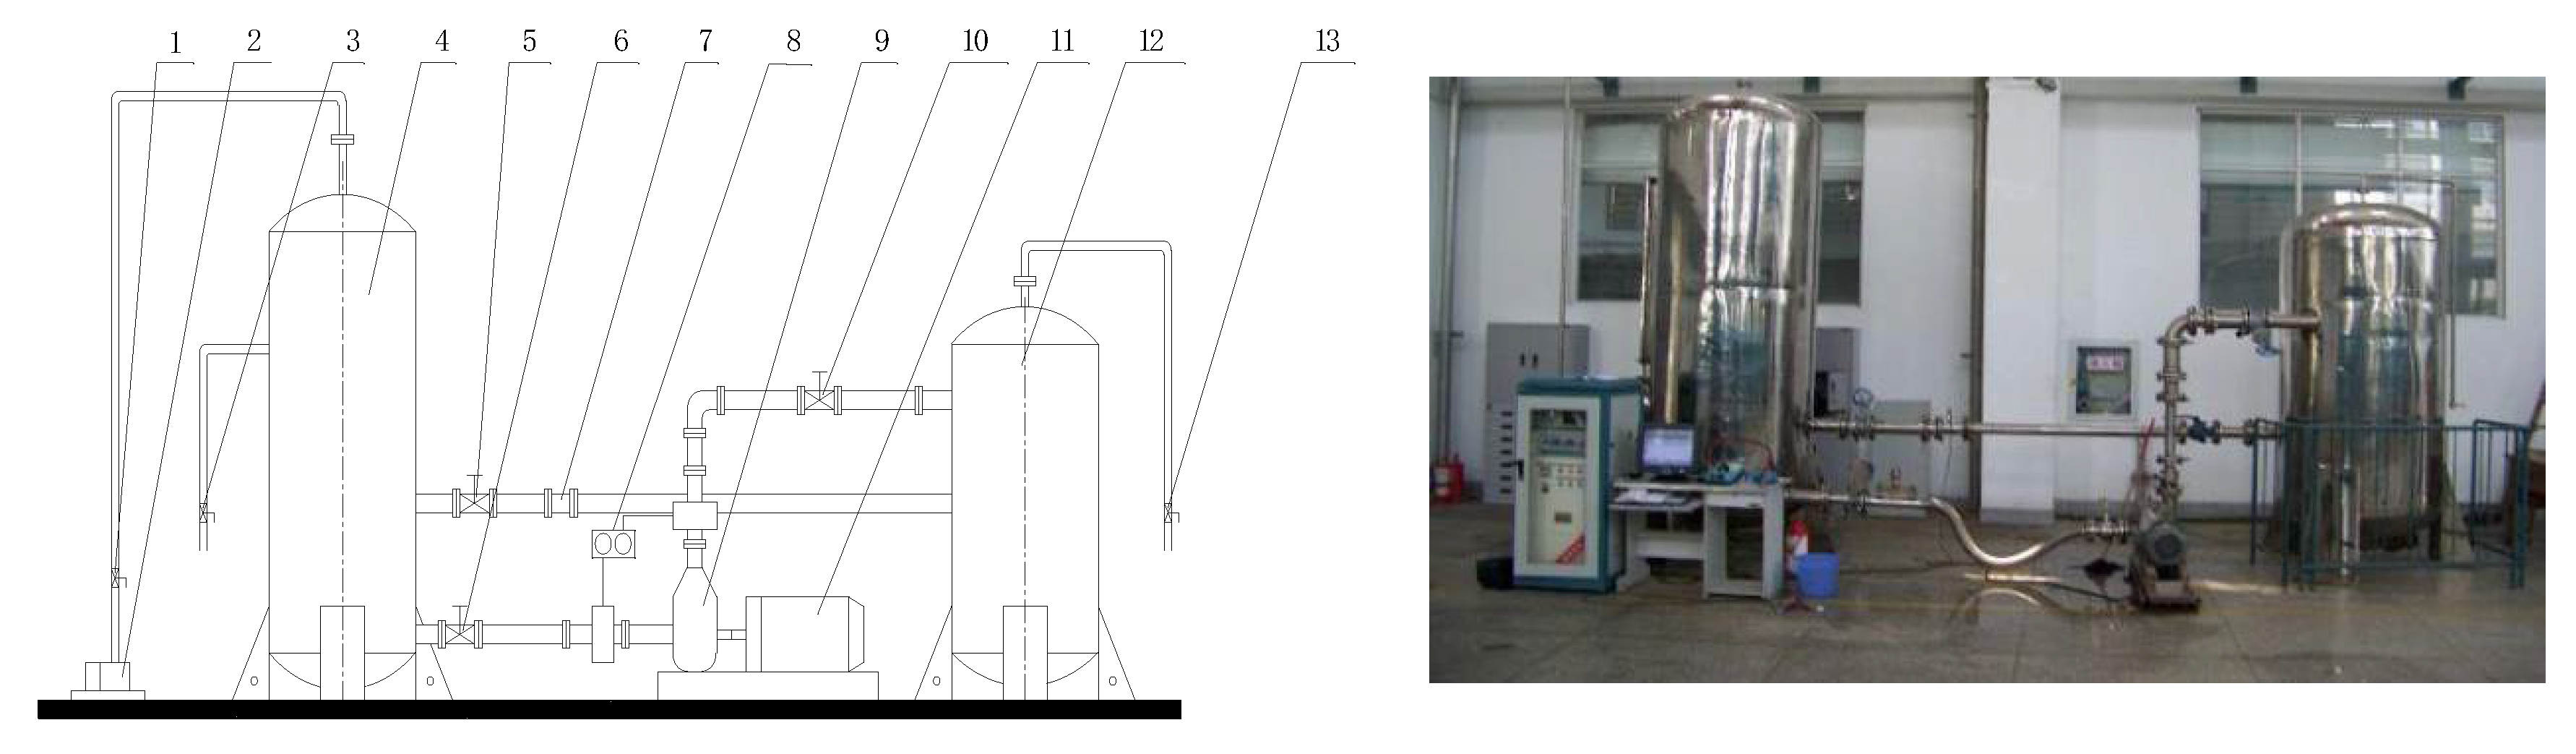
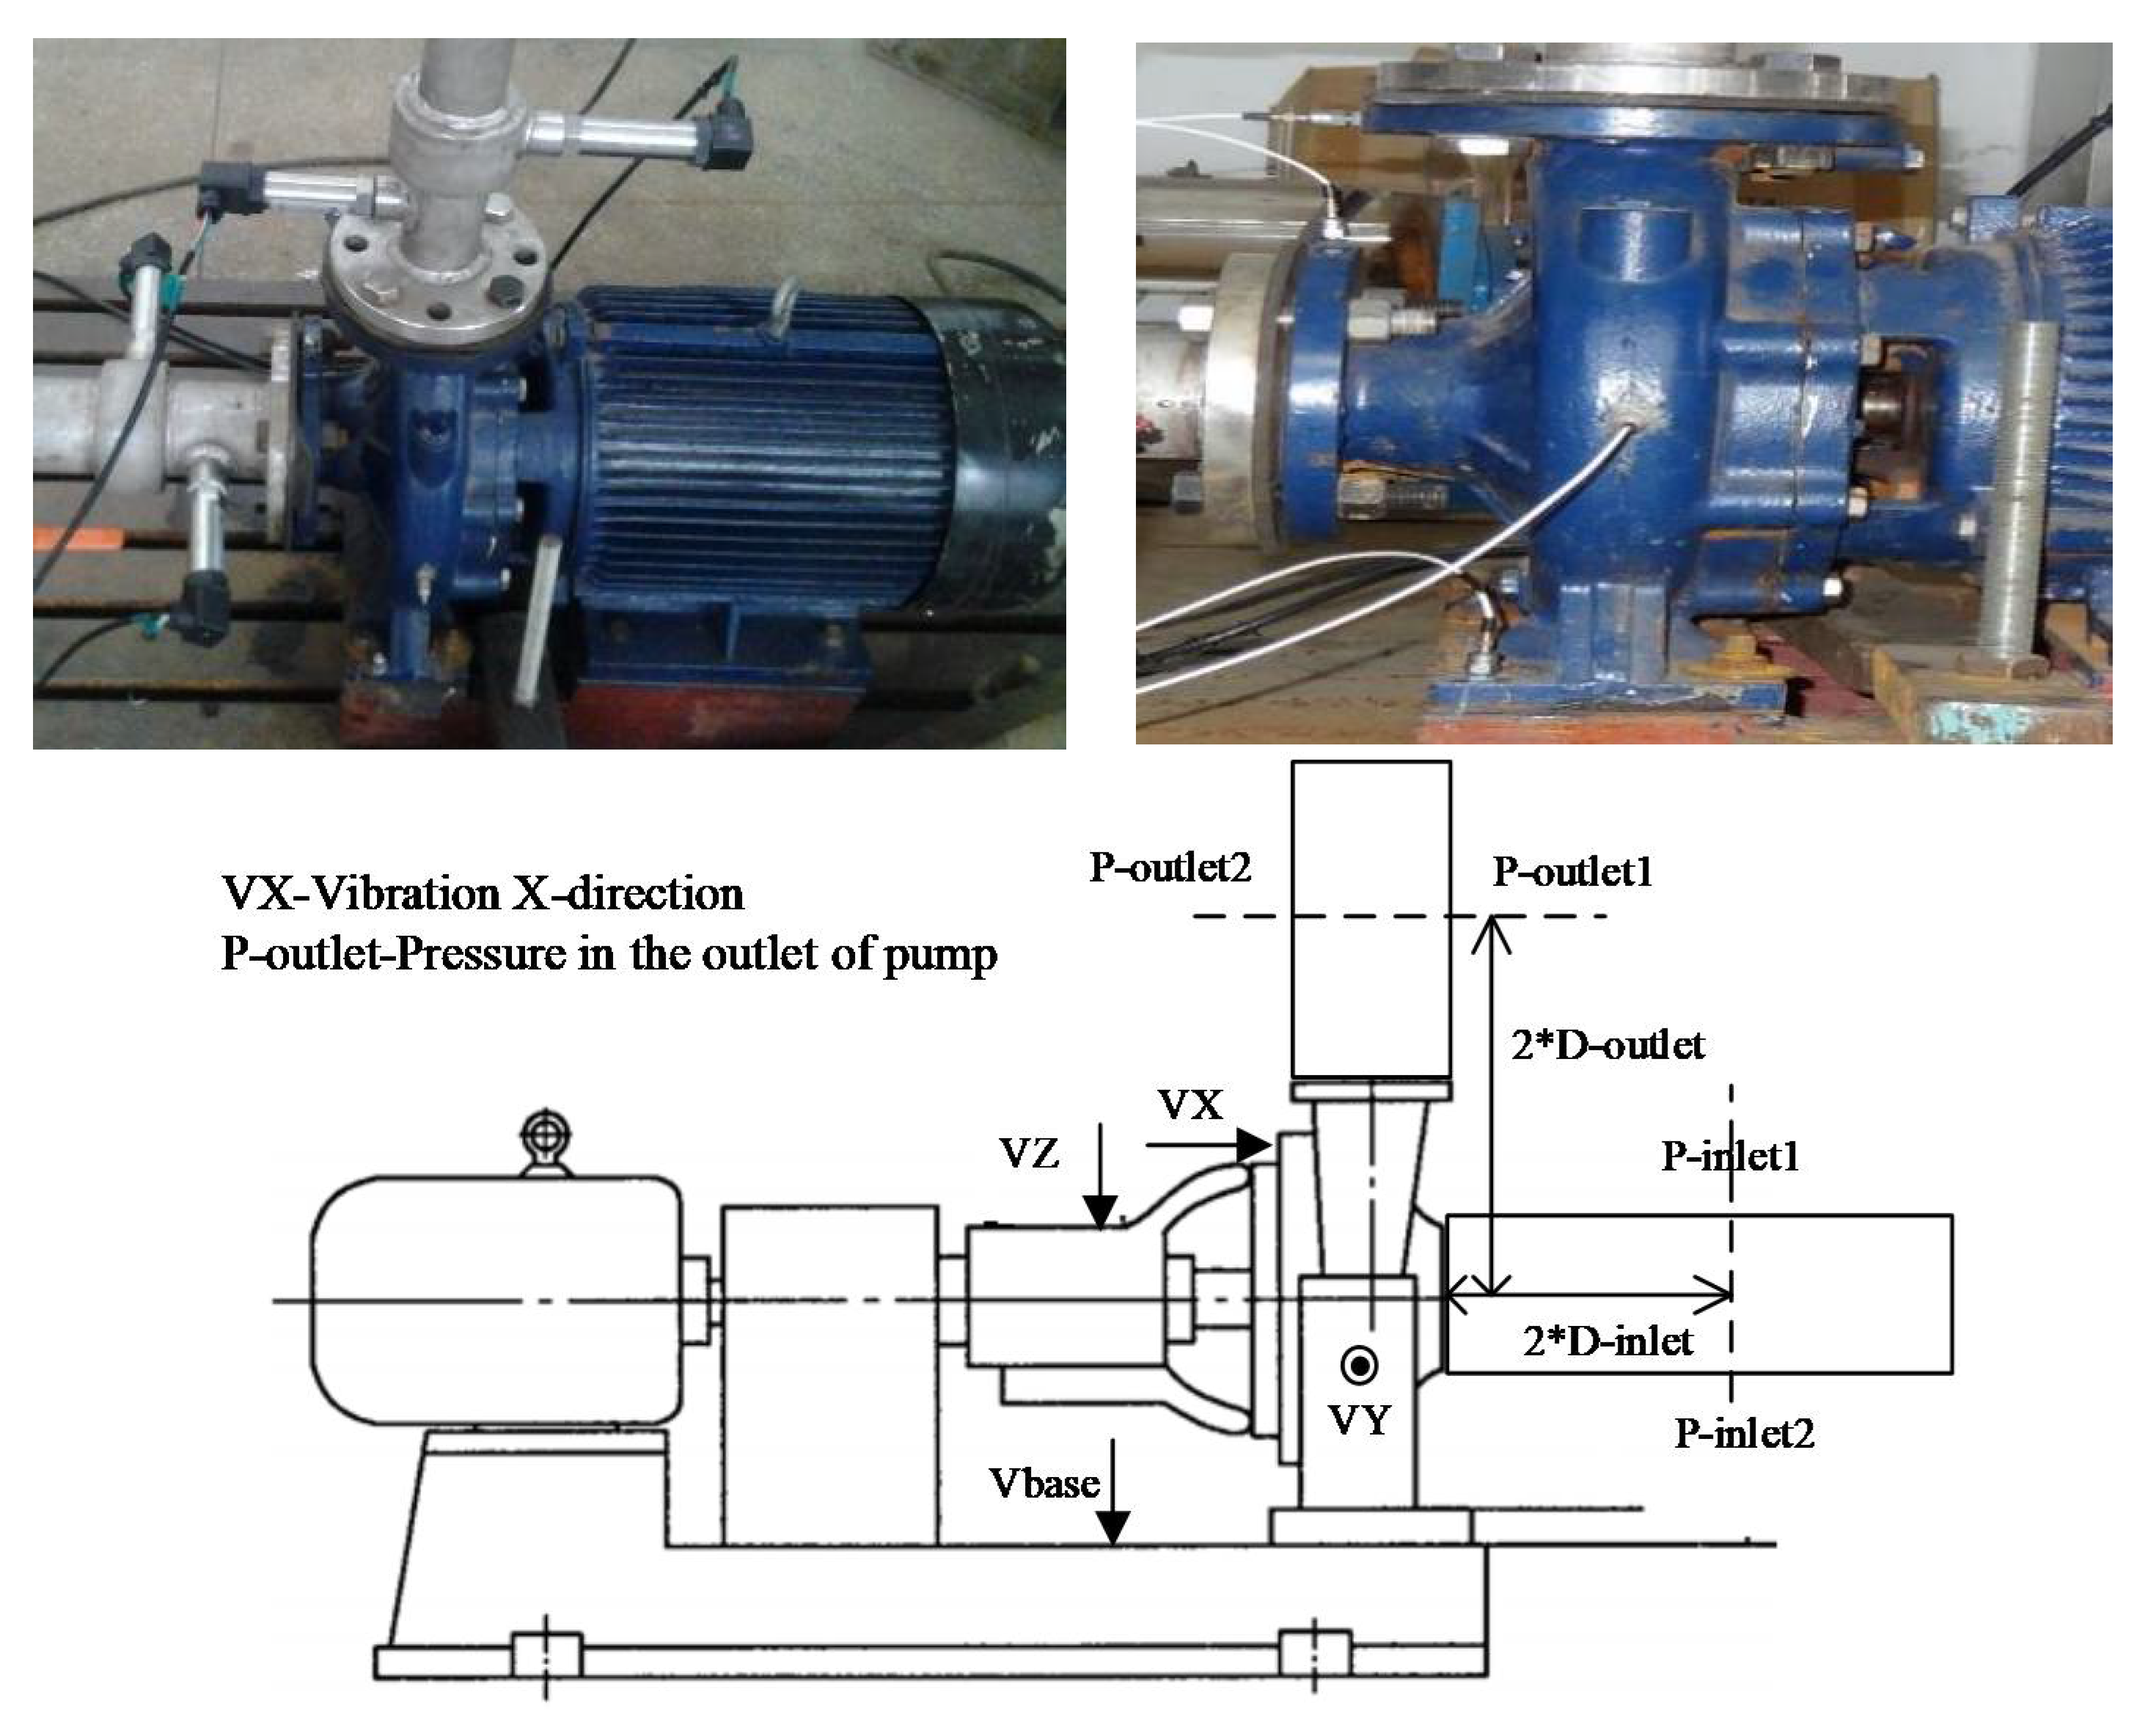
3.1. Test Bed
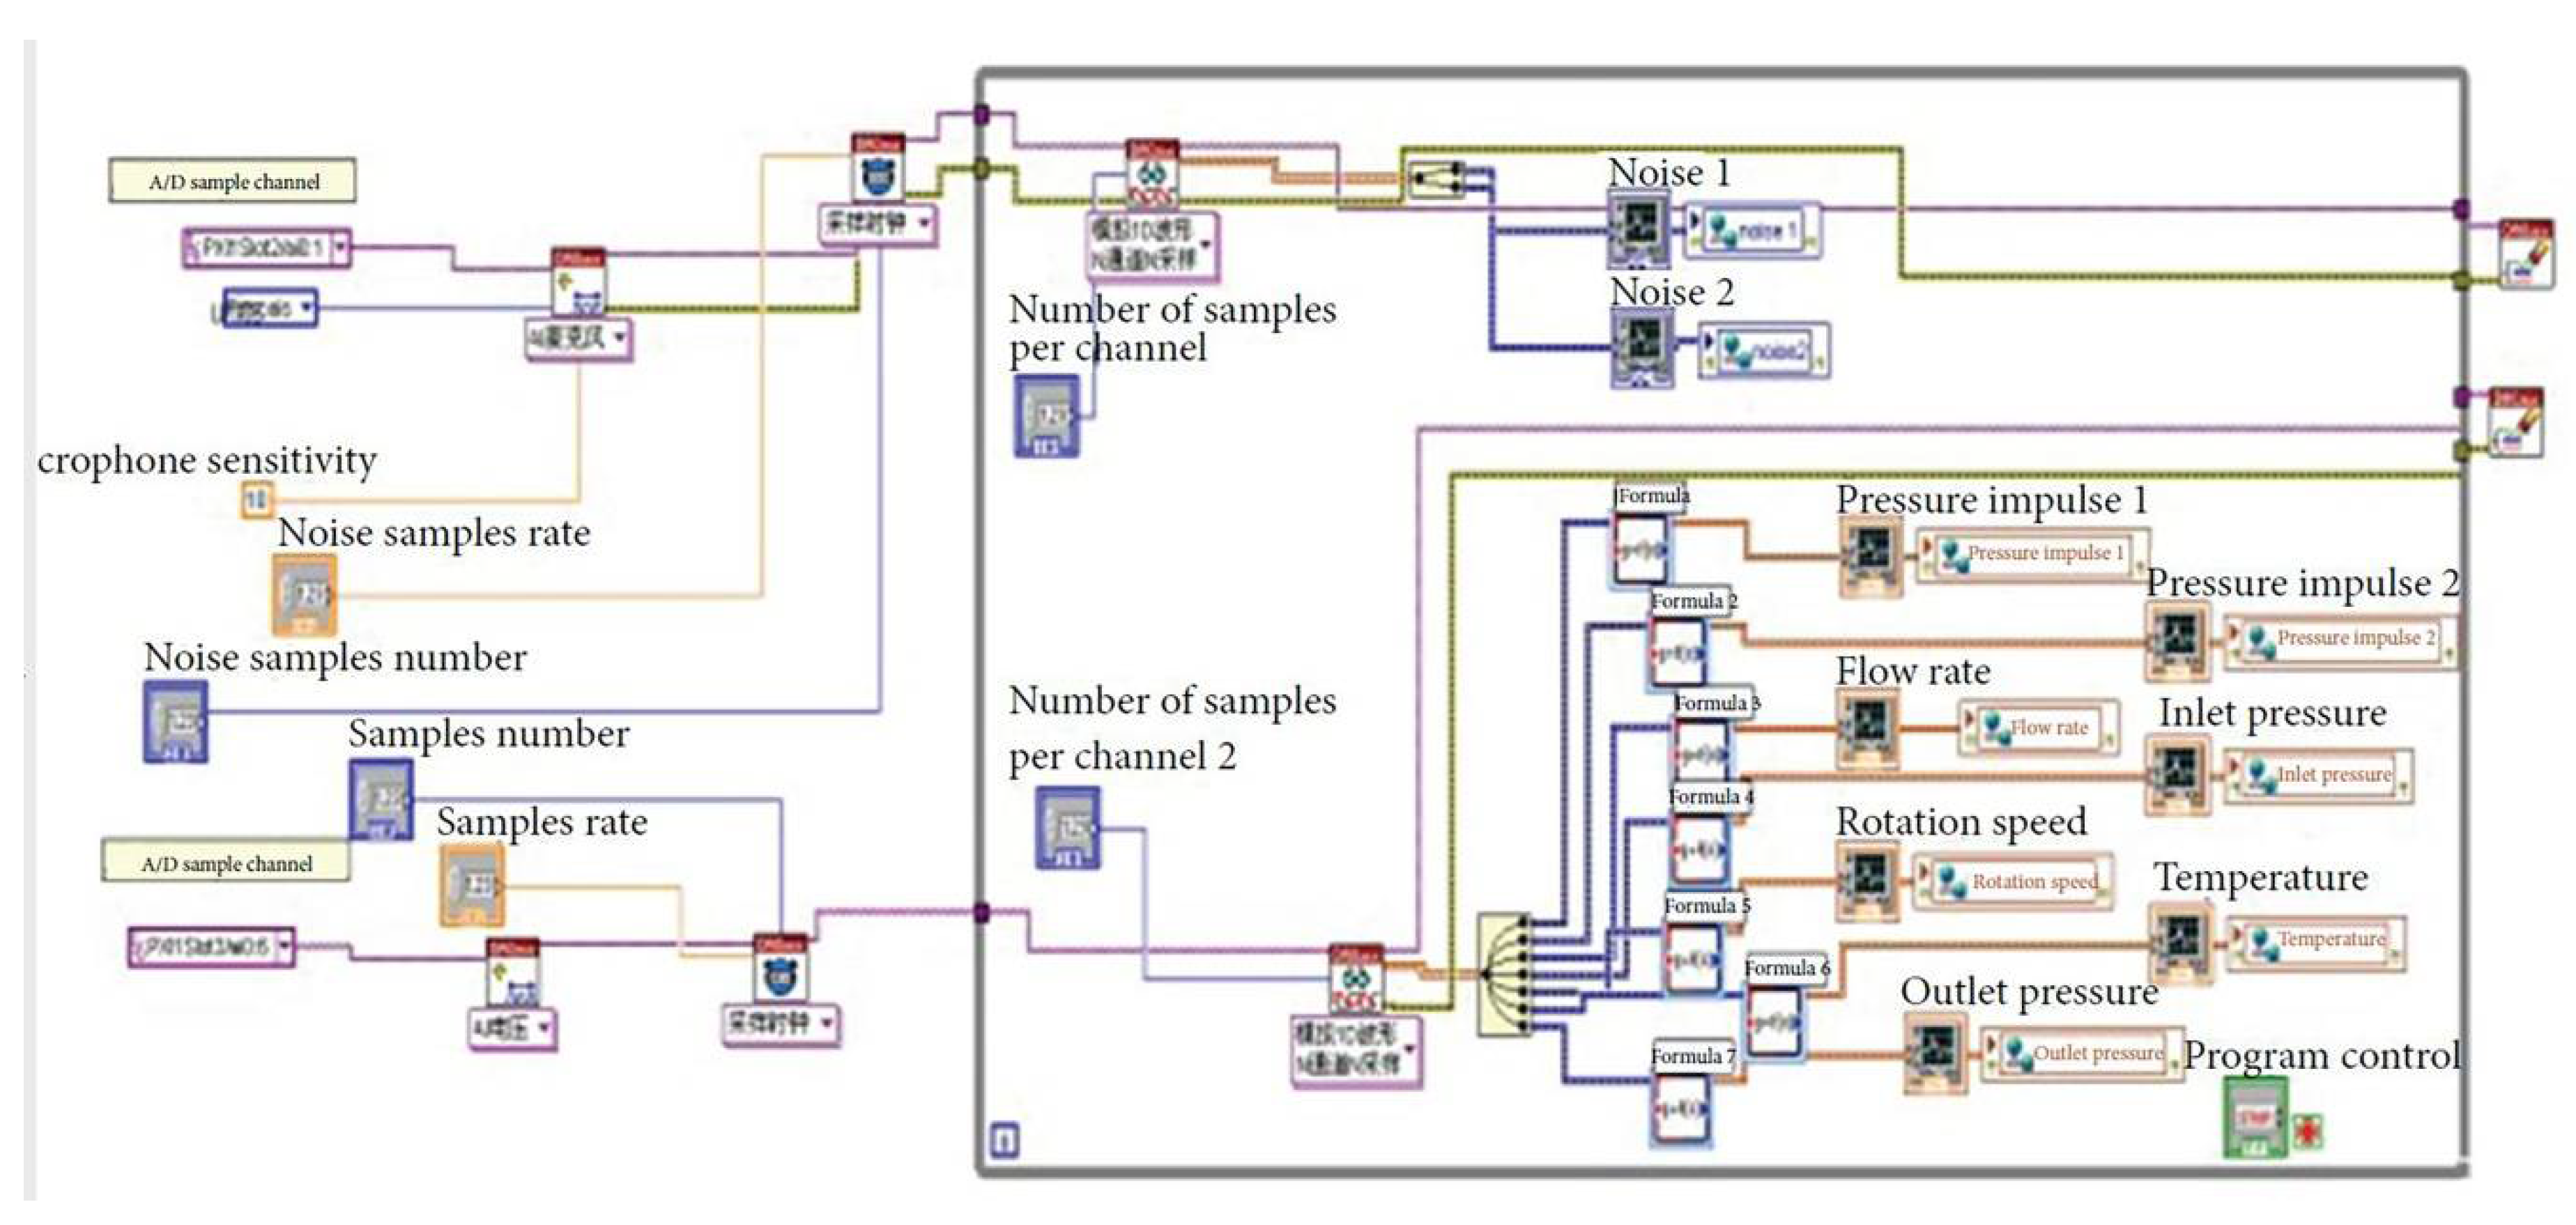
3.2. Data Acquisition System
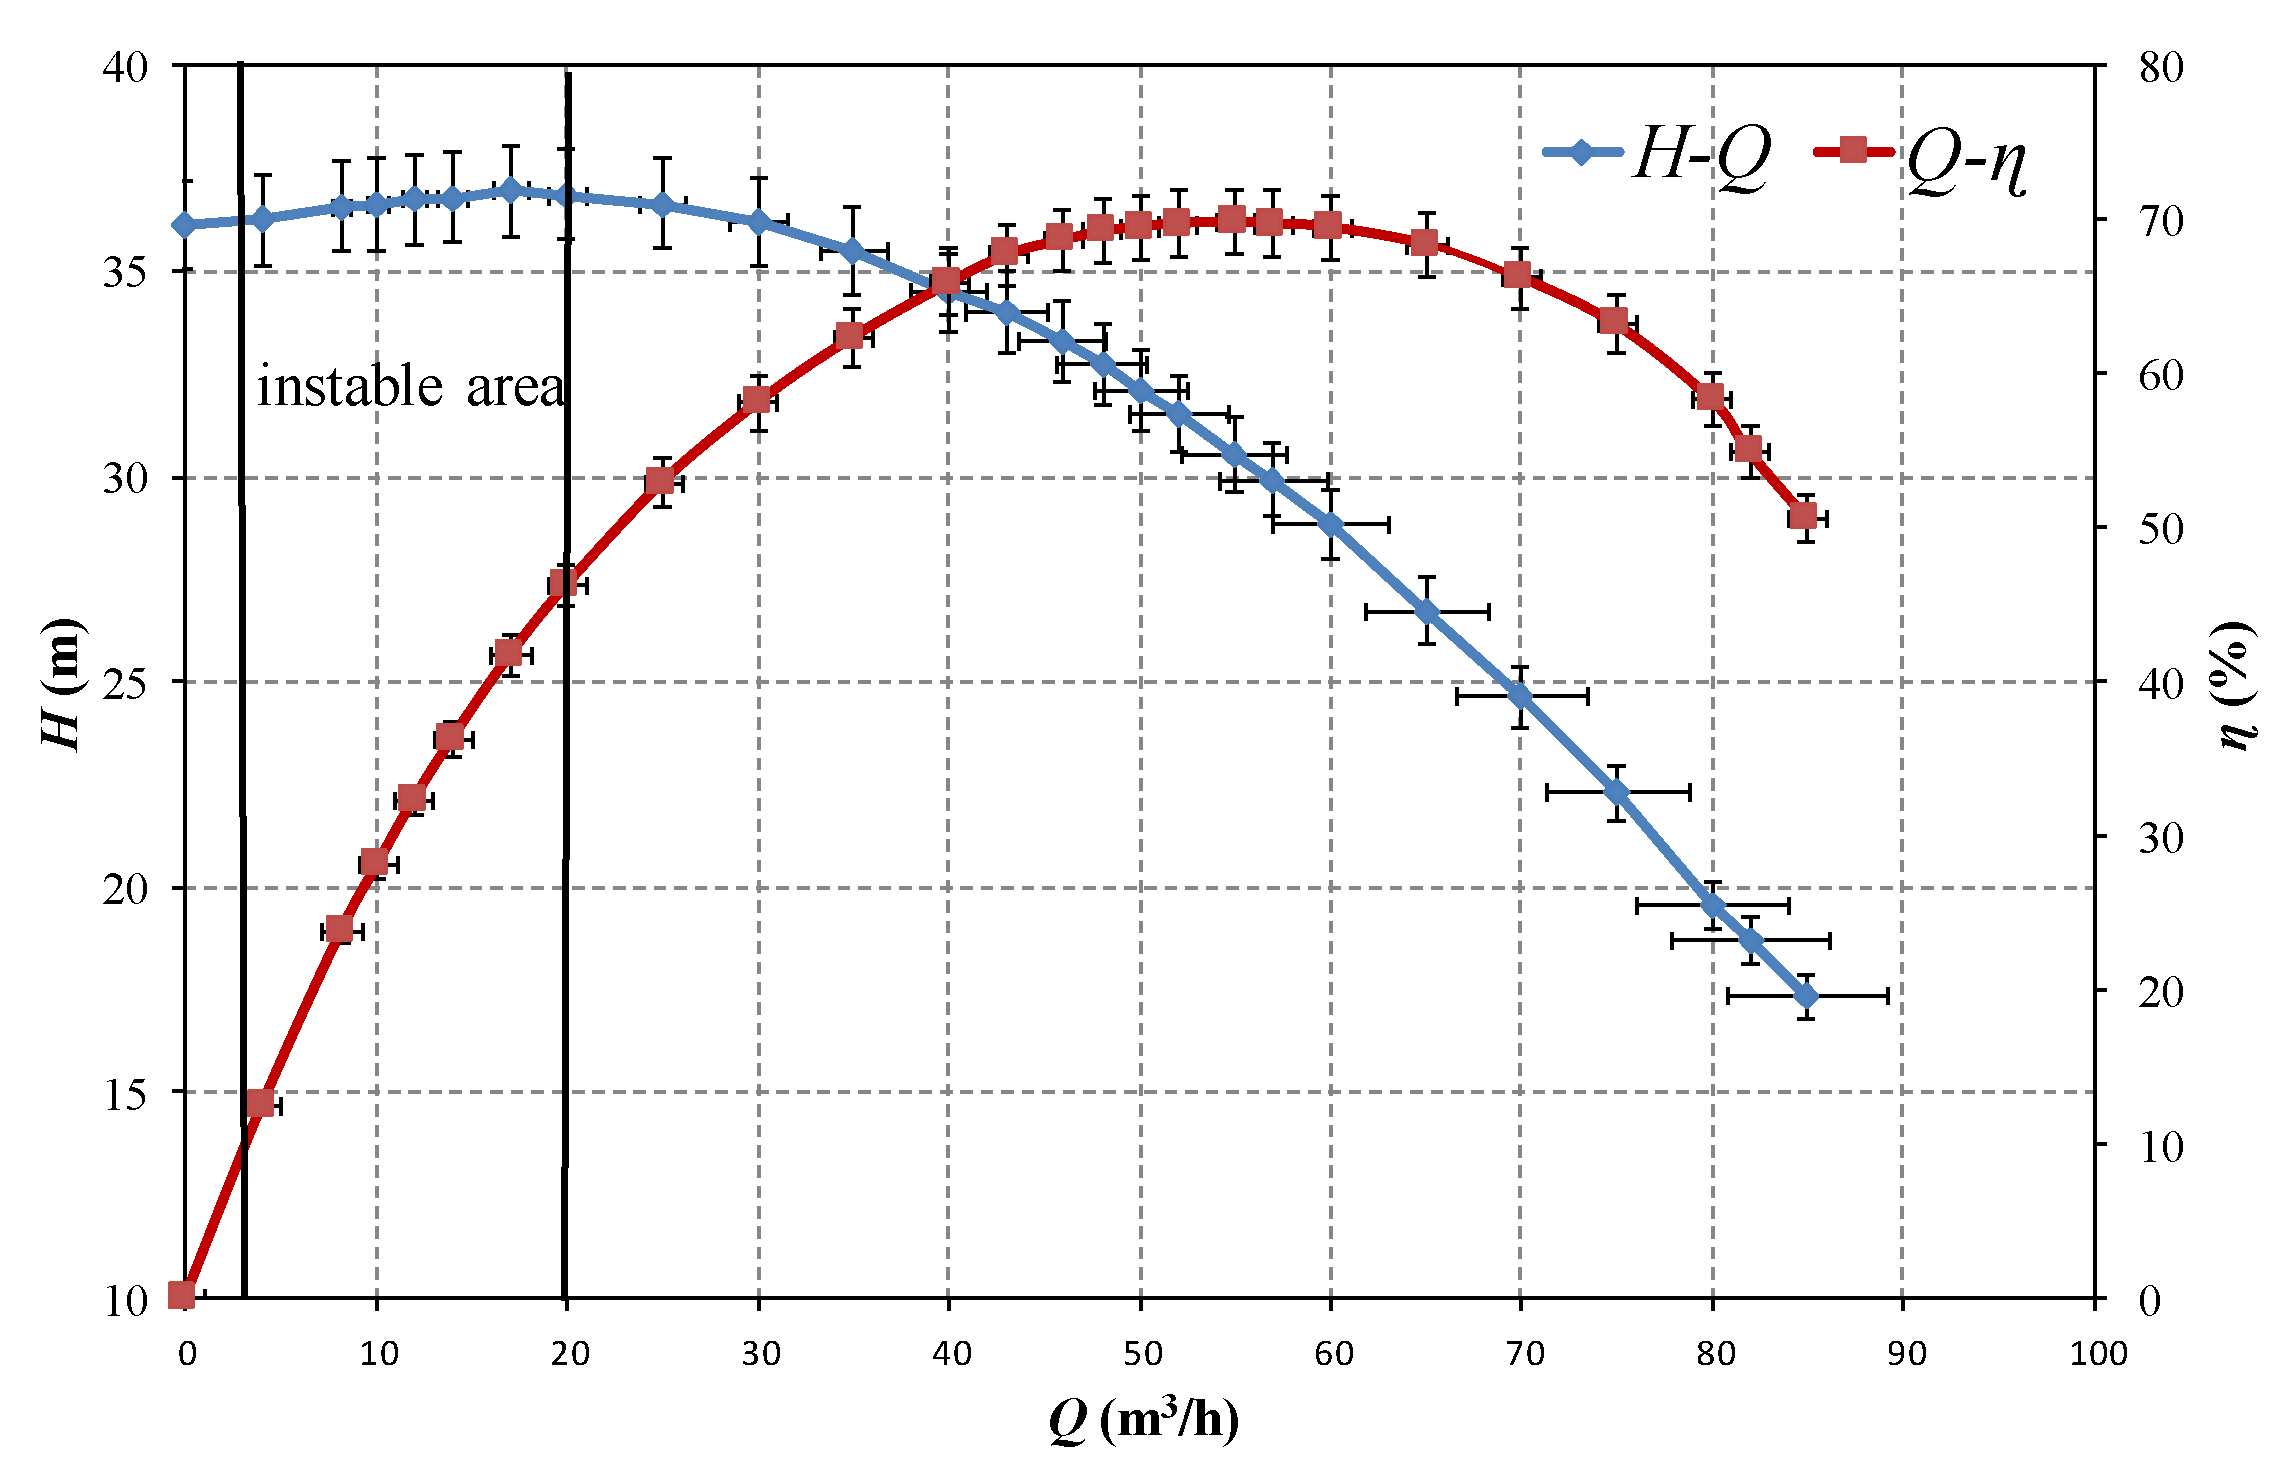
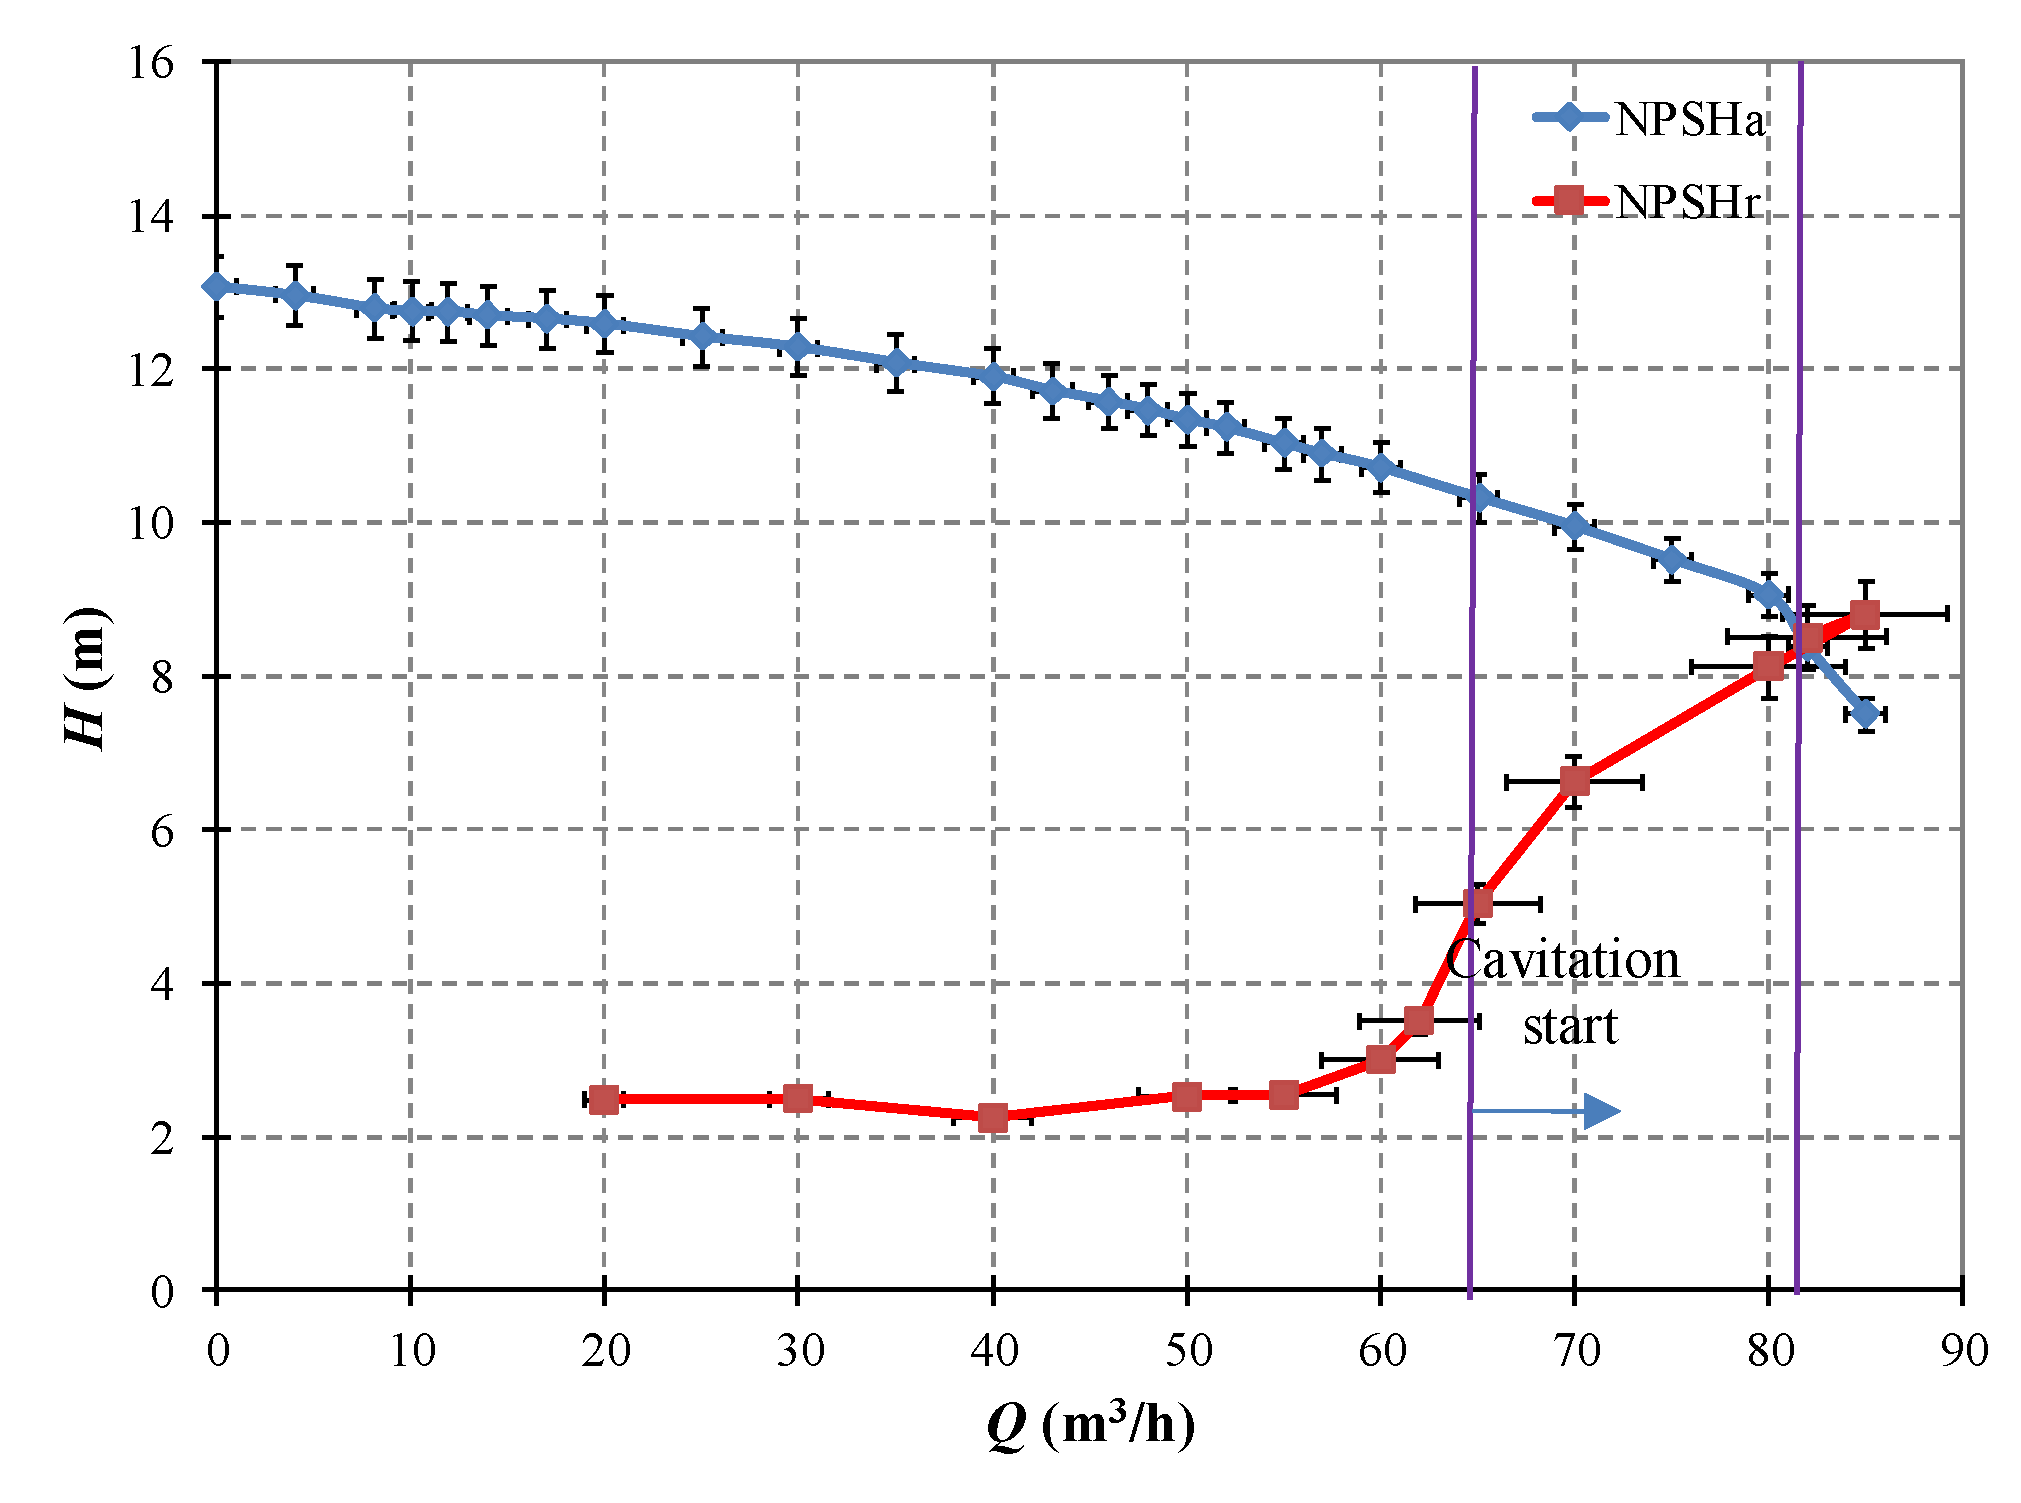
3.3. Experimental Procedures
4. The Analysis of the Single Value Operation Monitoring Indicators for Centrifugal Pump
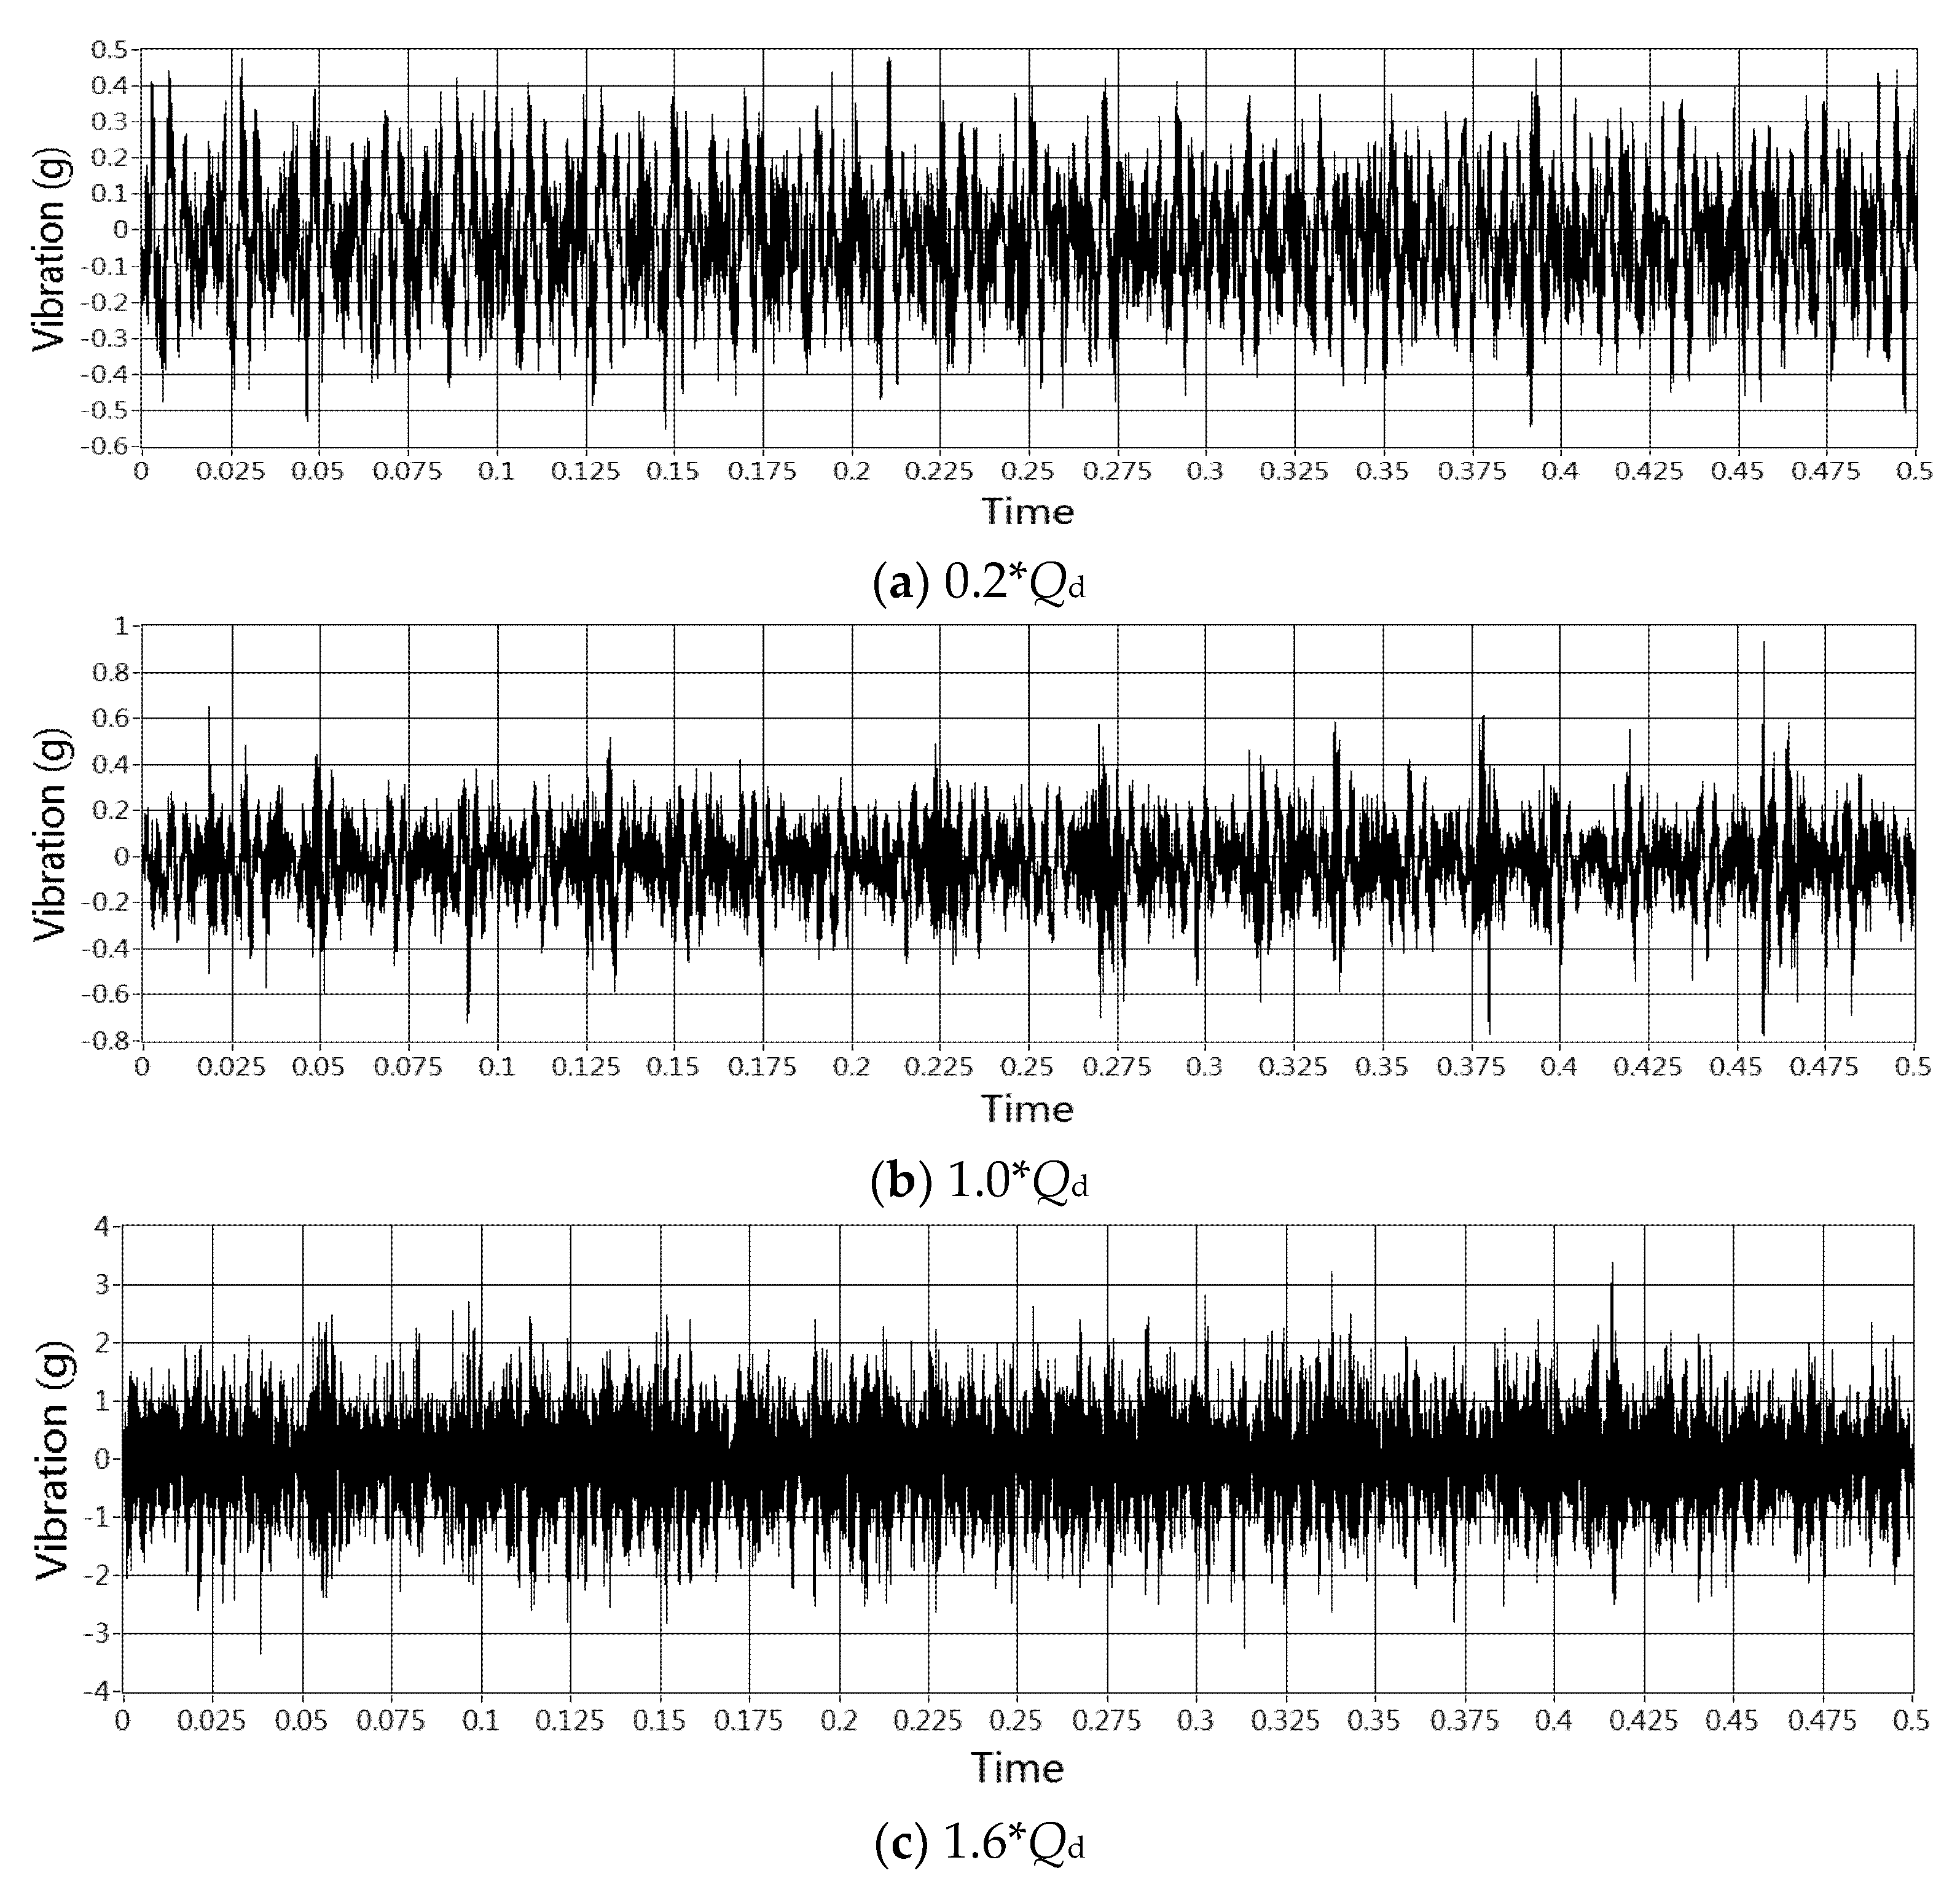
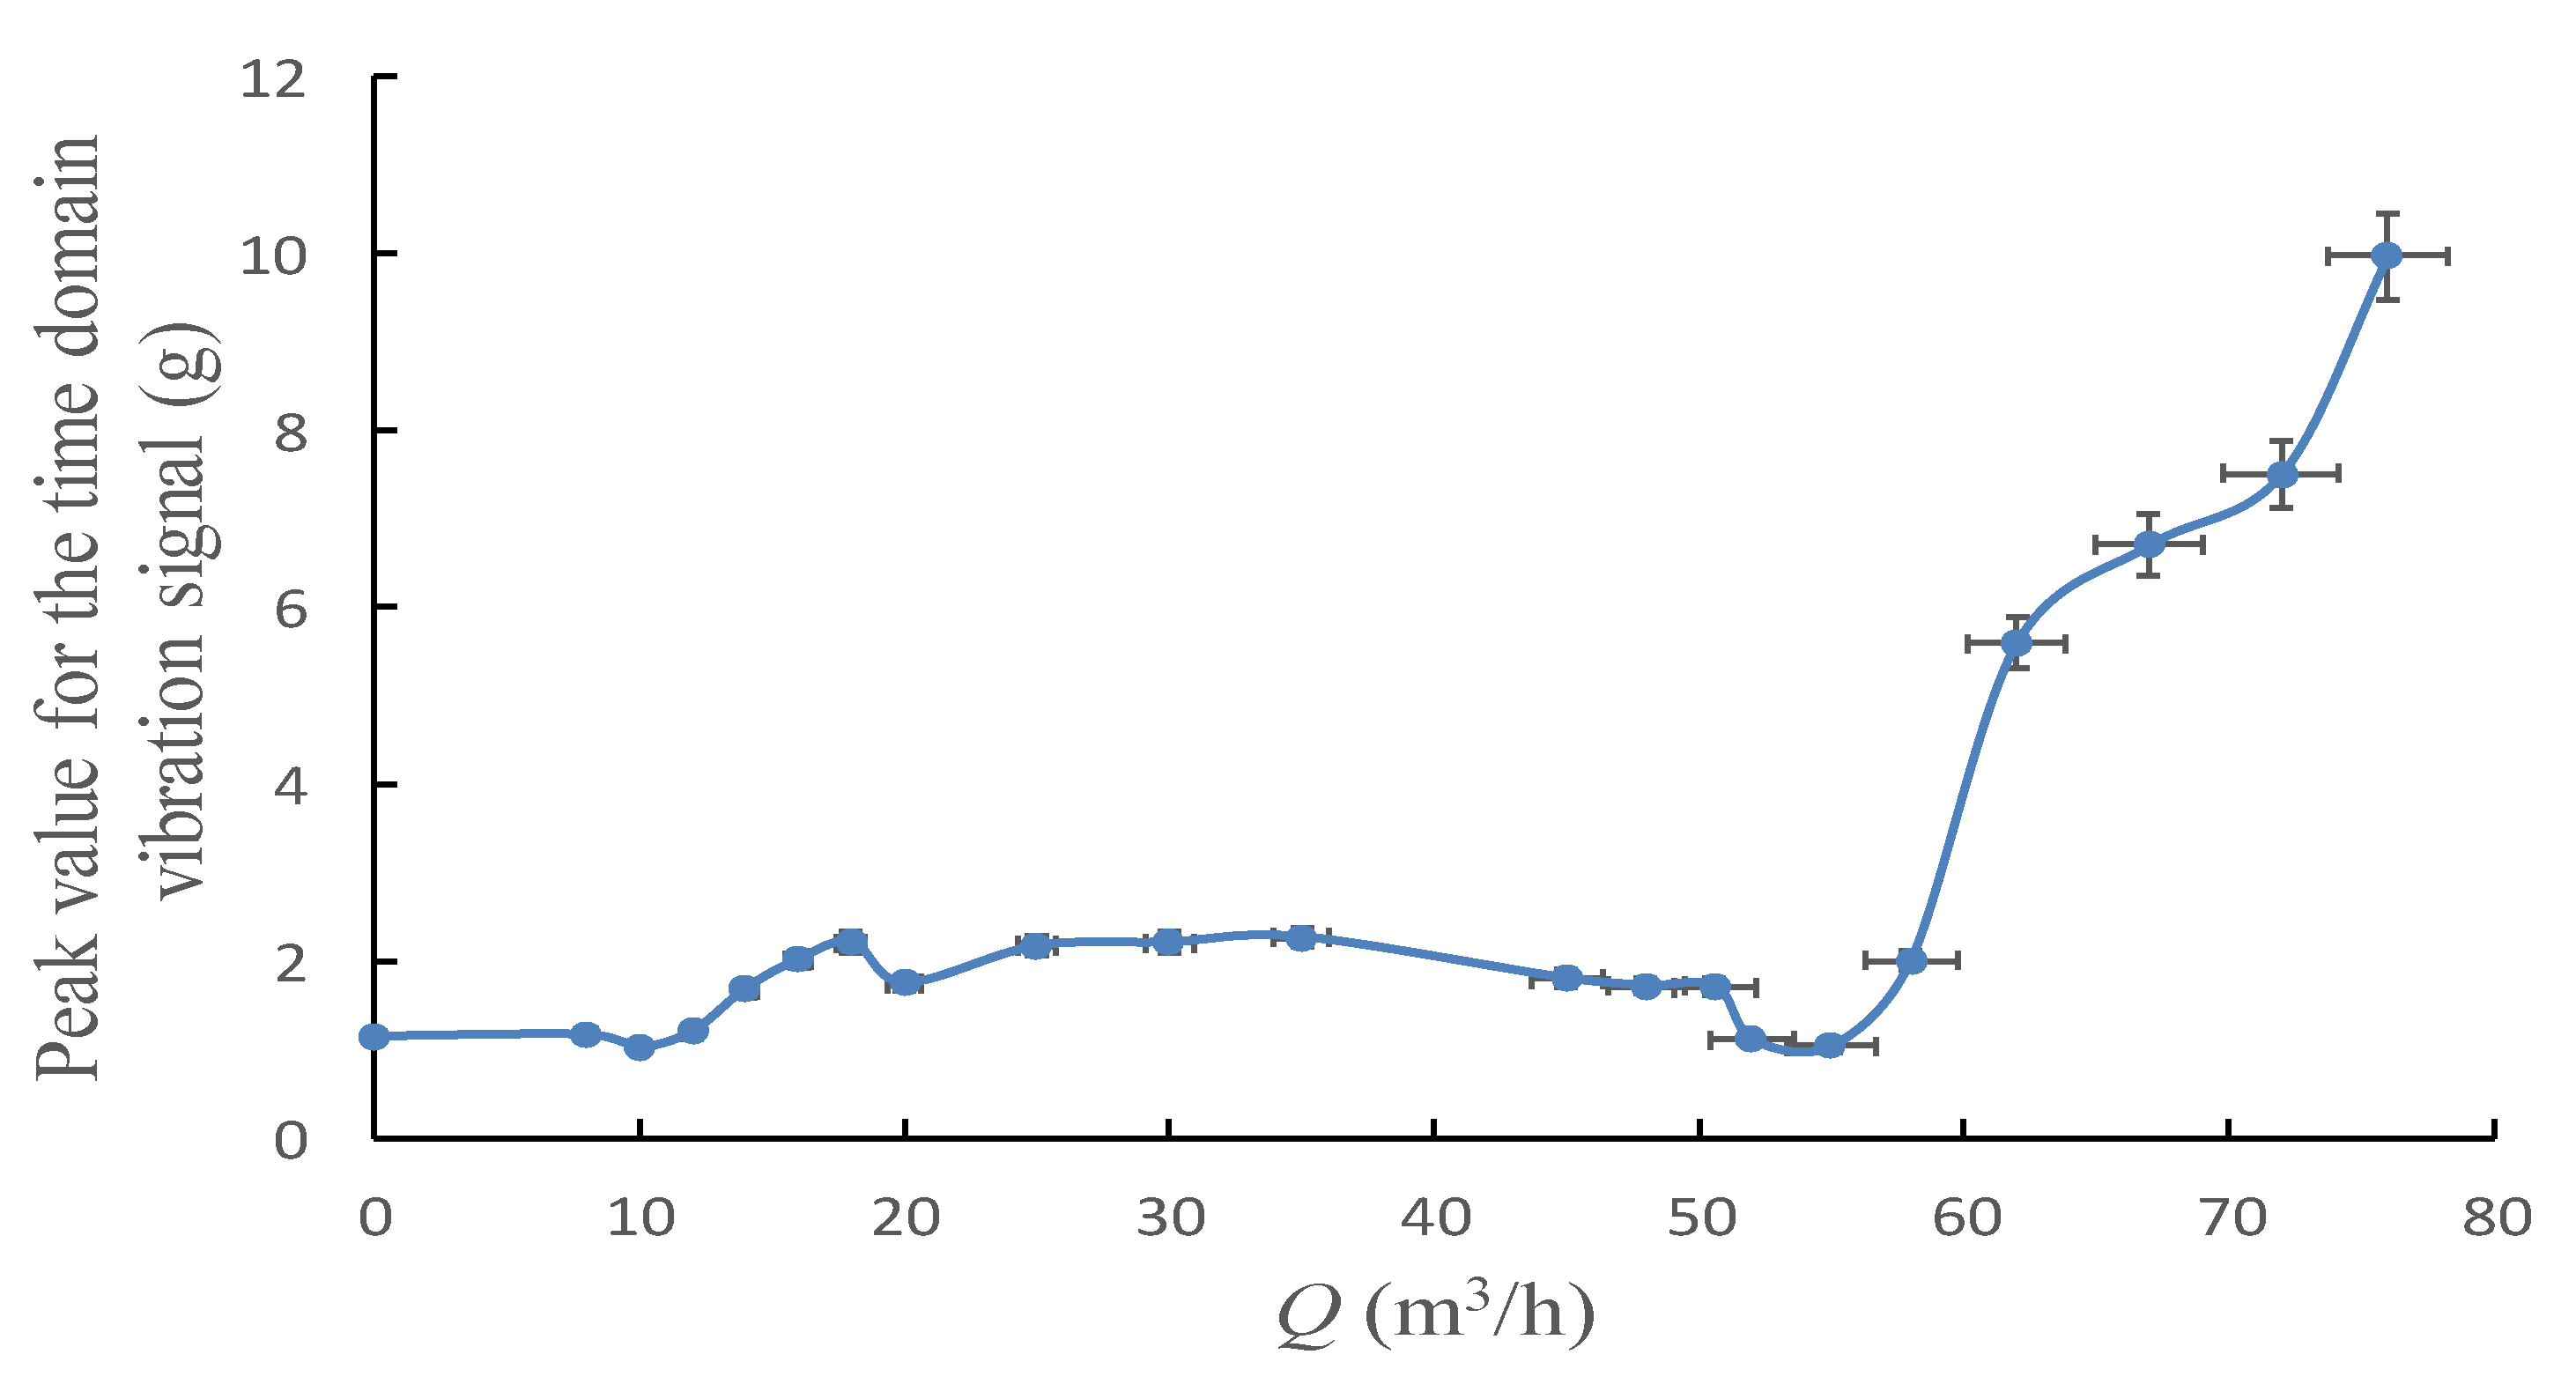
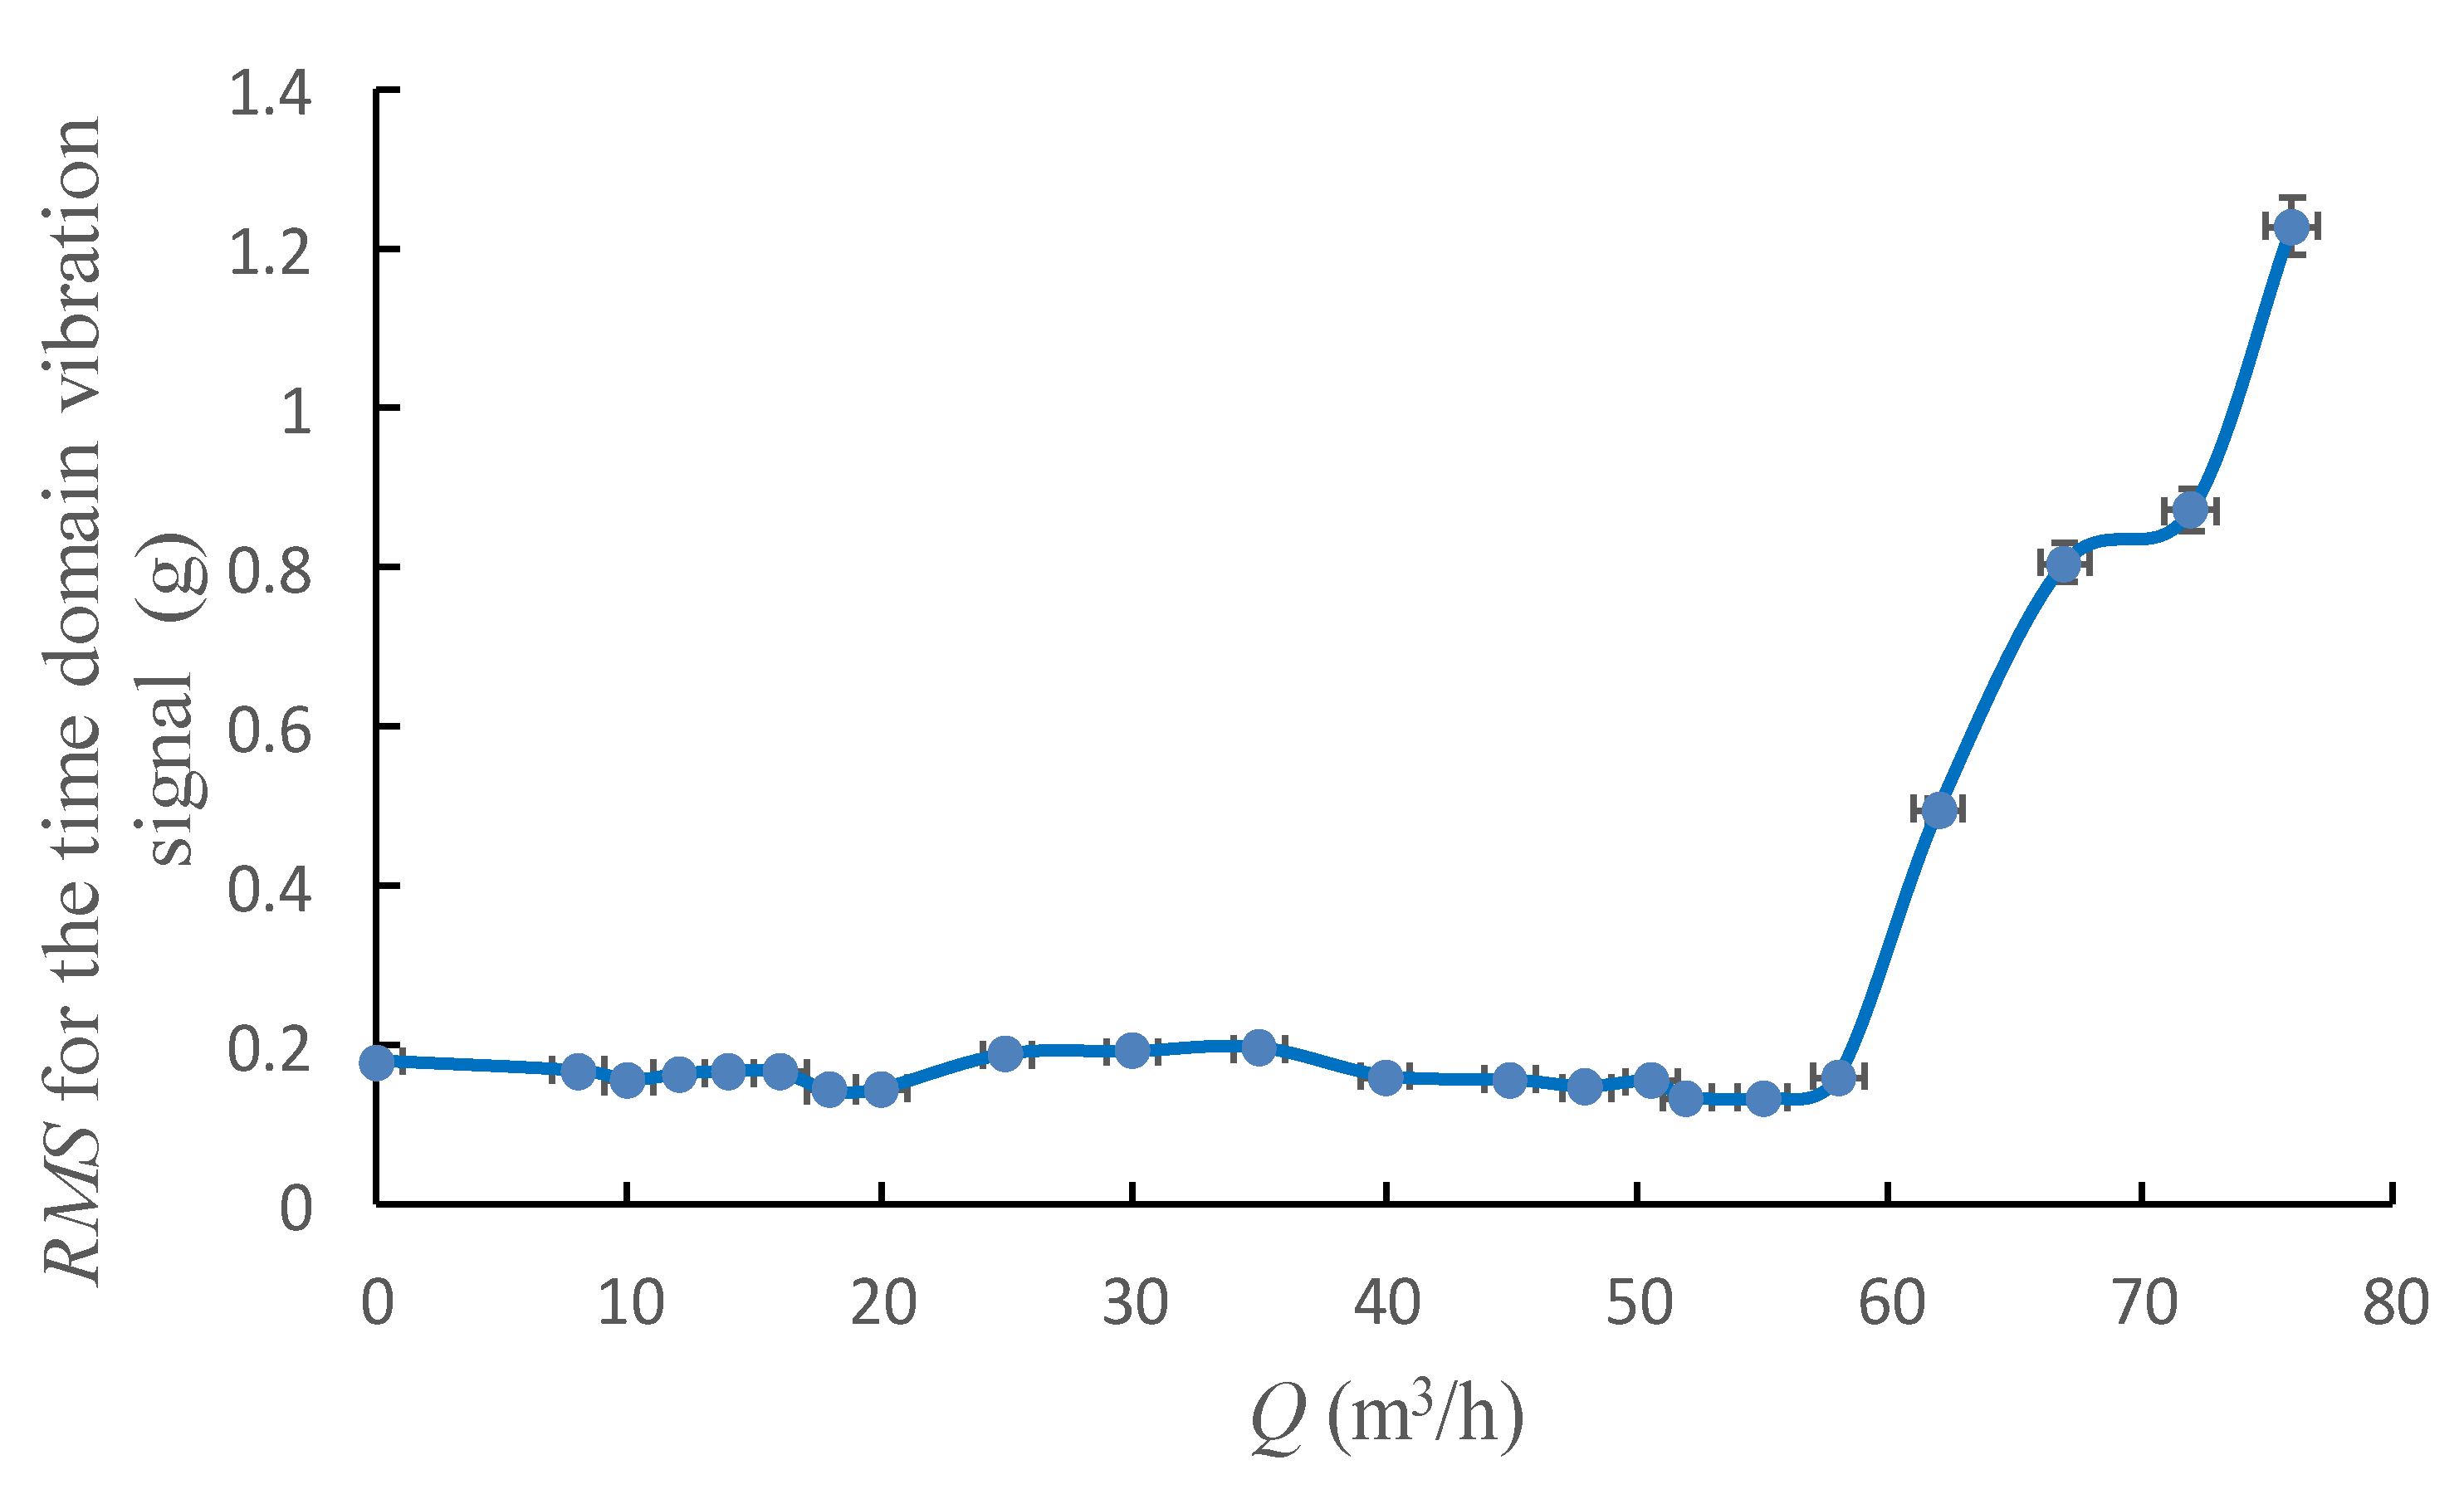
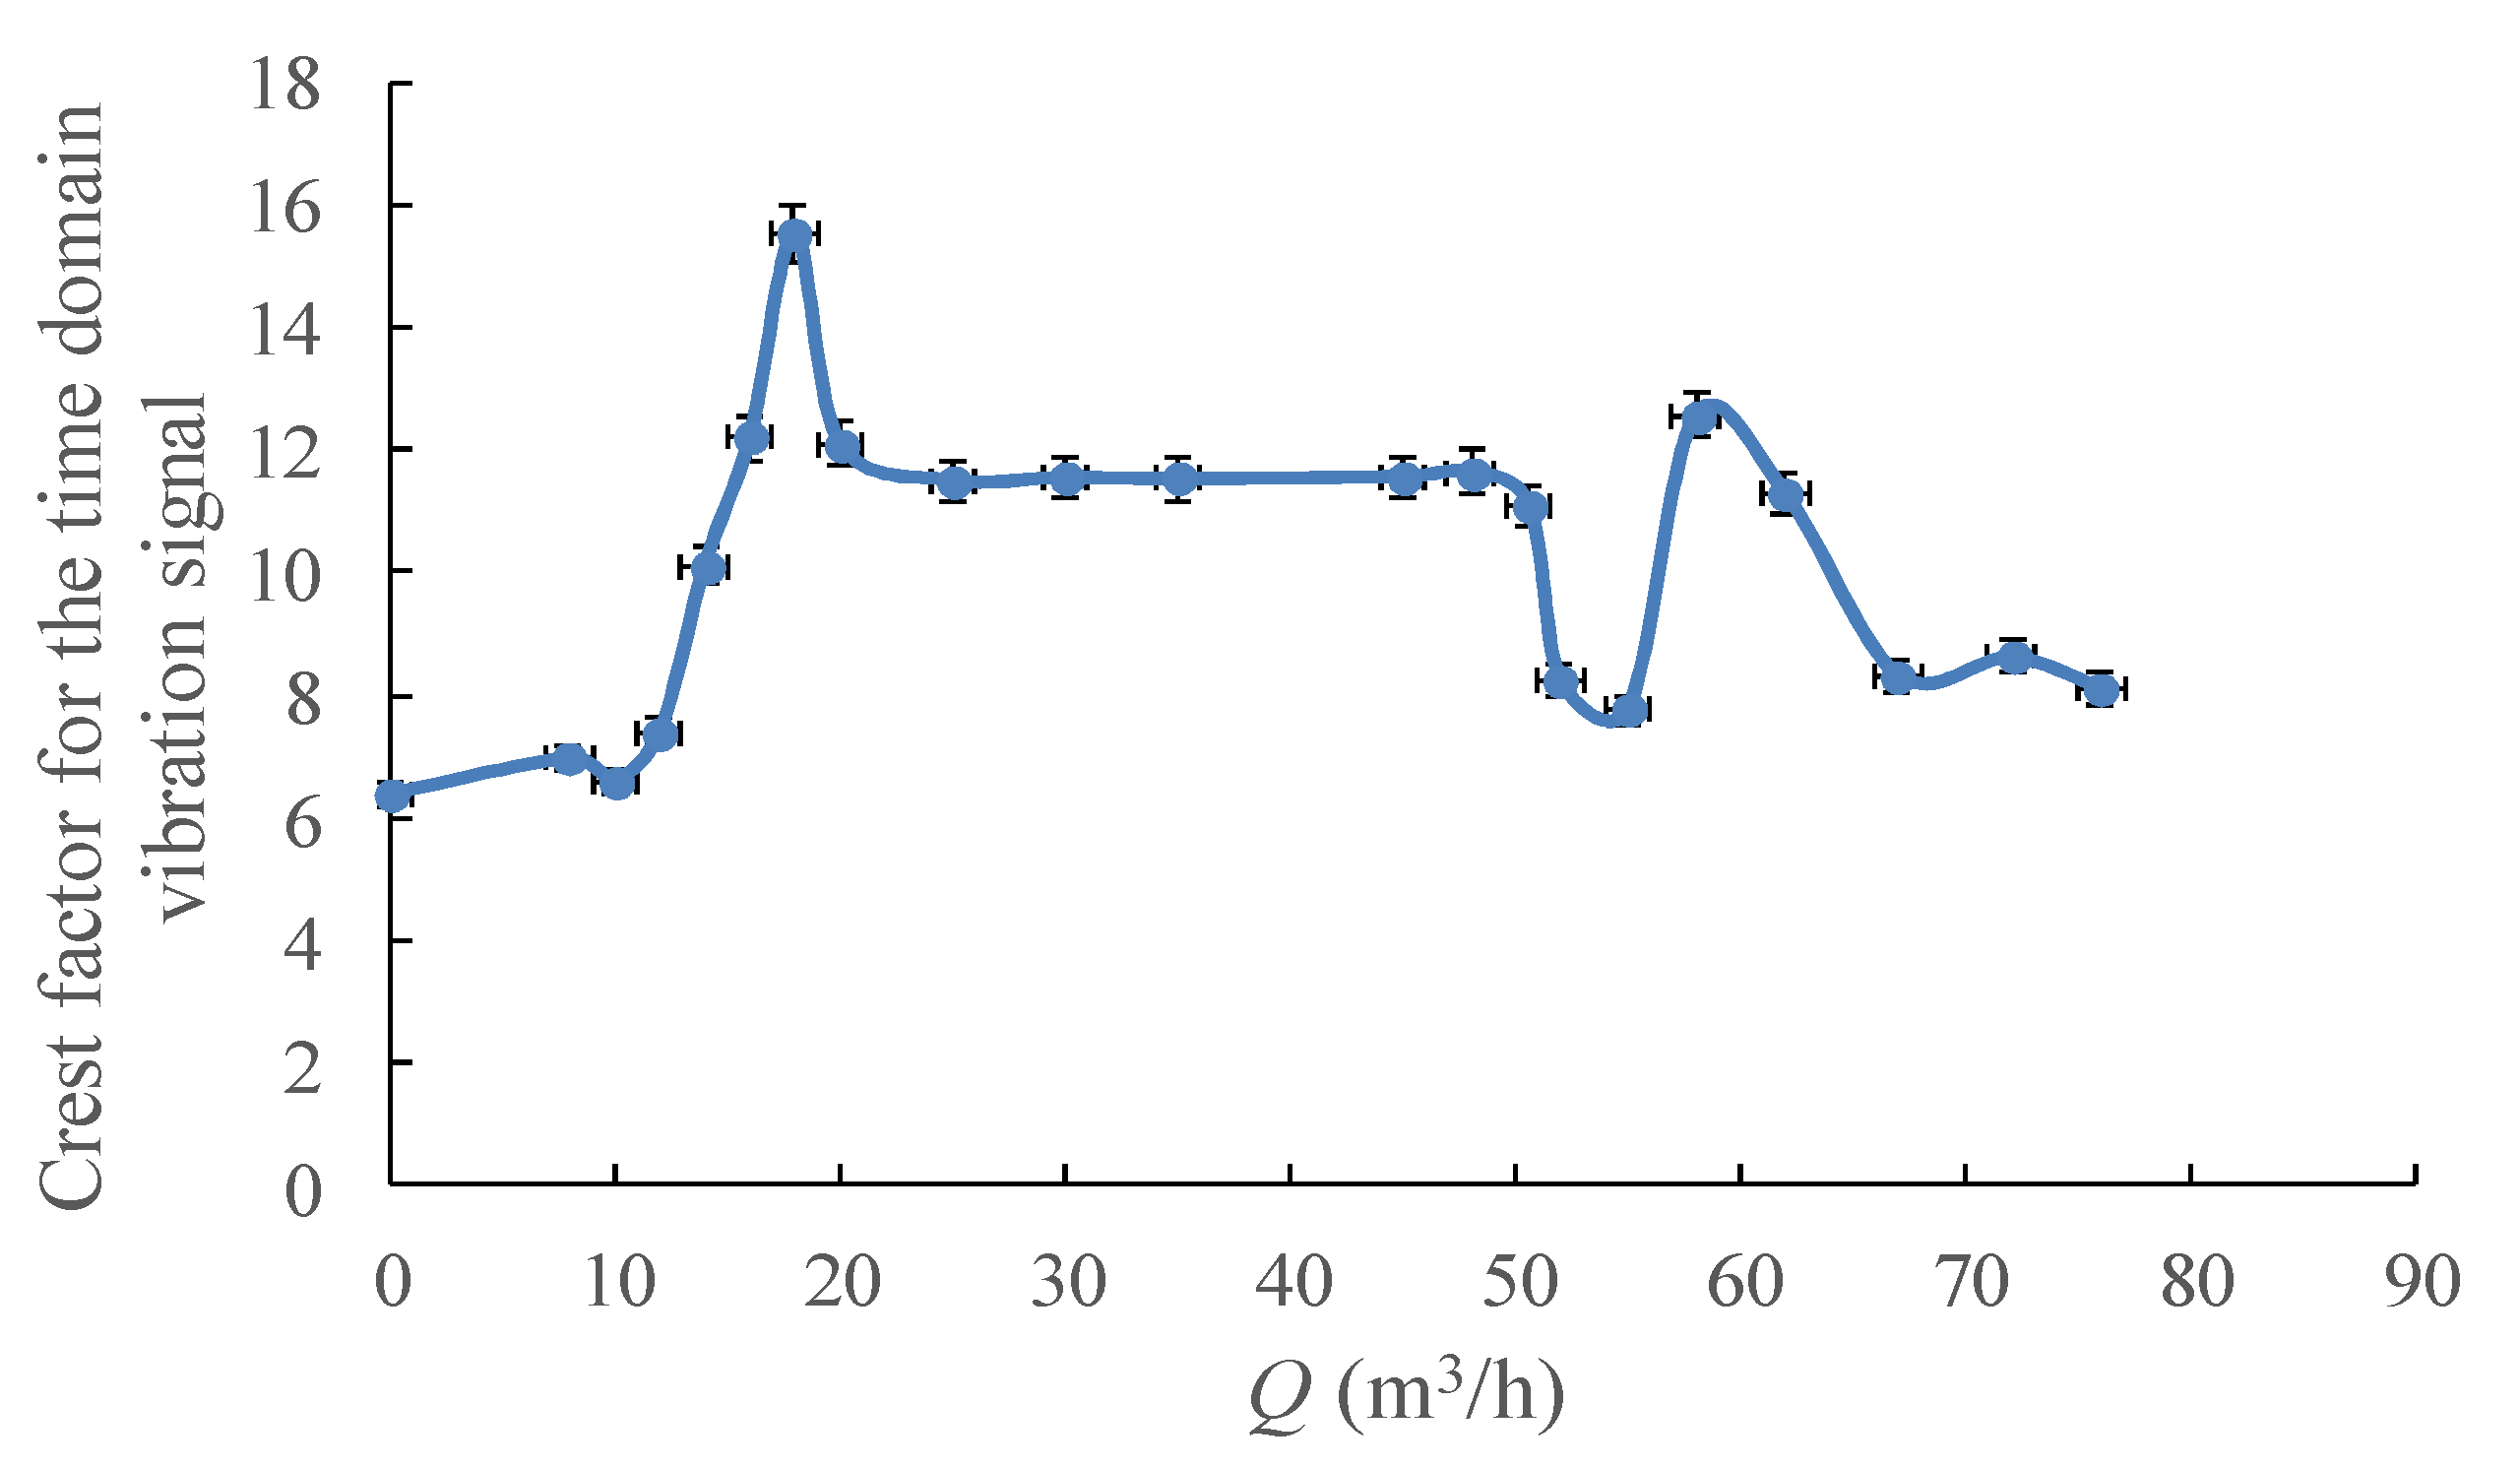
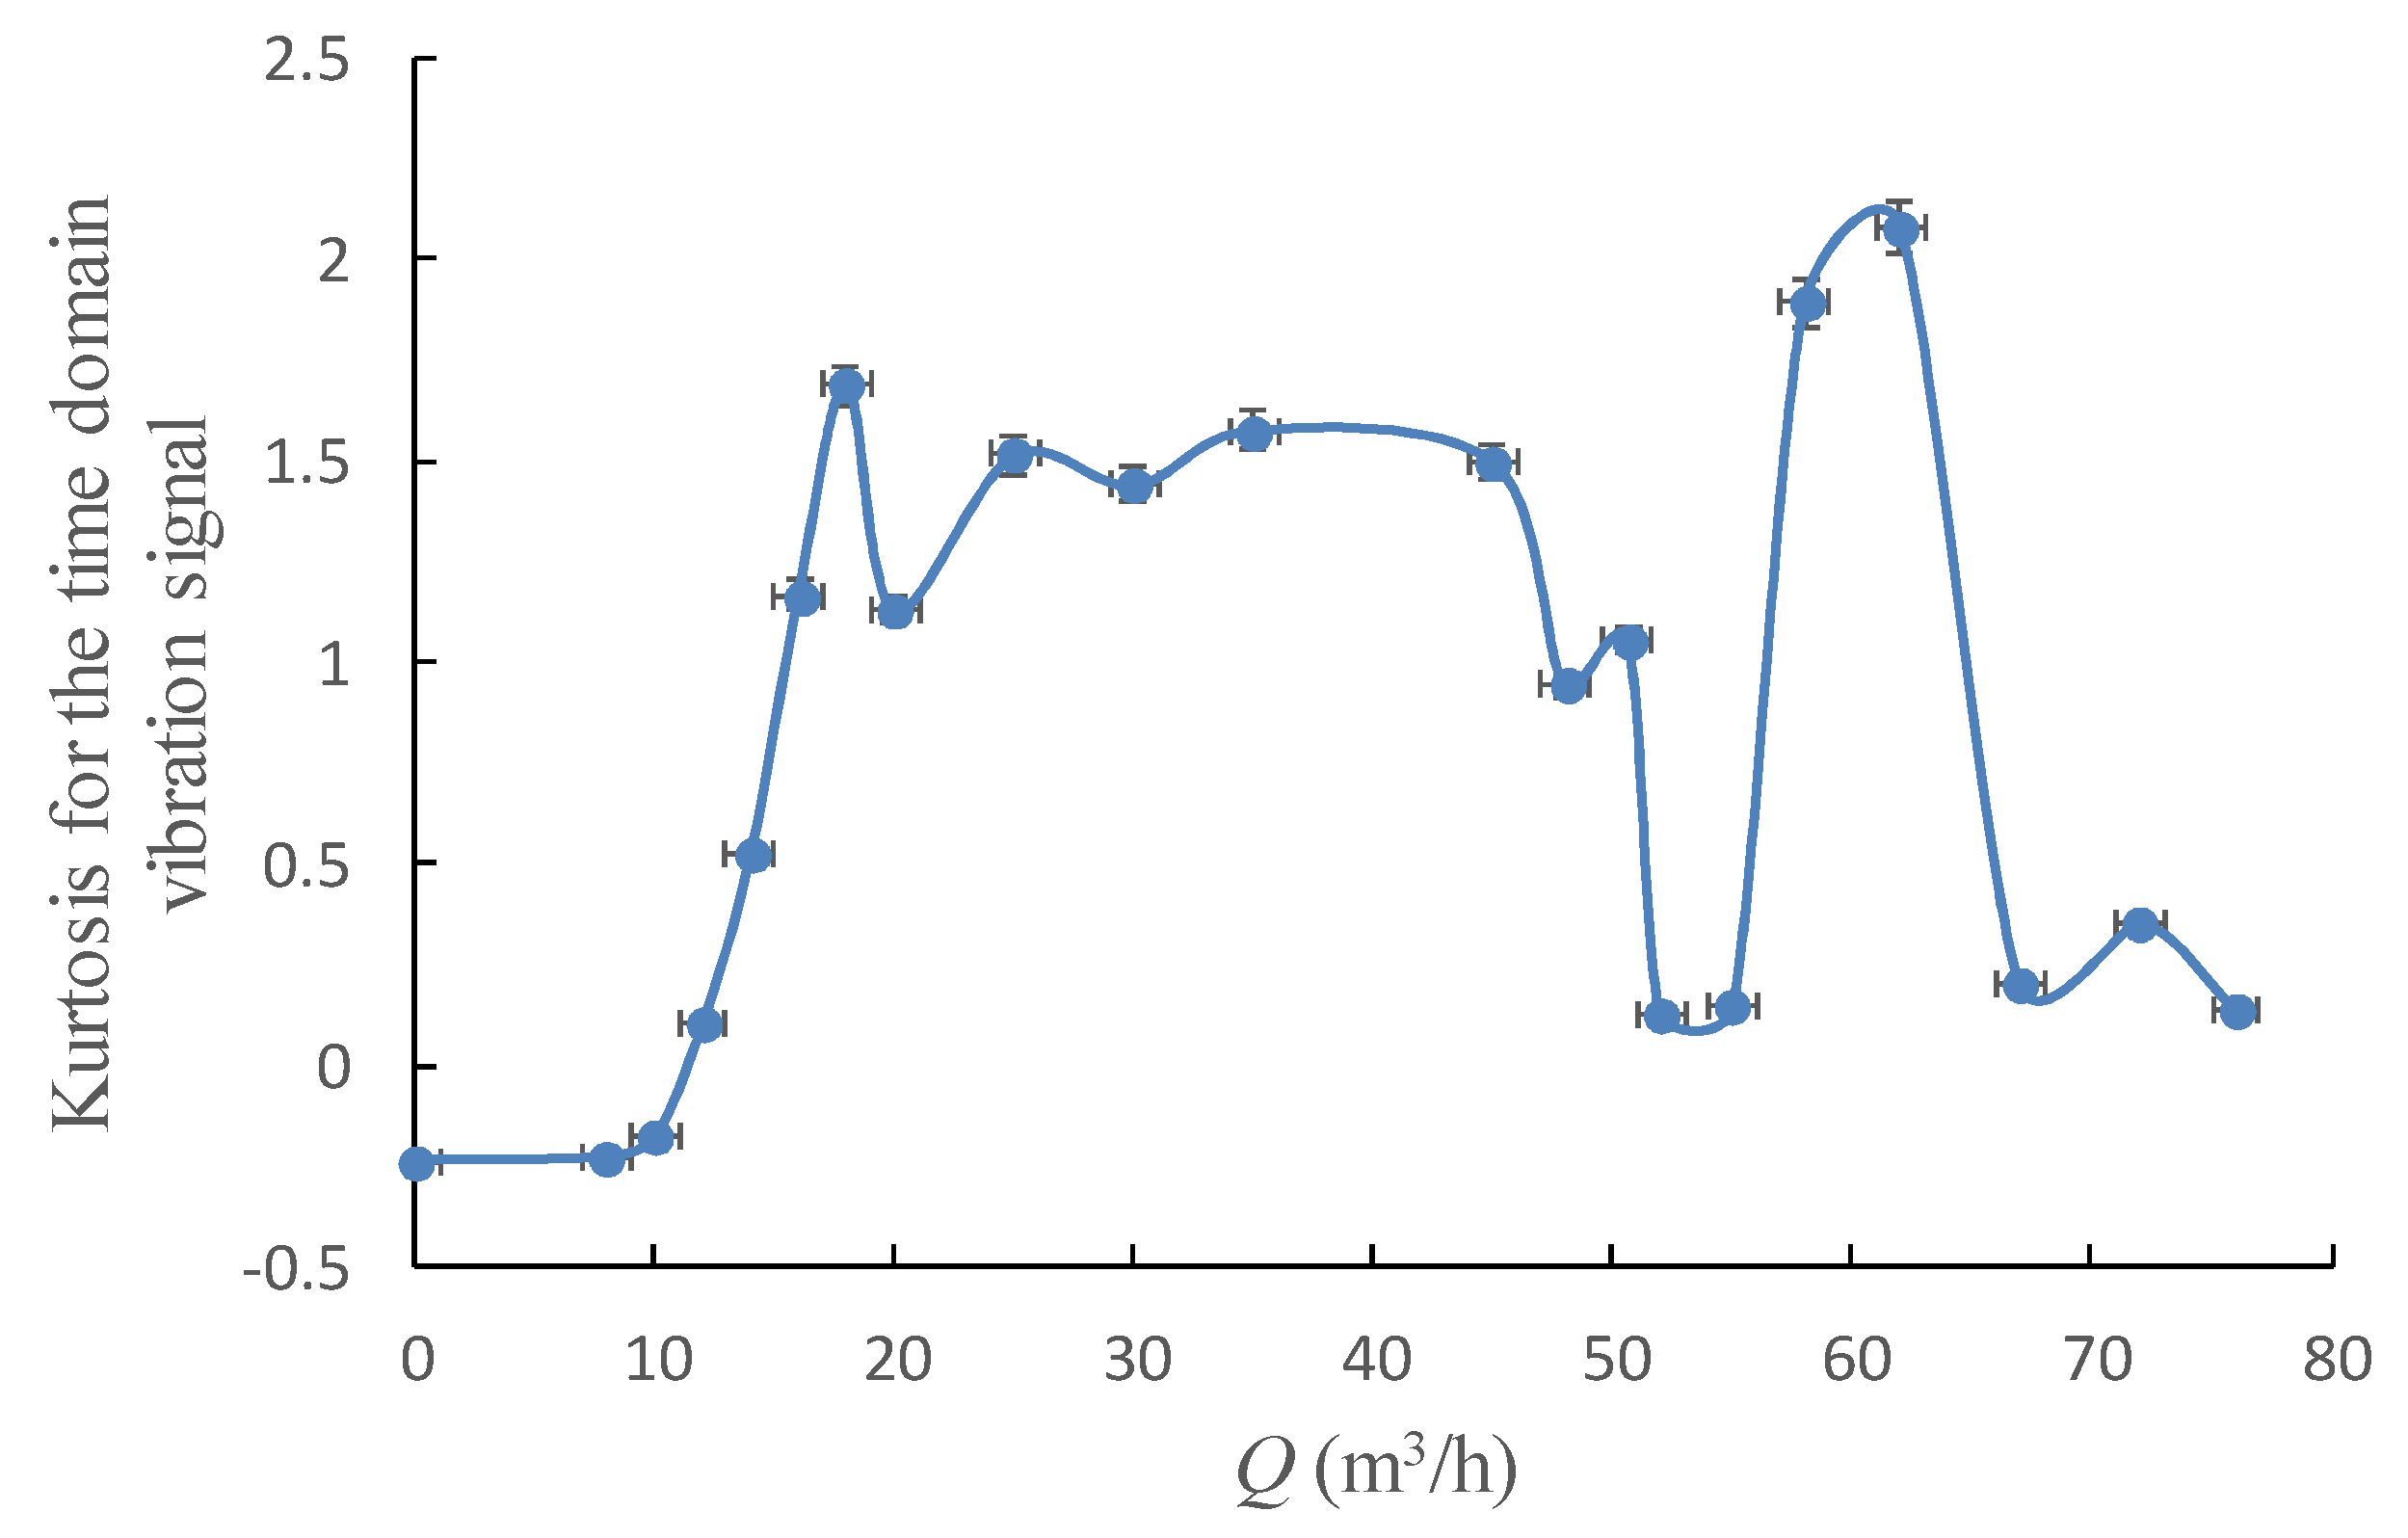
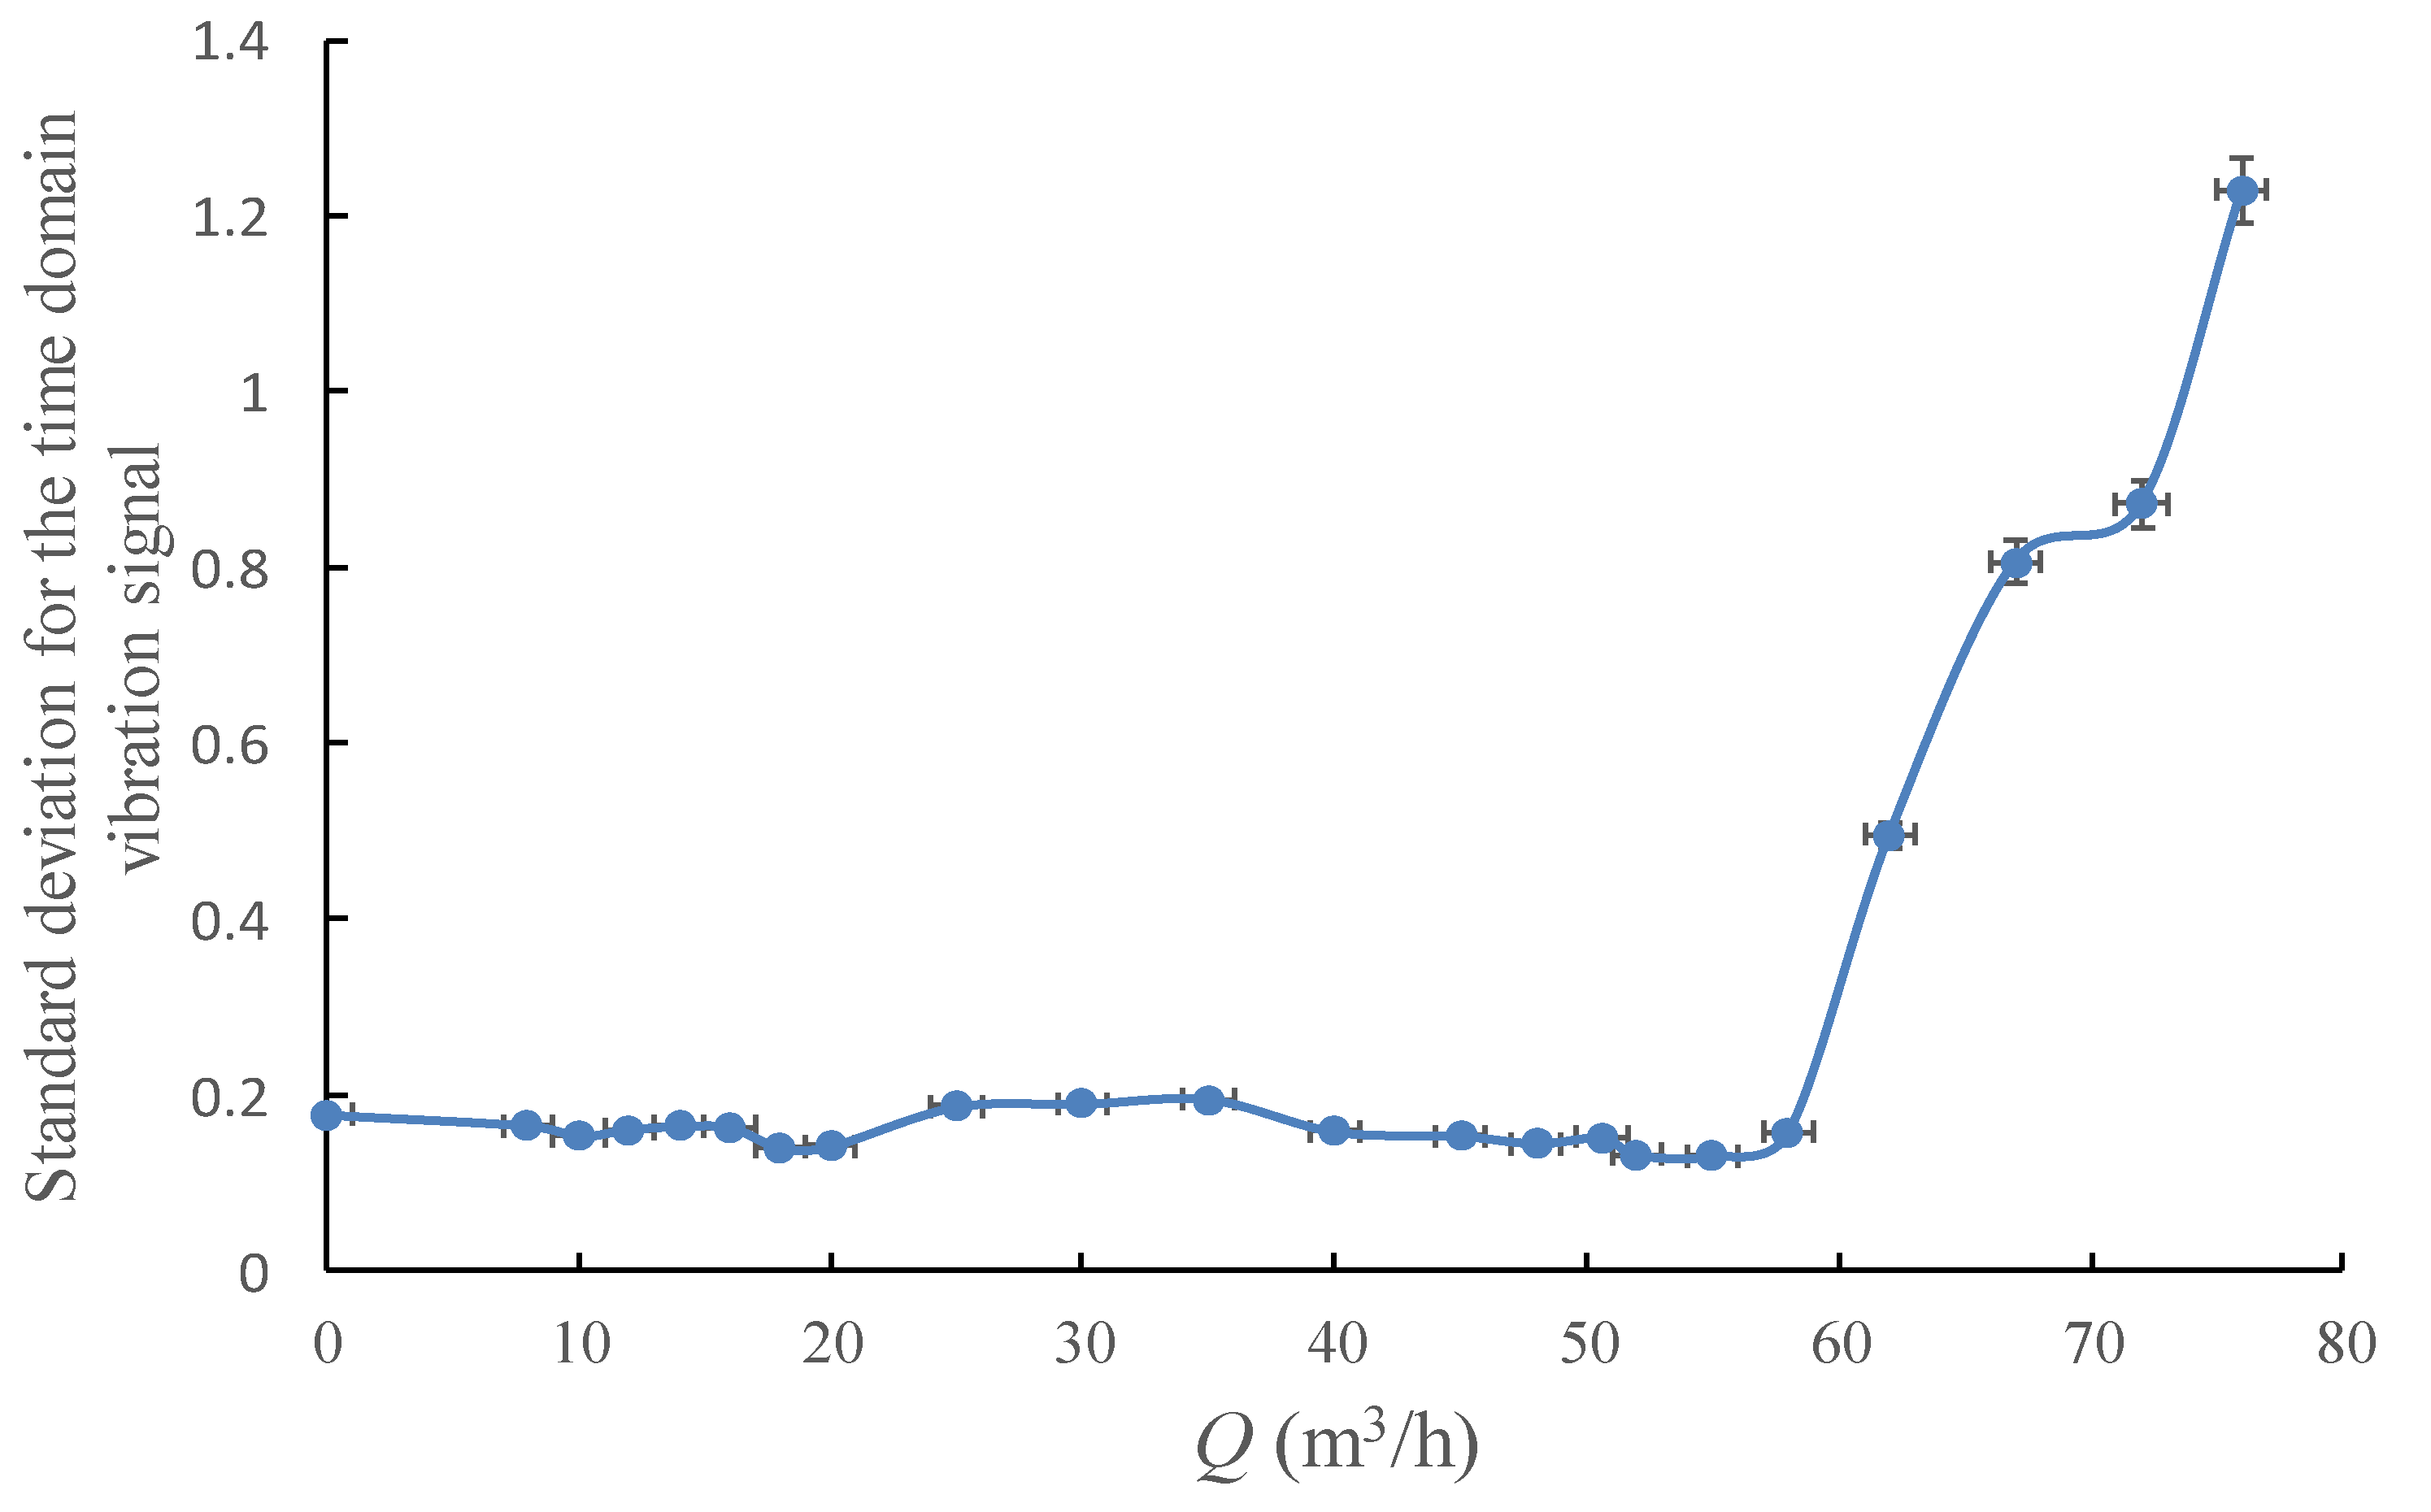
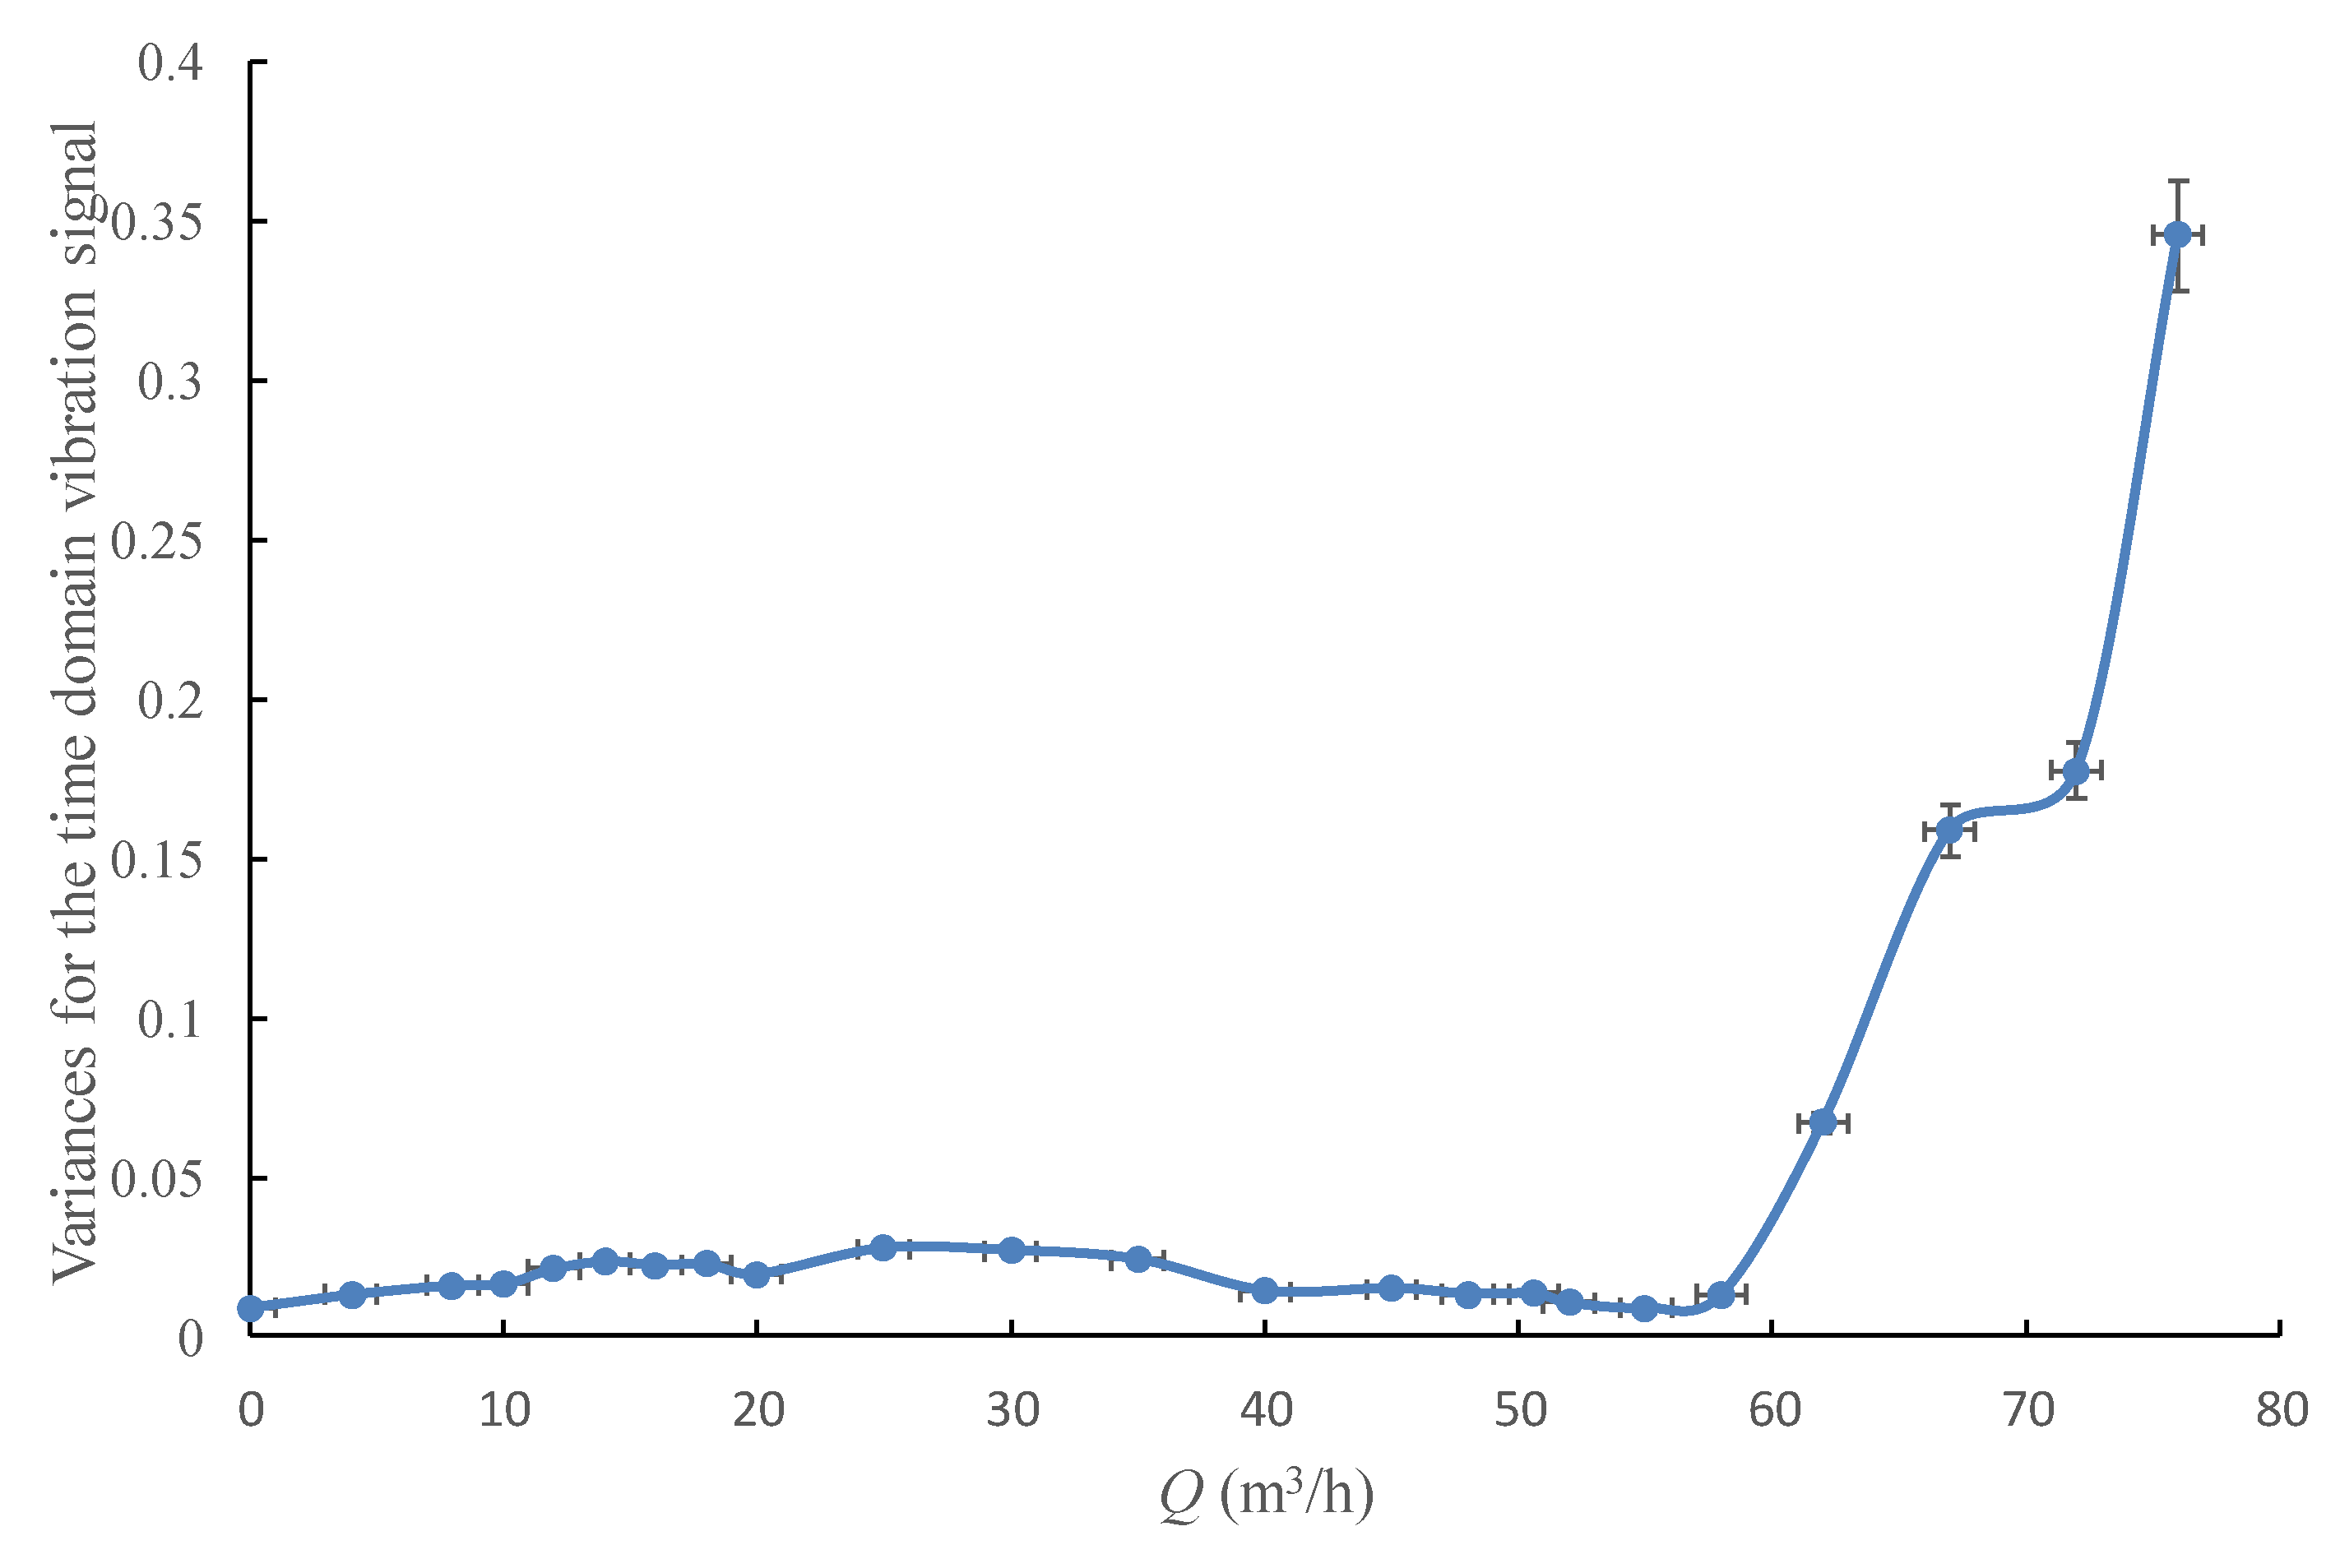
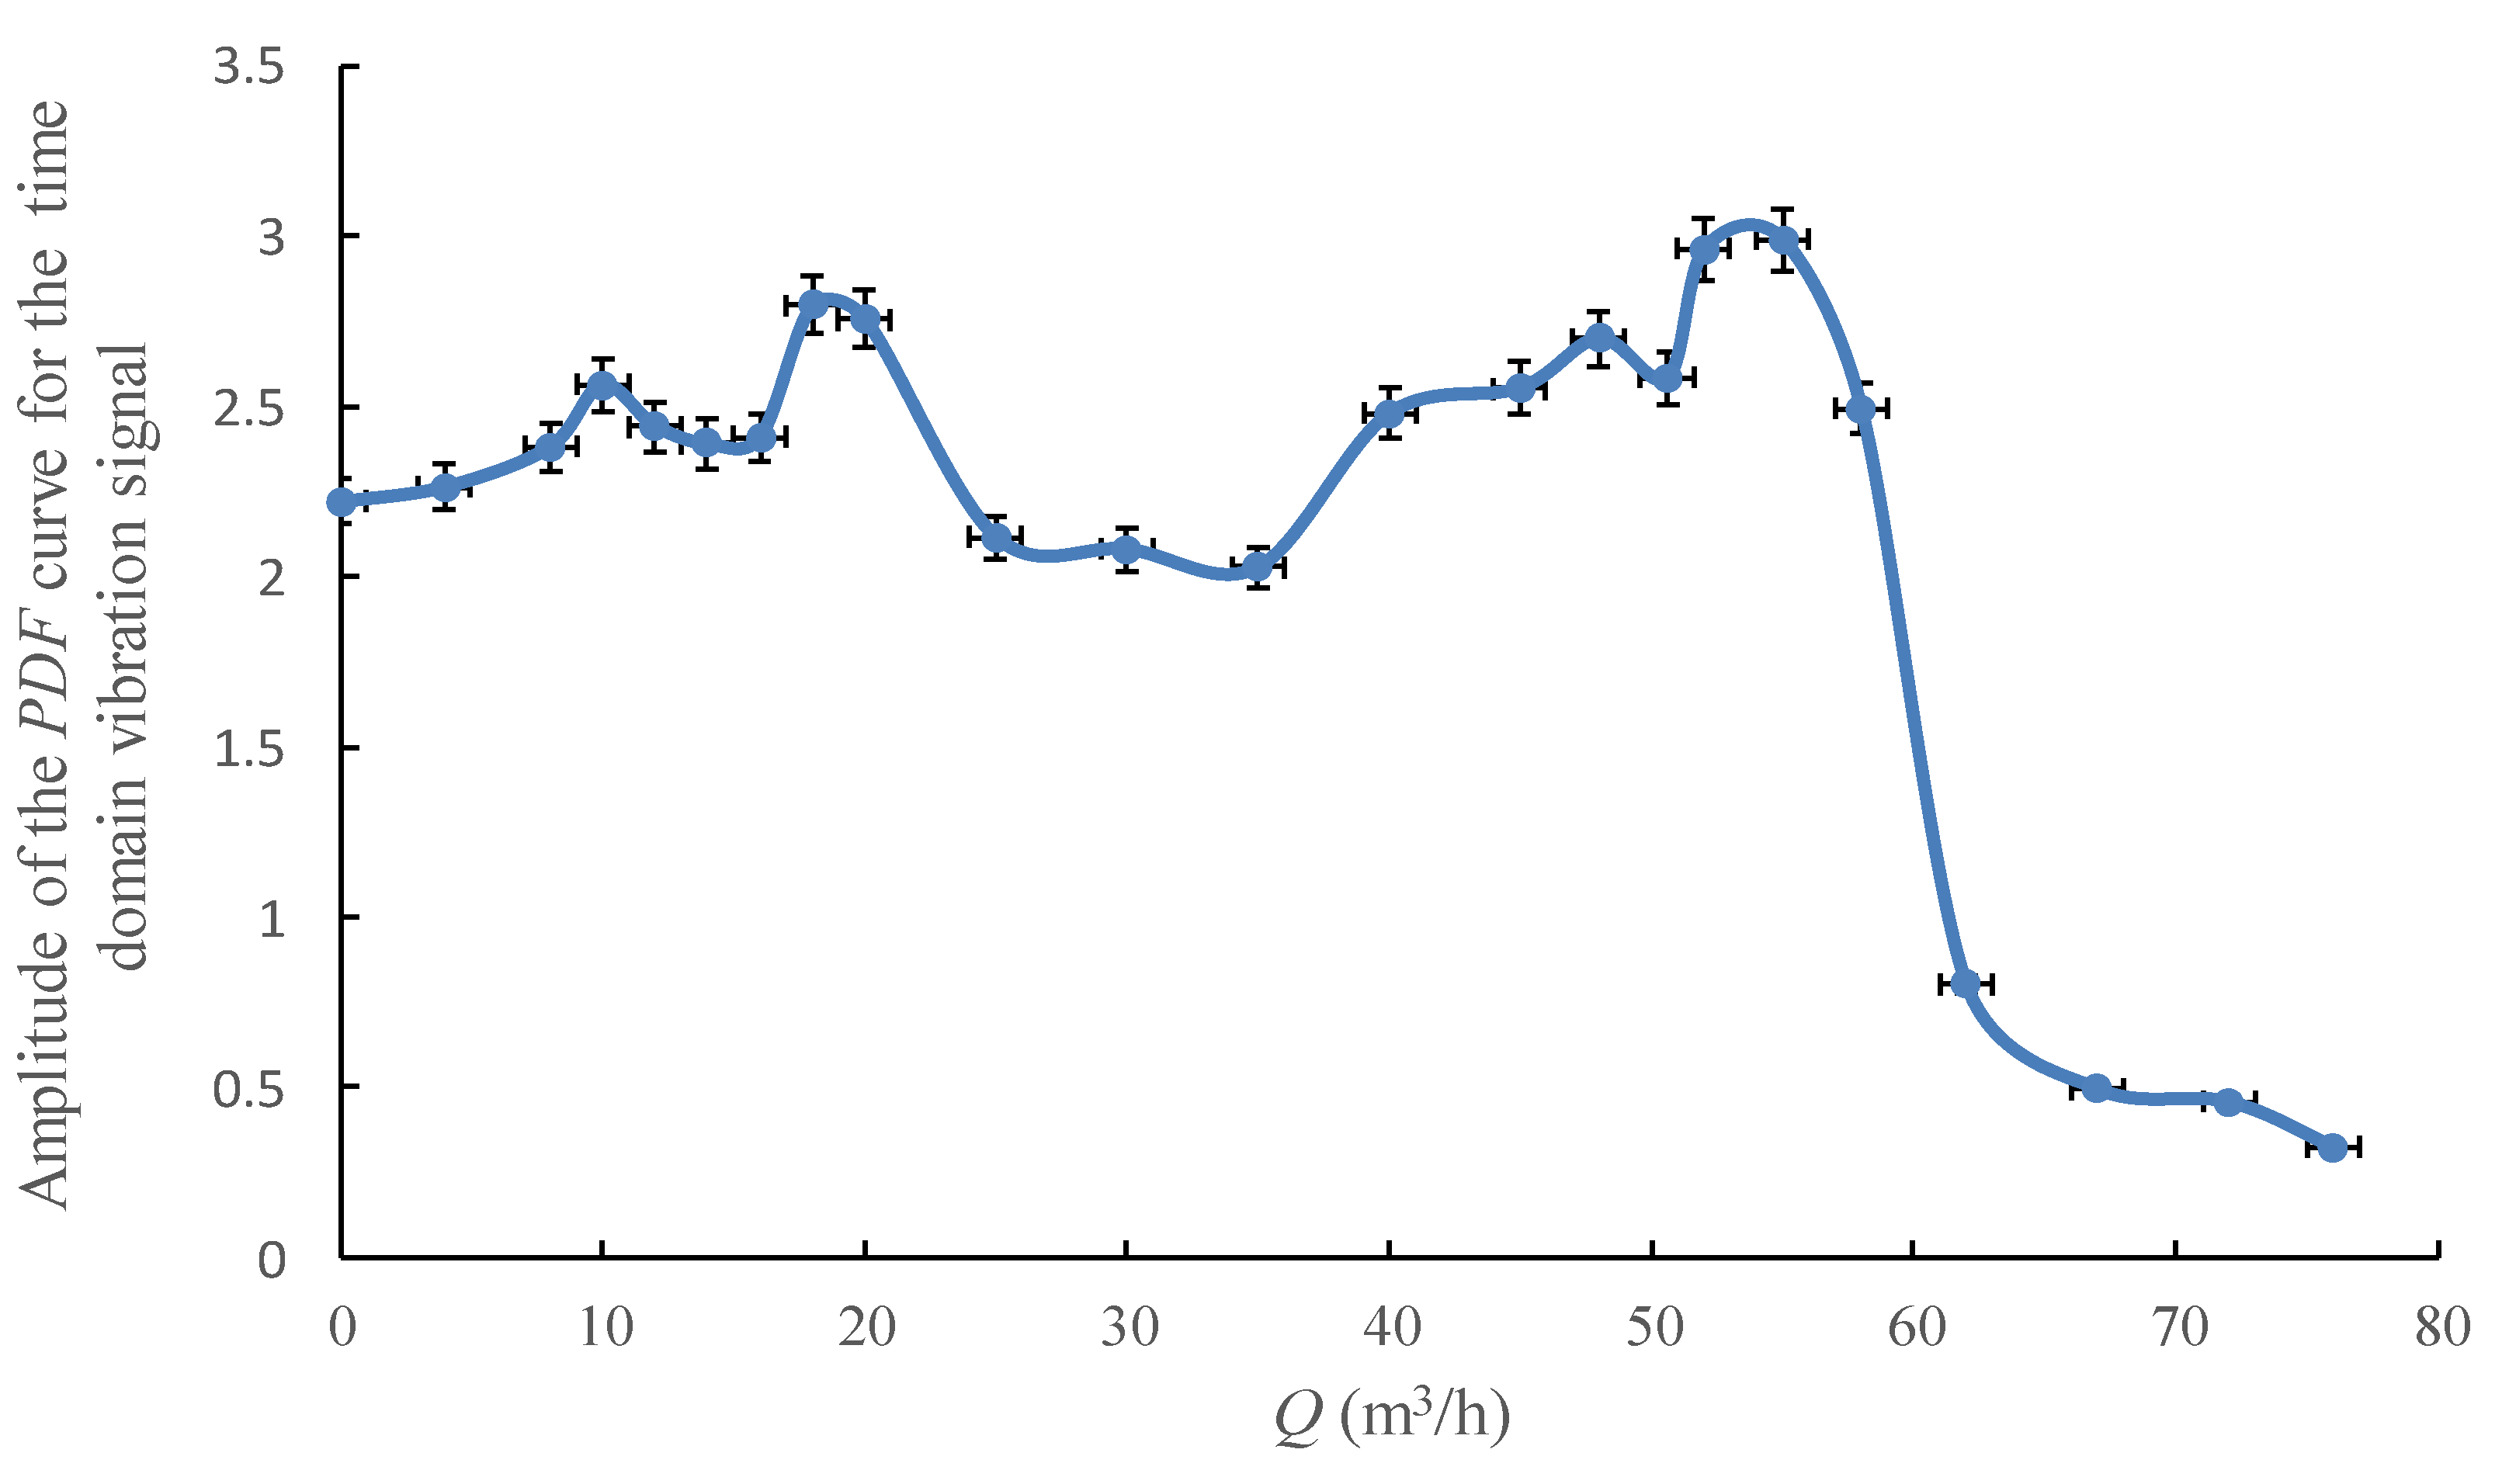
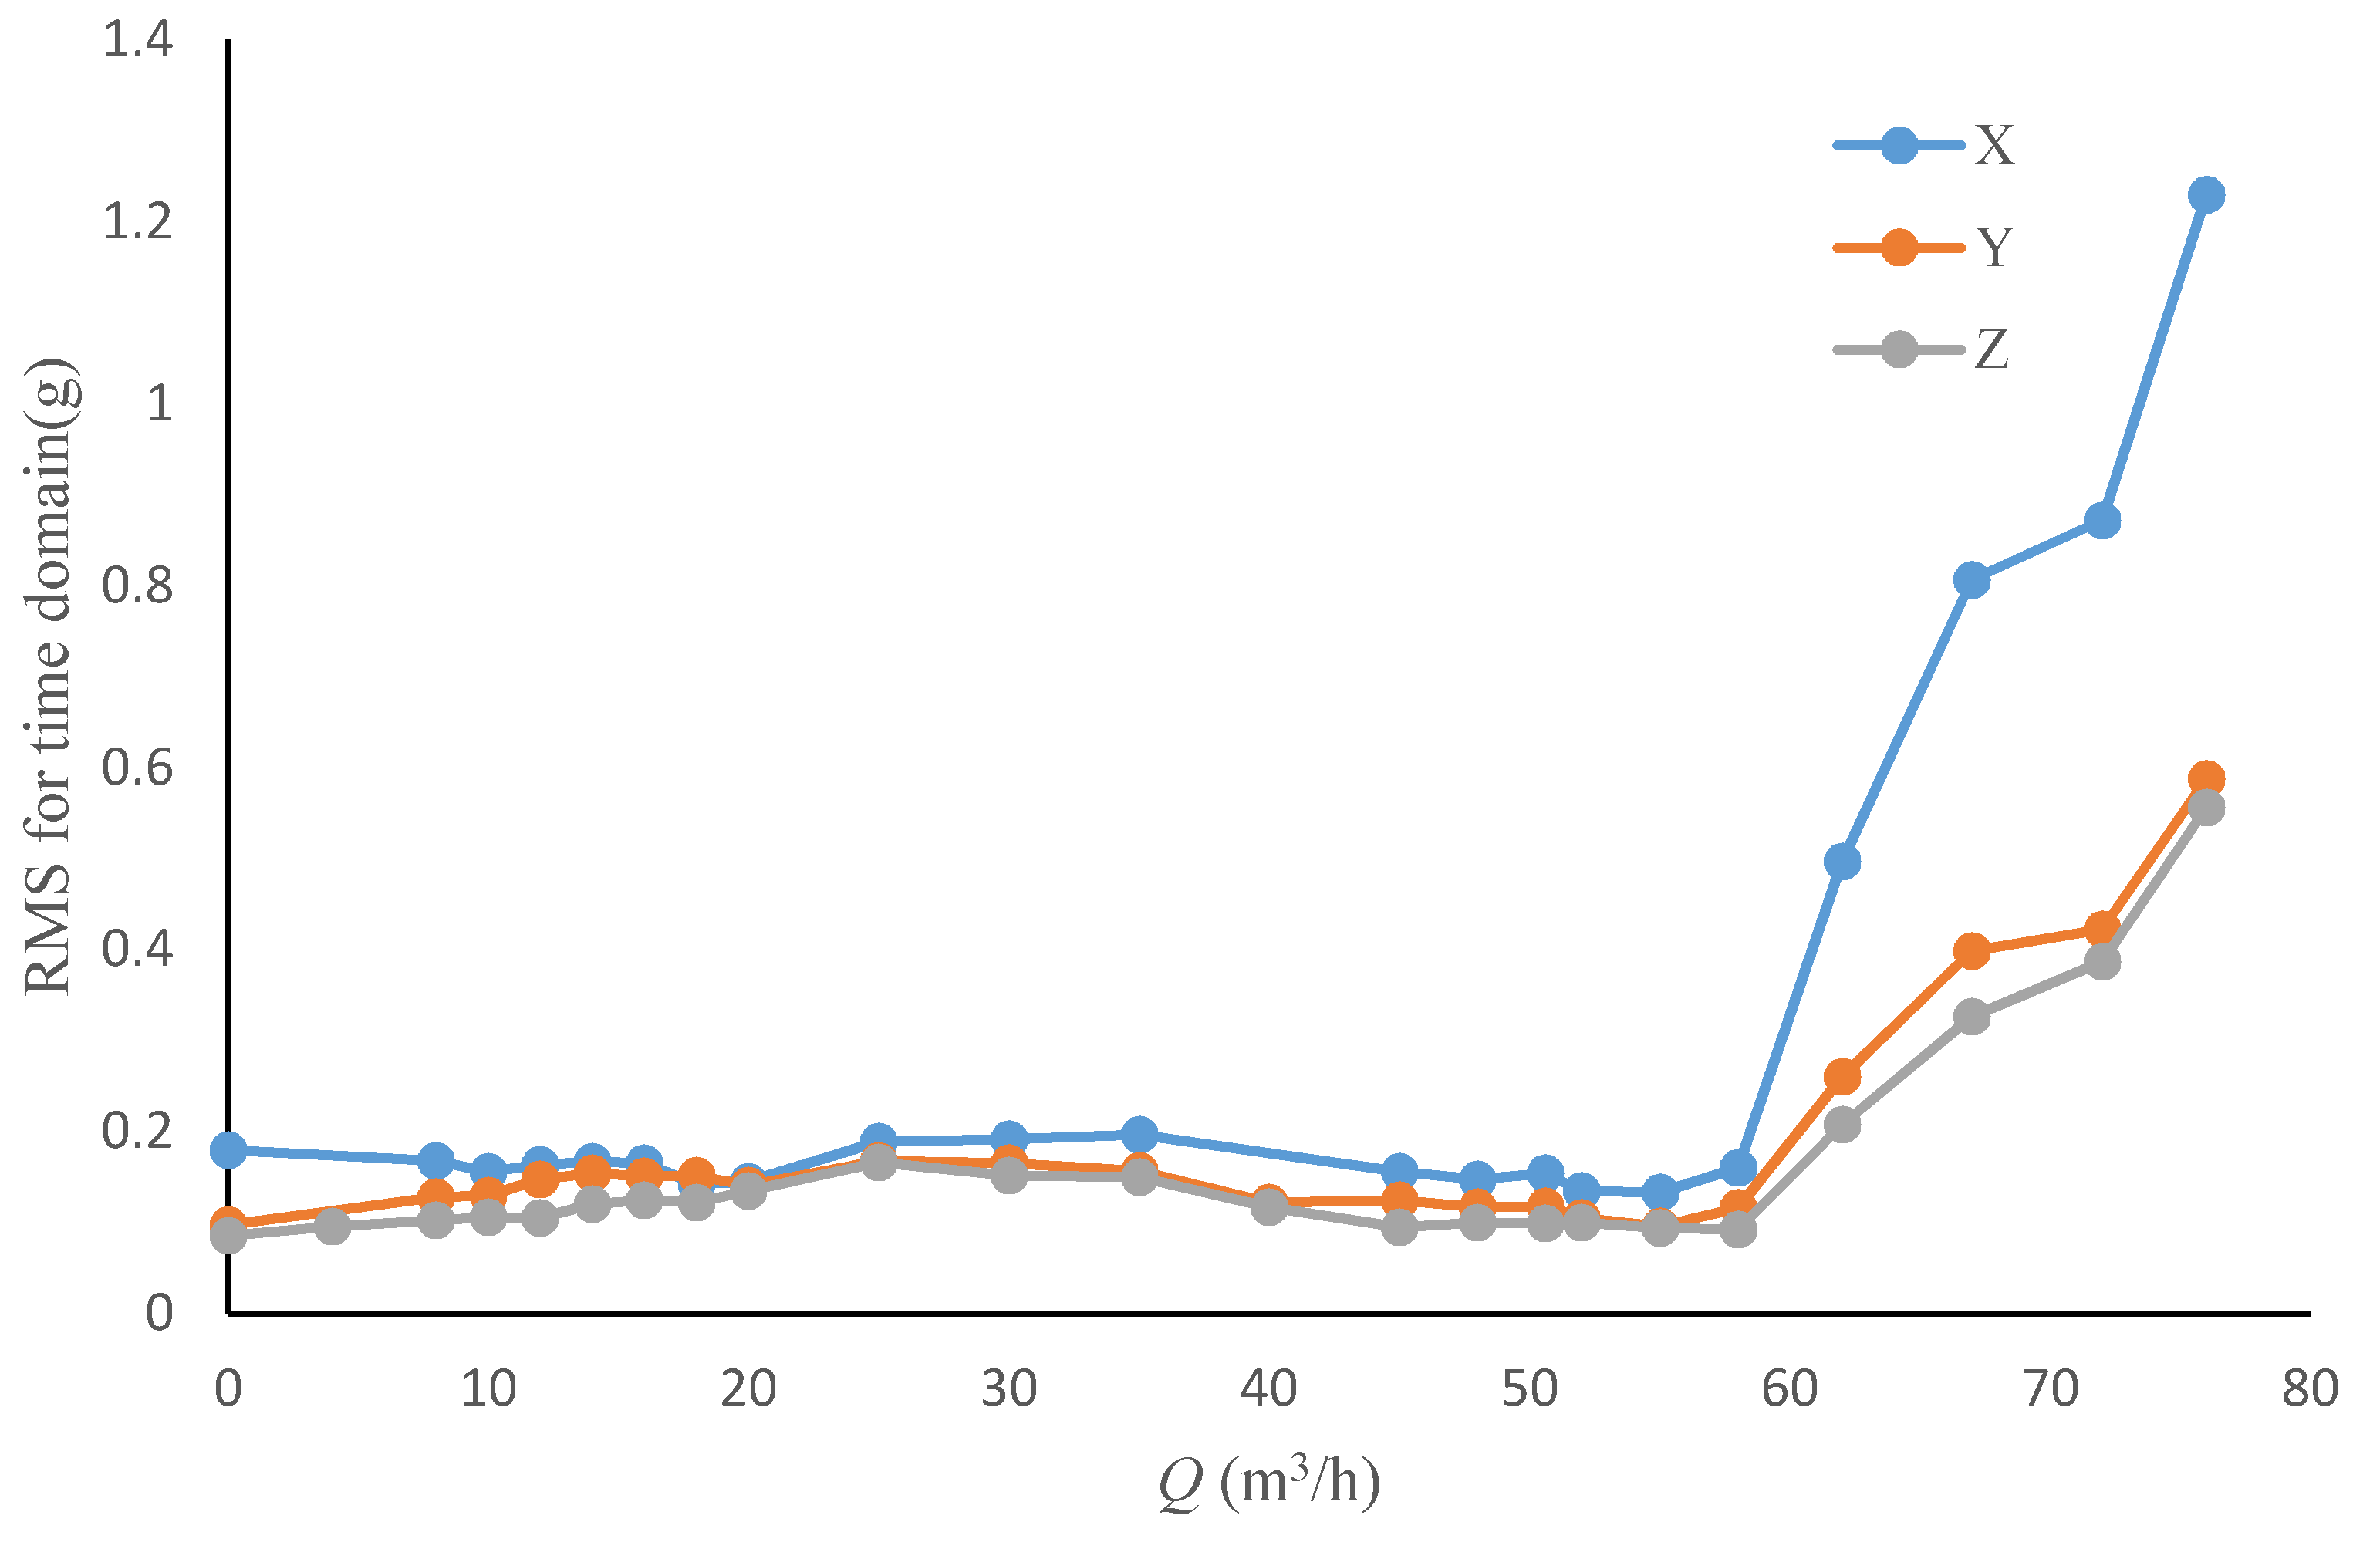
4.1. Single-Value Indicators of Vibration from Time Domain
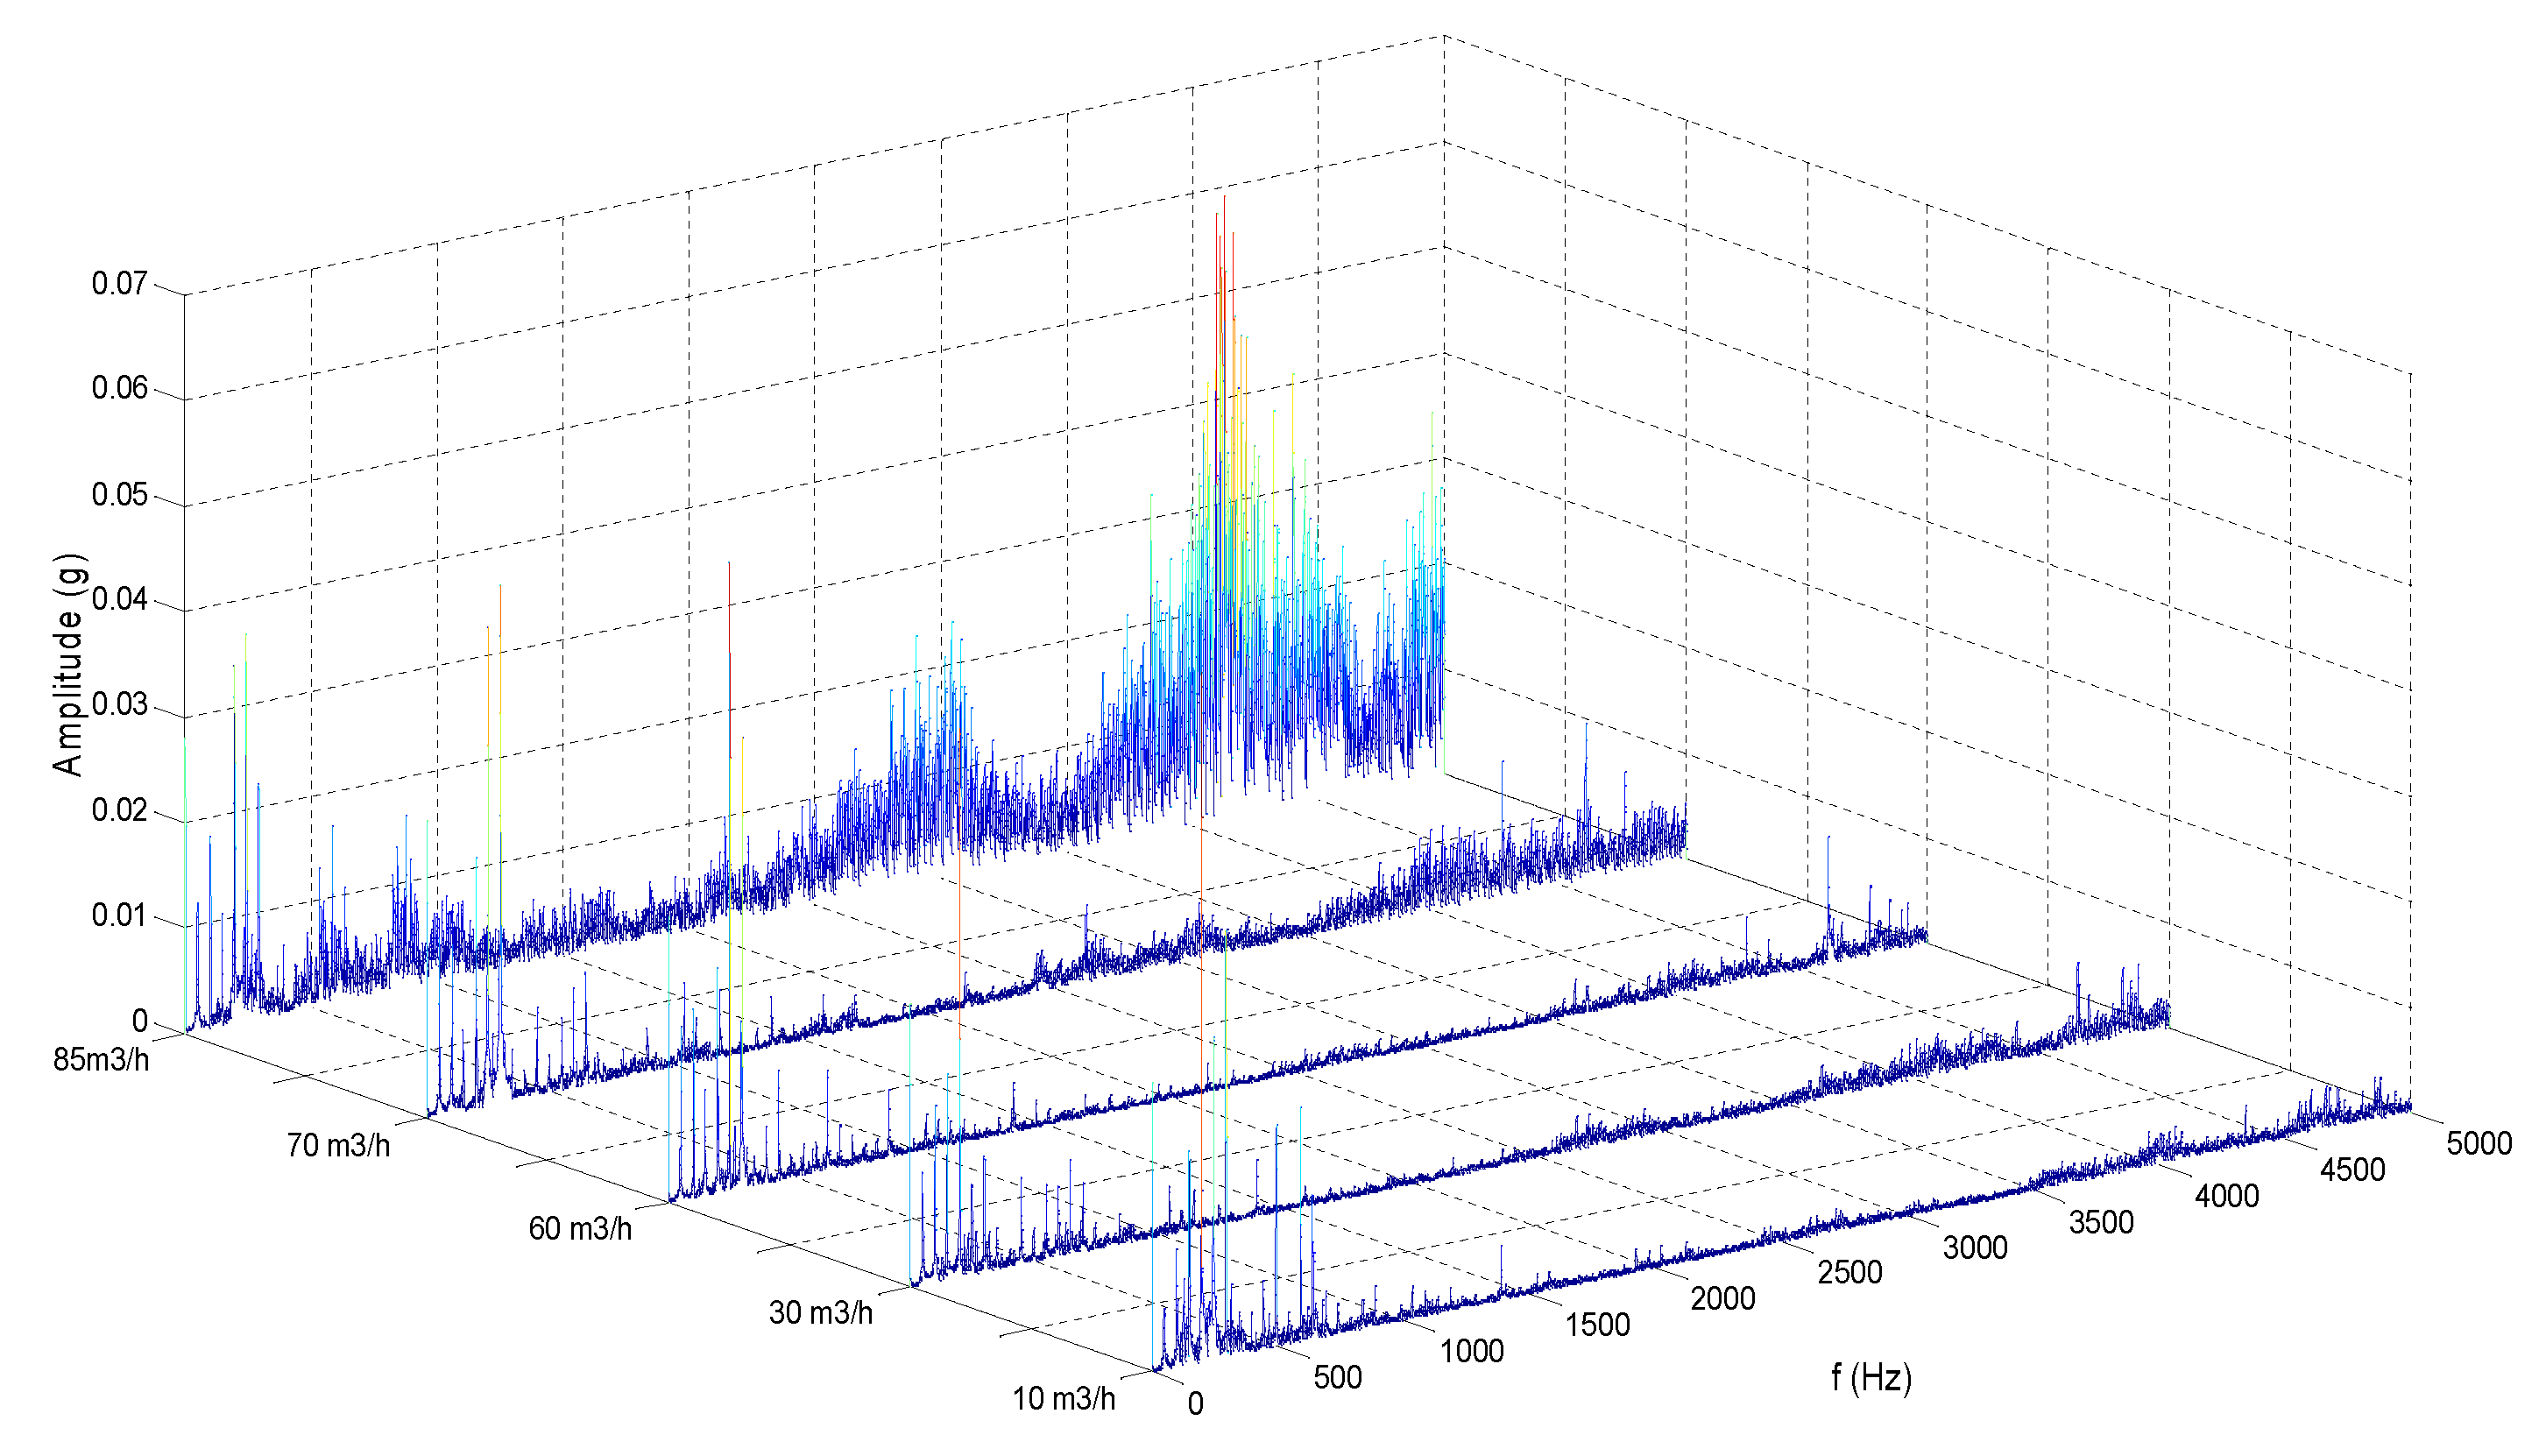
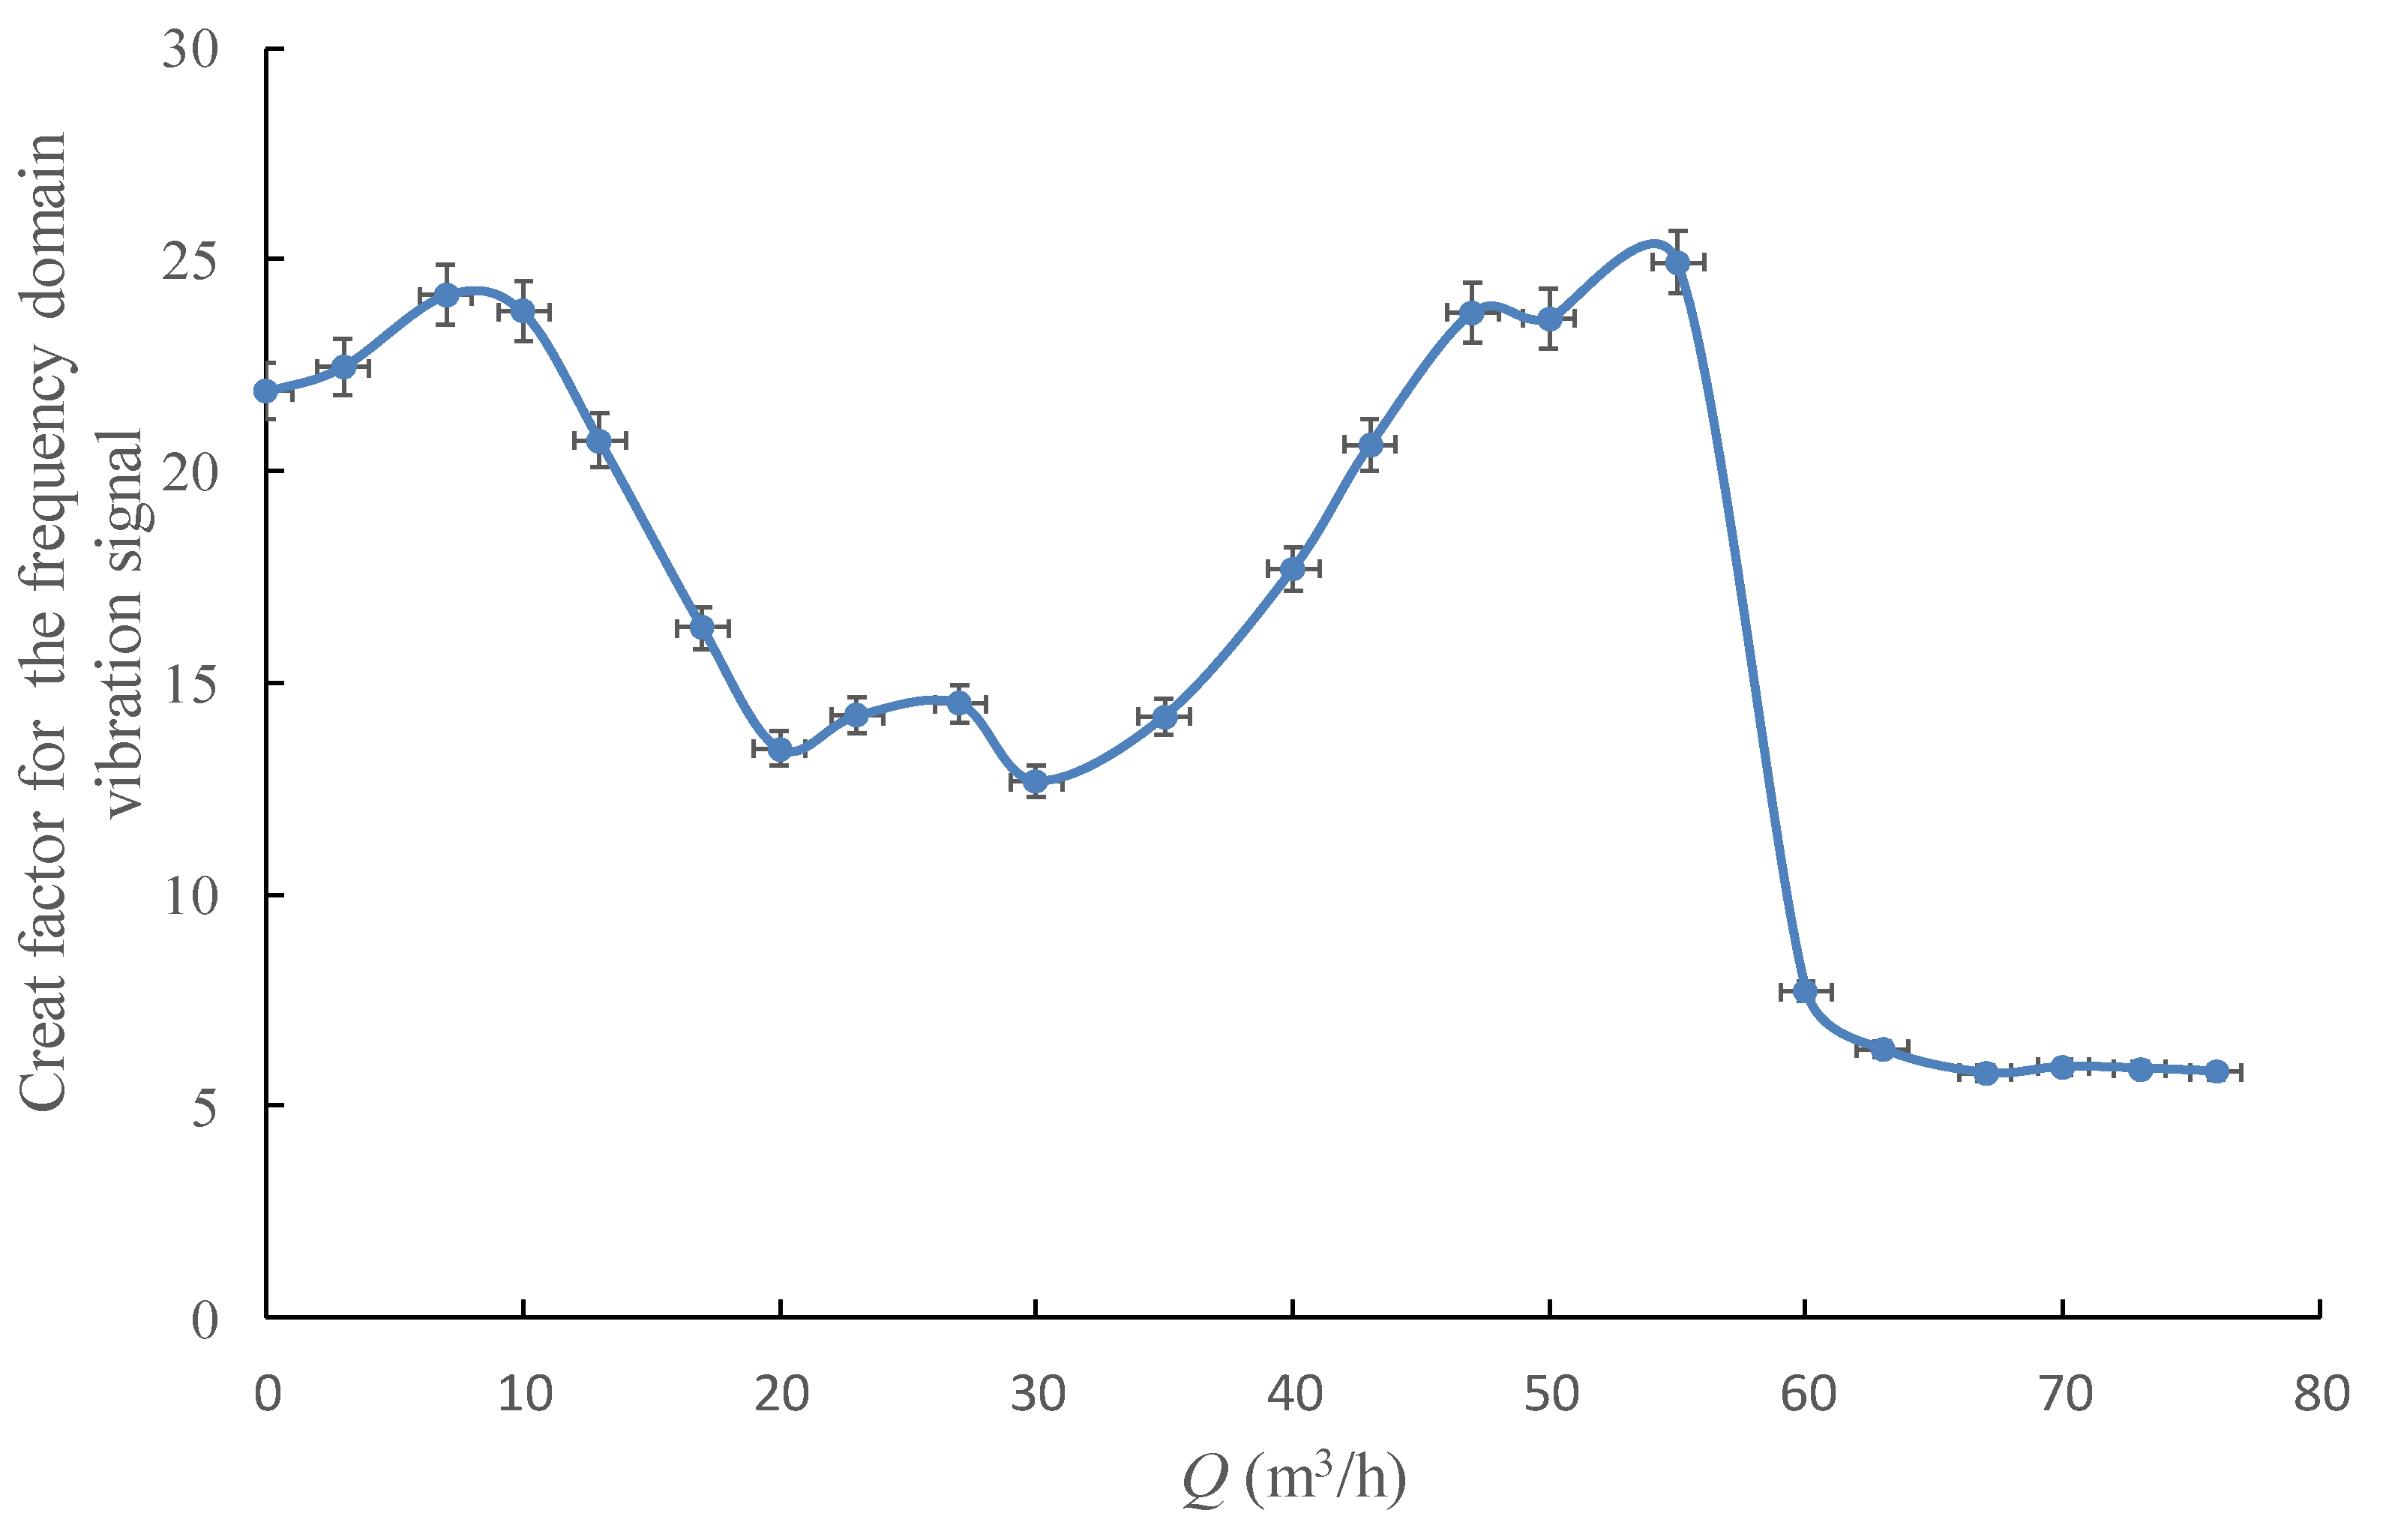
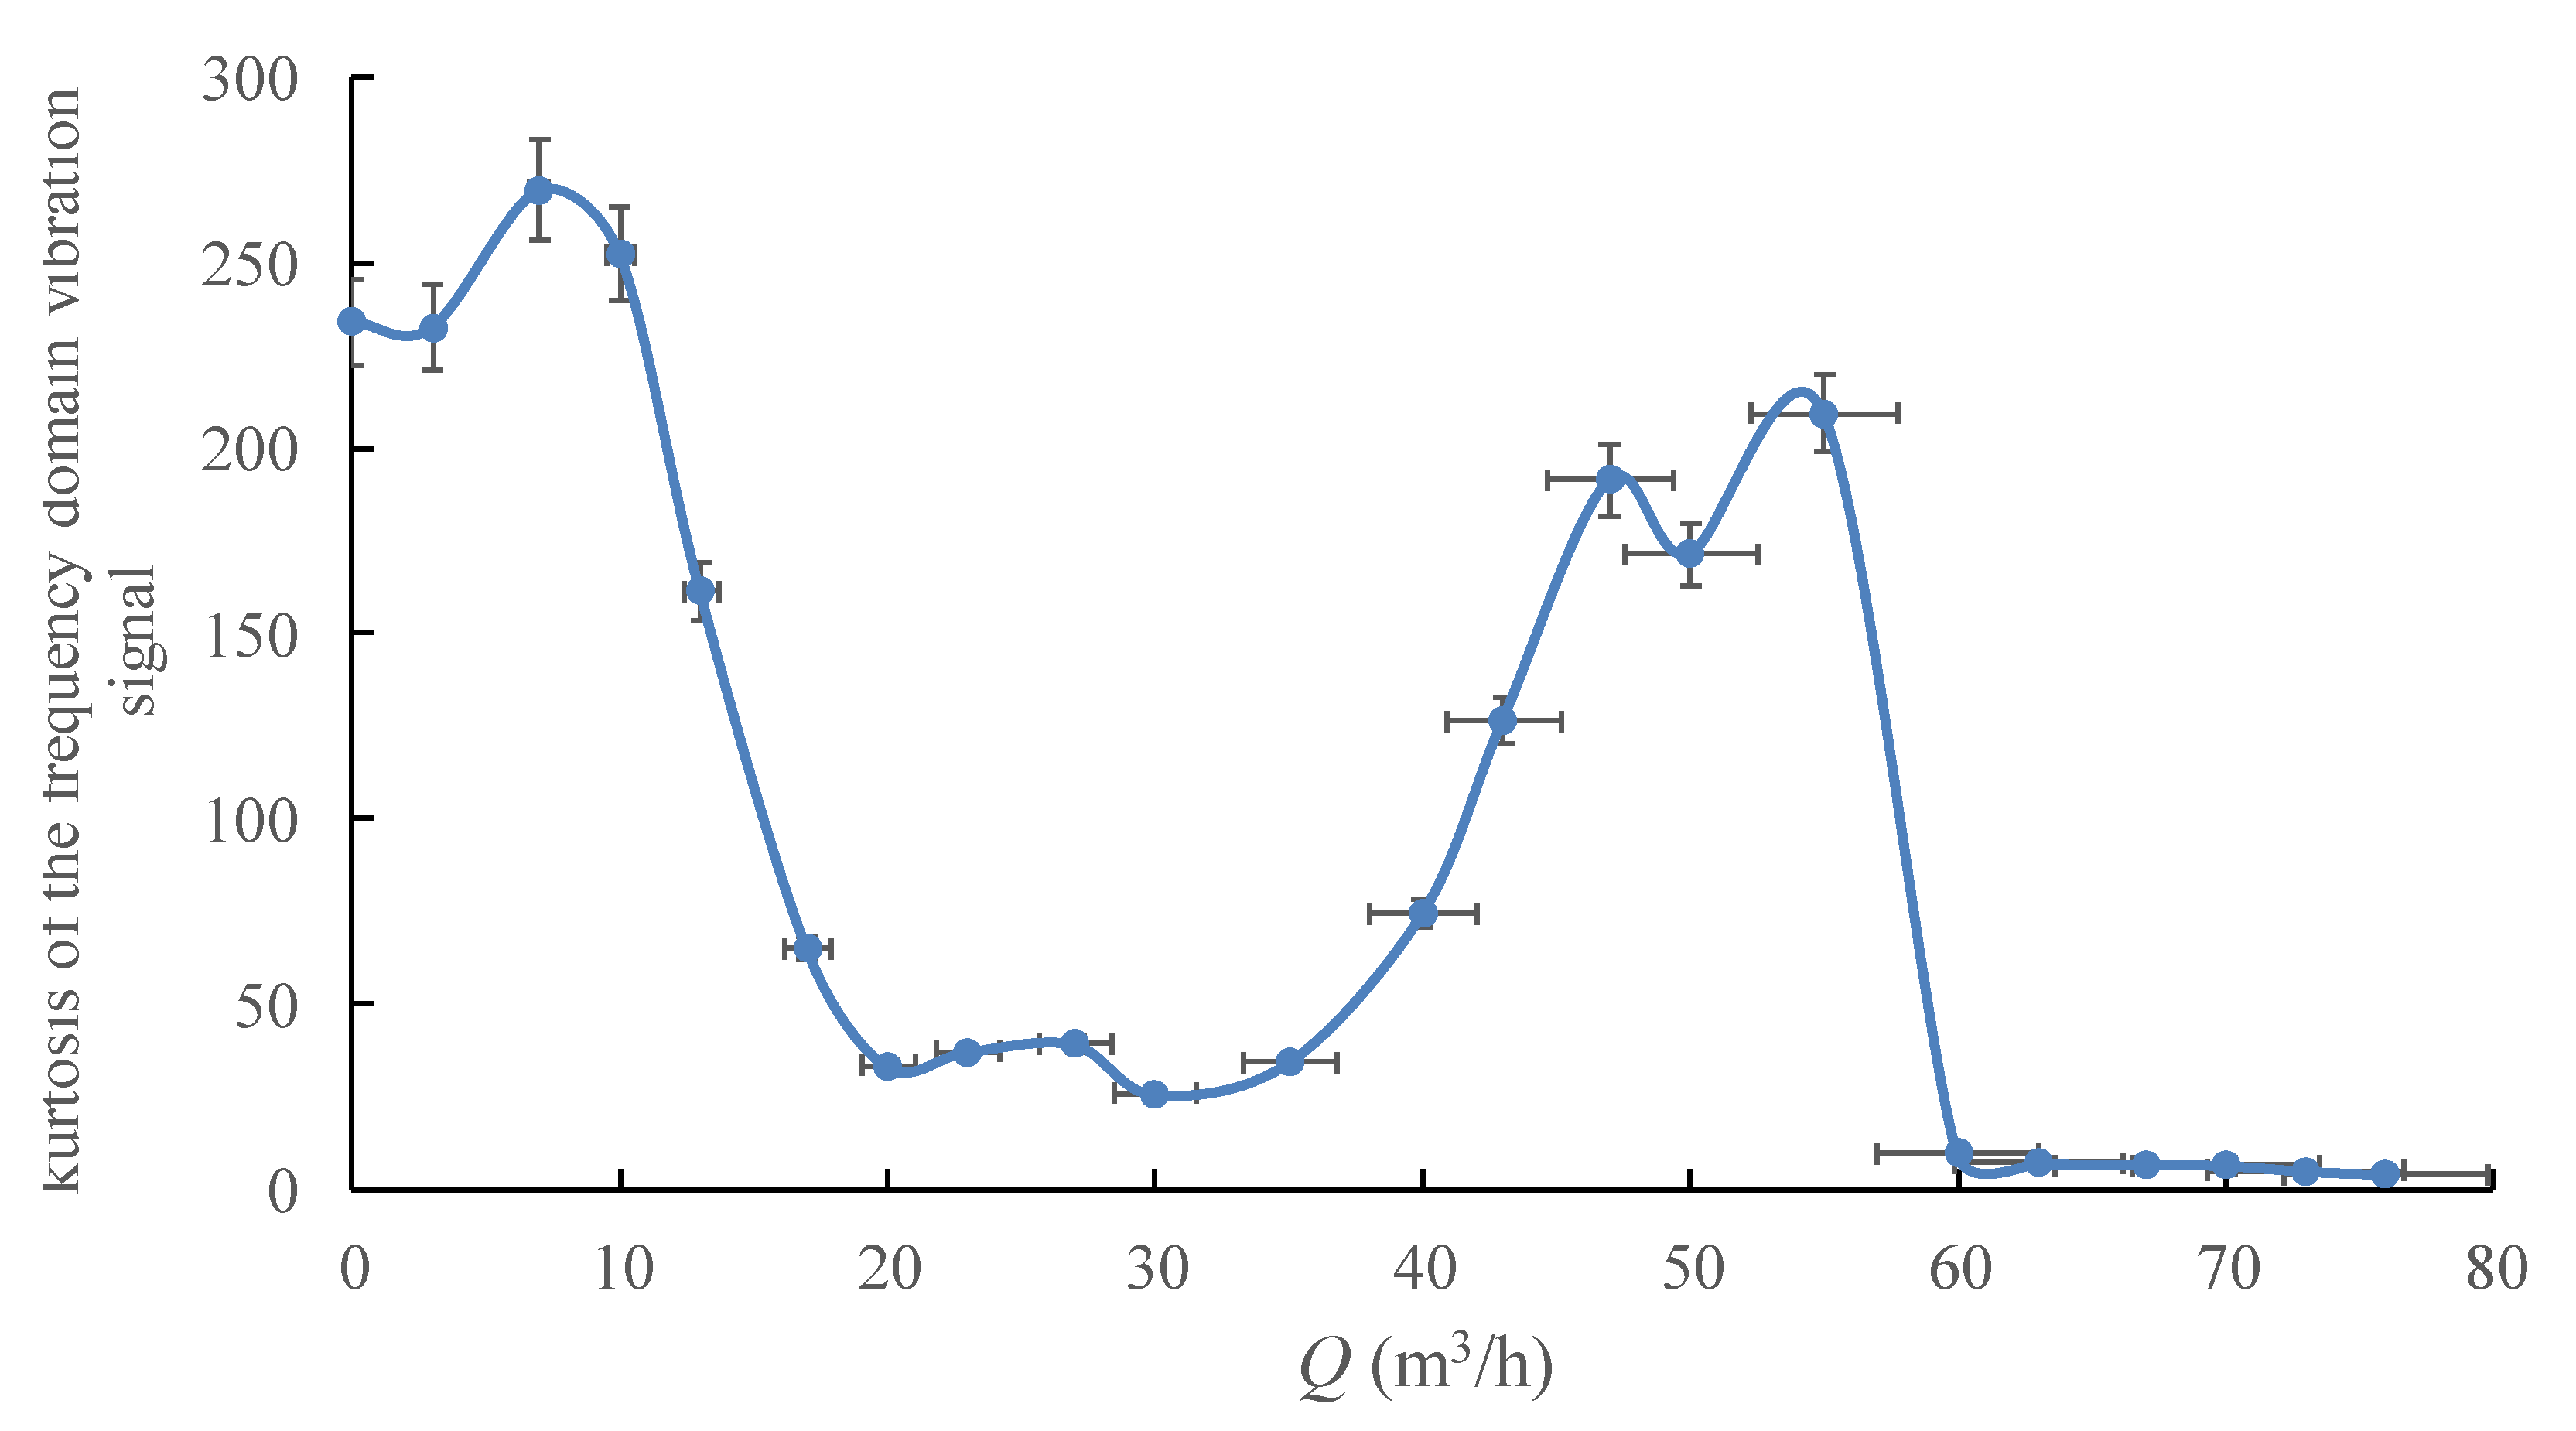
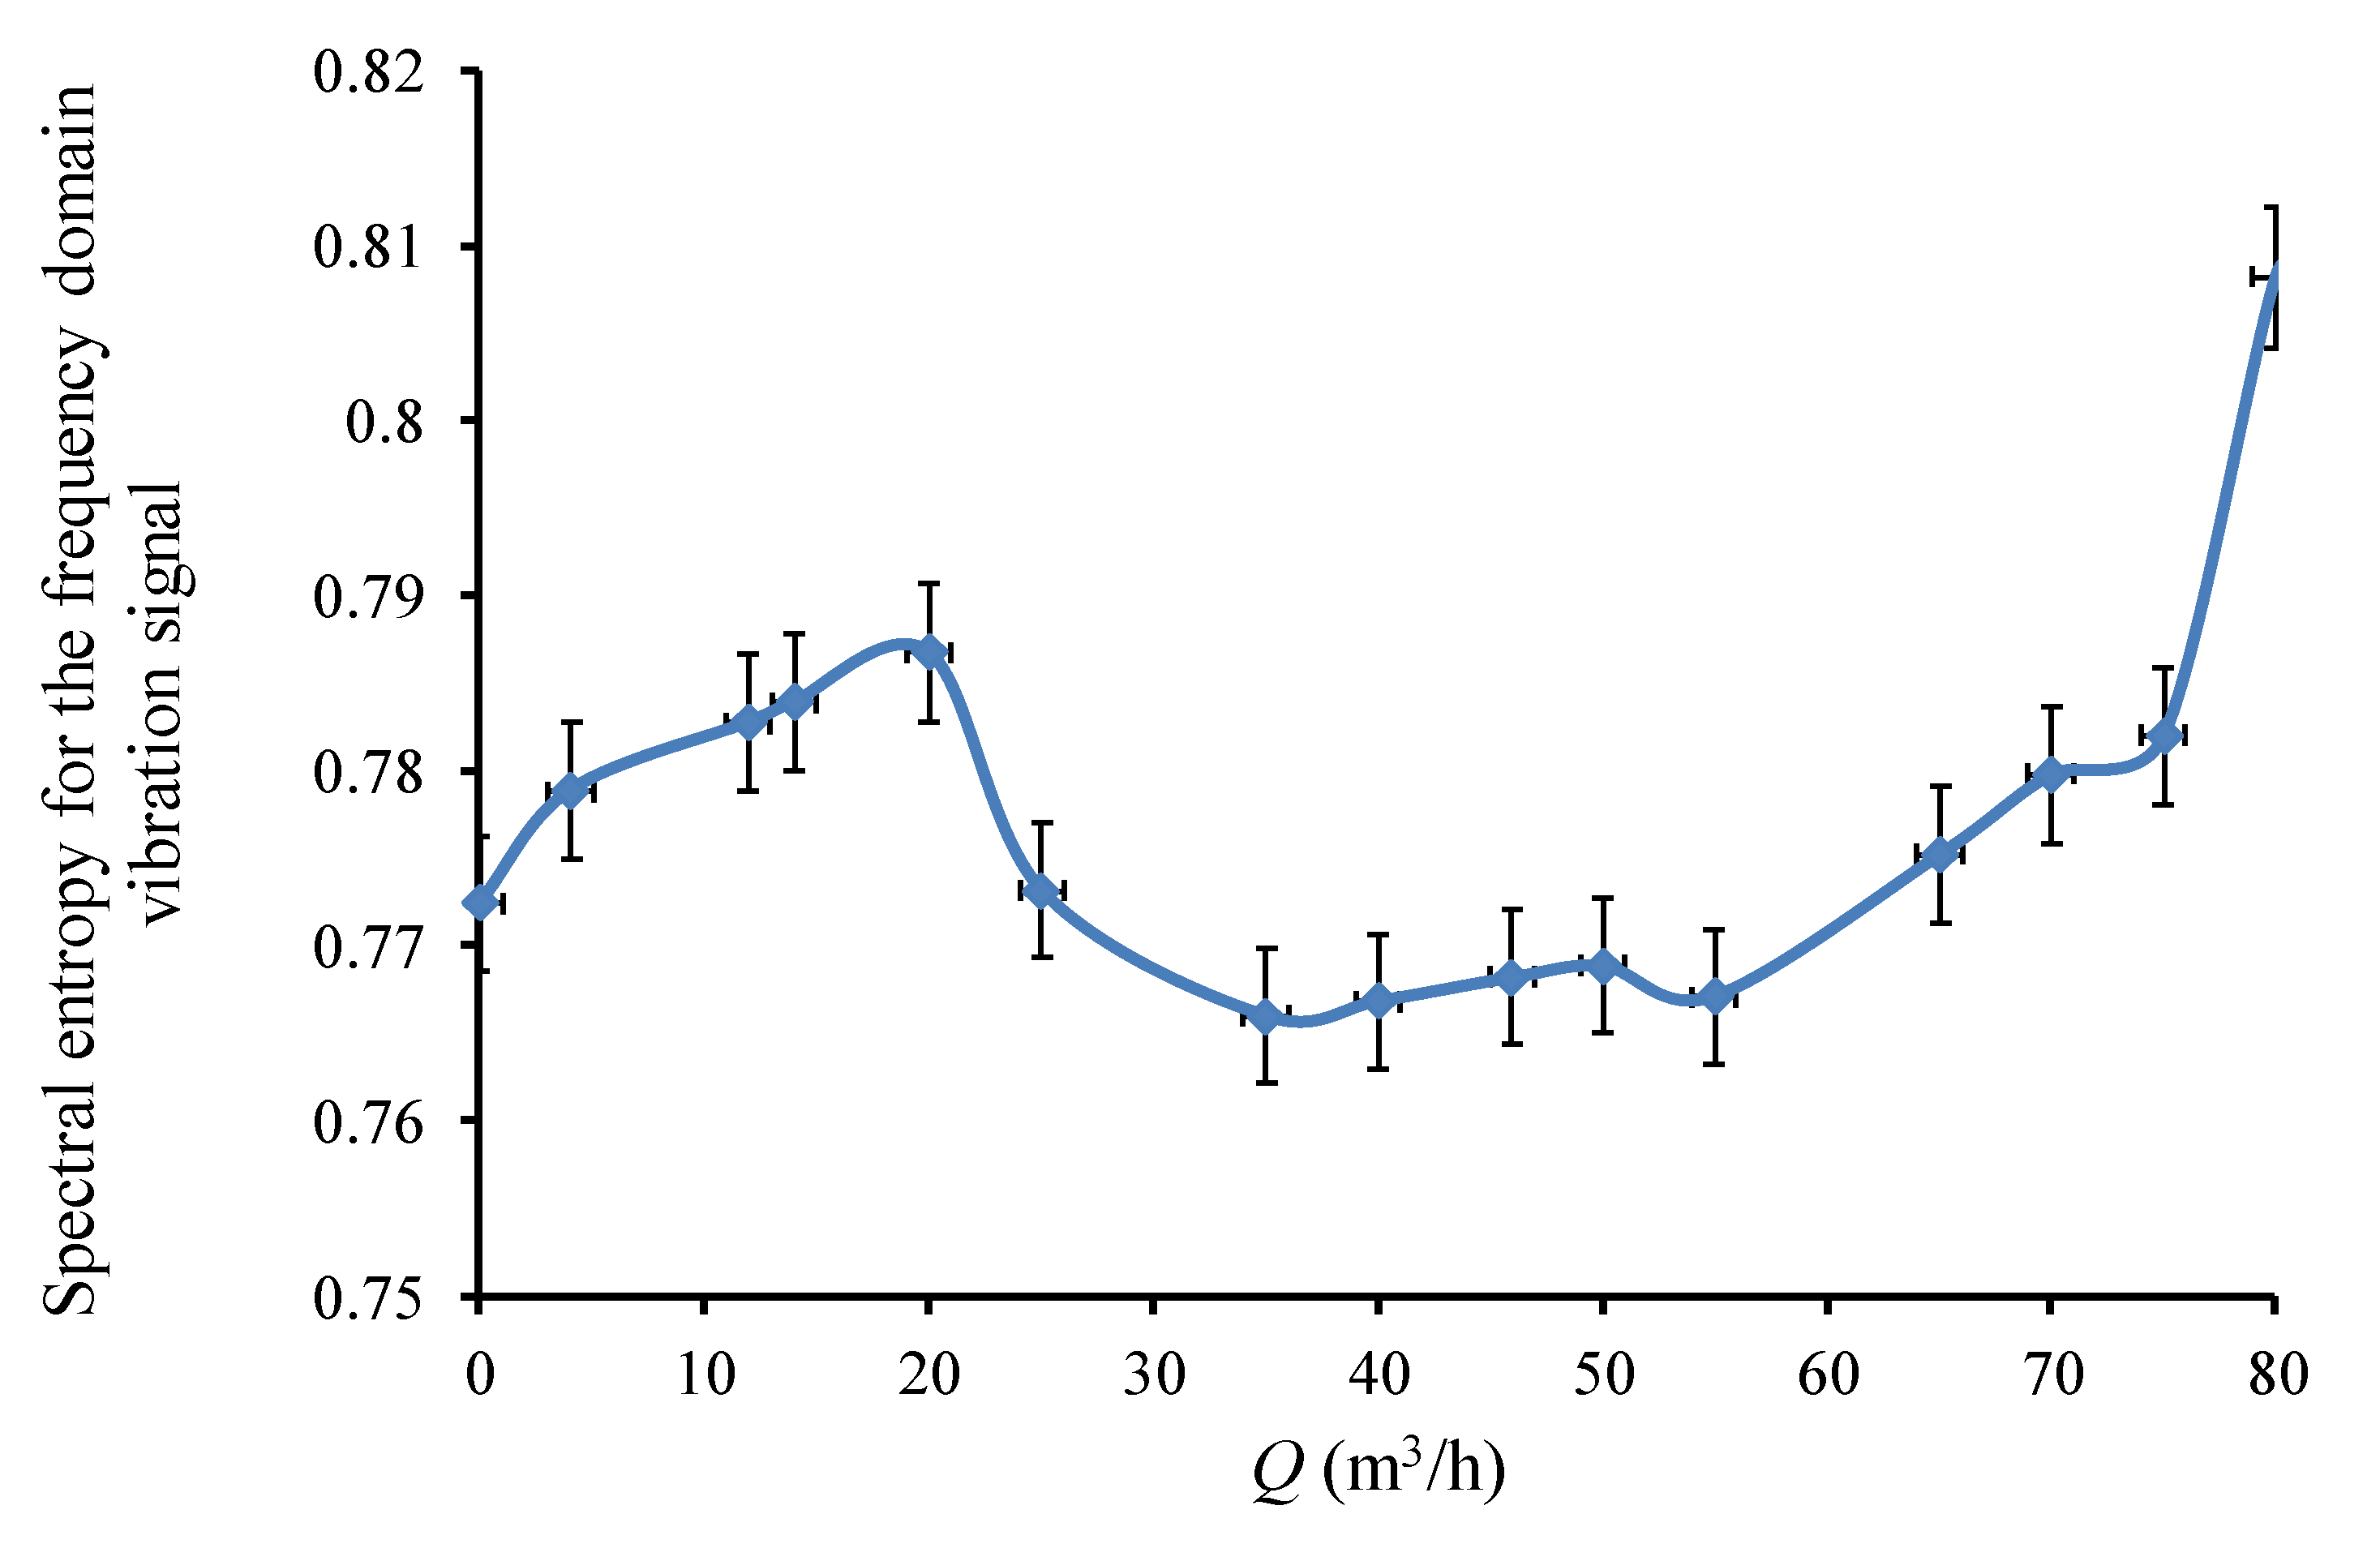
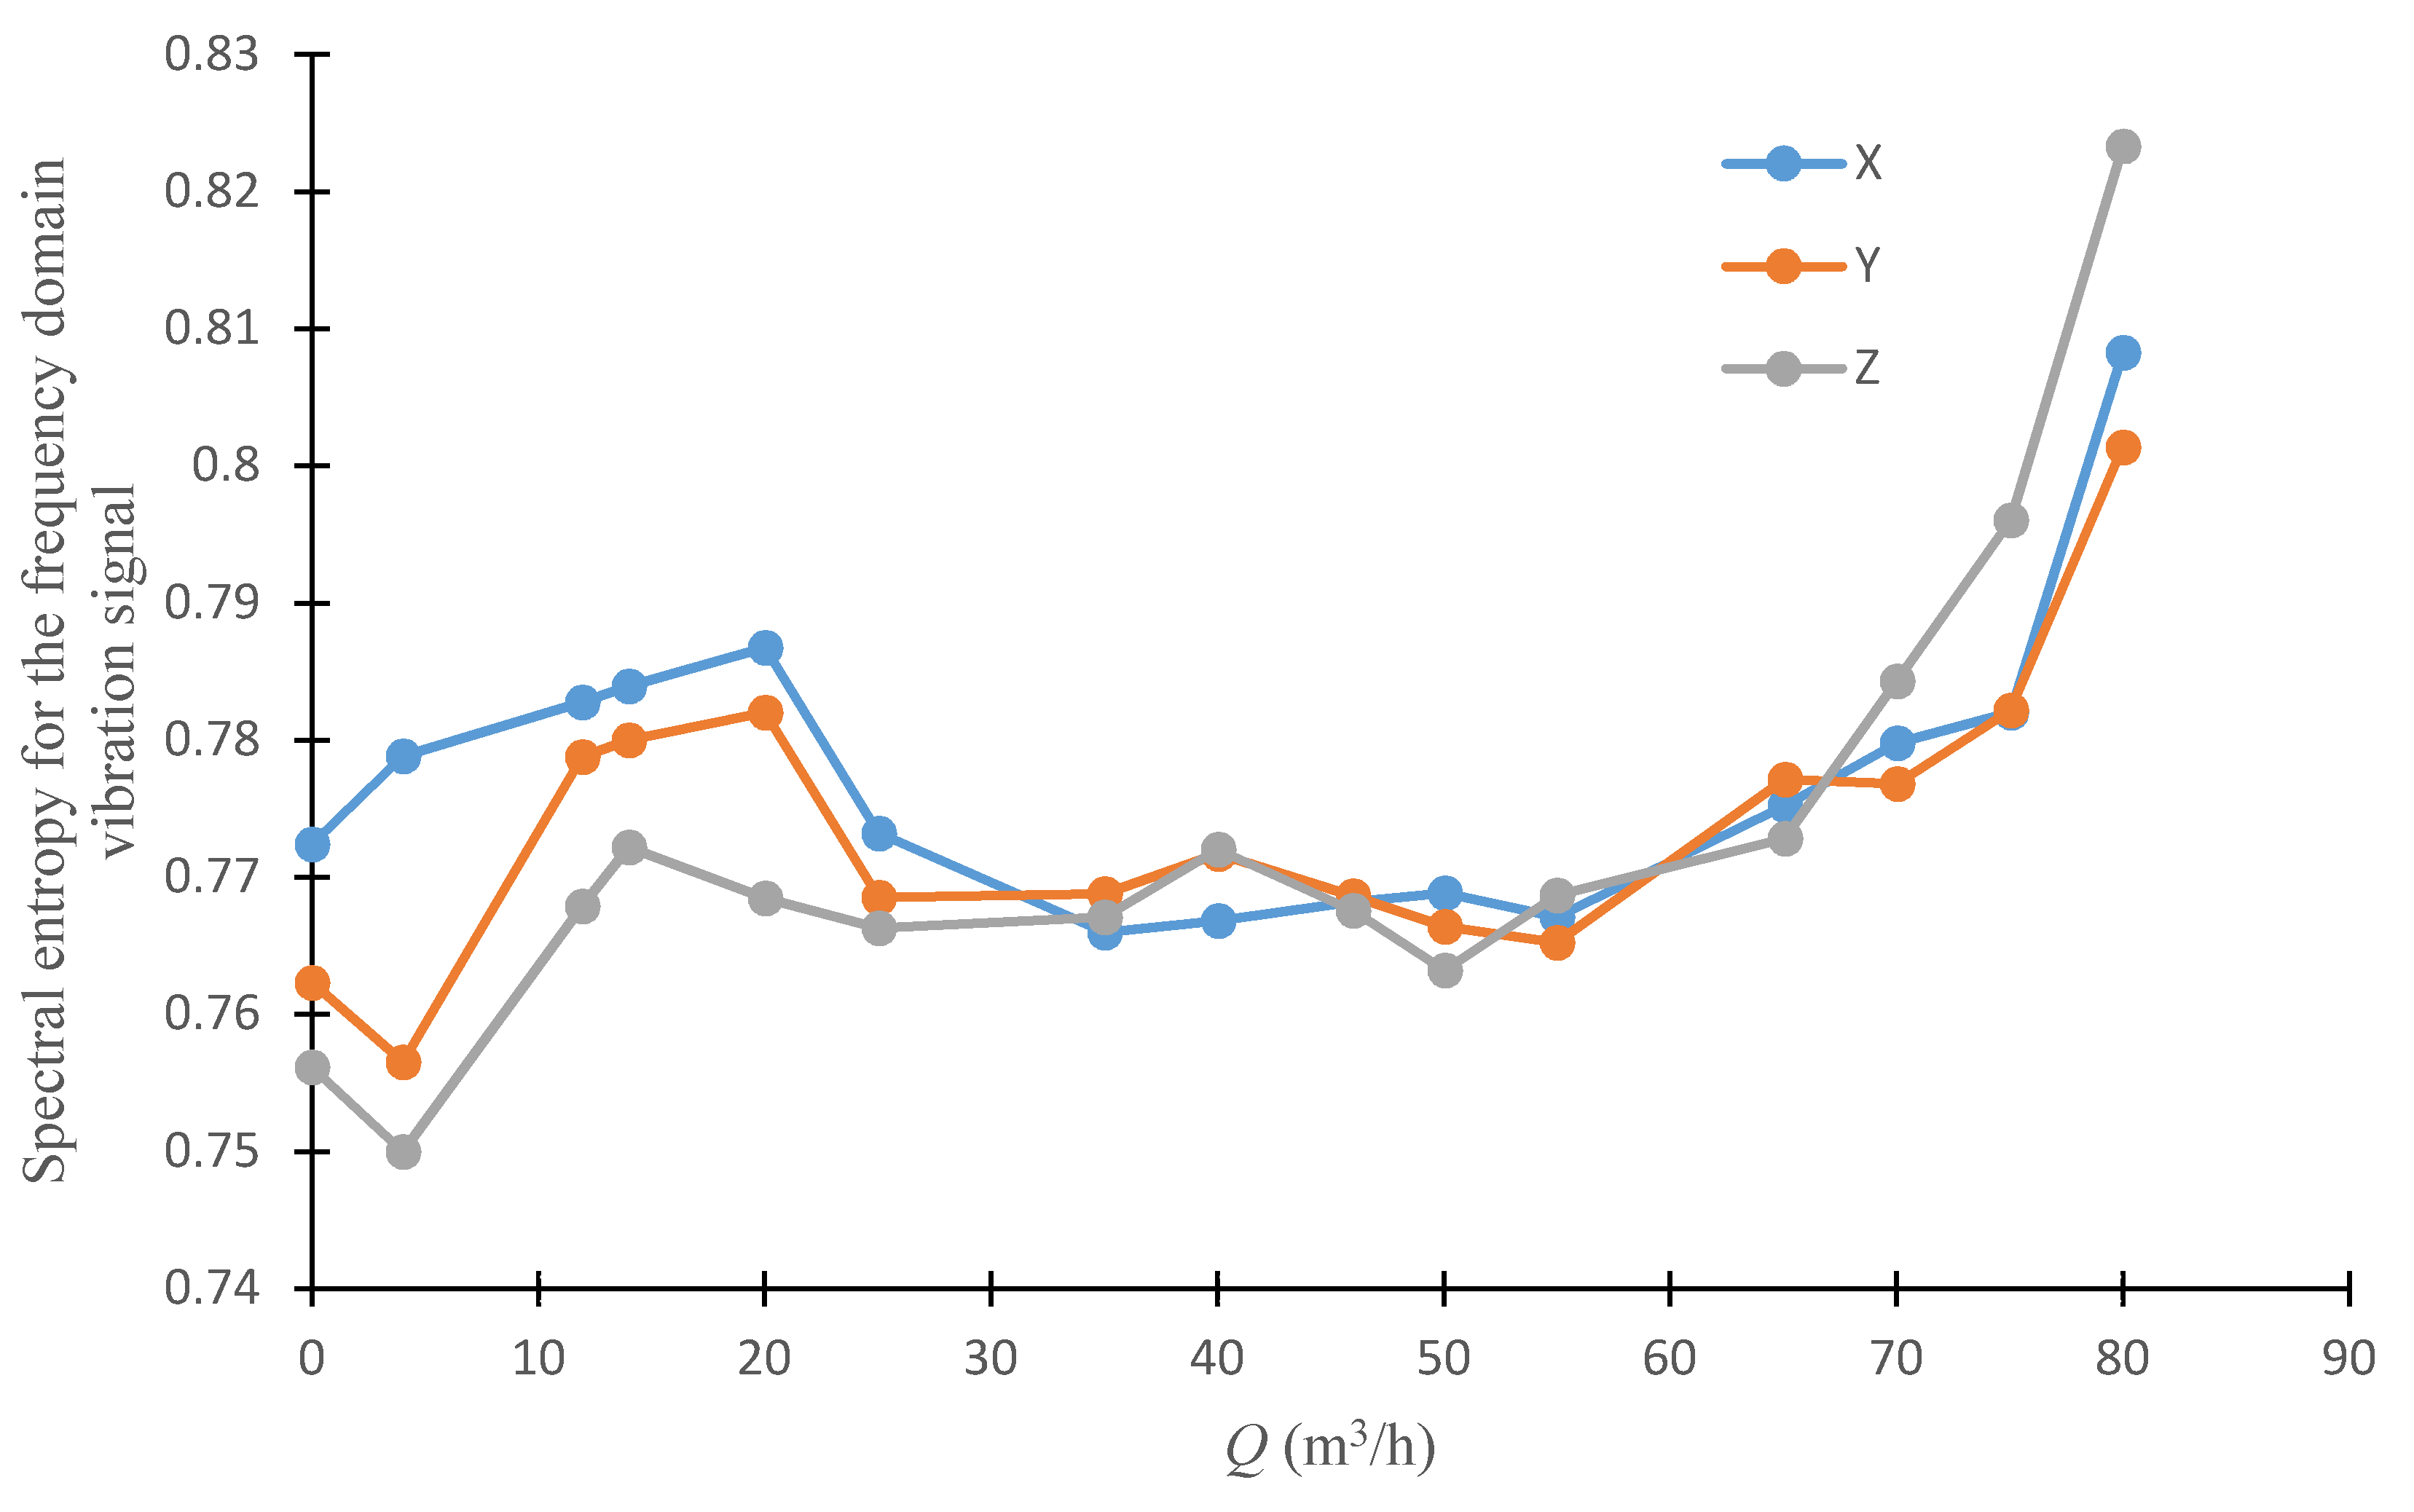
4.2. Single-Value Indicators of Vibration from Frequency Domain
4.3. Comparison of Single-Value Indicators in Multiple Measurement Directions
5. Conclusions
Author Contributions
Funding
Conflicts of Interest
References
- Christian, L.; Martin, B. Development of an Operation Point Detection System for Centrifugal Pumps by Classifying the Time Signal of a Single Vibration Sensor. In Proceedings of the ASME 2014 4th Joint US-European Fluids Engineering Division Summer Meeting, Chicago, IL, USA, 3–7 August 2014. [Google Scholar]
- Luo, Y.; Yuan, S.Q.; Yuan, J.P.; Lu, J.X. Research on Characteristics of the Vibration Spectral Entropy for Centrifugal Pump. Adv. Mech. Eng. 2015, 6, 698938. [Google Scholar] [CrossRef]
- Wang, J.; Hu, H. Vibration-based fault diagnosis of pump using fuzzy technique. Measurement 2006, 39, 176–185. [Google Scholar] [CrossRef]
- Zhang, W.; Peng, G.L.; Li, C.H.; Chen, Y.H.; Zhang, Z.J. A New Deep Learning Model for Fault Diagnosis with Good Anti-Noise and Domain Adaptation Ability on Raw Vibration Signals. Sensors 2017, 17, 425. [Google Scholar]
- Li, C.; Sánchez, R.V.; Zurita, G.; Cerrada, M.; Cabrera, D. Fault Diagnosis for Rotating Machinery Using Vibration Measurement Deep Statistical Feature Learning. Sensors 2016, 16, 895. [Google Scholar] [CrossRef]
- Parrondo, J.L.; Velarde, S.; Santolaria, C. Development of a predictive maintenance system for a centrifugal pump. J. Qual. Maint. Eng. 1998, 4, 198–211. [Google Scholar] [CrossRef]
- Rodriguez, C.G.; Mateos-Prieto, B.; Egusquiza, E. Monitoring of Rotor-Stator Interaction in Pump-Turbine Using Vibrations Measured with On-Board Sensors Rotating with Shaft. Shock Vib. 2014, 2014, 276796. [Google Scholar] [CrossRef]
- Al Thobiani, F. The Non-intrusive Detection of Incipient Cavitation in Centrifugal Pumps. Ph.D. Thesis, The University of Huddersfield, Huddersfield, UK, November 2011. [Google Scholar]
- He, Q.; Wang, X.; Zhou, Q. Vibration sensor data denoising using a time-frequency manifold for machinery fault diagnosis. Sensors 2014, 14, 382–402. [Google Scholar] [CrossRef]
- Prieto, M.D.; Cirrincione, G.; Espinosa, A.G.; Ortega, J.A.; Henao, H. Bearing fault detection by a novel condition-monitoring scheme based on statistical-time features and neural networks. IEEE Trans. Ind. Electron. 2013, 60, 3398–3407. [Google Scholar] [CrossRef]
- Hamomd, O.; Alabied, S.; Xu, Y.D.; Daraz, A.; Gu, F.S.; Ball, A. Vibration based centrifugal pump fault diagnosis based on modulation signal bispectrum analysis. In Proceedings of the 23rd International Conference on Automation & Computing, Huddersfield, UK, 7–8 September 2017. [Google Scholar]
- Sun, H.; Yuan, S.Q.; Luo, Y. Cyclic Spectral Analysis of Vibration Signals for Centrifugal Pump Fault Characterization. IEEE Sens. J. 2018, 18, 2925–2933. [Google Scholar]
- Li, Y.B.; Wang, X.Z.; Si, S.B. Centrifugal Pumps Fault Diagnosis Using Multivariate Multiscale Symbolic Dynamic Entropy and Logistic Regression. In Proceedings of the 2018 Prognostics and System Health Management Conference, Chongqing, China, 26–28 October 2018. [Google Scholar]
- Siano, D.; Panza, M.A. Diagnostic method by using vibration analysis for pump fault detection. In Proceedings of the 73rd Conference of the Italian Thermal Machines Engineering Association, Pisa, Italy, 12–14 September 2018. [Google Scholar]
- Xue, H.T.; Li, Z.X.; Wang, H.Q.; Chen, P. Intelligent Diagnosis Method for Centrifugal Pump System Using Vibration Signal and Support Vector Machine. Shock Vib. 2014, 2014, 407570. [Google Scholar] [CrossRef]
- Sakthivel, N.; Nair, B.; Sugumaran, V. Soft computing approach to fault diagnosis of centrifugal pump. Appl. Soft Comput. 2012, 12, 1574–1581. [Google Scholar] [CrossRef]
- Mohanty, A.R.; Pradhan, P.K.; Mahalik, N.P.; Dastidar, S.G. Fault detection in a centrifugal pump using vibration and motor current signature analysis. Int. J. Autom. Control 2012, 6, 261–276. [Google Scholar] [CrossRef]
- Sakthivel, N.R.; Sugumaran, V.; Babudevasenapati, S. Vibration based fault diagnosis of monoblock centrifugal pump using decision tree. Expert Syst. Appl. 2010, 37, 4040–4049. [Google Scholar] [CrossRef]
- Chudina, M. Noise as an indicator of cavitation in a centrifugal pump. Acoust. Phys. 2003, 49, 463–474. [Google Scholar] [CrossRef]
- Surendra, N.G.; Kanakasabai, V. Using vibration signatures analysis to detect cavitation in centrifugal pumps. In Rotating Machinery, Structural Health Monitoring, Shock and Vibration; Society for Experimental Mechanics Series; Springer: New York, NY, USA, 2011; pp. 499–507. [Google Scholar]
- Florjancic, S.; Frei, A. Dynamic loading on pumps-causes for vibrations. In Proceedings of the 10th International Pump Users Symposium; Elsevier: Houston, TX, USA, 1993; pp. 171–184. [Google Scholar]
- Nelson, W.E.; Dufour, J.W. Pump vibrations. In Proceedings of the 9th International Pump Users Symposium; Elsevier: Houston, TX, USA, 1992; pp. 137–147. [Google Scholar]
- Black, H.F. Effects of Hydraulic Forces in Annular Pressure Seals on the Vibration of Centrifugal Pump Rotors. Arch. J. Mech. Eng. 1969, 11, 206–213. [Google Scholar] [CrossRef]
- Liu, C.H.; Vafidis, C.; Whitelaw, J.H. Flow Characteristics of a Centrifugal Pump. J. Fluids Eng. 1994, 116, 303. [Google Scholar] [CrossRef]
- Dong, R.; Chu, S.; Katz, J. Effect of Modification to Tongue and Impeller Geometry on Unsteady Flow, Pressure Fluctuations, and Noise in a Centrifugal Pump. J. Turbomach. 1997, 119, 506. [Google Scholar] [CrossRef]
- Klaus, B.; Rainer, K. Analysis of Secondary Flows in Centrifugal Impellers. Int. J. Rotat. Mach. 2005, 1, 45–52. [Google Scholar]
- Pavesi, G.; Cavazzini, G.; Ardizzon, G. Time-frequency Characterization of the Unsteady Phenomena in a Centrifugal Pump. Int. J. Heat Fluid Flow 2008, 29, 1527–1540. [Google Scholar] [CrossRef]
- Hodkiewicz, M.R.; Norton, M.P. The Effect of Change in Flow Rate on the Vibration of Double-suction Centrifugal Pumps. Proc. Inst. Mech. Eng. Part E J. Process Mech. Eng. 2005, 216, 47–58. [Google Scholar] [CrossRef]
- Pan, Y.N.; Chen, X.; Li, X.L. Spectral Entropy: A Complementary Index for Rolling Element Bearing Performance Degradation Assessment. Proc. Inst. Mech. Eng. Part C J. Mech. Eng. Sci. 2009, 223, 1223–1231. [Google Scholar] [CrossRef]
- Qu, L.; Li, L.; Lee, J. Enhanced Diagnostic Certainty Using Information Entropy Theory. Adv. Eng. Inform. 2003, 17, 141–150. [Google Scholar] [CrossRef]


| Parameter | Value |
|---|---|
| Rated flow (Qd) | 50 m3/h |
| Rated head (Hd) | 32 m |
| Rated speed (n) | 2900 r/min |
| Efficiency (η) | 72% |
| Specific speed (ns) | 101 |
| Pump inlet diameter (Ds) | 60 mm |
| Impeller inlet diameter (Dj) | 75 mm |
| Impeller outlet diameter (D2) | 174 mm |
| Blade width (b2) | 12 mm |
| Blade number (Z) | 6 |
| Volute base diameter (D3) | 184 mm |
| Pump outlet diameter (Dd) | 50 mm |
| Sensor | Parameter | Value |
|---|---|---|
| DM4022 induction tachometer | Measurement range | 0–3000 rpm |
| Measurement accuracy | 0.1% | |
| LDG-SIN-CN65-Z2 electromagnetic flowmeter | Measurement range | 0–100 m3/h |
| Measurement accuracy | 0.5% | |
| WIKA S-10 pressure sensors | Measurement range | (inlet) 0–1.6 (bar)/(outlet) (1–4 bar) |
| Measurement accuracy | 0.2% | |
| PCB MA352A60 vibration sensor | Measurement range | 5 Hz–60 kHz |
| Measurement accuracy | 10 mv/g |
| PXI-4472—Dynamic Signal Acquisition | PXI-6251—High-Speed M Series Multifunction DAQ | ||
|---|---|---|---|
| Resolution | 24-bit | Resolution | 16-bit |
| Dynamic range | 110 dB | Analog inputs | 32 channel (1.25 MS/s) |
| Sampling rate | 102.4 kS/s maximum | Analog outputs | 2 channel (2.5 Ms/s) |
| Range | ±10 V | Range | ±100 mV to ±10 V |
| IEPE conditioning | Software configurable | Synchronization | Multiple-device |
| Synchronization | Multiple-device | ||
© 2020 by the authors. Licensee MDPI, Basel, Switzerland. This article is an open access article distributed under the terms and conditions of the Creative Commons Attribution (CC BY) license (http://creativecommons.org/licenses/by/4.0/).
Share and Cite
Luo, Y.; Han, Y.; Yuan, S.; Yuan, J. Research on the Single-Value Indicators for Centrifugal Pump Based on Vibration Signals. Sensors 2020, 20, 3283. https://doi.org/10.3390/s20113283
Luo Y, Han Y, Yuan S, Yuan J. Research on the Single-Value Indicators for Centrifugal Pump Based on Vibration Signals. Sensors. 2020; 20(11):3283. https://doi.org/10.3390/s20113283
Chicago/Turabian StyleLuo, Yin, Yuejiang Han, Shouqi Yuan, and Jianping Yuan. 2020. "Research on the Single-Value Indicators for Centrifugal Pump Based on Vibration Signals" Sensors 20, no. 11: 3283. https://doi.org/10.3390/s20113283
APA StyleLuo, Y., Han, Y., Yuan, S., & Yuan, J. (2020). Research on the Single-Value Indicators for Centrifugal Pump Based on Vibration Signals. Sensors, 20(11), 3283. https://doi.org/10.3390/s20113283