In-Ear Pulse Rate Measurement: A Valid Alternative to Heart Rate Derived from Electrocardiography?


Abstract
1. Introduction
2. Materials and Methods
2.1. Participants
2.2. Instruments
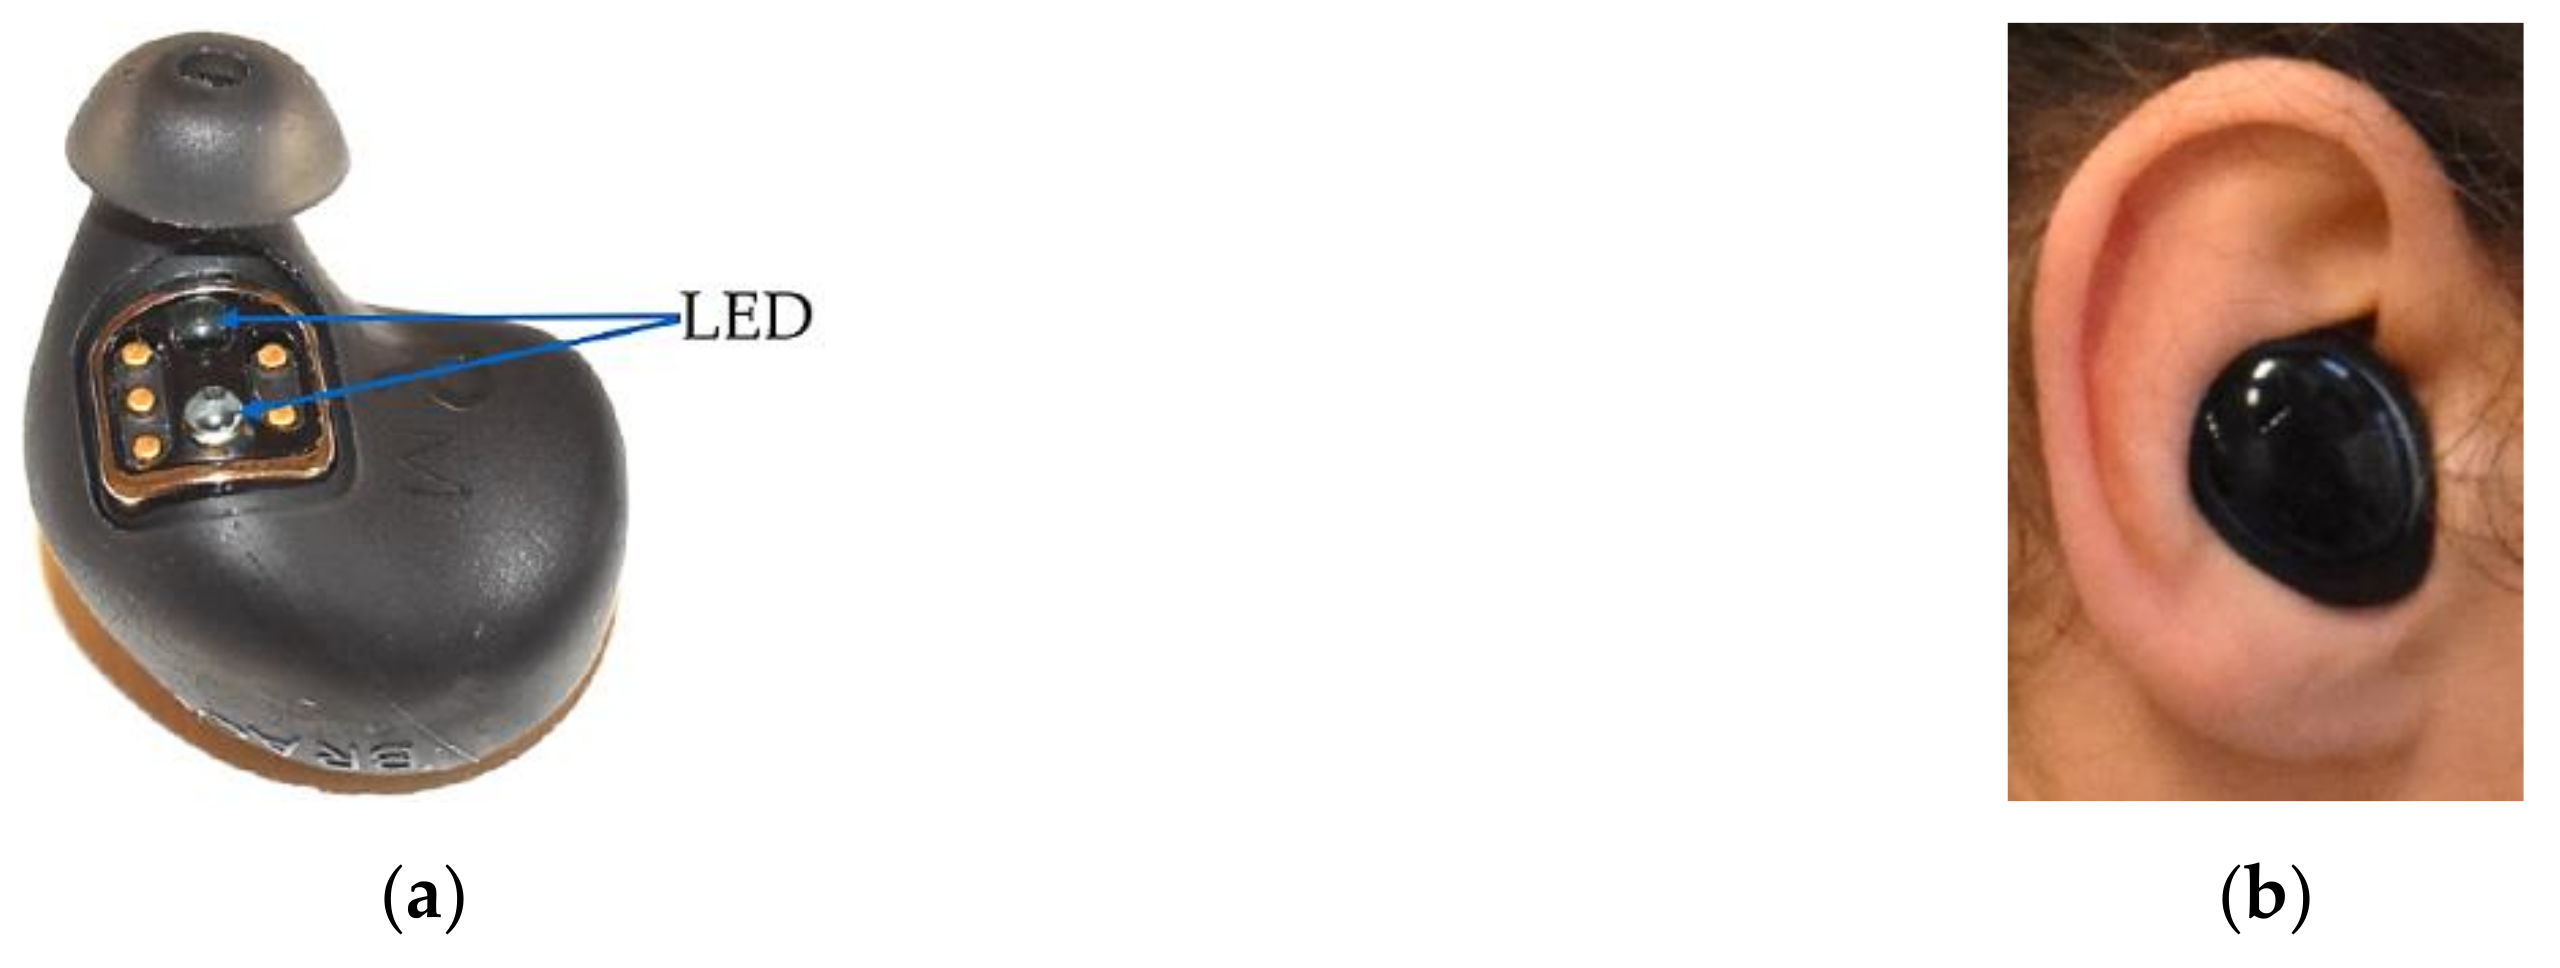
2.2.1. The Dash Pro
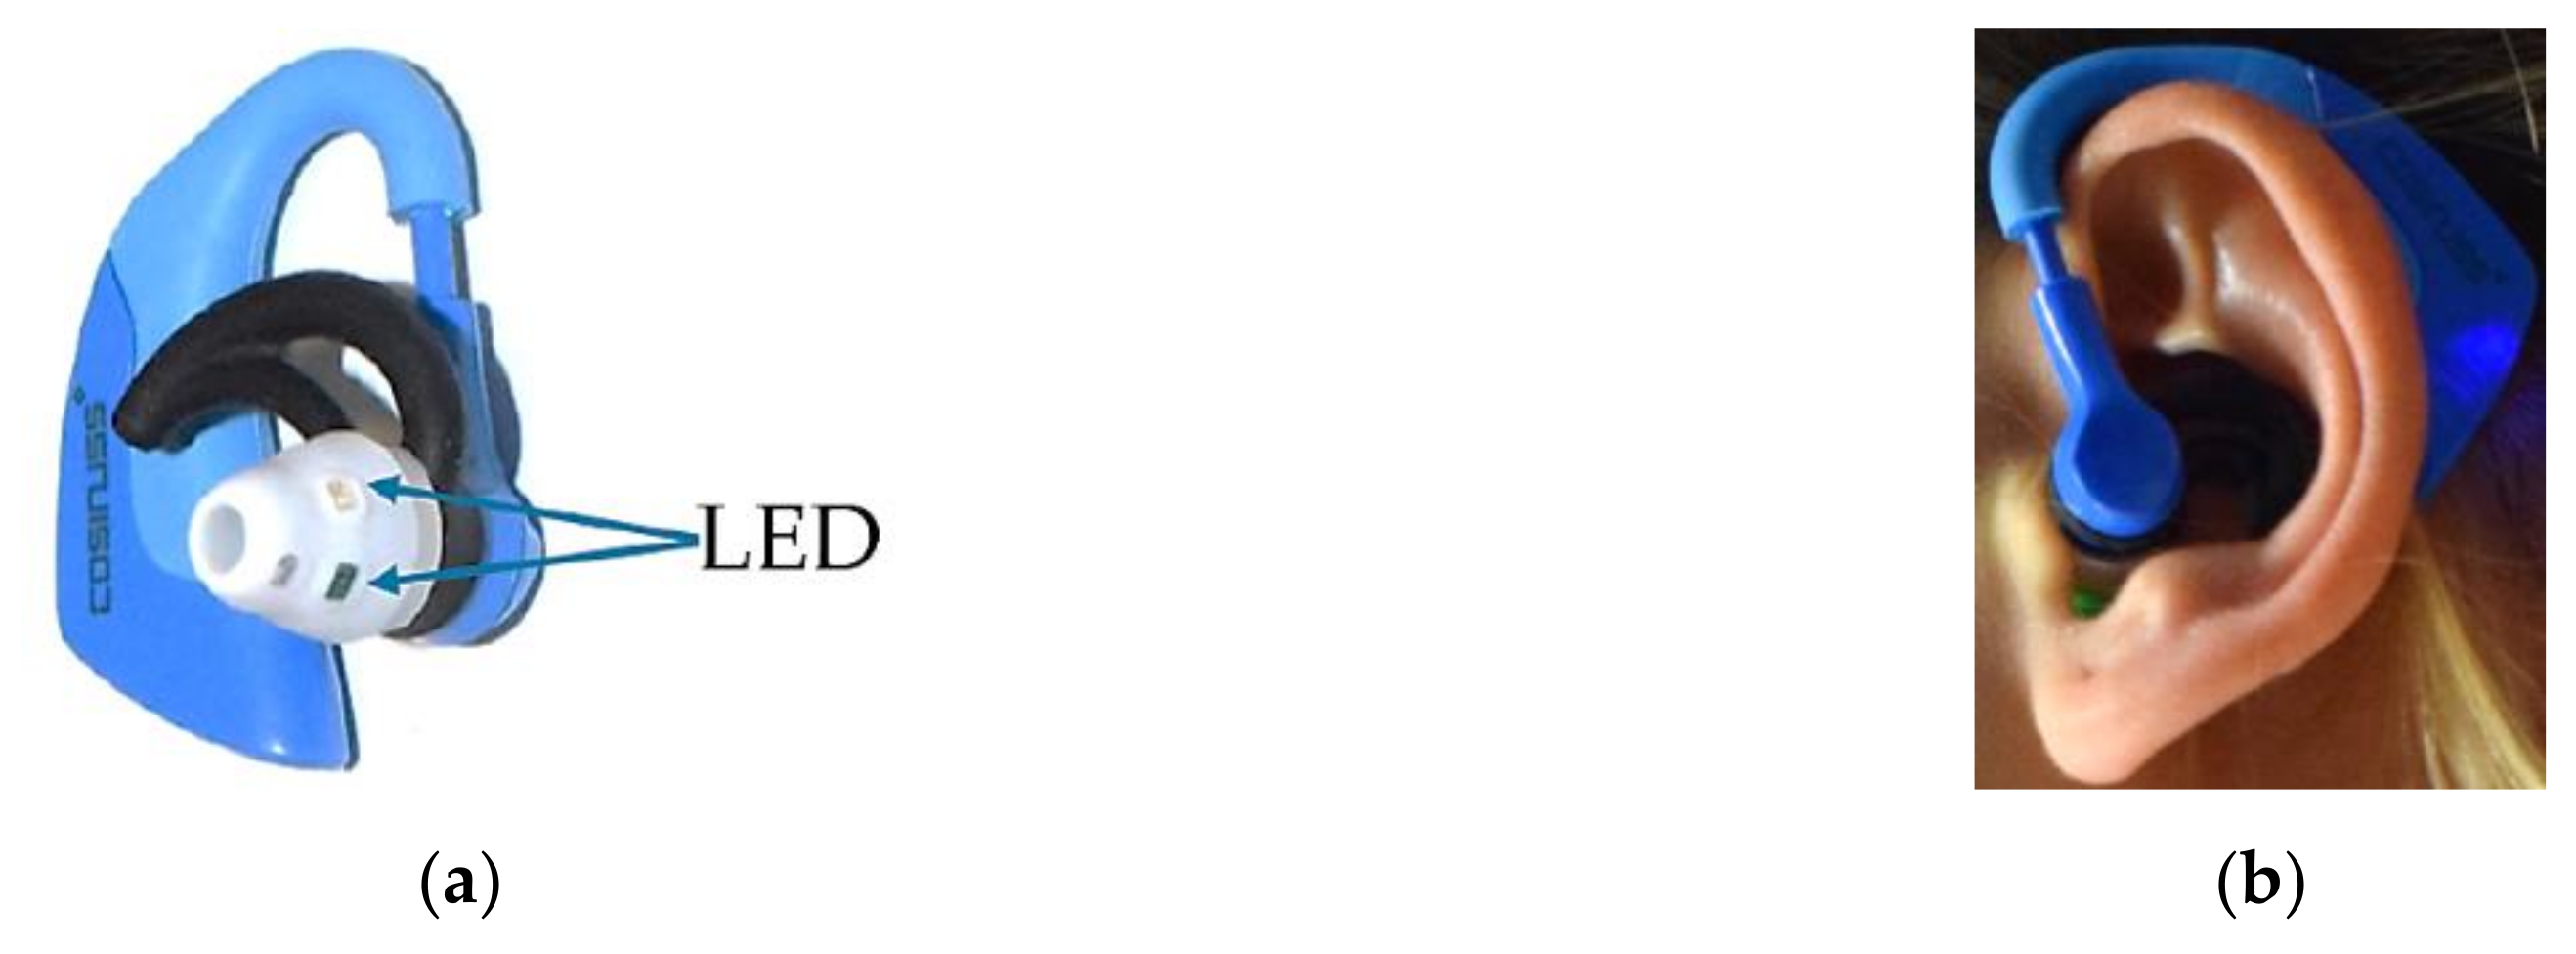
2.2.2. Cosinuss°One
2.2.3. Criterion Measure ECG—Bodyguard 2
2.3. Experimental Protocol
2.4. Data Analysis
3. Results
3.1. Preliminary Analysis
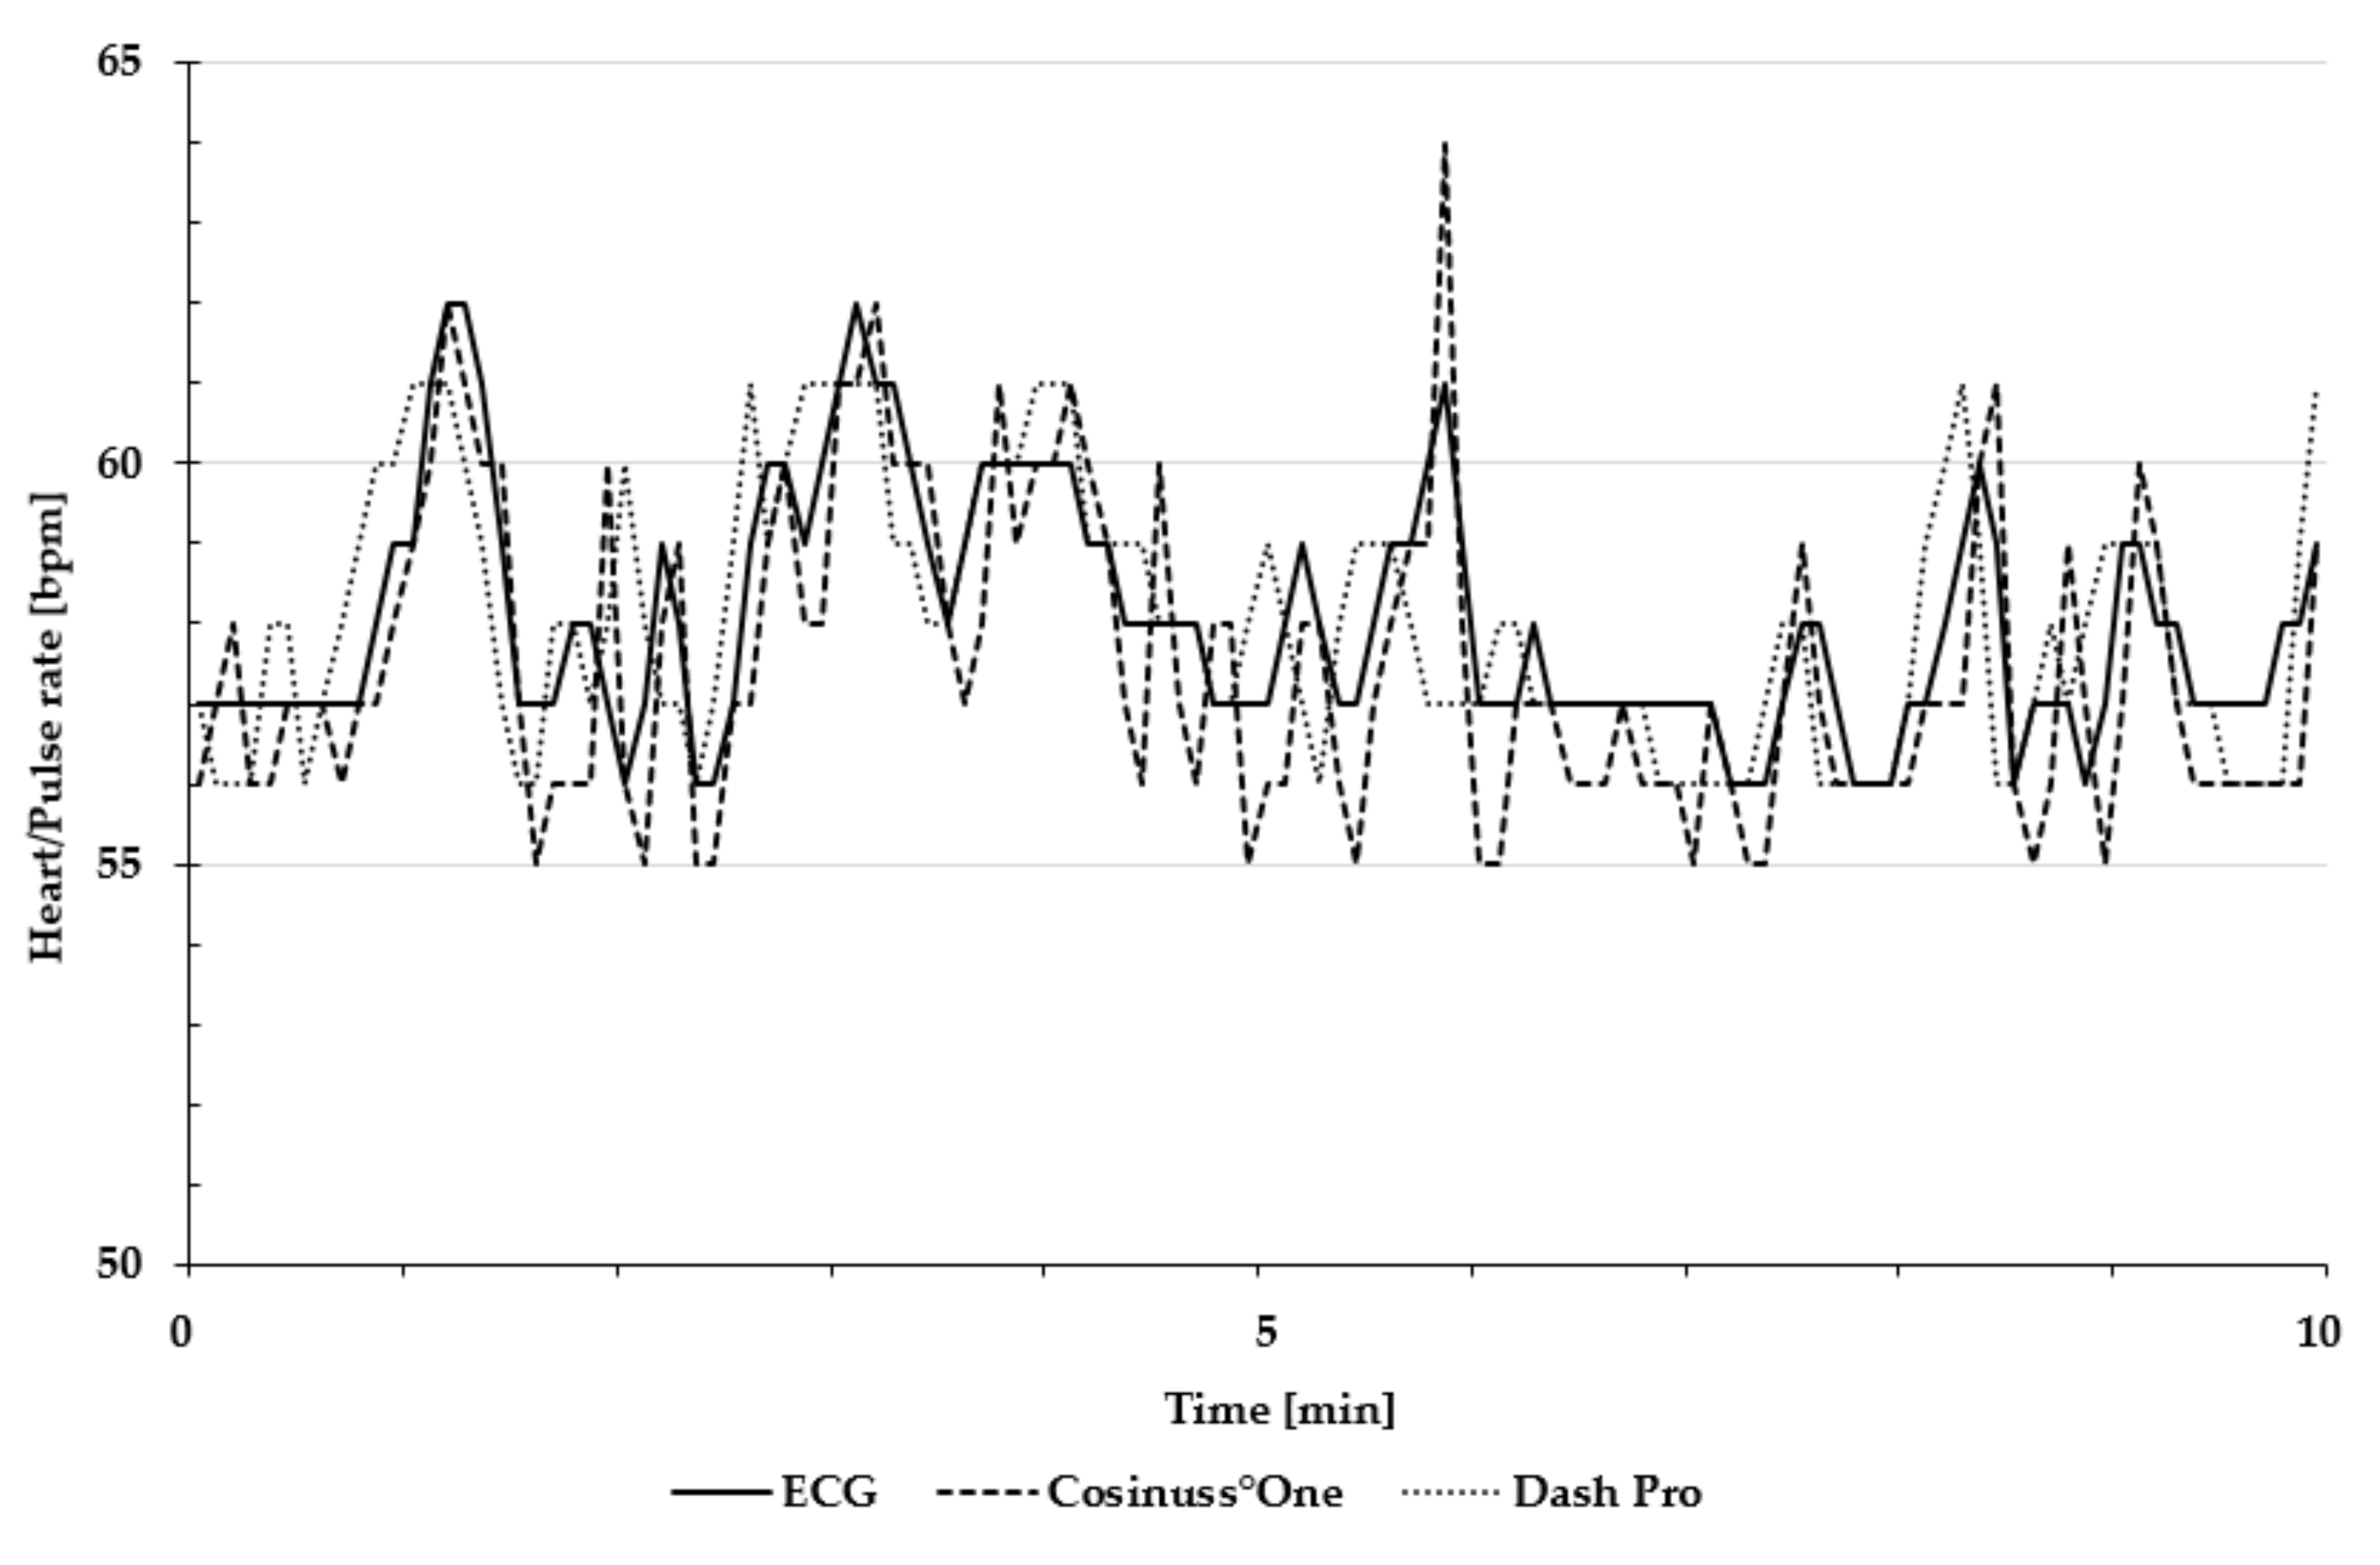
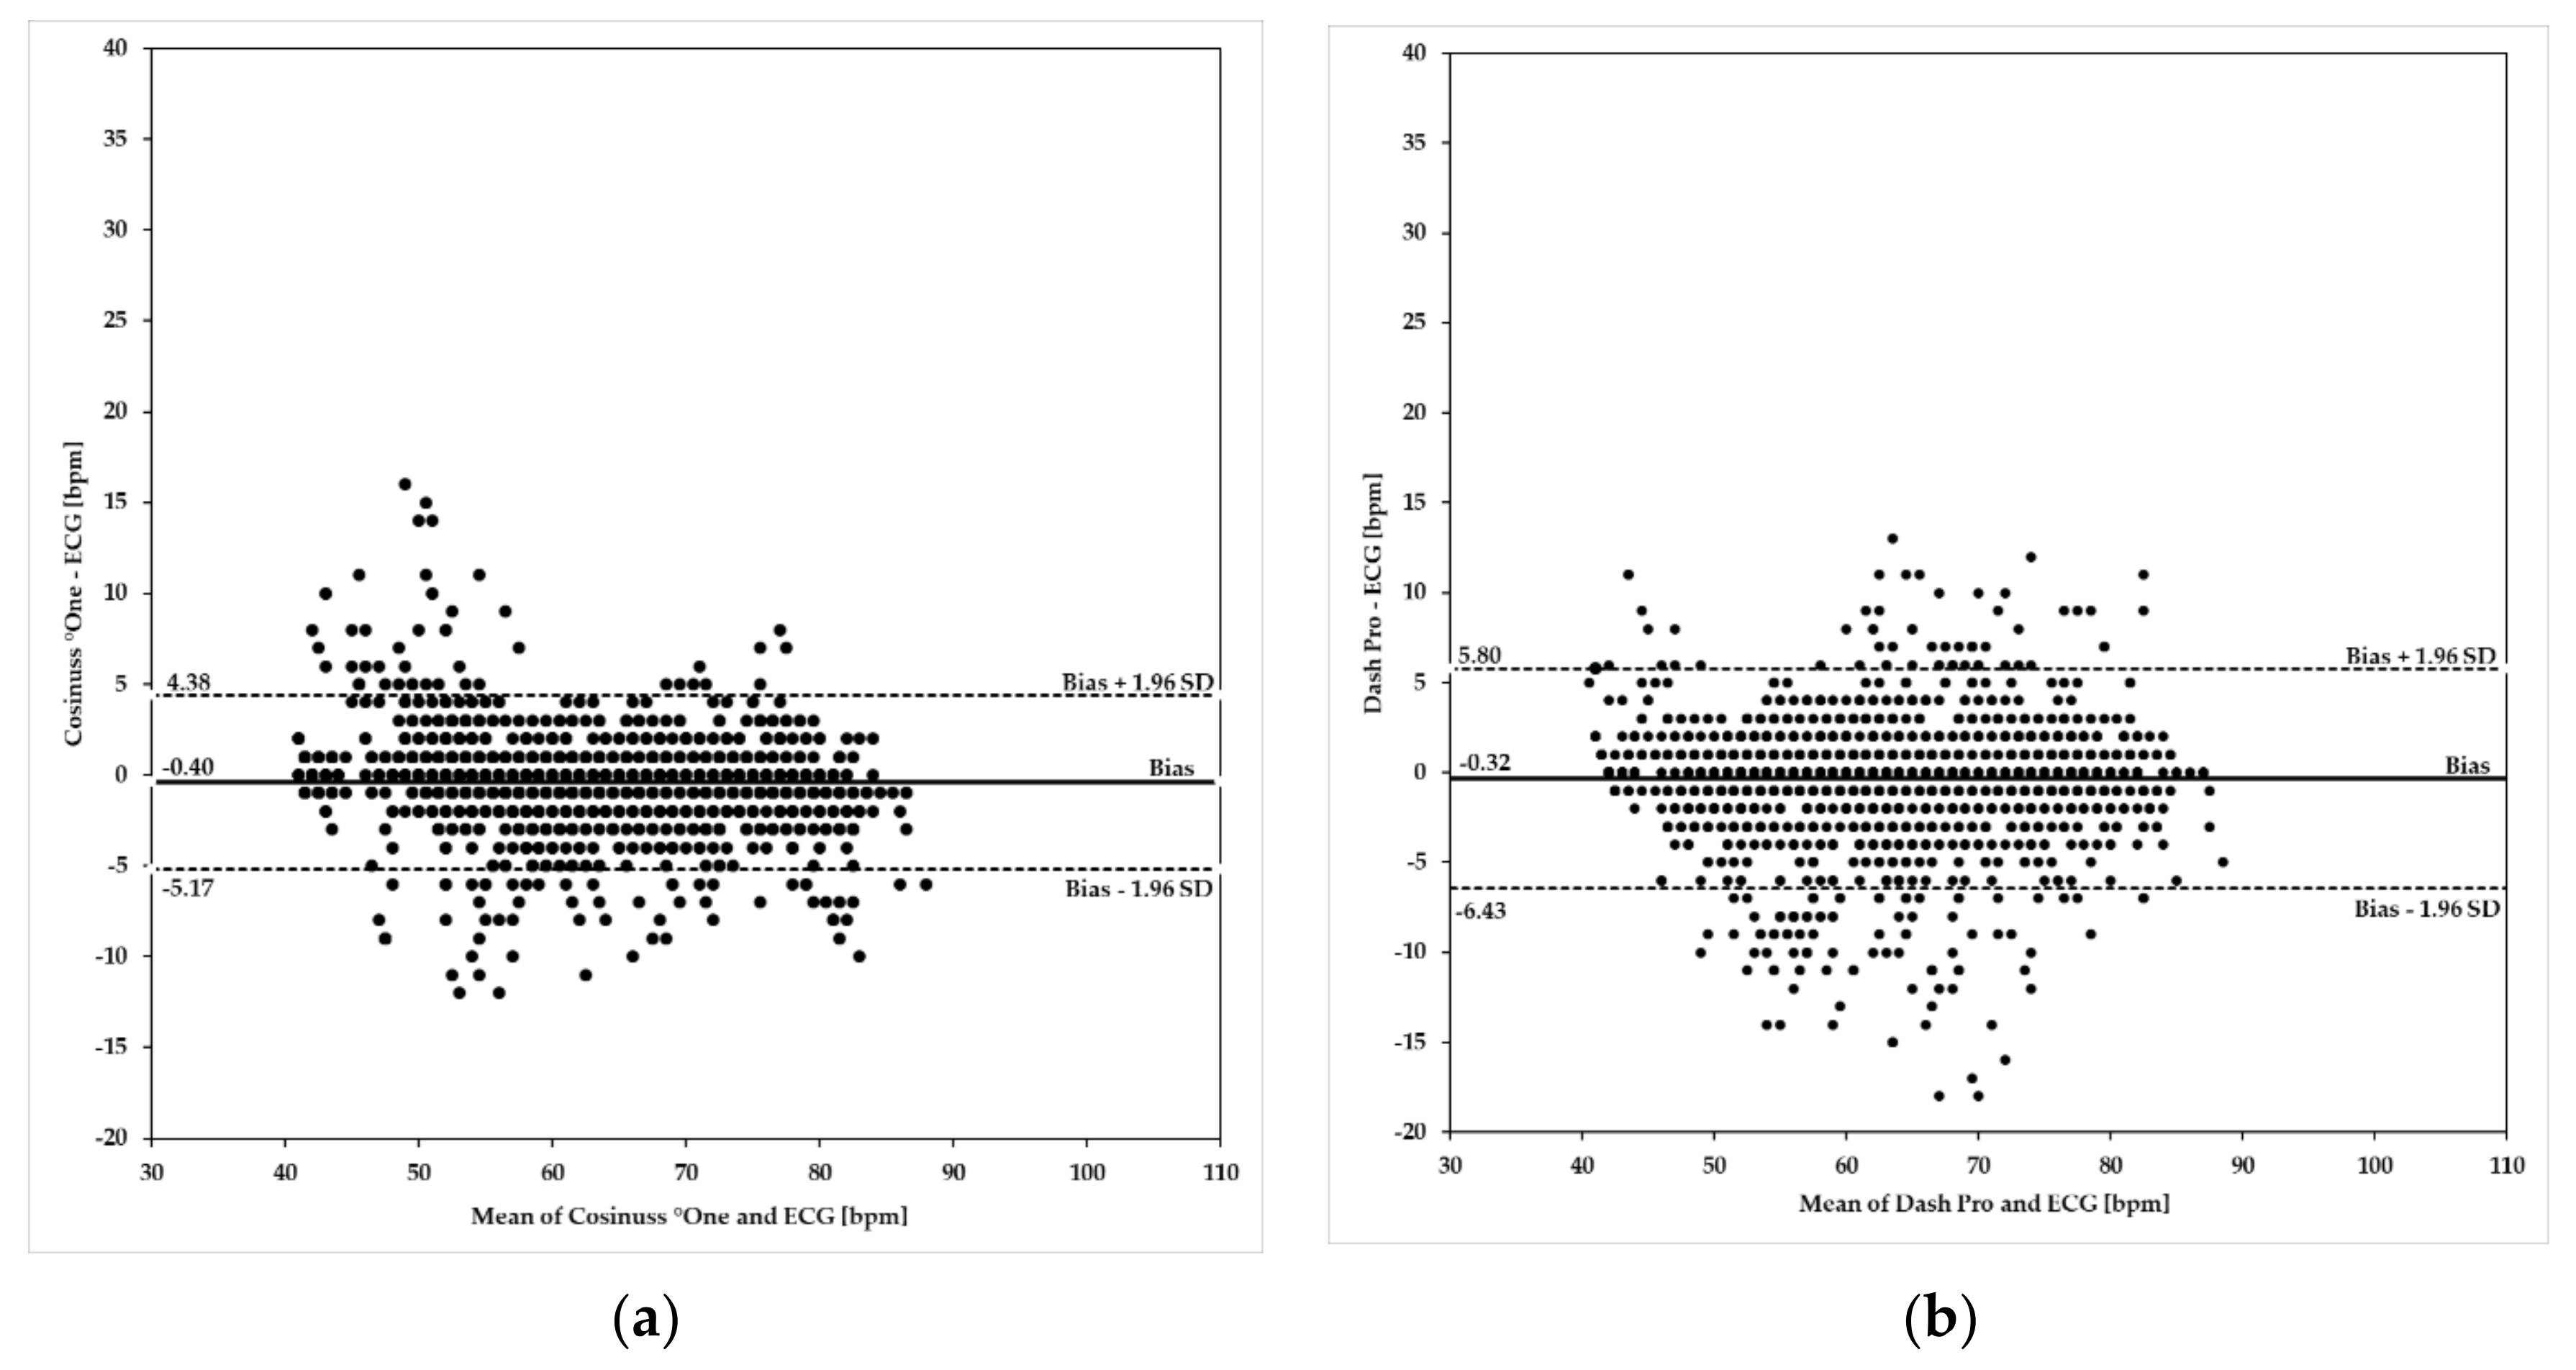
3.2. Resting Heart/Pulse Rate and Heart/Pulse Rate ≤90 bpm
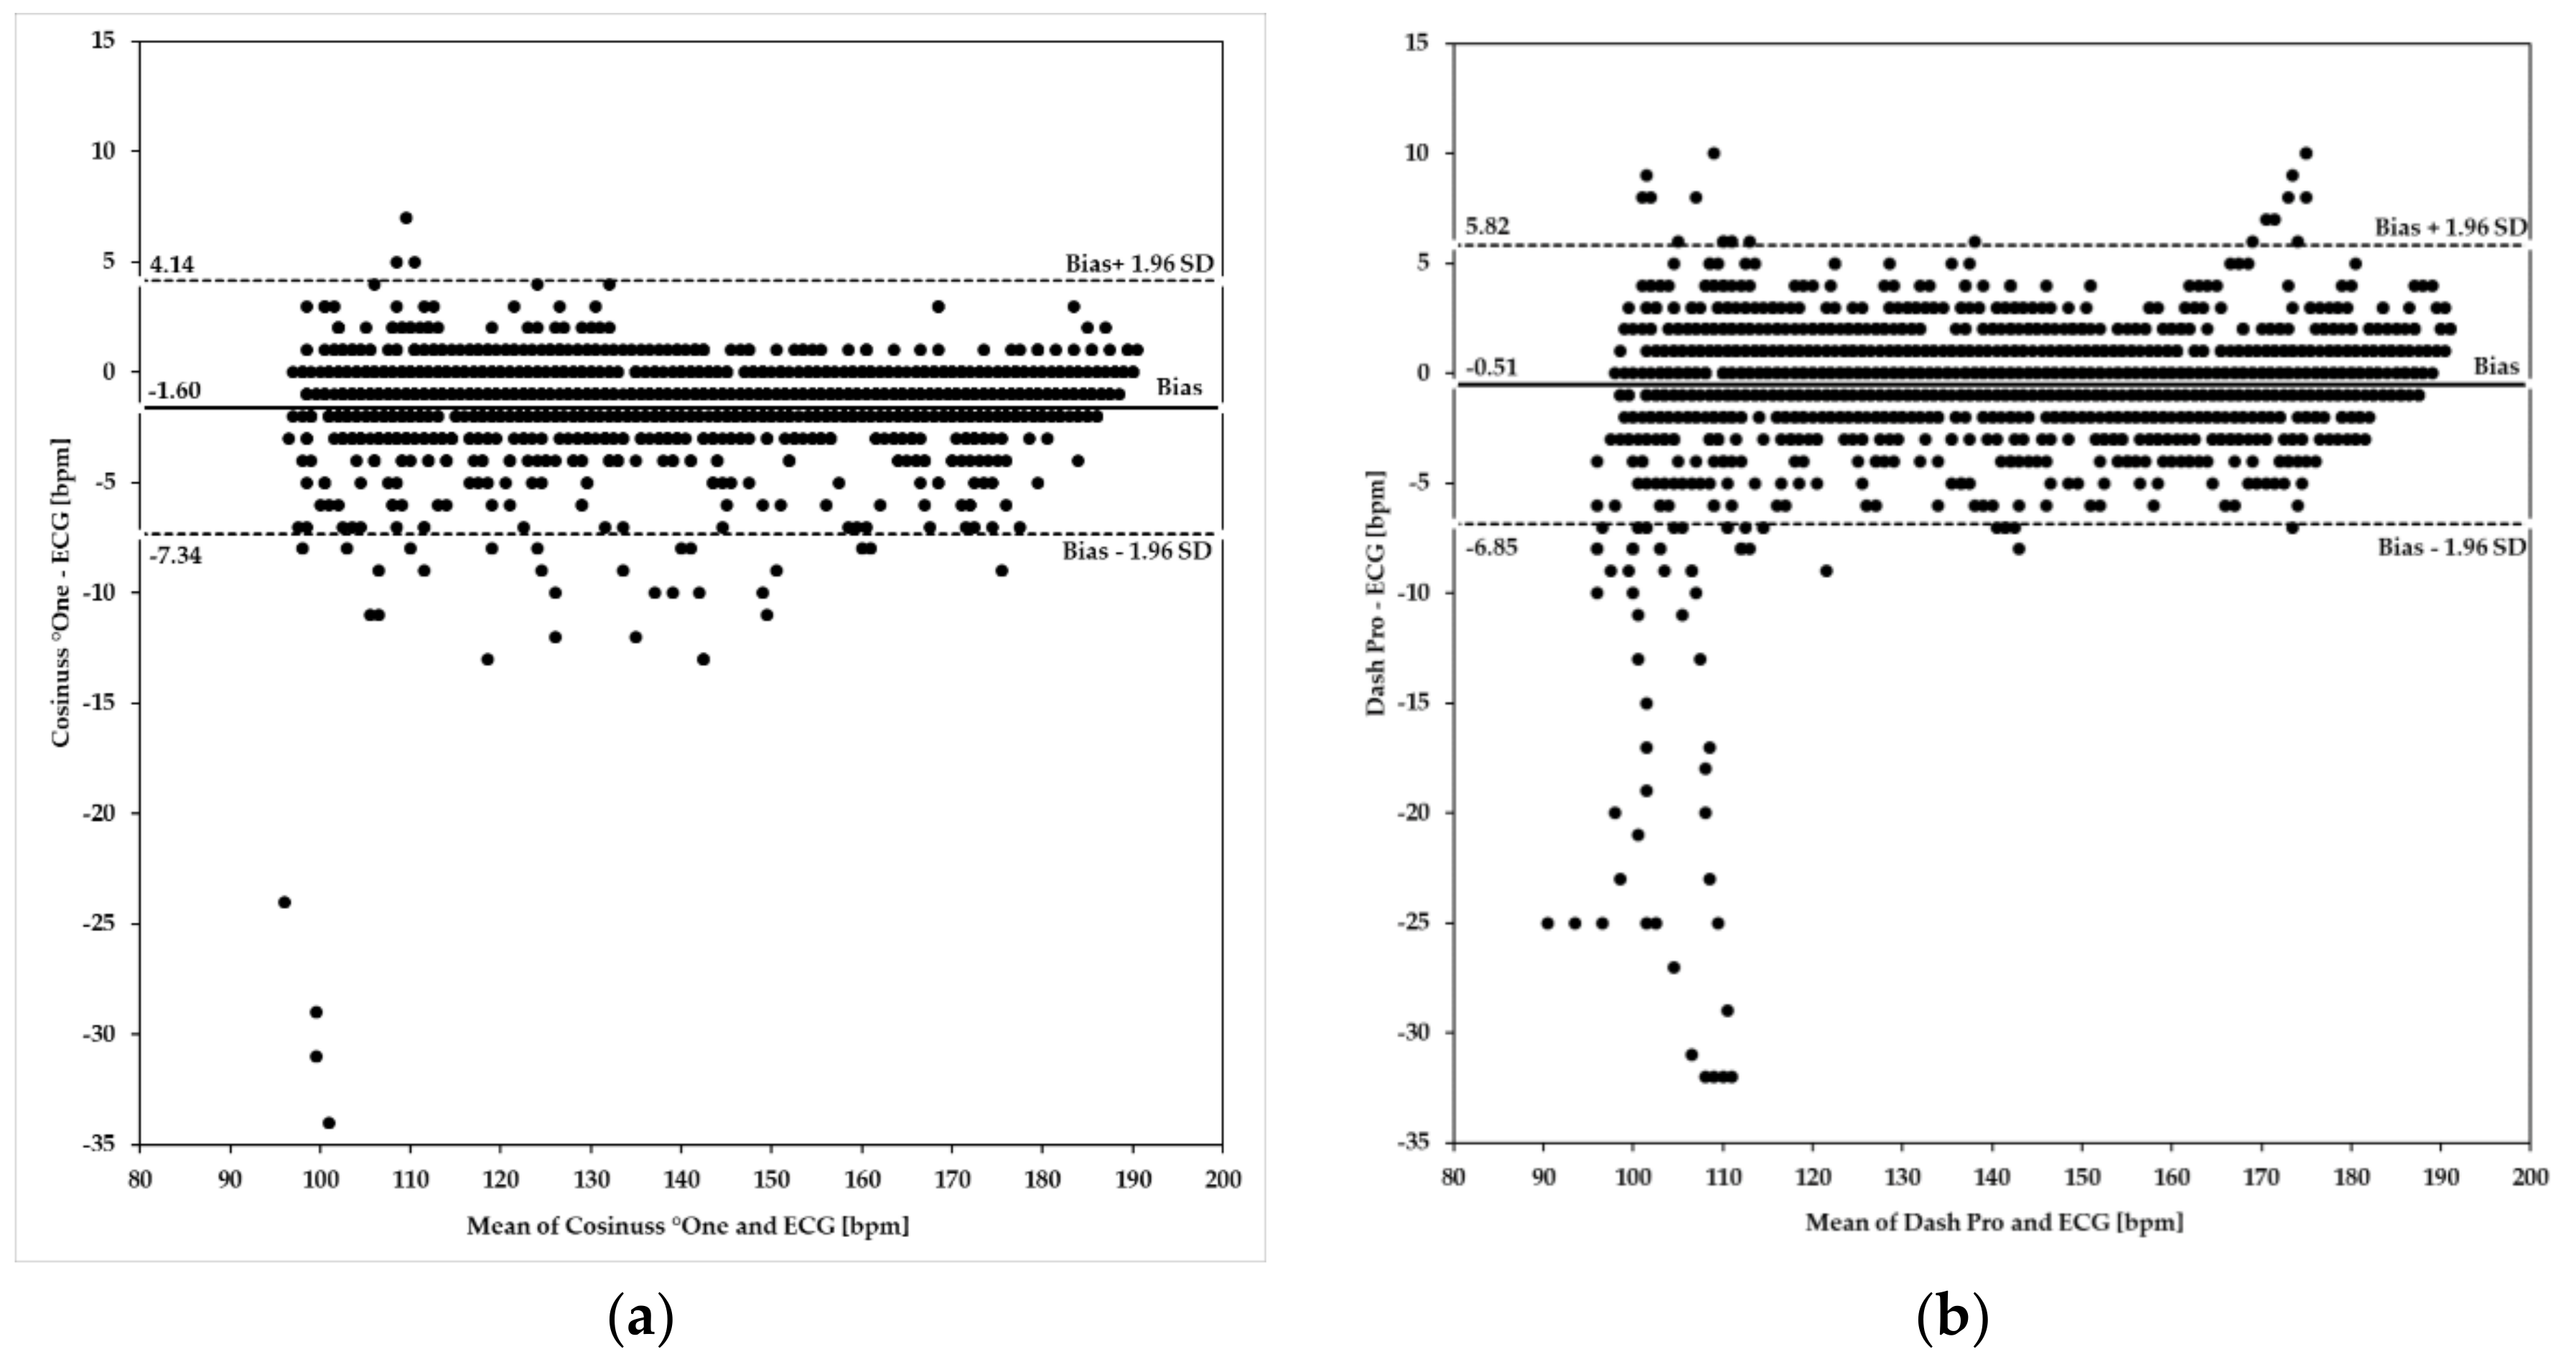
3.3. Heart/Pulse Rate ≥100 bpm
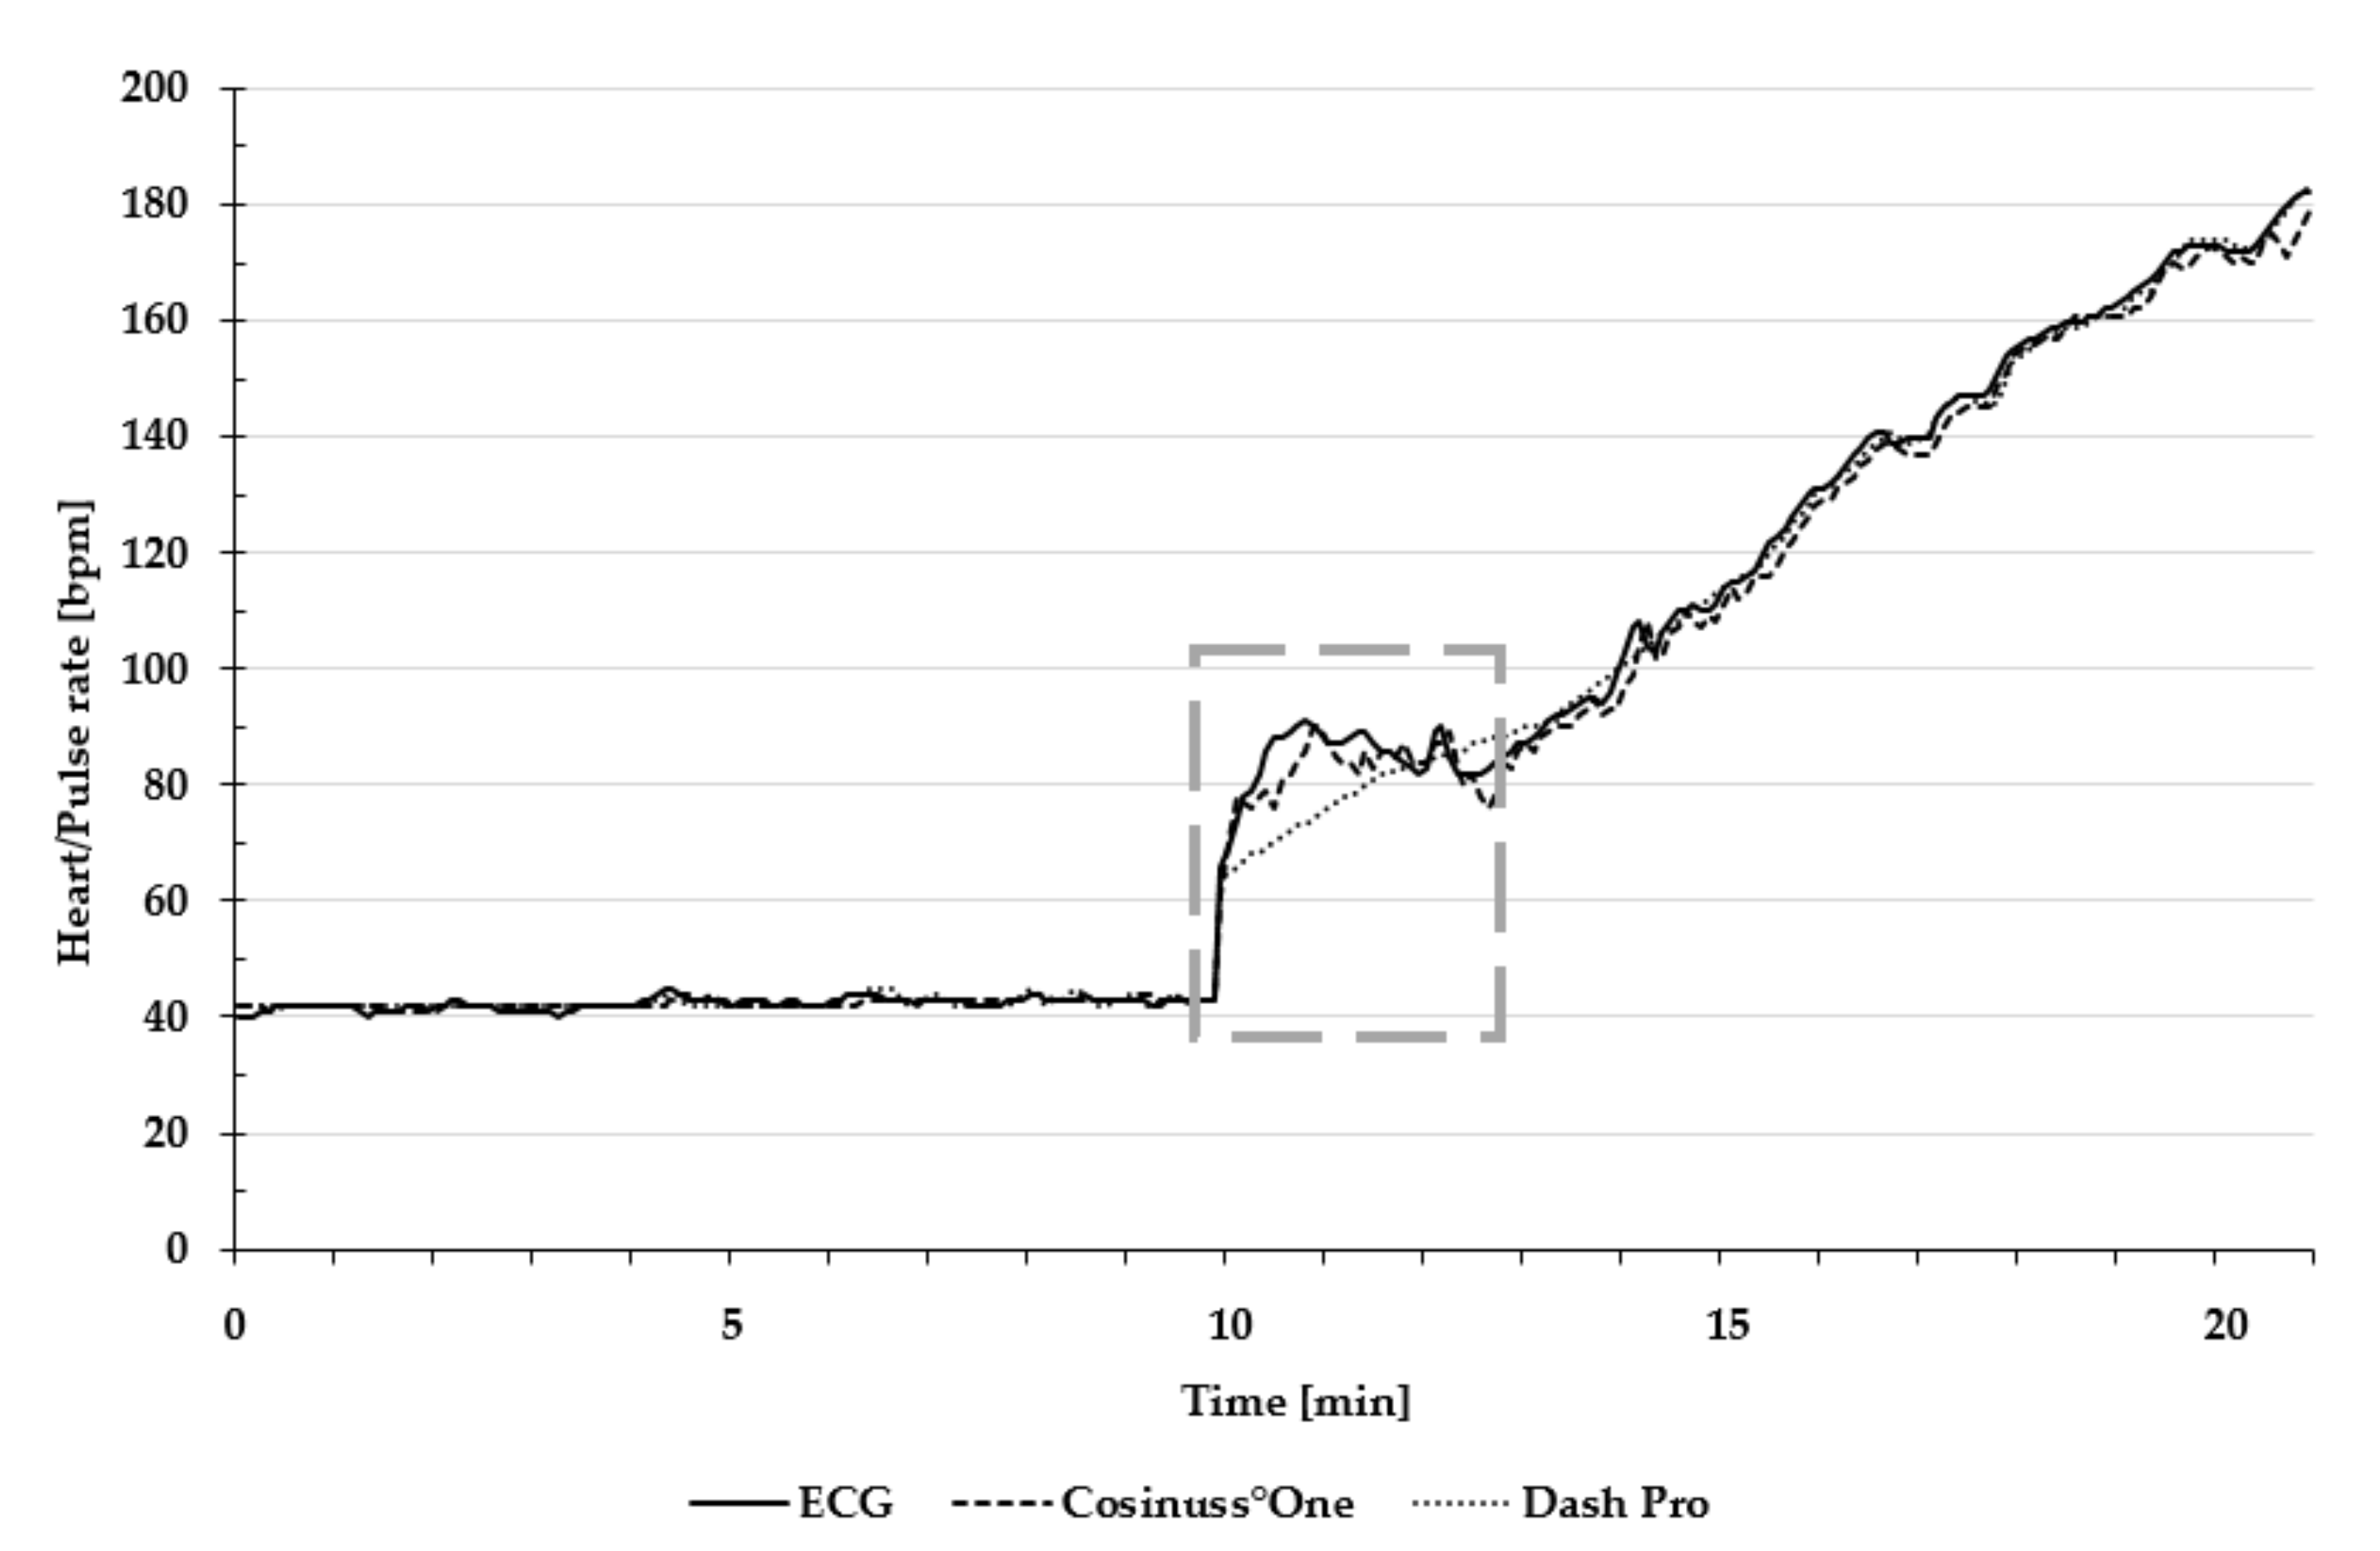
3.4. Maximum Heart/Pulse Rate
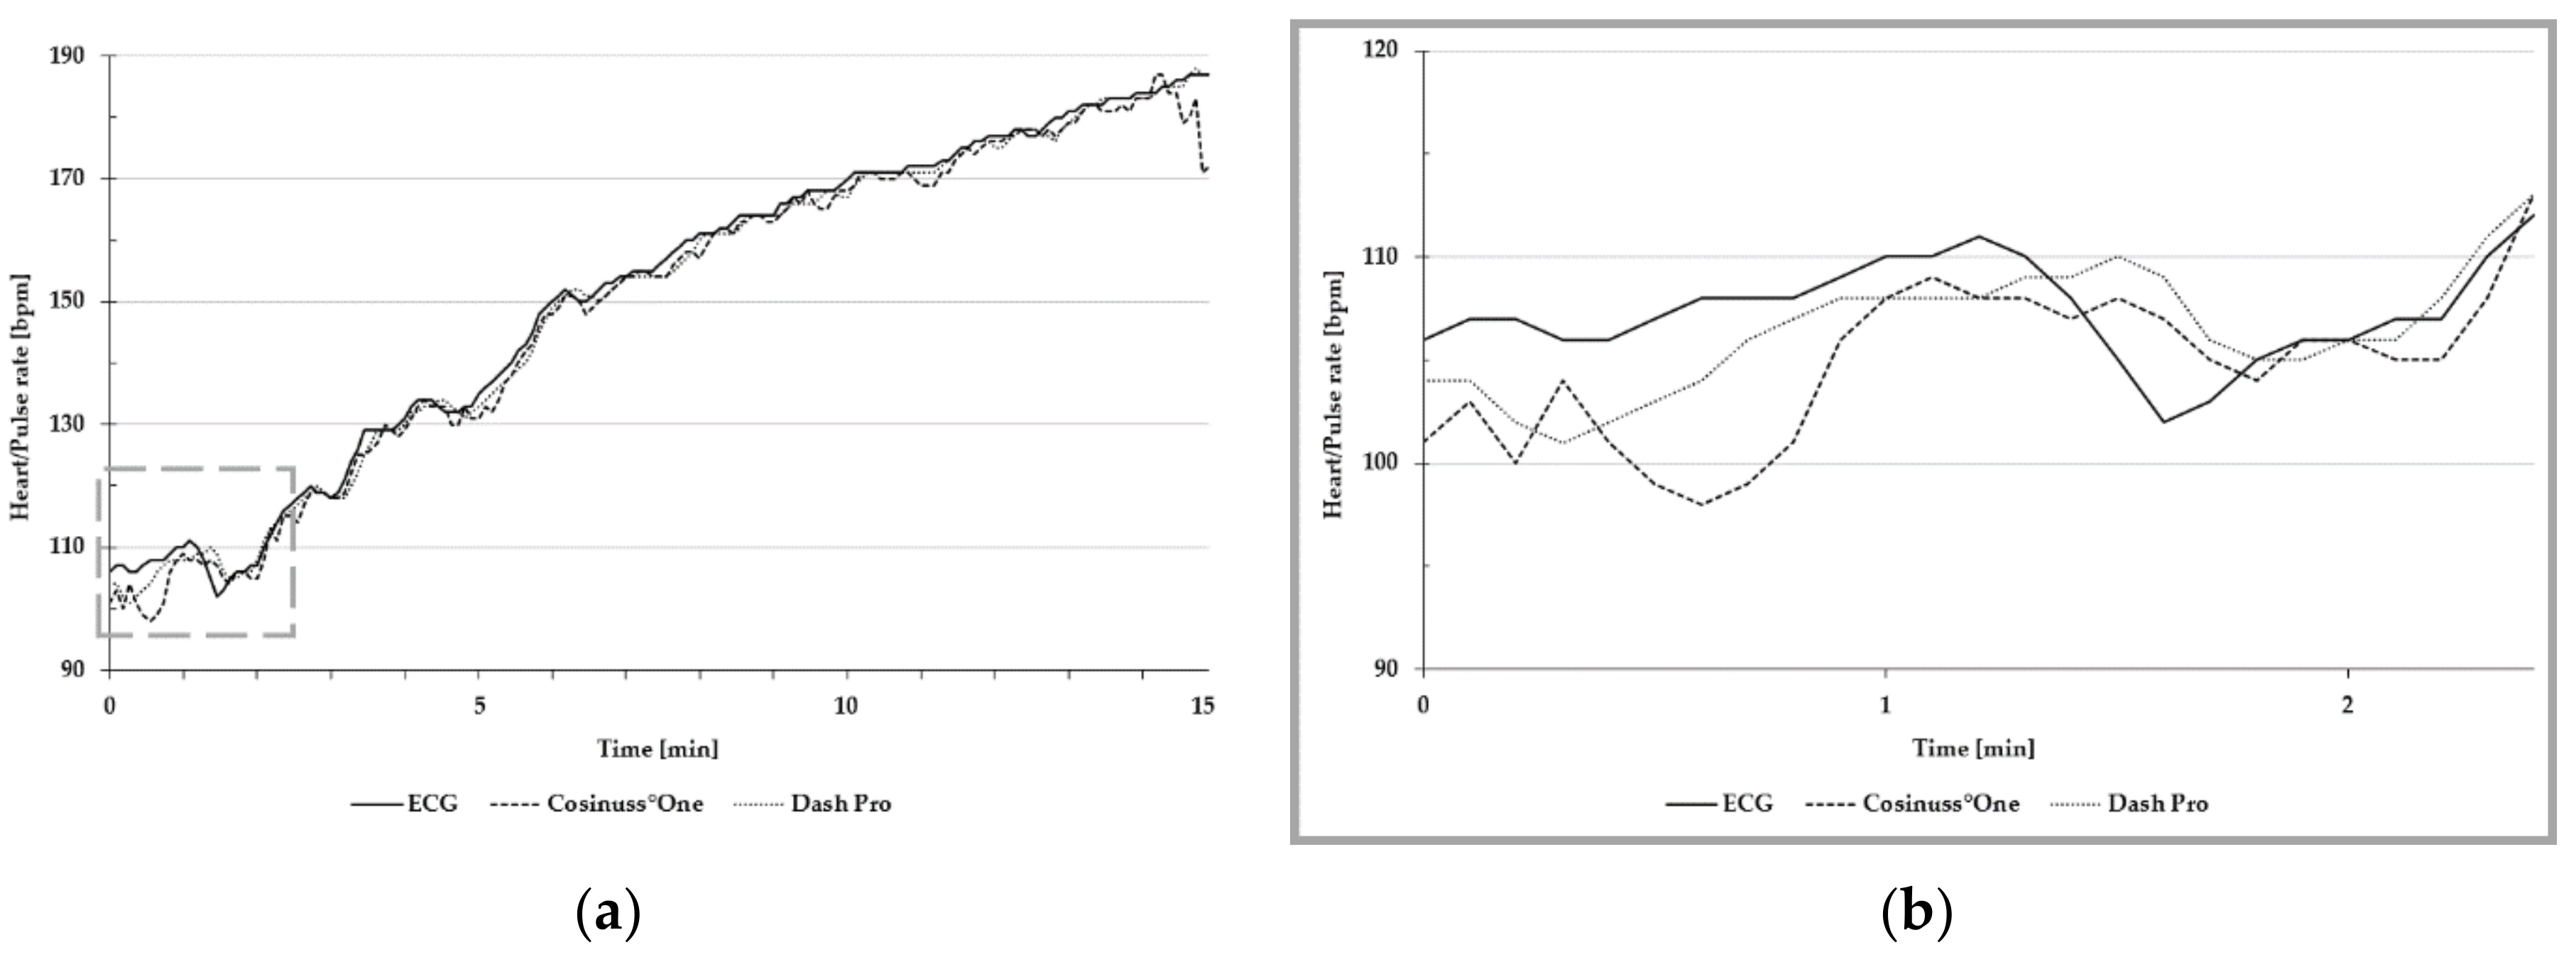
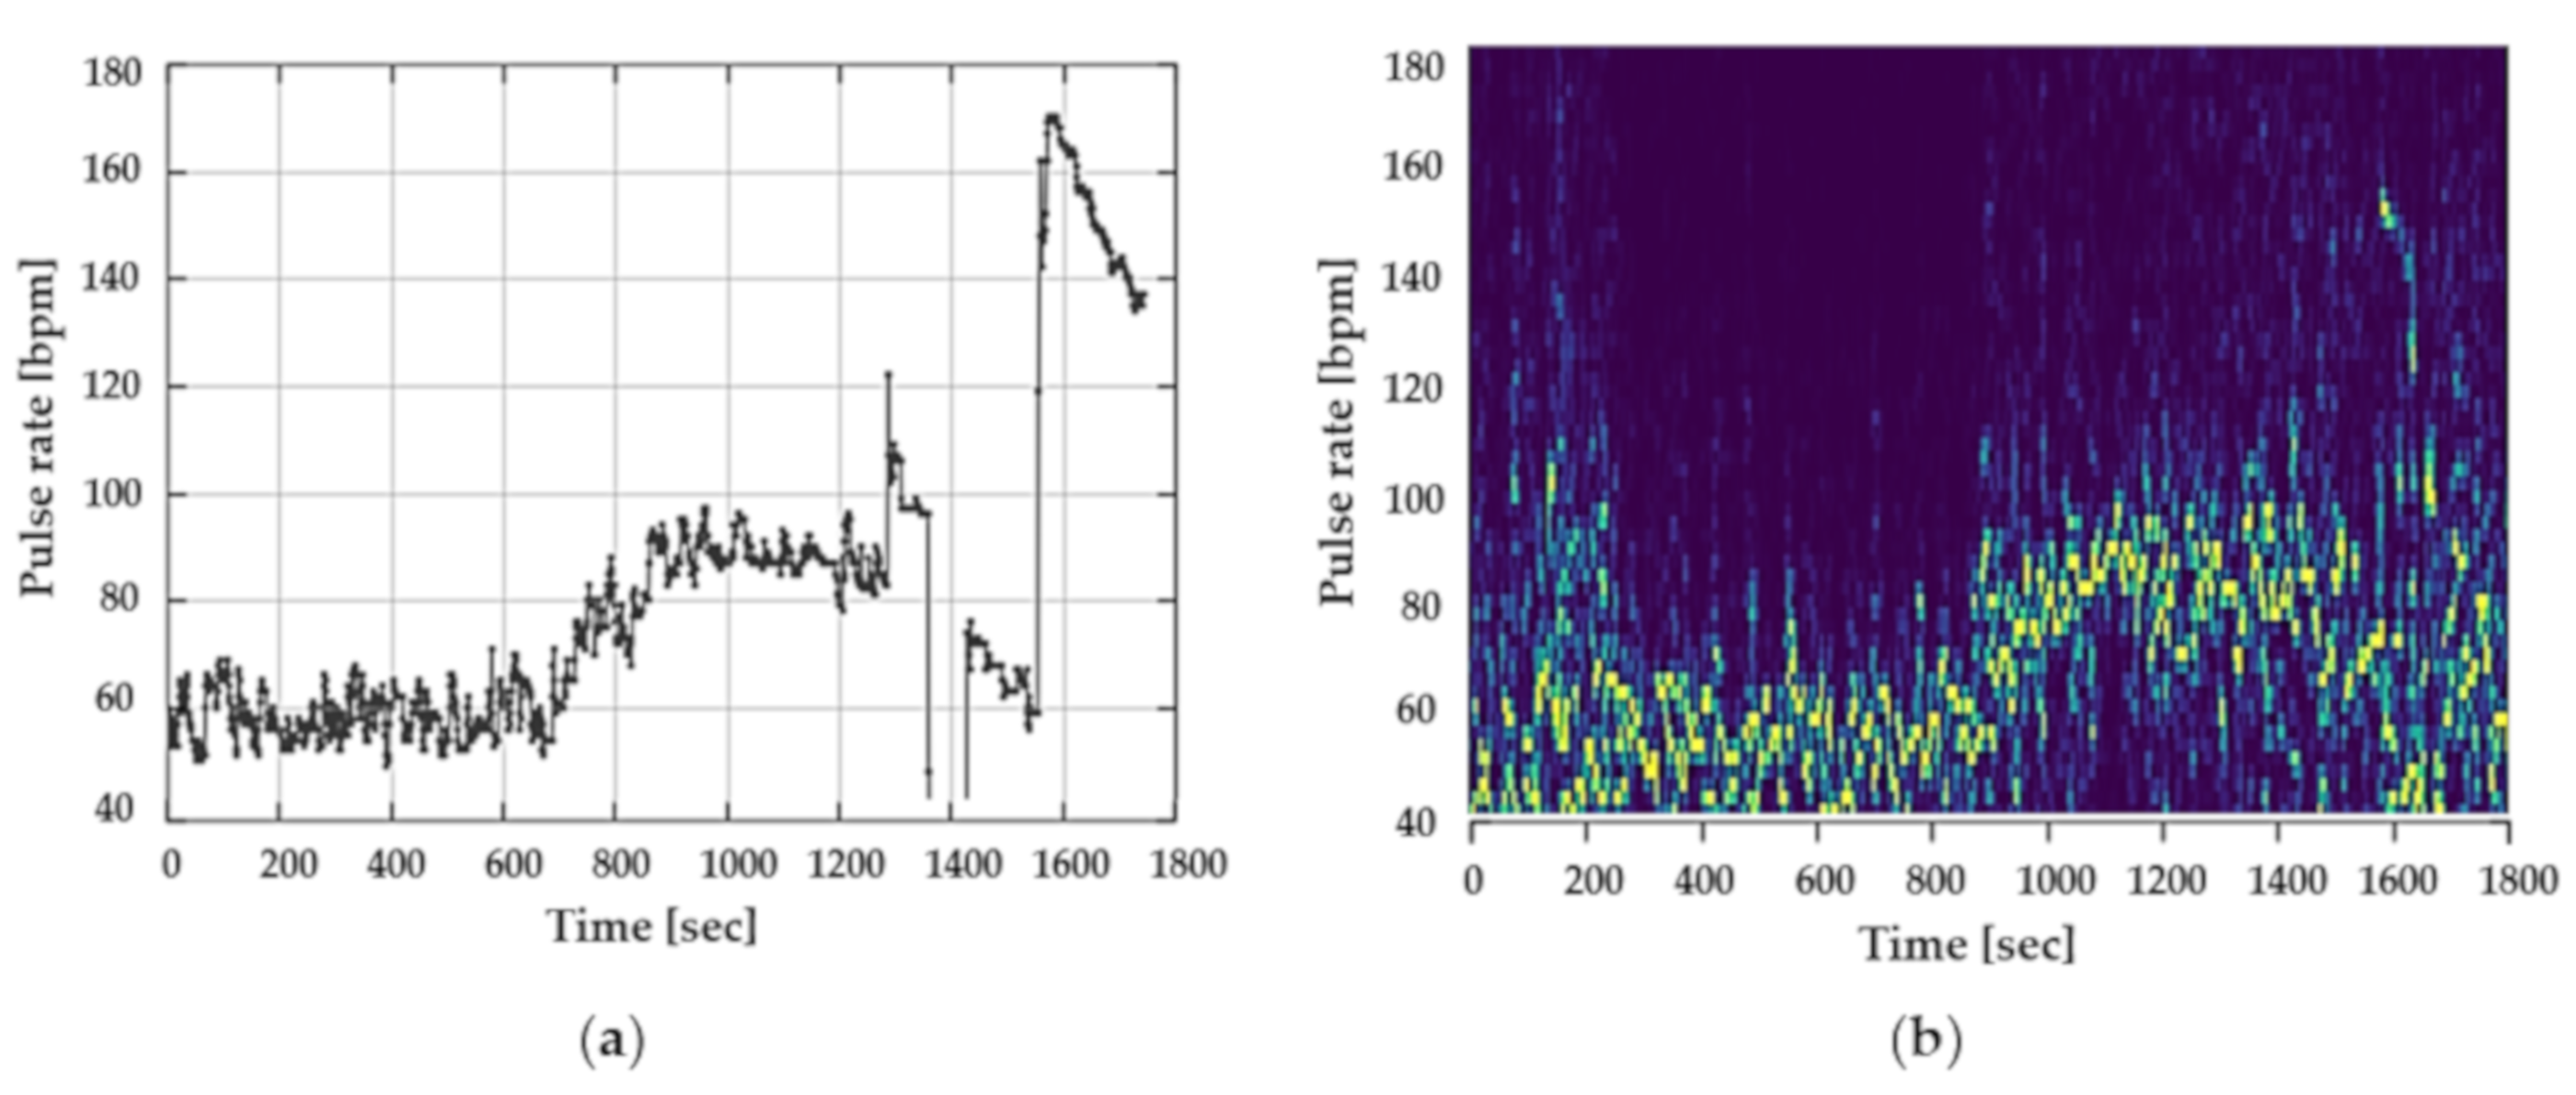
3.5. Motion Artefacts
4. Discussion
5. Conclusions
Author Contributions
Funding
Conflicts of Interest
References
- Achten, J.; Jeukendrup, A.E. Heart rate monitoring: Applications and limitations. Sports Med. 2003, 33, 517–538. [Google Scholar] [CrossRef]
- Hertzman, A.B. The blood supply of various skin areas as estimated by the photoelectric plethysmograph. Am. J. Physiol. Content 1938, 124, 328–340. [Google Scholar] [CrossRef]
- Sanders, J.; Wark, P.; Winfree, K.; Fallahzadeh, R.; Fernández, C.; Henriksen, A.; Mikalsen, M.H.; Woldaregay, A.Z.; Muzny, M.; Hartvigsen, G.; et al. Using Fitness Trackers and Smartwatches to Measure Physical Activity in Research: Analysis of Consumer Wrist-Worn Wearables. J. Med. Internet Res. 2018, 20, e110. [Google Scholar]
- Tamura, T. Current progress of photoplethysmography and SPO2 for health monitoring. Biomed. Eng. Lett. 2019, 9, 21–36. [Google Scholar] [CrossRef] [PubMed]
- Jung, J.Y.; Lee, L.W. Zigbee device access control and reliable data transmission in Zigbee based health monitoring. In Proceedings of the 2008 10th International Conference on Advanced Communication Technology, Gangwon-Do, Korea, 17–20 February 2008; pp. 795–797. [Google Scholar]
- Lee, Y.K.; Jo, J.; Shin, H.S. Development and Evaluation of a Wristwatch-Type Photoplethysmography Array Sensor Module. IEEE Sens. J. 2013, 13, 1459–1463. [Google Scholar] [CrossRef]
- Cadmus-Bertram, L.; Gangnon, R.; Wirkus, E.J.; Thraen-Borowski, K.M.; Gorzelitz-Liebhauser, J. The Accuracy of Heart Rate Monitoring by Some Wrist-Worn Activity Trackers. Ann. Intern. Med. 2017, 166, 610–612. [Google Scholar] [CrossRef] [PubMed]
- Maeda, Y.; Sekine, M.; Tamura, T. Relationship between measurement site and motion artifacts in wearable reflected photoplethysmography. J. Med. Syst. 2011, 35, 969–976. [Google Scholar] [CrossRef]
- Maeda, Y.; Sekine, M.; Tamura, T. The Advantages of Wearable Green Reflected Photoplethysmography. J. Med. Syst. 2011, 35, 829–834. [Google Scholar] [CrossRef]
- Maguire, M.; Ward, T. The Design and Clinical Use of a Reflective Brachial Photoplethysmograph; Maynooth University: Kildare, Ireland, 2002. [Google Scholar]
- Rhee, S.; Yang, B.-H.; Asada, H. Artifact-resistant power-efficient design of finger-ring plethysmographic sensors. IEEE Trans. Biomed. Eng. 2001, 48, 795–805. [Google Scholar] [CrossRef] [PubMed]
- Kyriacou, P.A.; Moye, A.R.; Gregg, A.; Choi, D.M.A.; Langford, R.M.; Jones, D.P.; Kyriacou, P. A system for investigating oesophageal photoplethysmographic signals in anaesthetised patients. Med. Biol. Eng. 1999, 37, 639–643. [Google Scholar] [CrossRef]
- Mendelson, Y.; Pujary, C. Measurement site and photodetector size considerations in optimizing power consumption of a wearable reflectance pulse oximeter. In Proceedings of the 25th Annual International Conference of the IEEE Engineering in Medicine and Biology Society, Cancún, Mexico, 17–21 September 2003; pp. 3016–3019. [Google Scholar]
- Dassel, A.C.M.; Graaff, R.; Sikkema, M.; Meijer, A.; Zijlstra, W.G.; Aarnoudse, J.G. Reflectance pulse oximetry at the forehead improves by pressure on the probe. J. Clin. Monit. 1995, 11, 237–244. [Google Scholar] [CrossRef] [PubMed]
- Poh, M.-Z.; Swenson, N.C.; Picard, R.W. Motion-tolerant magnetic earring sensor and wireless earpiece for wearable photoplethysmography. IEEE Trans. Inf. Technol. Biomed. 2010, 14, 786–794. [Google Scholar] [CrossRef] [PubMed]
- Budidha, K.; Kyriacou, P.A. The human ear canal: Investigation of its suitability for monitoring photoplethysmographs and arterial oxygen saturation. Physiol. Meas. 2014, 35, 111–128. [Google Scholar] [CrossRef] [PubMed]
- Poh, M.-Z.; Kim, K.; Goessling, A.; Swenson, N.; Picard, R. Cardiovascular Monitoring Using Earphones and a Mobile Device. IEEE Pervasive Comput. 2012, 11, 18–26. [Google Scholar] [CrossRef]
- Patterson, J.A.C.; McIlwraith, D.C.; Yang, G.-Z. A Flexible, Low Noise Reflective PPG Sensor Platform for Ear-Worn Heart Rate Monitoring. In Proceedings of the 2009 Sixth International Workshop on Wearable and Implantable Body Sensor Networks, Berkeley, CA, USA, 3–5 June 2009; pp. 286–291. [Google Scholar]
- Wang, C.-Z.; Zheng, Y.-P. Home-Telecare of the Elderly Living Alone Using an New Designed Ear-wearable Sensor. In Proceedings of the 5th International Workshop on Wearable and Implantable Body Sensor Networks, Hong Kong, China, 1–3 June 2008; pp. 71–74. [Google Scholar]
- Wang, L.; Lo, B.P.L.; Yang, G.-Z. Multichannel Reflective PPG Earpiece Sensor with Passive Motion Cancellation. IEEE Trans. Biomed. Circuits Syst. 2007, 1, 235–241. [Google Scholar] [CrossRef] [PubMed]
- Vogel, S.; Hülsbusch, M.; Hennig, T.; Blazek, V.; Leonhardt, S. In-ear vital signs monitoring using a novel microoptic reflective sensor. IEEE Trans. Inf. Technol. Biomed. 2009, 13, 882–889. [Google Scholar] [CrossRef] [PubMed]
- Goverdovsky, V.; Von Rosenberg, W.C.; Nakamura, T.; Looney, D.; Sharp, D.J.; Papavassiliou, C.; Morrell, M.J.; Mandic, D.P. Hearables: Multimodal physiological in-ear sensing. Sci. Rep. 2017, 7, 6948. [Google Scholar] [CrossRef] [PubMed]
- Tigges, T.; Büchler, T.; Pielmuş, A.; Klum, M.; Feldheiser, A.; Hunsicker, O.; Orglmeister, R. Assessment of In-ear Photoplethysmography as a Surrogate for Electrocardiography in Heart Rate Variability Analysis. In World Congress on Medical Physics and Biomedical Engineering 2018; Lhotska, L., Sukupova, L., Lacković, I., Ibbott, G.S., Eds.; Springer: Singapore, 2019; pp. 293–297. [Google Scholar]
- Shin, K.; Kim, Y.; Bae, S.; Park, K.; Kim, S. A Novel Headset with a Transmissive PPG Sensor for Heart Rate Measurement. In Proceedings of the 13th International Conference on Biomedical Engineering, Singapore, 3–6 December 2008; Lim, C.T., Goh, J.C.H., Eds.; Springer: Berlin/Heidelberg, Germany, 2009; pp. 519–522. [Google Scholar]
- Agashe, G.S.; Coakley, J.; Mannheimer, P.D. Forehead pulse oximetry: Headband use helps alleviate false low readings likely related to venous pulsation artifact. Anesthesiology 2006, 105, 1111–1116. [Google Scholar] [CrossRef]
- Mendelson, Y.; Ochs, B.D. Noninvasive pulse oximetry utilizing skin reflectance photoplethysmography. IEEE Trans. Biomed. Eng. 1988, 35, 798–805. [Google Scholar] [CrossRef]
- Anderson, R.R.; Parrish, J.A. The Optics of Human Skin. J. Investig. Dermatol. 1981, 77, 13–19. [Google Scholar] [CrossRef] [PubMed]
- Allen, J. Photoplethysmography and its application in clinical physiological measurement. Physiol. Meas. 2007, 28, R1–R39. [Google Scholar] [CrossRef]
- Delgado-Gonzalo, R.; Parák, J.; Tarniceriu, A.; Renevey, P.; Bertschi, M.; Korhonen, I. Evaluation of accuracy and reliability of PulseOn optical heart rate monitoring device. In Proceedings of the 2015 37th Annual International Conference of the IEEE Engineering in Medicine and Biology Society (EMBC), Milan, Italy, 25–29 August 2015; pp. 430–433. [Google Scholar]
- Lee, S.; Shin, H.; Hahm, C. Effective PPG sensor placement for reflected red and green light, and infrared wristband-type photoplethysmography. In Proceedings of the 2016 18th International Conference on Advanced Communication Technology (ICACT), Pyeongchang, Korea, 31 January–3 February 2016. [Google Scholar]
- Spierer, D.K.; Rosen, Z.; Litman, L.L.; Fujii, K. Validation of photoplethysmography as a method to detect heart rate during rest and exercise. J. Med. Eng. Technol. 2015, 39, 264–271. [Google Scholar] [CrossRef] [PubMed]
- European Union. Regulation (EU) 2016/679 of the European Parliament and the Council of 27 April 2016 on the protection of natural persons with regard to the processing of personal data and on the free movement of such data, and repealing Directive 95/46/EC (General Data Protection Regulation). Off. J. Eur. Union 2016, 59, 1–88. [Google Scholar]
- European Union. Corrigendum to Regulation (EU) 2016/679 of the European Parliament and the Council of 27 April 2016 on the protection of natural persons with regard to the processing of personal data and on the free movement of such data, and repealing Directive 95/46/EC (General Data Protection Regulation). Off. J. Eur. Union 2018, 61, 2–5. [Google Scholar]
- Parak, J. Accuracy of Firstbeat Bodyguard 2 Beat-To-Beat Heart Rate Monitor; (whitepaper). 2013. Available online: https://assets.firstbeat.com/firstbeat/uploads/2015/11/white_paper_bodyguard2_final.pdf (accessed on 20 August 2019).
- Fokkema, T.; Kooiman, T.J.M.; Krijnen, W.P.; Van der Schans, C.P.; Groot, M. Reliability and Validity of Ten Consumer Activity Trackers Depend on Wlaking Speed. Med. Sci. Sports Exerc. 2017, 49, 793–800. [Google Scholar] [CrossRef] [PubMed]
- Bland, J.M.; Altman, D. Statistical methods for assessing agreement between two methods of clinical measurement. Lancet 1986, 327, 307–310. [Google Scholar] [CrossRef]
- Liu, J.; Tang, W.; Chen, G.; Lu, Y.; Feng, C.; Tu, X.M. Correlation and agreement: Overview and clarification of competing concepts and measures. Shanghai Arch Psychiatry 2016, 28, 115–120. [Google Scholar]
- Bland, J.M.; Altman, D.G. Applying the right statistics: Analyses of measurement studies. Ultrasound Obstet. Gynecol. 2003, 22, 85–93. [Google Scholar] [CrossRef]
- Bland, J.M.; Altman, D.G. Measuring agreement in method comparison studies. Stat. Methods Med. Res. 1999, 8, 135–160. [Google Scholar] [CrossRef]
- Nelson, M.B.; Kaminsky, L.A.; Dickin, D.C.; Montoye, A.H. Validity of Consumer-Based Physical Activity Monitors for Specific Activity Types. Med. Sci. Sports Exerc. 2016, 48, 1619–1628. [Google Scholar] [CrossRef]
- Boudreaux, B.D.; Hebert, E.P.; Hollander, D.B.; Williams, B.M.; Cormier, C.L.; Naquin, M.R.; Gillan, W.W.; Gusew, E.E.; Kraemer, R.R. Validity of Wearable Activity Monitors during Cycling and Resistance Exercise. Med. Sci. Sports Exerc. 2018, 50, 624–633. [Google Scholar] [CrossRef] [PubMed]
- Leboeuf, S.F.; Aumer, M.E.; Kraus, W.E.; Johnson, J.L.; Duscha, B. Earbud-based sensor for the assessment of energy expenditure, HR, and VO2max. Med. Sci. Sports Exerc. 2014, 46, 1046–1052. [Google Scholar] [CrossRef] [PubMed]
- Wallen, M.P.; Gomersall, S.R.; Keating, S.E.; Wisløff, U.; Coombes, J.S. Accuracy of Heart Rate Watches: Implications for Weight Management. PLoS ONE 2016, 11, e0154420. [Google Scholar] [CrossRef] [PubMed]
- Jo, E.; Lewis, K.; Directo, D.; Kim, M.J.; Dolezal, B.A. Validation of Biofeedback Wearables for Photoplethysmographic Heart Rate Tracking. J. Sports Sci. Med. 2016, 15, 540–547. [Google Scholar] [PubMed]
- Benedetto, S.; Caldato, C.; Bazzan, E.; Greenwood, D.C.; Pensabene, V.; Actis, P. Assessment of the Fitbit Charge 2 for monitoring heart rate. PLoS ONE 2018, 13, e0192691. [Google Scholar] [CrossRef] [PubMed]
- Horton, J.F.; Stergiou, P.; Katz, L.; Fung, T.S. Comparison of Polar M600 Optical Heart Rate and ECG Heart Rate during Exercise. Med. Sci. Sports Exerc. 2017, 49, 2600–2607. [Google Scholar] [CrossRef] [PubMed]
- Abt, G.; Bray, J.; Benson, A.C. The validity and inter-device variability of the Apple Watch™ for measuring maximal heart rate. J. Sports Sci. 2018, 36, 1447–1452. [Google Scholar] [CrossRef]
- Støve, M.P.; Haucke, E.; Nymann, M.L.; Sigurdsson, T.; Larsen, B.T. Accuracy of the wearable activity tracker Garmin Forerunner 235 for the assessment of heart rate during rest and activity. J. Sports Sci. 2019, 37, 895–901. [Google Scholar] [CrossRef]
- Wang, R.; Blackburn, G.; Desai, M.; Phelan, D.; Gillinov, L.; Houghtaling, P. Accuracy of Wrist-Worn Heart Rate Monitors. JAMA Cardiol. 2017, 2, 104–106. [Google Scholar] [CrossRef]
- Stahl, S.E.; An, H.-S.; Dinkel, D.M.; Noble, J.M.; Lee, J.-M. How accurate are the wrist-based heart rate monitors during walking and running activities? Are they accurate enough? BMJ Open Sport Exerc. Med. 2016, 2, e000106. [Google Scholar] [CrossRef]
- Reddy, R.K.; Pooni, R.; Zaharieva, D.P.; Senf, B.; El Youssef, J.; Dassau, E.; Doyle Iii, F.J.; Clements, M.A.; Rickels, M.R.; Patton, S.R.; et al. Accuracy of Wrist-Worn Activity Monitors During Common Daily Physical Activities and Types of Structured Exercise: Evaluation Study. JMIR mHealth uHealth 2018, 6, e10338. [Google Scholar] [CrossRef] [PubMed]
- Gillinov, S.; Etiwy, M.; Wang, R.; Blackburn, G.; Phelan, D.; Gillinov, A.M.; Houghtaling, P.; Javadikasgari, H.; Desai, M.Y. Variable Accuracy of Wearable Heart Rate Monitors during Aerobic Exercise. Med. Sci. Sports Exerc. 2017, 49, 1697–1703. [Google Scholar] [CrossRef] [PubMed]
- Shcherbina, A.; Mattsson, C.M.; Waggott, D.; Salisbury, H.; Christle, J.W.; Hastie, T.; Wheeler, M.T.; Ashley, E.A. Accuracy in Wrist-Worn, Sensor-Based Measurements of Heart Rate and Energy Expenditure in a Diverse Cohort. J. Pers. Med. 2017, 7, 3. [Google Scholar] [CrossRef] [PubMed]
- Tamura, T.; Maeda, Y.; Sekine, M.; Yoshida, M. Wearable Photoplethysmographic Sensors—Past and Present. Electronics 2014, 3, 282–302. [Google Scholar] [CrossRef]
- Trivedi, N.S.; Ghouri, A.F.; Shah, N.K.; Lai, E.; Barker, S.J. Effects of motion, ambient light, and hypoperfusion on pulse oximeter function. J. Clin. Anesth. 1997, 9, 179–183. [Google Scholar] [CrossRef]


| Male (N = 14) | Female (N = 6) | All Participants (N = 20) | |
|---|---|---|---|
| Age (years) | 22.1 ± 1.8 | 22.5 ± 2.1 | 22.3 ± 2.0 |
| Body mass (kg) | 74.6 ± 8.4 | 57.8 ± 4.2 | 69.6 ± 11.0 |
| Resting Heart/Pulse Rate | Heart/Pulse Rate ≤90 bpm | |||
|---|---|---|---|---|
| Mean ± SD (bpm) | ICC | MAE ± SD (bpm) | MAPE (%) | |
| Cosinuss°One | 53.6 ± 8.3 | 0.94 | 1.5 ± 1.8 | 2.5 |
| Dash Pro | 55.0 ± 9.7 | 0.98 | 2.0 ± 2.5 | 3.2 |
| ECG | 54.9 ± 10.1 | |||
| Pulse Rate ≥ 100 bpm | ||
|---|---|---|
| MAE ± SD (bpm) | MAPE (%) | |
| Cosinuss°One | 1.8 ± 2.8 | 1.3 |
| Dash Pro | 1.8 ± 2.8 | 1.4 |
| Maximum Heart/Pulse Rate | ||
|---|---|---|
| Mean ± SD (bpm) | ICC | |
| Cosinuss°One | 181.6 ± 6.4 | 0.84 |
| Dash Pro | 183.7 ± 4.8 | 0.83 |
| ECG | 183.0 ± 5.1 | |
© 2019 by the authors. Licensee MDPI, Basel, Switzerland. This article is an open access article distributed under the terms and conditions of the Creative Commons Attribution (CC BY) license (http://creativecommons.org/licenses/by/4.0/).
Share and Cite
Passler, S.; Müller, N.; Senner, V. In-Ear Pulse Rate Measurement: A Valid Alternative to Heart Rate Derived from Electrocardiography? Sensors 2019, 19, 3641. https://doi.org/10.3390/s19173641
Passler S, Müller N, Senner V. In-Ear Pulse Rate Measurement: A Valid Alternative to Heart Rate Derived from Electrocardiography? Sensors. 2019; 19(17):3641. https://doi.org/10.3390/s19173641
Chicago/Turabian StylePassler, Stefanie, Niklas Müller, and Veit Senner. 2019. "In-Ear Pulse Rate Measurement: A Valid Alternative to Heart Rate Derived from Electrocardiography?" Sensors 19, no. 17: 3641. https://doi.org/10.3390/s19173641
APA StylePassler, S., Müller, N., & Senner, V. (2019). In-Ear Pulse Rate Measurement: A Valid Alternative to Heart Rate Derived from Electrocardiography? Sensors, 19(17), 3641. https://doi.org/10.3390/s19173641