Article

A Simple Surface-Enhanced Raman Spectroscopic Method for on-Site Screening of Tetracycline Residue in Whole Milk

1
Environmental Microbial and Food Safety Laboratory, Agricultural Research Service, United States Department of Agriculture, 10300 Baltimore Avenue, Bldg. 303 BARC-East, Beltsville, MD 20705, USA
2
Hefei Institute of Physical Science, CAS 350 Shushanhu Road, Hefei 230031, China
*
Author to whom correspondence should be addressed.
Sensors 2018, 18(2), 424; https://doi.org/10.3390/s18020424
Submission received: 21 November 2017 / Revised: 11 January 2018 / Accepted: 29 January 2018 / Published: 1 February 2018
(This article belongs to the Section Biosensors)

Abstract

:
Therapeutic and subtherapeutic use of veterinary drugs has increased the risk of residue contamination in animal food products. Antibiotics such as tetracycline are used for mastitis treatment of lactating cows. Milk expressed from treated cows before the withdrawal period has elapsed may contain tetracycline residue. This study developed a simple surface-enhanced Raman spectroscopic (SERS) method for on-site screening of tetracycline residue in milk and water. Six batches of silver colloid nanoparticles were prepared for surface enhancement measurement. Milk-tetracycline and water-tetracycline solutions were prepared at seven concentration levels (1000, 500, 100, 10, 1, 0.1, and 0.01 ppm) and spiked with silver colloid nanoparticles. A 785 nm Raman spectroscopic system was used for spectral measurement. Tetracycline vibrational modes were observed at 1285, 1317 and 1632 cm−1 in water-tetracycline solutions and 1322 and 1621 cm−1 (shifted from 1317 and 1632 cm−1, respectively) in milk-tetracycline solutions. Tetracycline residue concentration as low as 0.01 ppm was detected in both the solutions. The peak intensities at 1285 and 1322 cm−1 were used to estimate the tetracycline concentrations in water and milk with correlation coefficients of 0.92 for water and 0.88 for milk. Results indicate that this SERS method is a potential tool that can be used on-site at field production for qualitative and quantitative detection of tetracycline residues.

1. Introduction

Tetracycline is a broad-spectrum antibiotic effective against a wide range of microorganisms including Gram-positive and Gram-negative bacteria, atypical bacteria and protozoan parasites [1]. It has been extensively used at therapeutic levels for prevention of bacterial infections in humans, animals, and plants [2], and at subtherapeutic levels in animal, poultry and fish feeds as growth promoters [3,4]. Animals receiving feed treated with antibiotics gain 4 to 5% more body weight compared to those receiving antibiotic-free feeds, which has escalated subtherapeutic use [5]. Consuming food products from tetracycline treated animals increases the risk of antibiotic resistant infections in humans if the proper withdrawal protocol is not followed. Regular consumption of tetracycline-contaminated food items can be toxic and allergenic to humans, and may induce fatty liver in pregnancy [6,7,8].
Antibiotics are frequently used for lactating dairy cows [9]. Intramammary infusion for mastitis treatment is a primary source of antibiotic contamination in milk [10,11]. Dosage in excess of label direction is fairly common in large animals, thus estimated withdrawal periods may not be adequate to ensure that antibiotic residue in milk is below the required limits [12,13,14]. The maximum residue limit (MRL) of tetracycline in milk set by the United States Food and Drug Administration is 0.3 ppm [15]. The US initiated restrictions on subtherapeutic tetracycline usage in January 2017 [16]. The tetracycline MRL of milk set by European Union and other countries is 0.1 ppm [16,17,18]. It is imperative to determine tetracycline residue levels in milk, meat and their derivative products to ensure food safety.
Several methods have been developed for detection of tetracycline residues in animal products: liquid chromatography/mass spectroscopy [8,19,20], high performance liquid chromatography [7,21,22,23], microbial tests [24,25,26,27], and electrochemical aptasensors [28,29]. Although these methods have high accuracy and low detection limits, factors including operational costs, requirement for skilled personnel, complicated sample preparation, solvent disposal and protracted sampling time limit their field application. An effective and efficient screening technique must be inexpensive, rapid, easy to operate and capable of processing multiple samples simultaneously [30]. Optical techniques such as visible/near-infrared spectroscopy, hyperspectral imaging and Raman spectroscopy are gaining importance for food safety and quality detection due to simple and inexpensive operation, minimal sample preparation and rapid results [31,32,33]. Among the optical techniques, Raman spectroscopy has the advantages of insensitivity to water, and qualitative and quantitative identification of a wide range of chemicals [34]. However, Raman spectra of biological samples are often overwhelmed by strong background fluorescence, preventing detection of chemicals at low concentrations.
Surface-enhanced Raman spectroscopy (SERS) uses metals such as gold (Au) or silver (Ag) in colloidal form to enhance Raman signal intensity, greatly lowering detection limits. SERS has been widely used in food authentication research for detection of microorganisms and contaminants [35,36,37,38,39,40] and for detection of antibiotics in biomedical and pharmaceutical applications [41,42]. SERS has been applied to qualitatively detect antibiotics in aqueous solutions, demonstrating its potential for food safety applications [43,44].
Tetracycline residues in milk should be measured immediately after milking. Prevailing laboratory-based technologies are not adaptable for on-site quantitative detection. This study used a portable Raman spectroscopic system and silver colloid nanoparticles to develop a simple method for on-site quantification of tetracycline residues in whole milk for agricultural applications. The proposed method can detect tetracycline residues in milk at concentrations below the MRL listed above. The main objectives of this study are to:
  • Develop a simple and easy to use SERS method for on-site detection of tetracycline residue in milk and water.
  • Analyze the spectra for consistently positive detection of residual tetracycline.
  • Develop a quantitative model to estimate tetracycline concentrations.

2. Materials and Methods

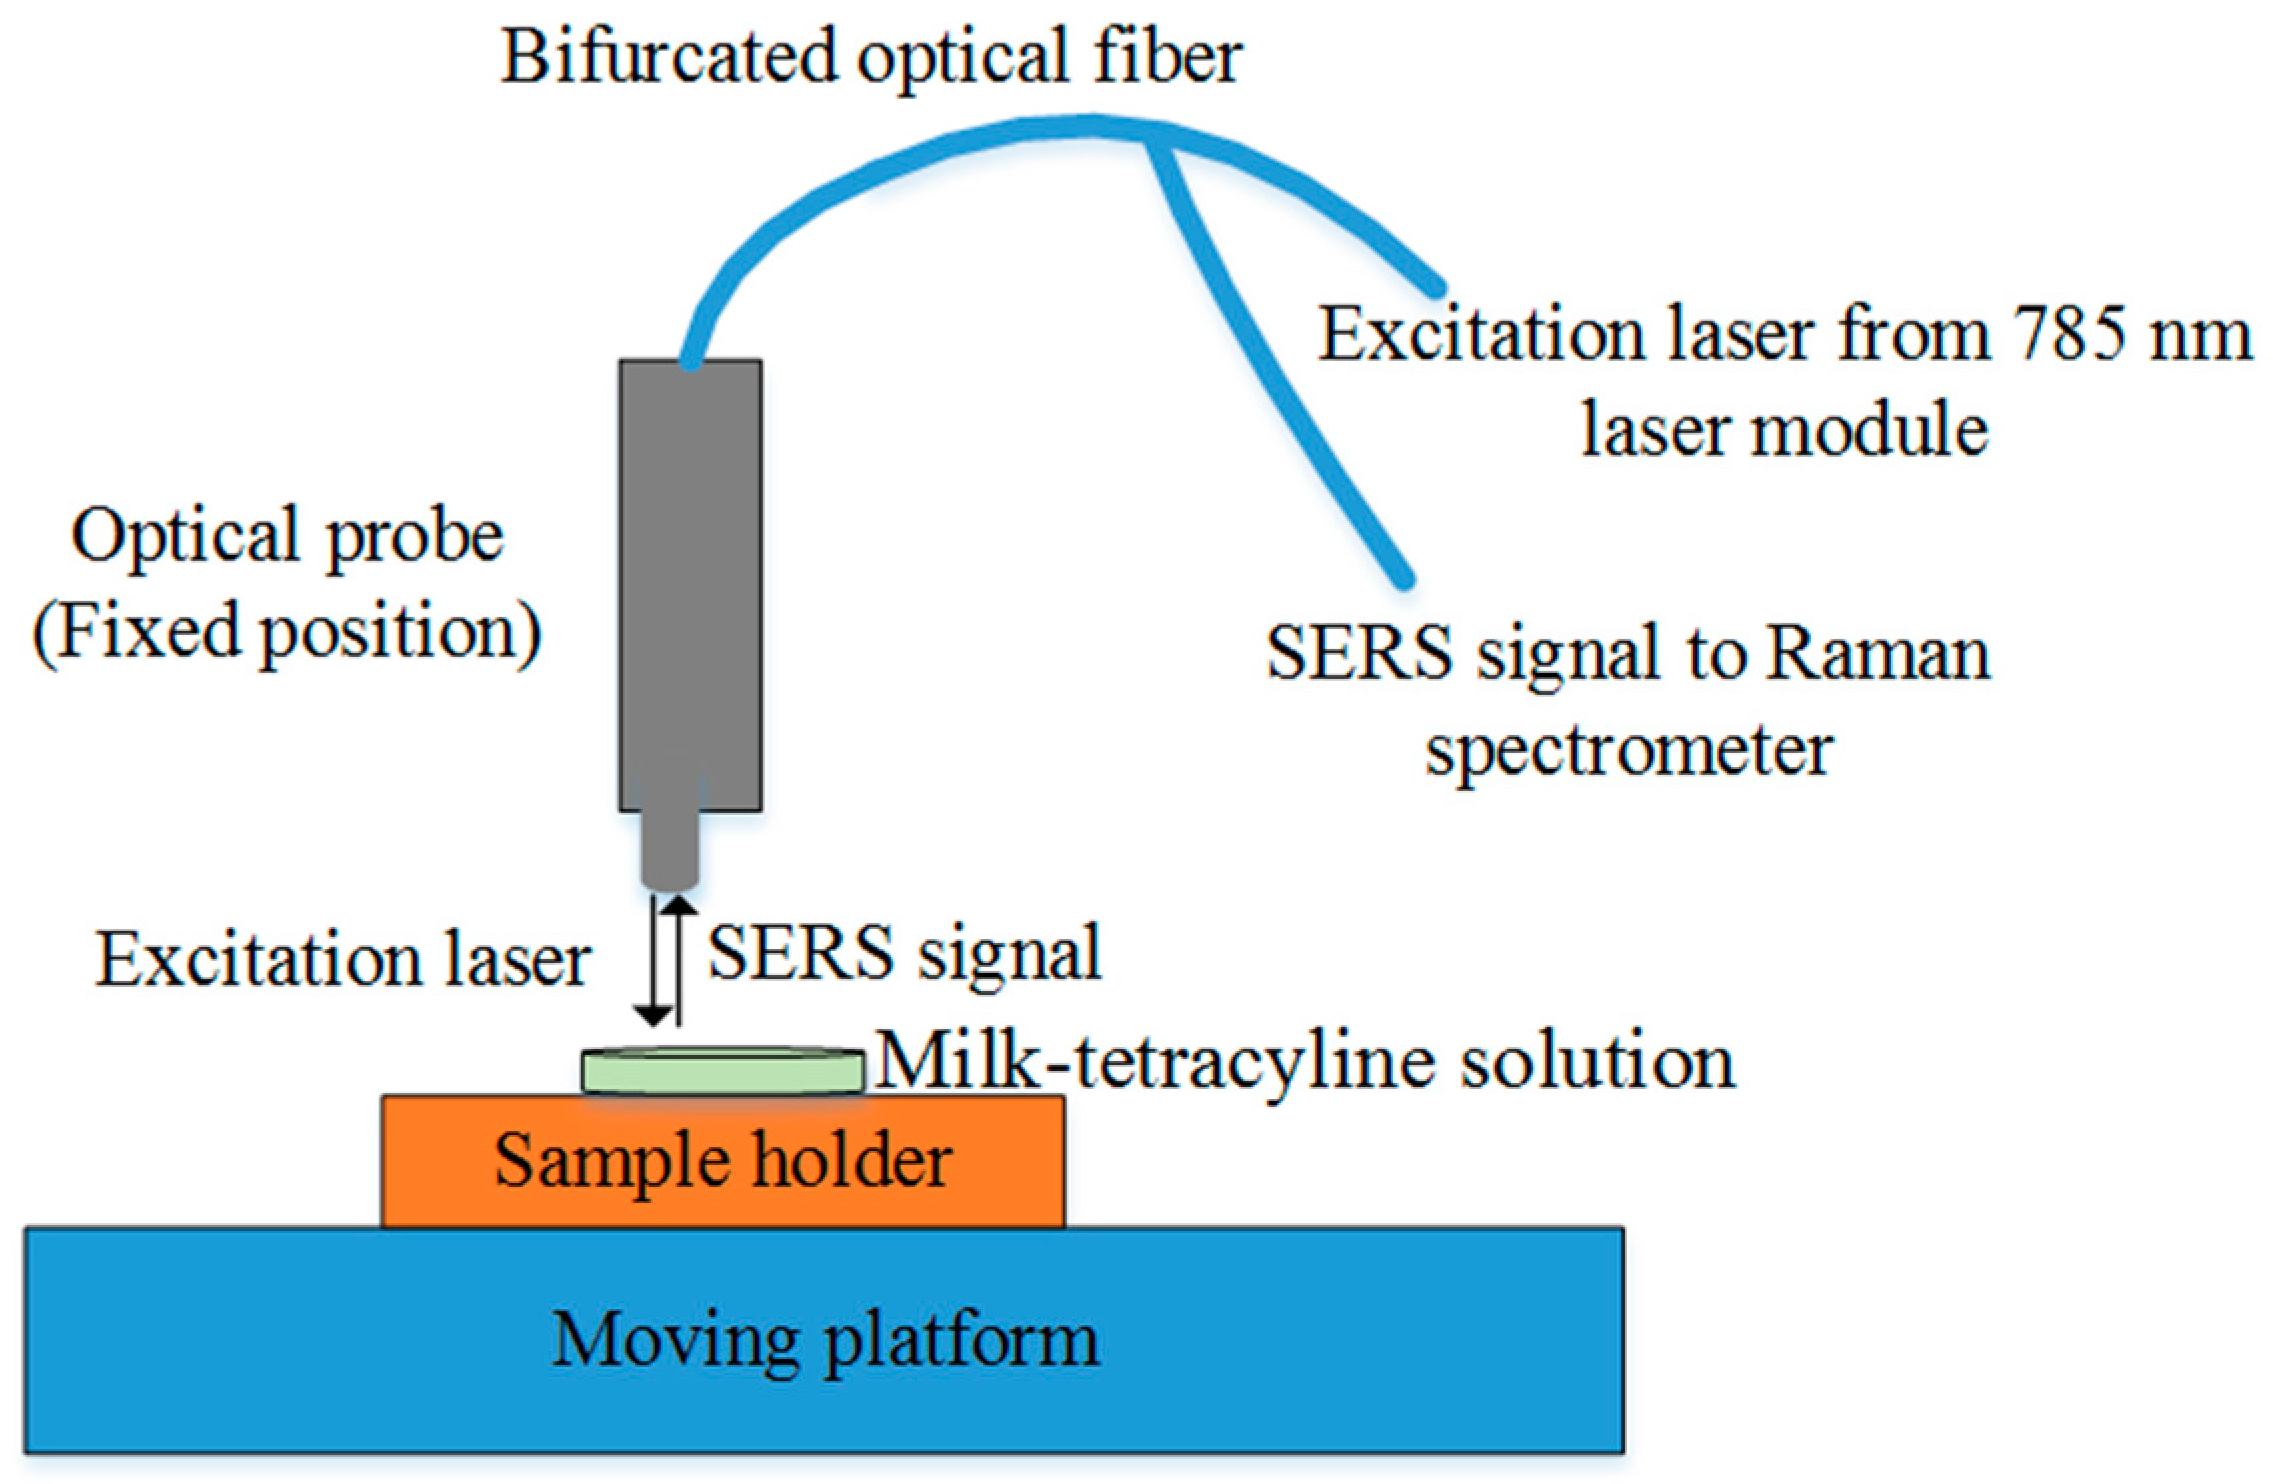
2.1. Portable Raman Spectroscopic System

Figure 1 shows the portable system used for surface-enhanced Raman spectroscopy. The Raman chemical imaging system described by Qin et al. [45] was modified. The system consists of a 16-bit charge-coupled device (CCD) camera with 1024 × 256 pixel resolution (Newton DU920N-BR-DD, Andor Technology, South Windsor, CT, USA) mounted with a Raman spectrometer (Raman Explorer 785, Headwall Photonics, Fitchburg, MA, USA). A USB cable connects the CCD camera to a computer for control and data transfer. A 785 nm laser module (I0785MM0500MF, Innovative Photonics Solutions, Monmouth Junction, NJ, USA) is used as the light source for sample excitation. A bifurcated optical fiber is connected to the laser module at one end to deliver laser light to the optical probe for sample excitation; the other end is connected to the spectrometer through a 100 µm slit to deliver scattering signal to the spectrometer. The optical probe focuses the excitation laser on the sample and collects scattering signal from the sample. A motorized platform (MAXY4009W1-S4, Velmex, Bloomfield, NY, USA) holds samples and positions them below the optical probe. Software developed in-house is used for CCD and platform control, and spectral acquisition and display. The system was spectrally calibrated using polystyrene and naphthalene. After spectral calibration, the system covered the range 111 to 2563 cm−1. Spectral resolution is 14 cm−1 at full width half maximum.

2.2. Silver Colloid Preparation

The method reported by Ma and Huang [46] was used to synthesis six batches of cyclodextrin capped silver colloid nanoparticles. Silver nitrate (AgNO3 > 99%), beta-cyclodextrin (β-CD > 97%) and sodium hydroxide (NaOH 1.0 M) (Sigma-Aldrich, St. Louis, MO, USA) were utilized without further purification. A clear solution of 50 mL deionized water and 0.4 g β-CD was prepared in a 125 mL flask and pH adjusted with 250 µL NaOH. The flask was placed in a hot water bath and heated to 80 °C, then 1.5 mL 20 mM AgNO3 solution was added with rigorous stirring. After 10 min, Ag colloidal nanoparticles form and the colorless solution becomes green. The nanoparticles were cooled, then purified with two cycles of deionized water wash, centrifugation (14,000 rpm/15 m) and decanting. The colloids were pipetted out and stored in clean tubes in a refrigerator.

2.3. Sample Preparation and Spectral Measurement

Tetracycline hydrochloride powder (>95%, Sigma-Aldrich, St. Louis, MO, USA) was mixed with deionized water to prepare stock 1000 ppm solution, then diluted to form the concentration series 500, 100, 10, 1.0, 0.1, and 0.01 ppm. Similarly, the tetracycline hydrochloride powder was mixed with organic whole milk (Costco Brand, Issaquah, WA, USA) to prepare stock 1000 ppm solution. The 1000 ppm solution was diluted by adding milk to obtain the concentration series 500, 100, 10, 1.0, 0.1, and 0.01 ppm.
One silver colloid batch was selected randomly to prepare the first set of water-tetracycline spiked samples. 5 µL 1000 ppm water-tetracycline solution and 5 µL silver colloid were mixed in a disposable aluminum dish. Three replicate samples of 1000 ppm water-tetracycline solution were prepared using this batch. Then, the same silver colloid batch was used to prepare three replicate samples of 500, 100, 10, 1.0, 0.1, and 0.01 ppm water-tetracycline solutions. The surface-enhanced Raman spectra were collected immediately after preparing the spiked samples to avoid drying. In the second week, three replicate samples of water-tetracycline solution at each of the seven concentrations were prepared in the same manner using the second silver colloid batch and SERS spectra were collected. In the third week, the third silver colloid batch was used to prepare three replicate samples of water-tetracycline solution at each of the seven concentrations and SERS spectra were collected. In this way, nine SERS spectra of water-tetracycline solution at each concentration were collected over three weeks. A total of 63 SERS spectra were collected from the water-tetracycline solution (9 replicates × 7 concentrations).
The same process was repeated using three other silver colloid batches to prepare milk-tetracycline solution spiked samples in the first, second and third week and SERS spectra were collected. Nine SERS spectra of milk-tetracycline solution—at each concentration were collected over three weeks. A total of 63 spiked samples were obtained from the milk-tetracycline solution. The spectrum of the corresponding silver colloid batch was also recorded on the day of experiment.

3. Results and Discussion

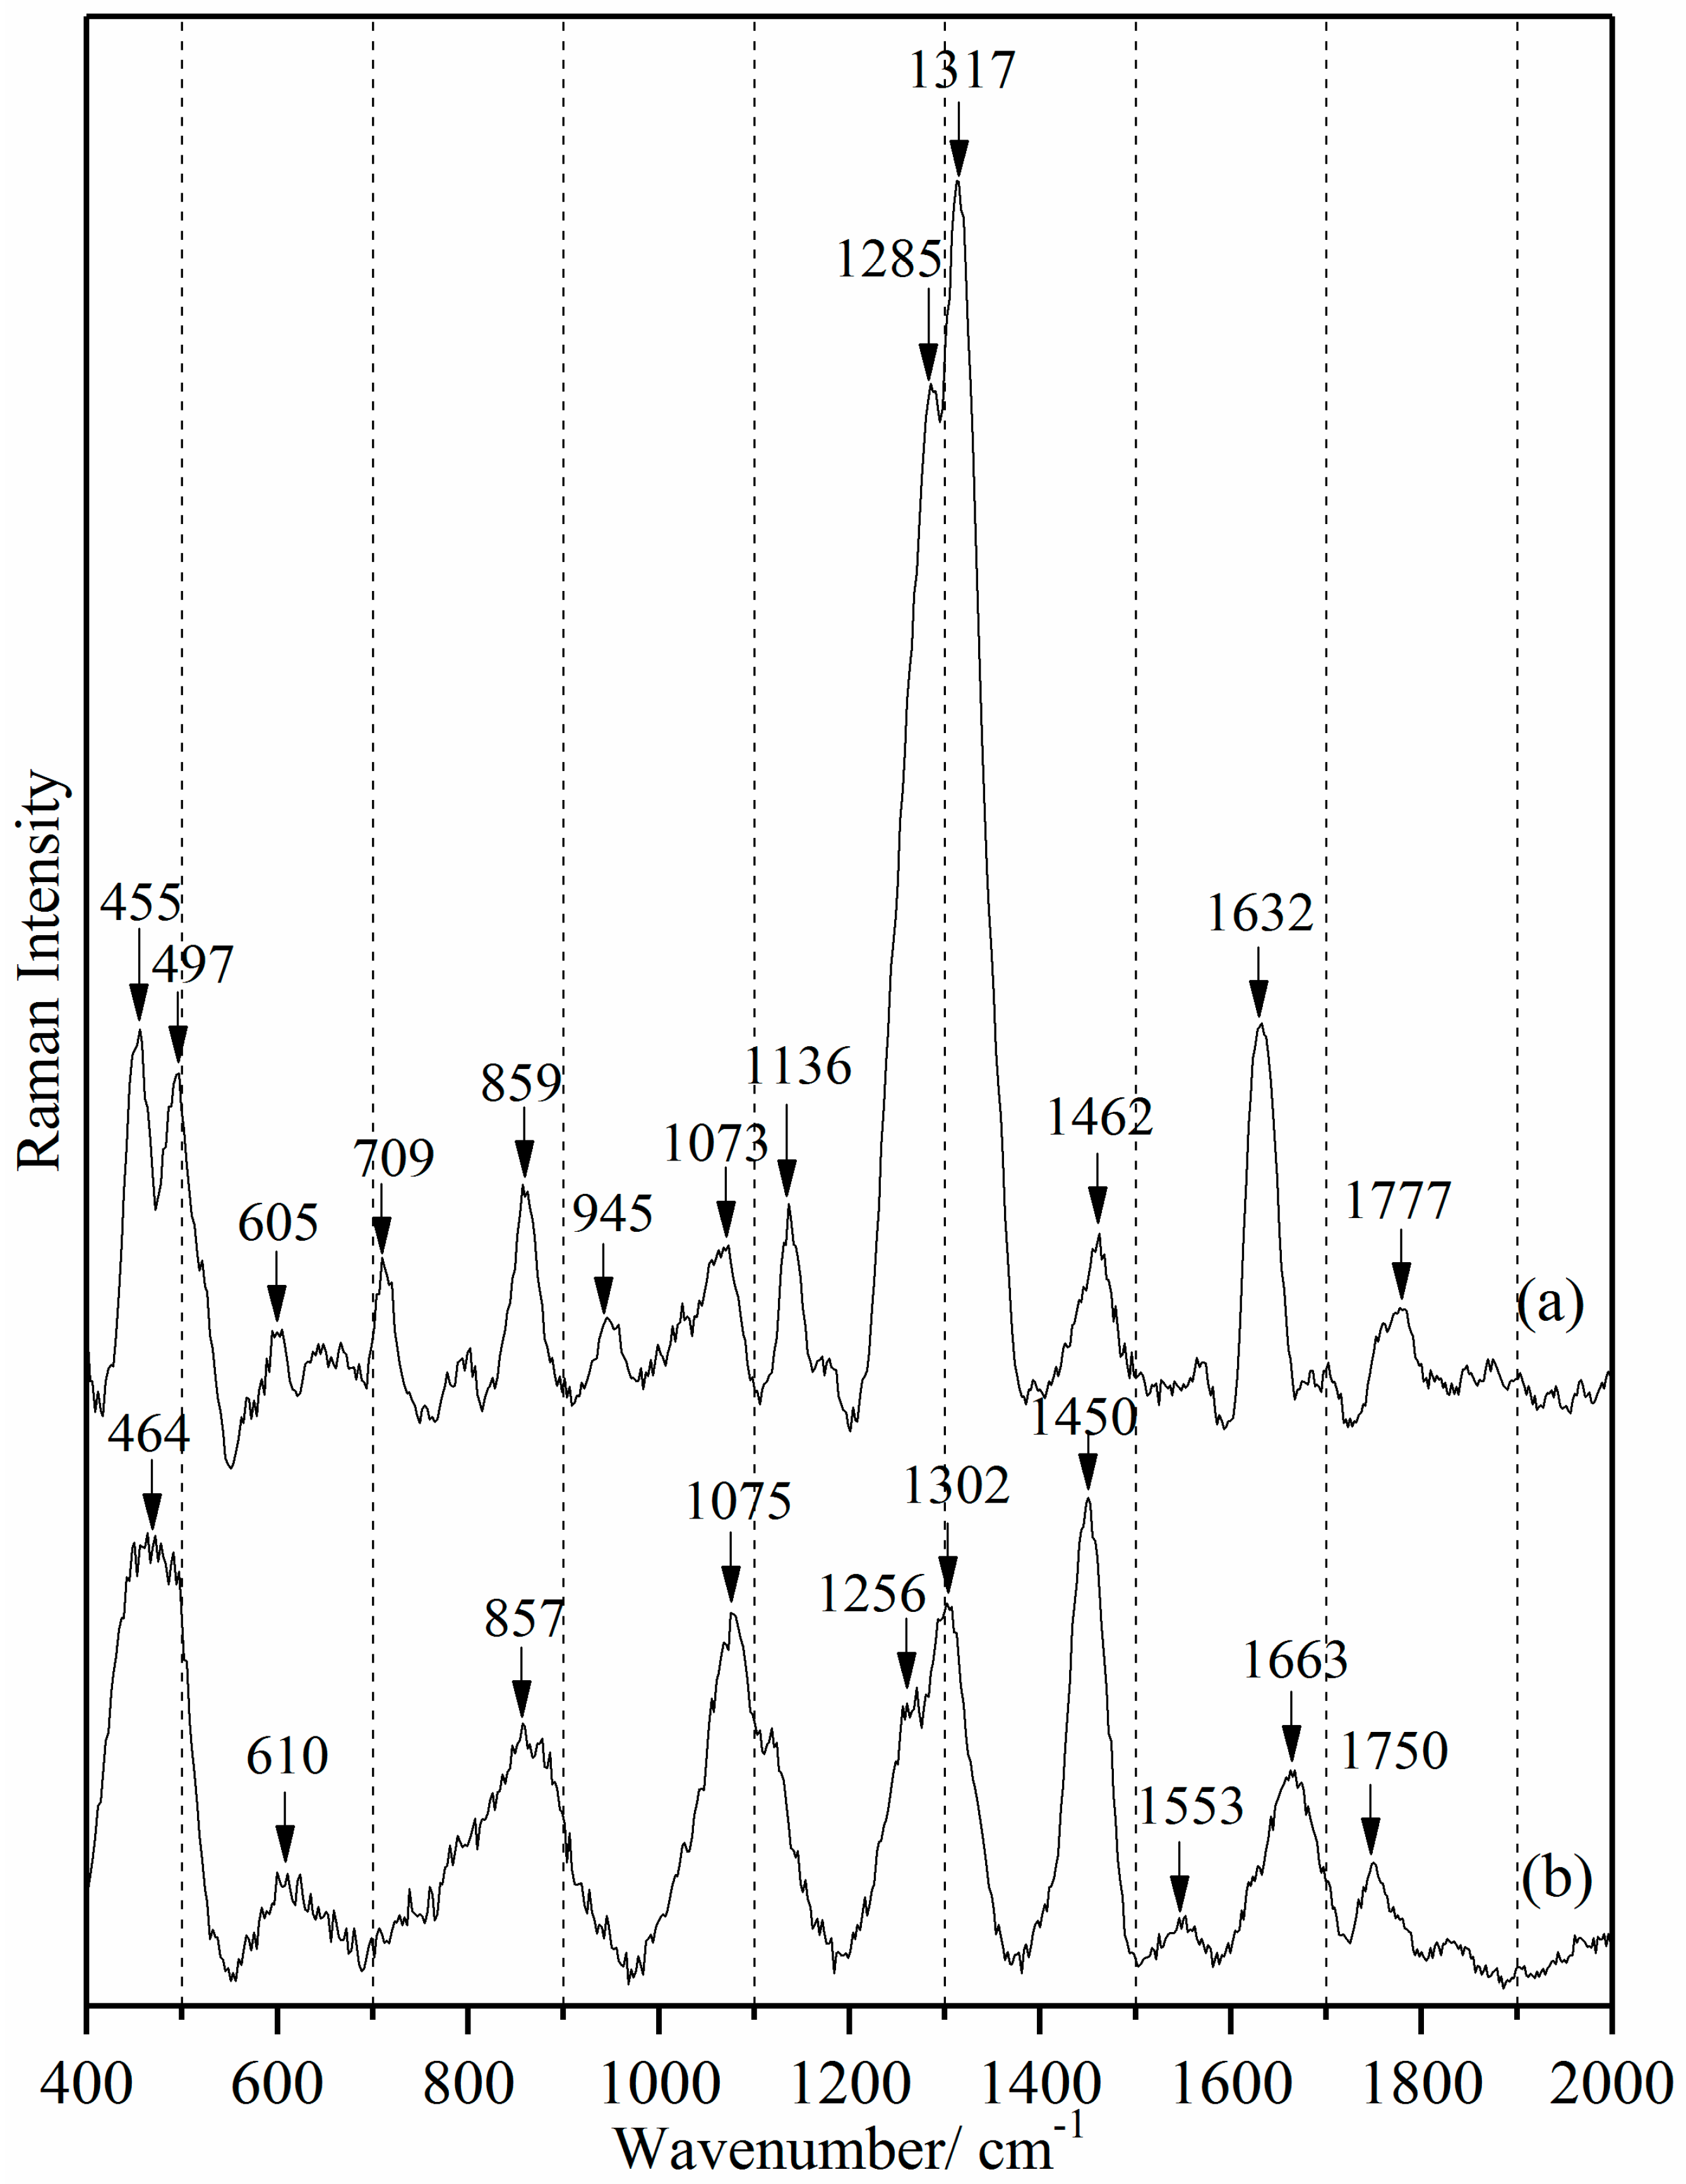
3.1. Raman Spectra of Tetracycline and Whole Milk

Figure 2 gives the Raman spectrum of tetracycline hydrochloride powder and whole milk. For clarity, only the range 400 to 2000 cm−1 is shown, but this covers all the important spectral information. The tetracycline molecular structure contains four rings (D, C, B, and A). Ring D (6a-7-8-9-10-10a-6a) is planar because of three double bonds (C7=C8, C9=C10 and C6a=C10a). The sites C9 to C12 (bottom half of molecule) are coplanar: Ring C (5a-6-6a-10a-11-11a-5a) and Ring B (4a-5-5a-11a-12-12a-4a) are planar because C6a=C10a-C11=O and O=C11-C11a=C12 are both co-planar with Ring D. The Ring A (1-2-3-4-4a-12a-1) structure is almost all above the C9 to C12 moiety plane because C12a-OH and C4a-H site are below the plane, and C3=C2-C1=O is planar and not in the C9 to C12 plane [47].
Several tetracycline peaks (605, 859, 1073 and 1136 cm−1) overlap with those of milk (610, 857, 1075 and 1133 cm−1). These milk vibrational modes correspond predominantly to proteins and lipids [48,49]. However, the tetracycline peaks at 1285, 1317 and 1632 cm−1 are discrete for tetracycline identification. The 1317 cm−1 frequency is assignable to ring breathing ν(C10-C10a), ν(C6a-C7), ν(C9-C10) relative to the planar C9 to C12 moiety. This portion of tetracycline is primarily hydrophobic and flat. The 1618 cm−1 frequency is assigned to ν(O-C1), ν(C2-C3), δ(amide-CO), δ(amide-NH)), i.e., amide stretching and bending modes. Ring A includes both the amide -NH2 moiety and secondary amine site C4-(N)(-CH3)2. Ring A thus includes the most polar and the most hydrophilic sites on the molecule. This site is clearly spatially resolved from the hydrophobic sites. The amide vibrational mode is pH dependent, so with tetracycline hydrochloride, the amide moiety would be (O=C-NH3)+. The degree of protonation of tetracycline is pH-dependent; milk is normally pH 6.6 ± 0.1 [50].
The short molecular fraction C4-C4a-C5-C5a contains only aliphatic H-C and CH2 sites. The 1285 cm−1 frequency δ(C-H) 4, 4a, 5, 5a arises from molecular sites which are the most elastic over short inter-atomic distances and these elastic sites are also localized. Frequency shifts observed in a matrix localized at only one site would be evidence for which moiety of the drug molecule is involved in tetracycline-matrix binding [51,52].

3.2. Raman Spectra of Cyclodextrin Capped Silver Colloids

Figure 3 shows the silver colloid nanoparticles imaged with a Hitachi S-4800 scanning electron microscope (SEM). The nanoparticles have uniform spherical shape; diameters ranged from 30 to 50 nm, with average 40 nm.
Ag colloid preparation is sensitive to factors including temperature, mixing, and rate of reagent addition [53,54]. Inattention to these factors results in inconsistency and irreproducibility between batches. Figure 4 shows the mean and ±standard deviation (SD) spectra of our six batches. The cyclodextrin capped Ag colloids were ideal because they produced low background signal and did not interfere with tetracycline detection. Before computing the mean, the six spectra were normalized to peak intensity at 1409 cm−1 = 1.0. Only five distinct peaks (550, 793, 945, 1055, 1409 cm−1) were observed, demonstrating reproducibility and consistency in our synthetic procedure. No significant change was observed in the spectral profile among the batches despite different storage periods. 550, 1055 and 1409 cm−1 are ring chair deformation, ring breathing and C7-C8 stretching + O-C8-O stretching modes on cyclodextrin, respectively [55]. 793 and 945 cm−1 are sites on cyclodextrin corresponding to conformational flexibility [56].

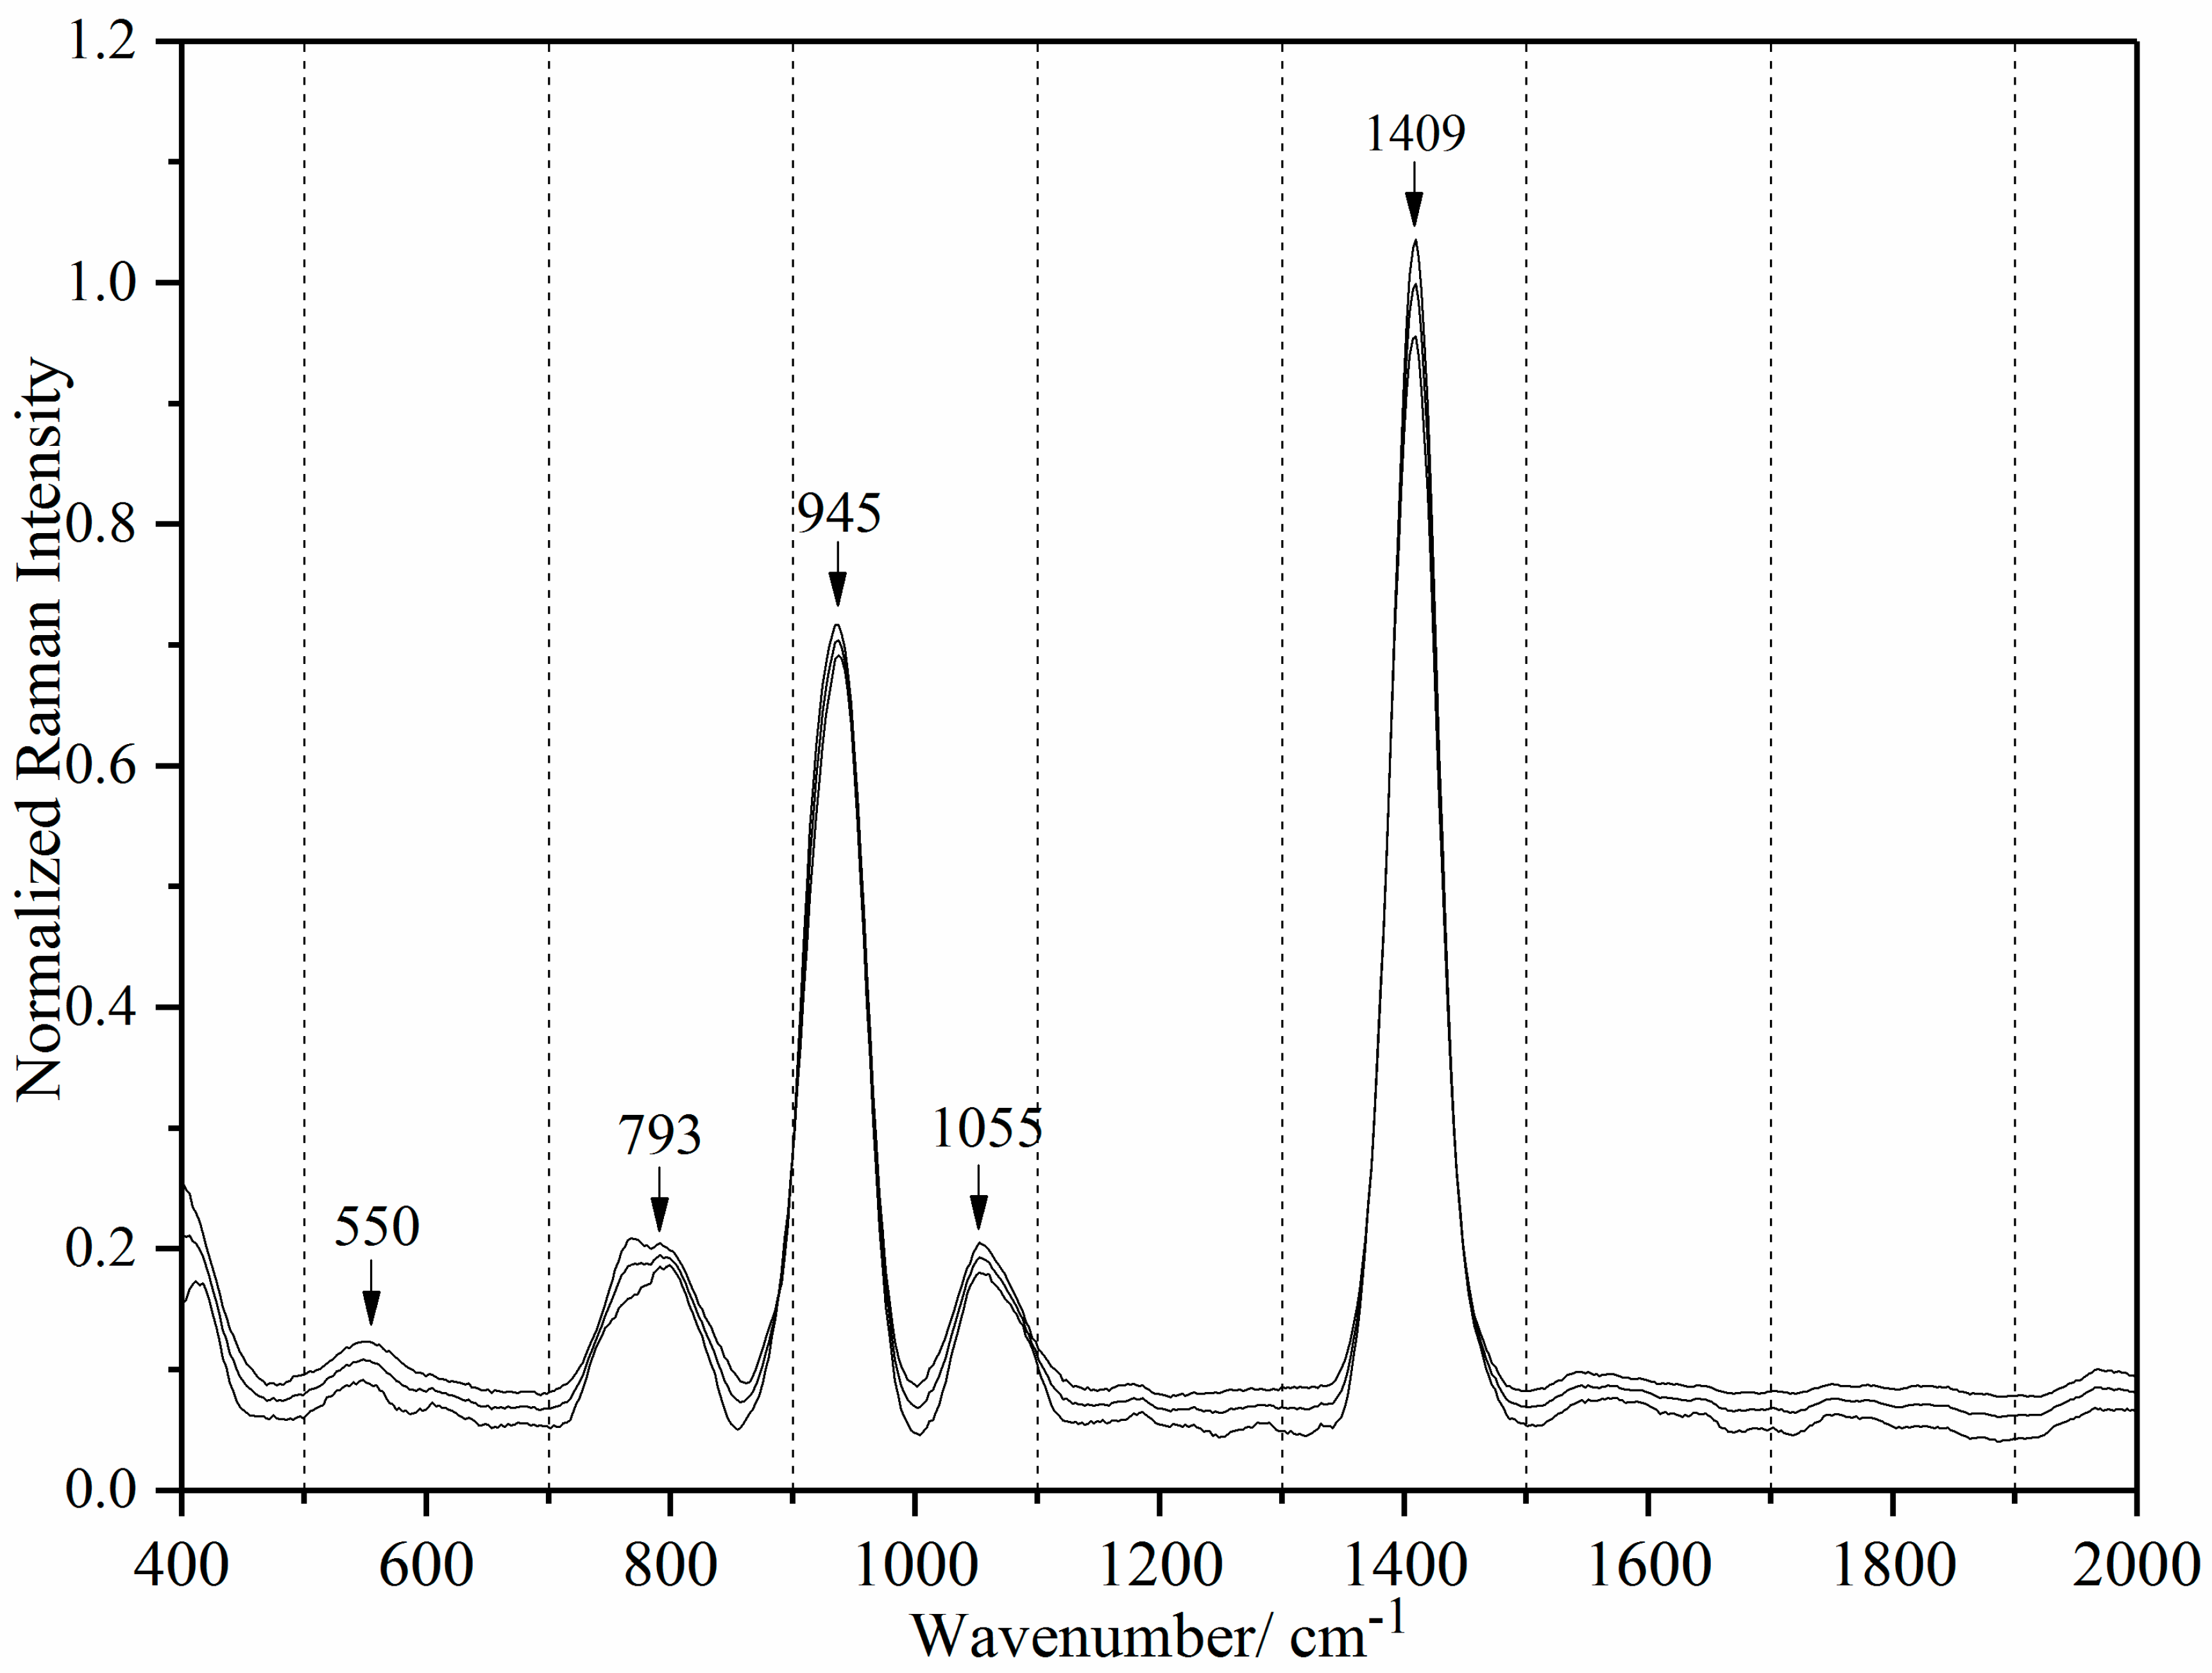
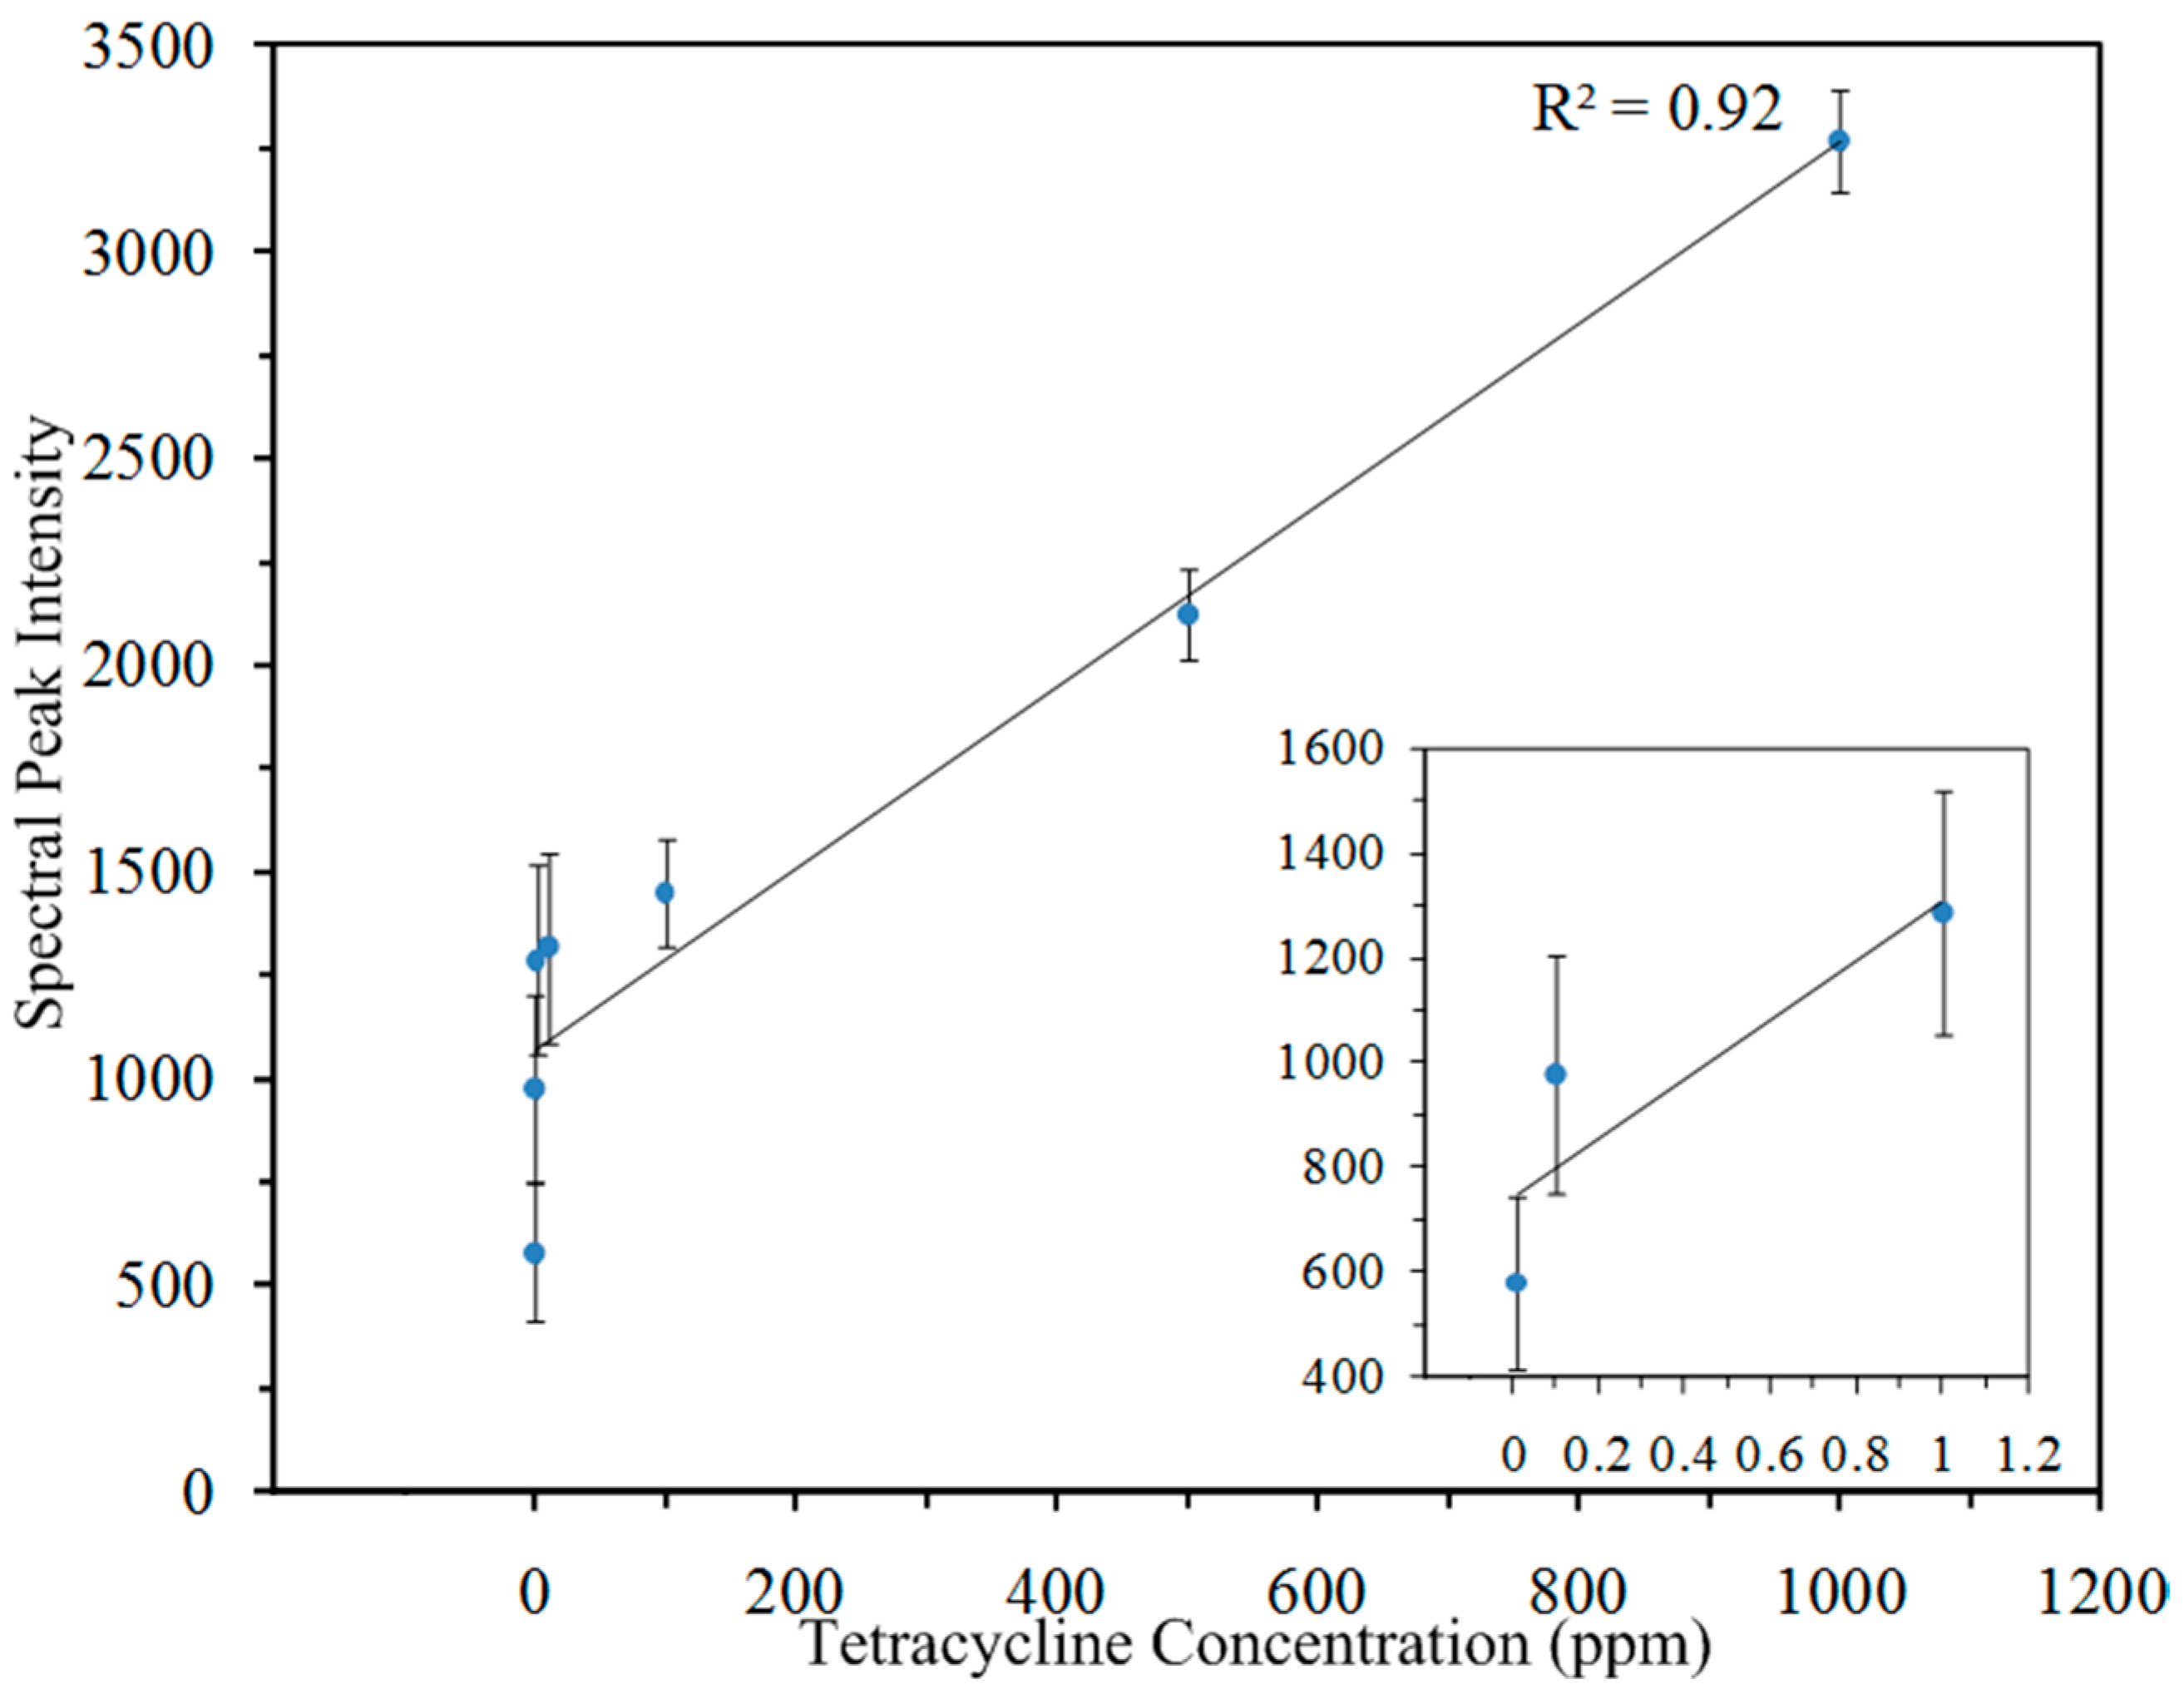
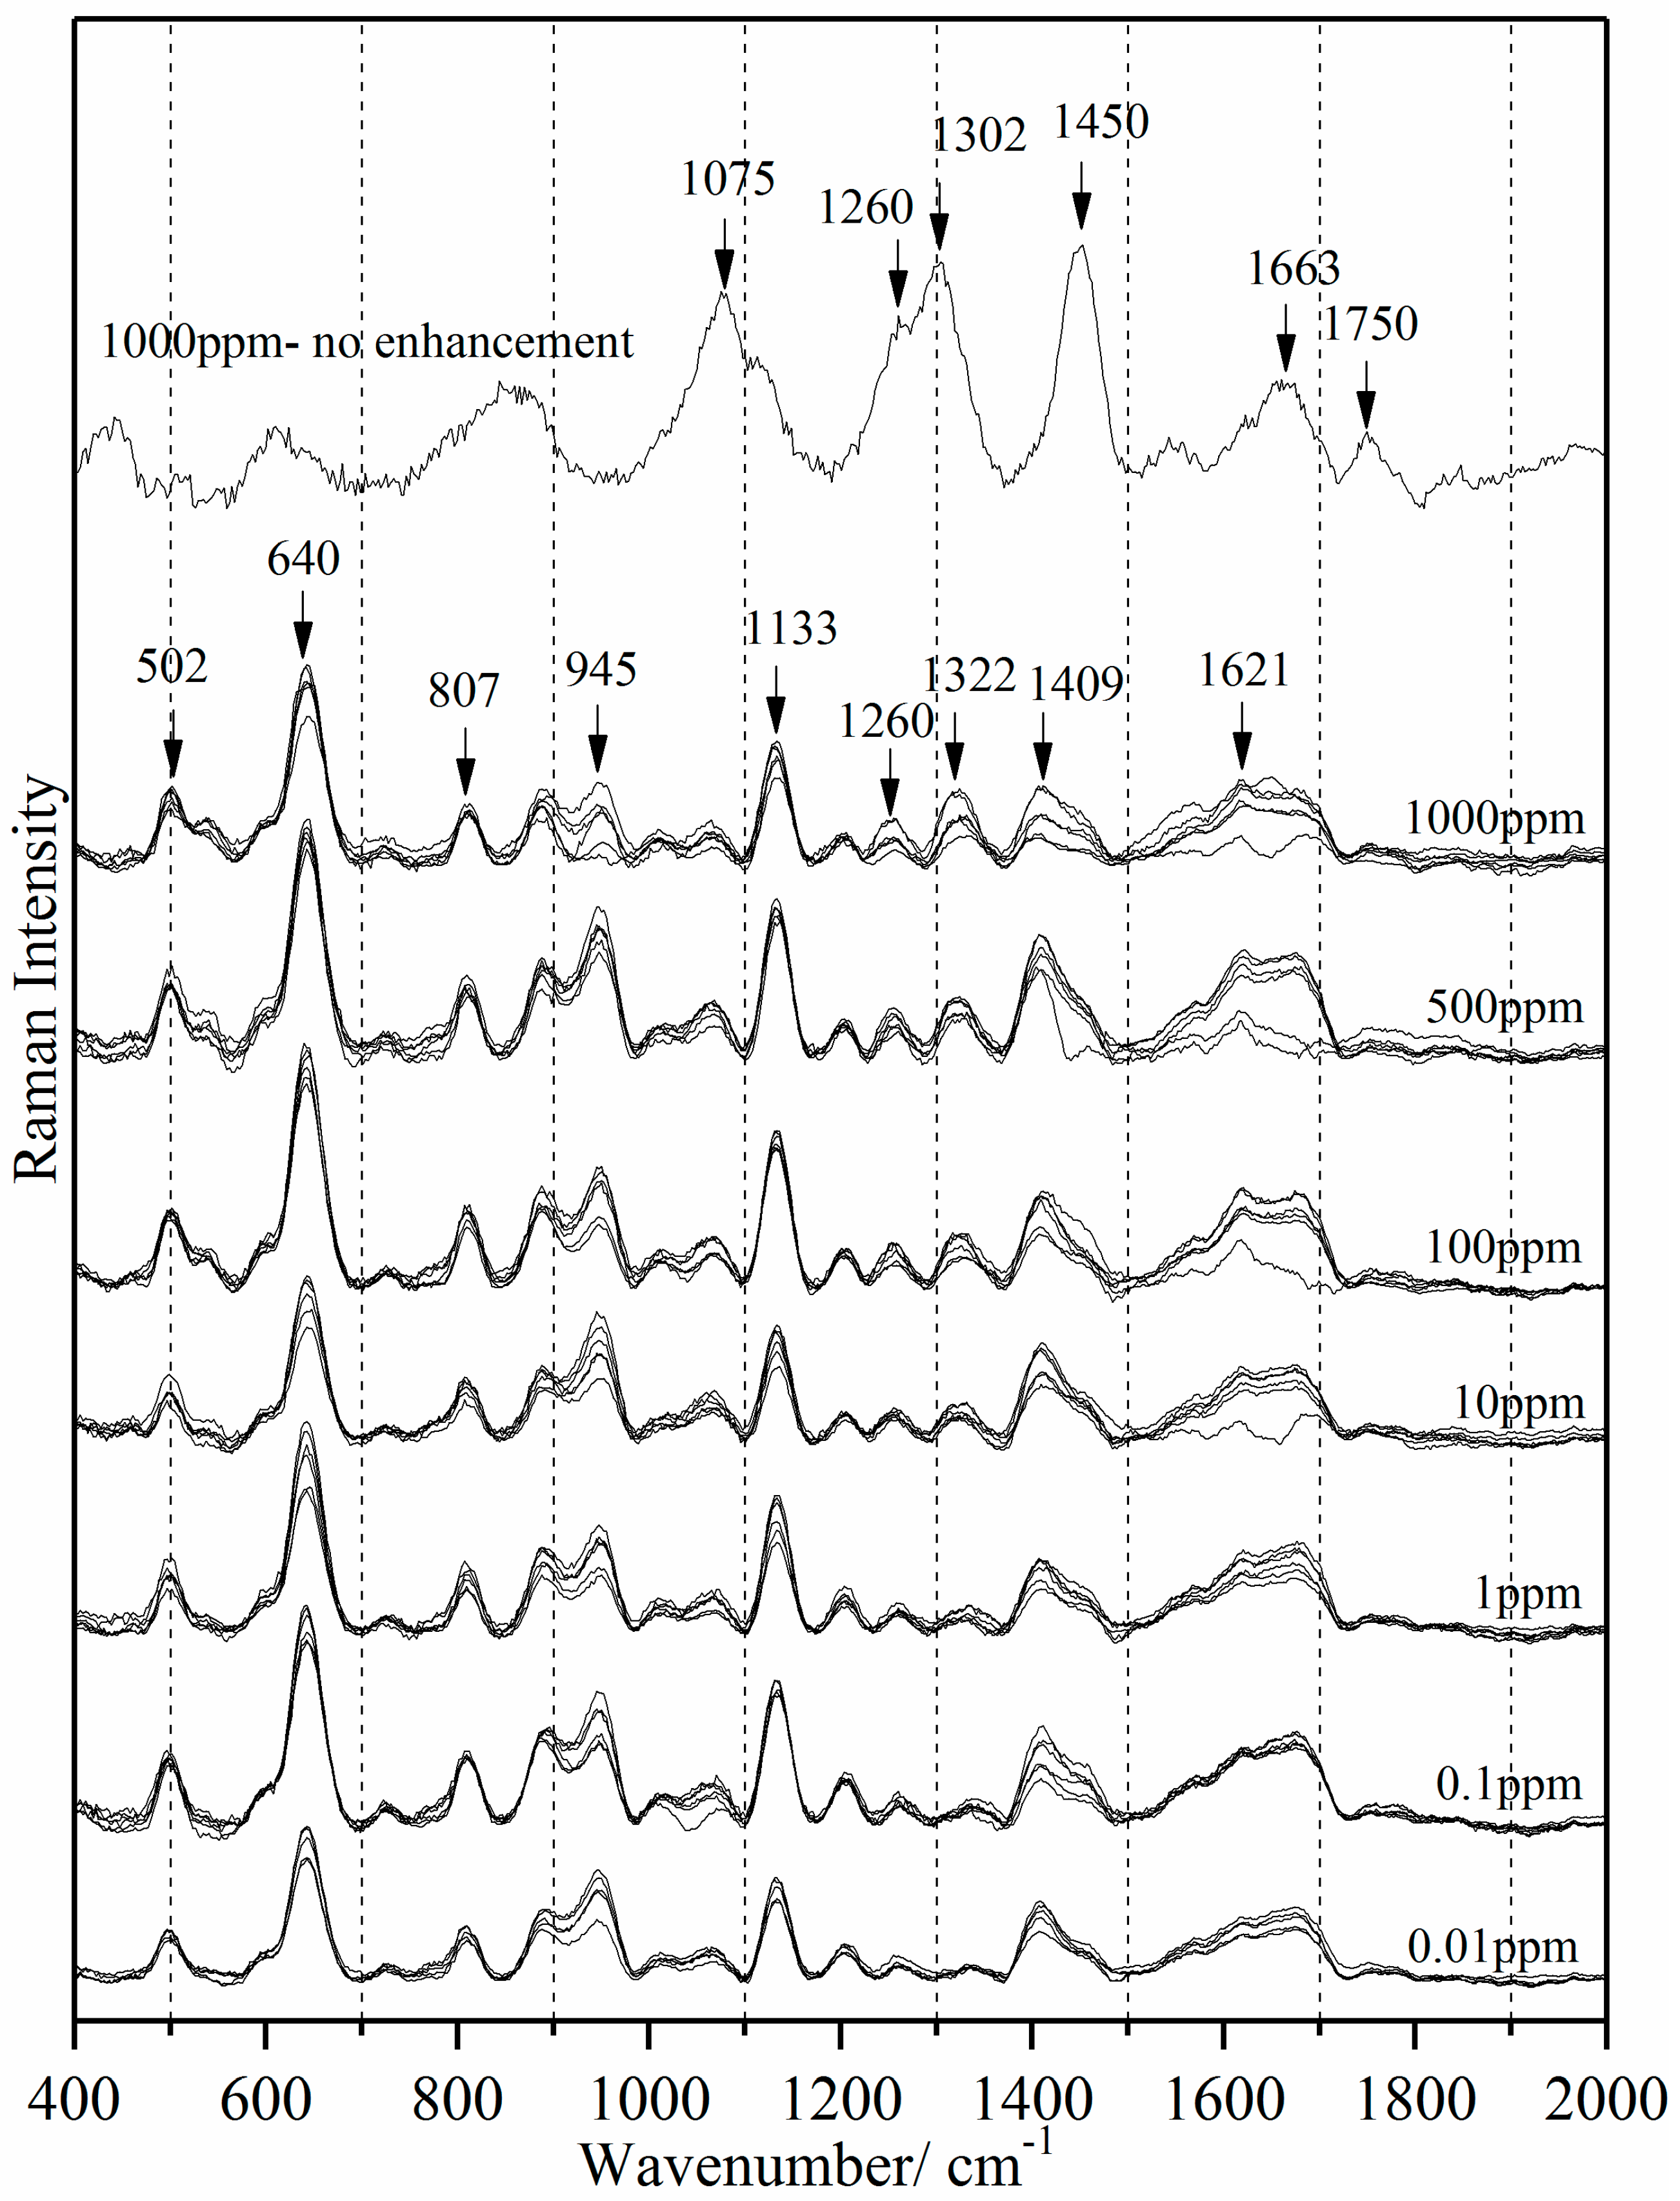
3.3. Surface-Enhanced Raman Spectra of Water-Tetracycline Solution

Figure 5 shows the SERS spectra of water-tetracycline at seven concentration levels (1000, 500, 100, 10, 1.0, 0.1, 0.01 ppm). Tetracycline peaks are present at 1285, 1317 and 1632 cm1. In comparison, the 1000 ppm spectrum without enhancement (also Figure 5) contains no distinct tetracycline peaks. The increased intensity of tetracycline peaks in the SERS spectra across all concentrations demonstrates the enhancement effect of the silver colloid nanoparticles. To demonstrate consistent SERS detection across all tetracycline concentration levels, three spectra were acquired from each colloidal batch—a total of nine spectra at each concentration level. The nine spectra at each concentration level were collected over three weeks. No significant variation was observed among spectra within the same concentration level, demonstrating consistent SERS detection despite different storage periods. In Figure 5, the three predominant modes are at the same frequencies as in pure tetracycline (Figure 2a), and the 1285 and 1317 cm1 peaks have a similar shape.
Tetracycline at the molecular level contains hydrophilic groups (-OH, O=C-NH, C=O, and -(N-H)(CH3)2 sites) separated by a mostly flat hydrophobic structure of four six carbon rings. Beta-cyclodextrin has an abundance of hydrophilic -OH binding sites and a 7.8Å inner diameter hydrophobic cavity [57]. The 1317 cm1 intensity could be significantly lower for concentrations below 10 ppm because the tetracycline molecules absorbed inside cyclodextrin have limited space for ring breathing vibrational modes. At higher concentrations, absorption can occur on the outside of cyclodextrin as well as inside it.
The number of hydrophobic and hydrophilic adsorption sites on the silver colloid can be unequal, especially if the ratio of silver to cyclodextrin were not exactly stoichiometric, or not exactly uniform. Silver sites unbound to cyclodextrin would be hydrophilic and have a higher affinity for the amide group on tetracycline. This could explain the abrupt change in the shape and the intensity of 1632 cm1 peak from 0.1 ppm and 0.01 ppm. Once the higher affinity/lower concentration hydrophilic sites are bound with tetracycline, the next binding site to be filled would be the cyclodextrin hydrophobic cavity. The 1285 cm1 peak also exhibited a decreasing intensity and/or broadening at lower concentration. This peak, readily identifiable across all concentration levels, appears to be less sensitive to differences between hydrophilic and hydrophobic binding sites.
The surface-enhanced Raman spectra (Figure 5) also contains the spectral peaks at 945 cm1 and 1409 cm1, which are directly assigned to silver colloid. A gradual increase in 1409 cm1 (cyclodextrin Ring-Chair deformation vibrational mode) peak intensities at decreasing concentration is the inverse function of tetracycline binding: maximum Ring-Chair deformation occurs in the absence of binding. Concurrent changes in the peak intensity at 945 cm1 (cyclodextrin sites of elasticity vibrational modes) are consistent with an increase in cyclodextrin rigidity with an increase in tetracycline binding.
The average peak intensity of the 1285 cm1 mode for 9 spectra at each concentration level was used to develop a predictive model to estimate tetracycline concentrations. Figure 6 shows the linear correlation (R2 = 0.92). Note the inset shows correlations for 0.01 ppm, 0.1 ppm and 1.0 ppm. The standard deviation range is narrow at high concentration, but widens at low concentration, ranging from 111 to 226. The slopes are all similar, supporting a linear relationship between intensity and concentration.

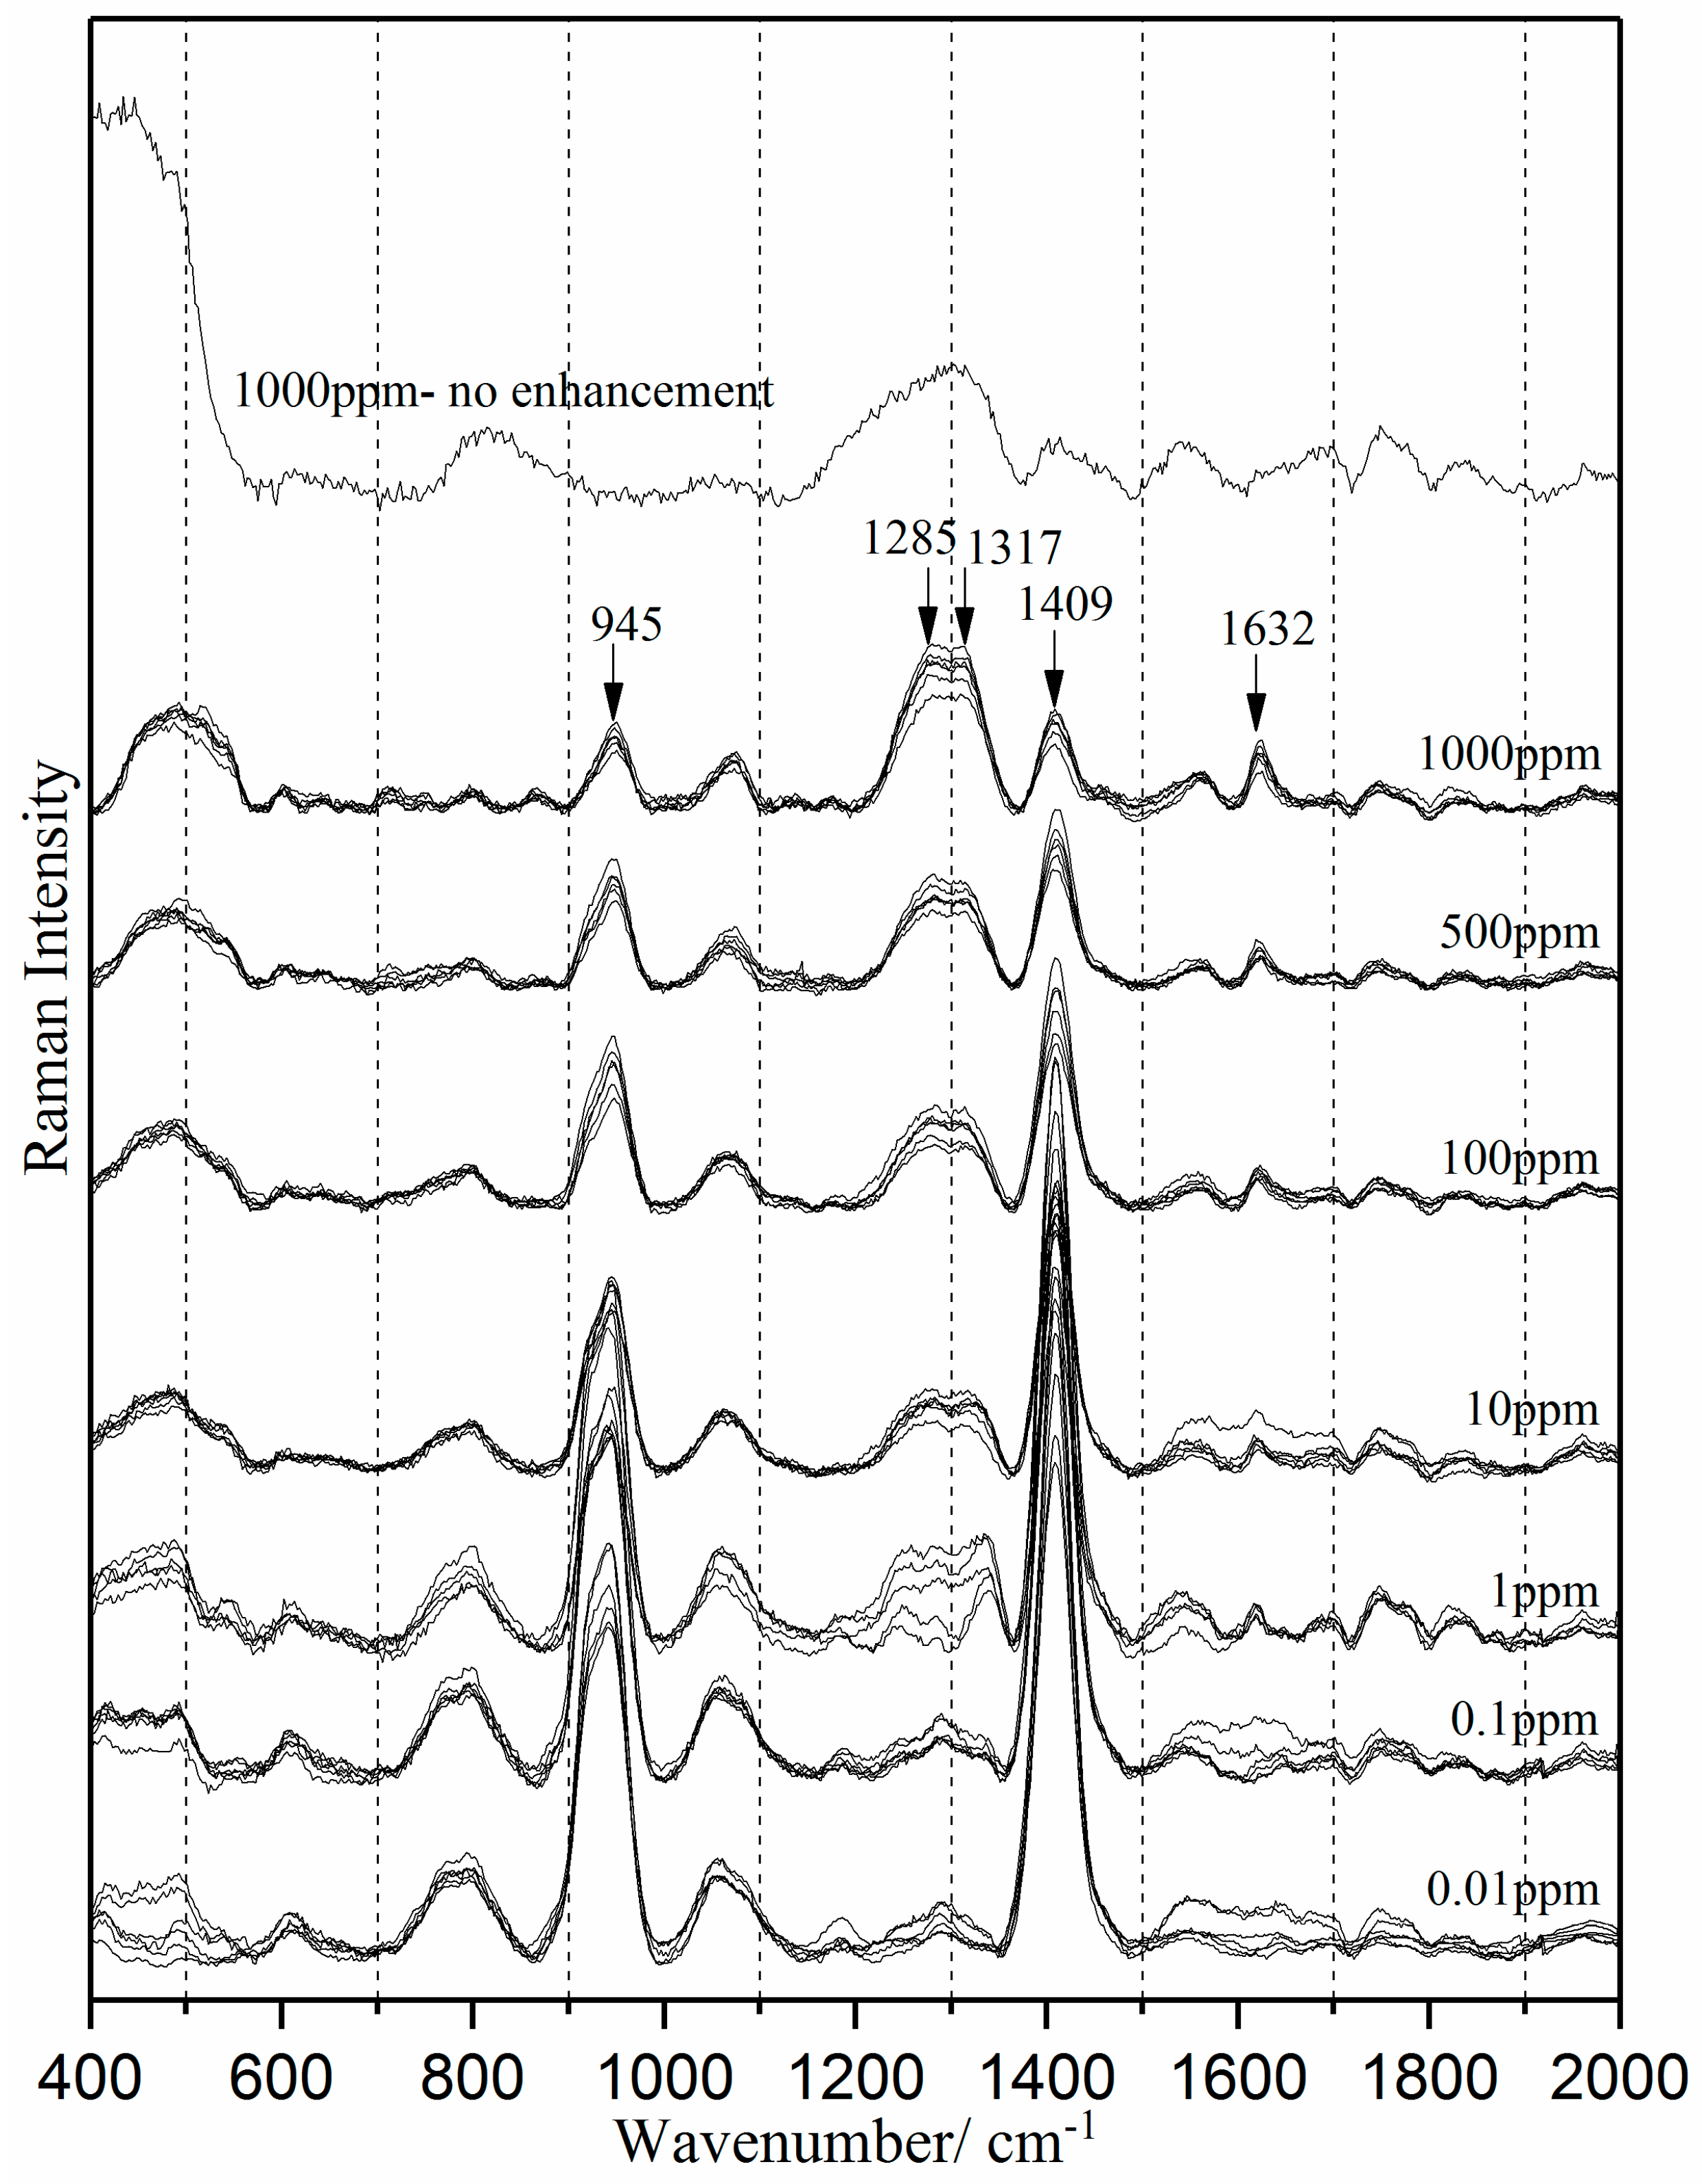
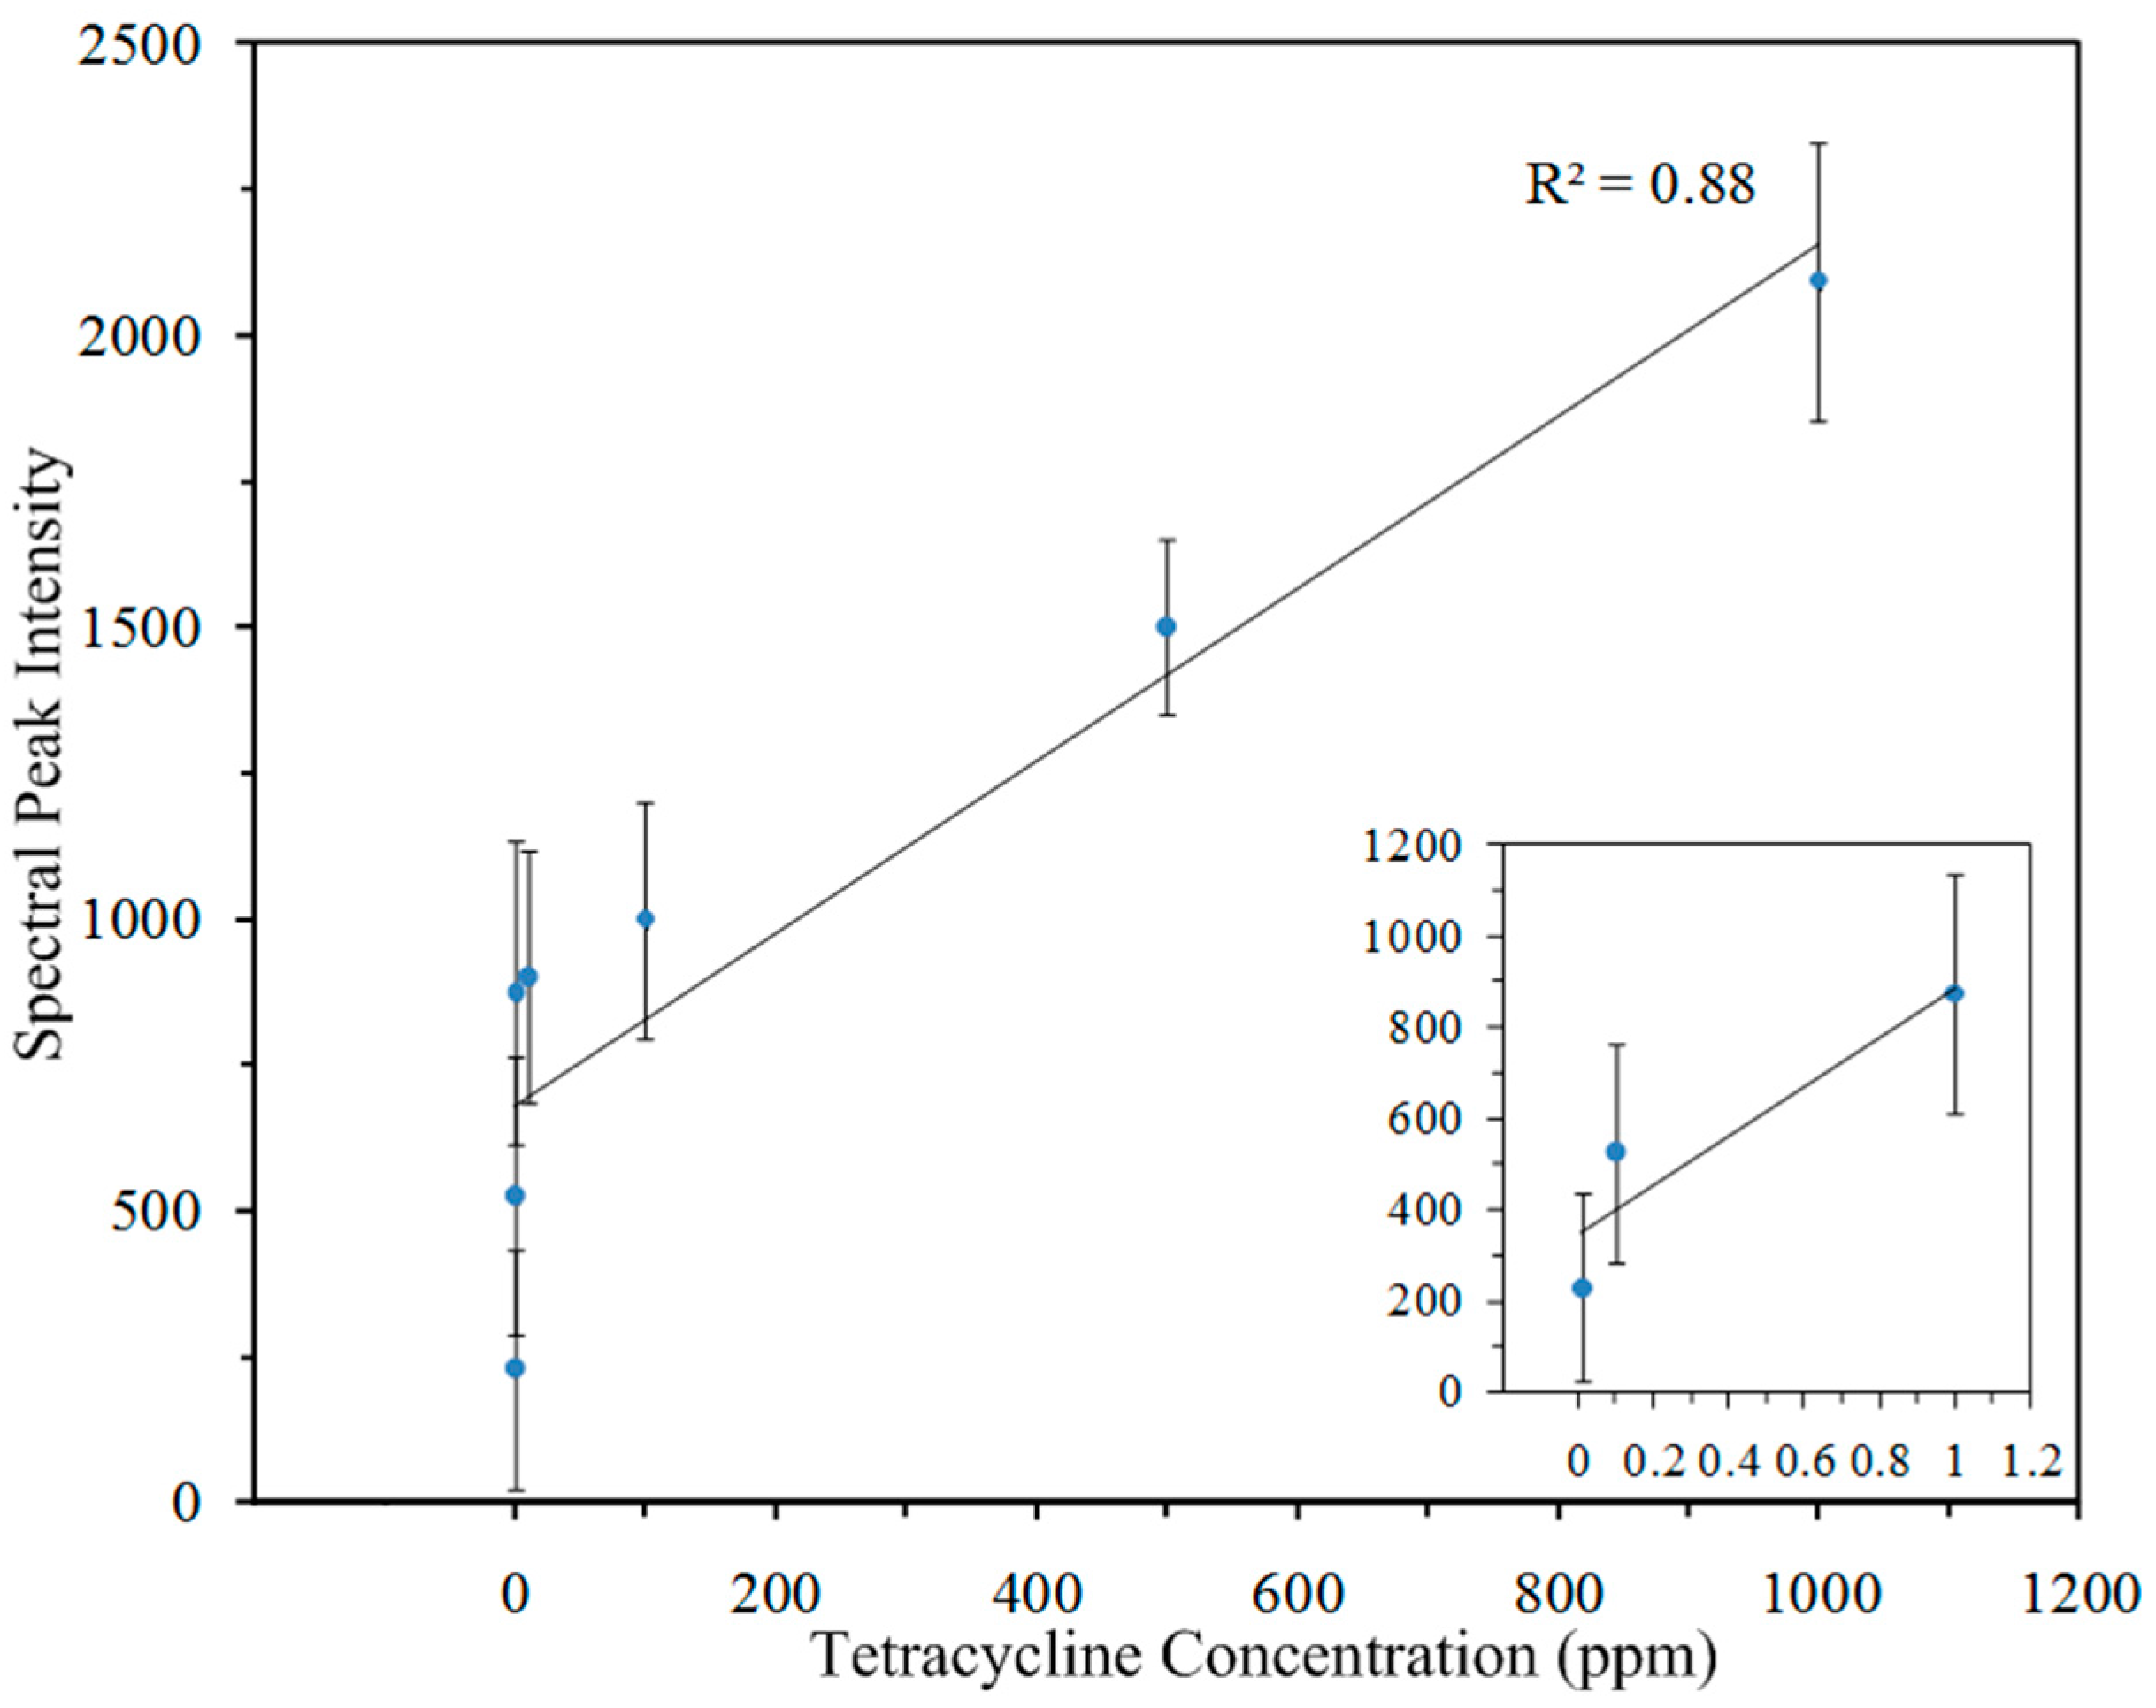
3.4. Surface-Enhanced Raman Spectra of Milk-Tetracycline Solution

Figure 7 shows the SERS spectra of milk-tetracycline at seven concentration levels and the unenhanced 1000 ppm spectrum. Only the SERS data show tetracycline peaks. Comparing the unenhanced 1000 ppm spectrum with the SERS spectra across seven concentrations, the enhanced tetracycline peaks show the surface enhancement effect of the Ag colloid nanoparticles. The 1322 and 1621 cm1 peaks (shifted from 1317 and 1632 cm1 respectively) are attributed to tetracycline. These frequency shifts indicate that tetracycline is included into a beta-cyclodextrin moiety. Comparing Figure 2a, milk-tetracycline solution has an overlap of 1285 cm1 with milk at 1256 cm1 to form a broader 1260 cm1 peak. Additionally, 1265 cm1 is a lipid peak, corresponding to CH2 twisting in the double bond region of linoleic acid [58]. Thus, tetracycline may also be binding with any polyunsaturated fats present in milk fat.
No significant change in the spectral profile and the position of the SERS tetracycline peaks were observed in nine spectra within the same concentration level in Figure 7, confirming the consistent SERS detection across all tetracycline concentration levels. The consistent SERS detection of tetracycline shows the stability of silver colloid nanoparticles when used with milk. This also confirms that storage of the silver colloids for three weeks does not influence SERS tetracycline detection.
The milk peaks (such as 640 and 1133 cm1) and silver colloid peaks (945 cm-1 and 1409 cm1) exhibited no distinct variation in the peak intensity across the seven concentration levels. Two possible reasons can explain the lack of change in peak intensity of the silver colloid in milk solution (in contrast to water solution, which exhibits increasing intensity with decreasing tetracycline concentration). First, the pH of milk is naturally strongly buffered so the concentration of hydrophilic sites in milk remains quite constant. In water, the pH can change with increasing (though low) concentrations of tetracycline HCl. Second, the cyclodextrin binding cavity could be more stable and/or a better fit for adsorption in a more hydrophobic environment.
The peak intensities at 1322 and 1621 cm1 were attenuated with decreasing concentration. The 1621 cm1 peak is not apparent below 0.1 ppm concentration, but the tetracycline peak at 1322 cm1 is detectable to 0.01 ppm. The intensity of the 1322 cm1 peak was correlated with the actual concentration of tetracycline in milk solution. The average peak intensity of 9 spectra at each concentration level and the standard deviation was computed. Figure 8 shows the linear correlation between the 1322 cm1 intensity and tetracycline concentration (R2 = 0.88).

4. Conclusions

This study demonstrates a simple, on-site SERS method for detection of tetracycline residue in bovine milk. A customized portable 785 nm Raman spectroscopic system coupled with silver colloid nanoparticles was used to detect tetracycline in milk and deionized water at concentrations 1000, 500, 100, 10, 1.0, 0.1, and 0.01 ppm. The reproducibility and consistency of silver colloids was assessed by producing six batches with matching spectral peak positions.
The characteristic vibrational modes of tetracycline at 1285, 1317 and 1632 cm−1 in water-tetracycline solution and 1322 and 1621 cm−1 in milk-tetracycline solution consistently appeared after surface-enhancement, but were absent in unenhanced spectra. The peaks at 1317 cm−1 and 1322 cm−1 can detect tetracycline in water-tetracycline solutions and milk-tetracycline solutions at concentrations as low as 0.01 ppm, which is below the MRL set by government authorities. The peak intensities of 1317 and 1322 cm−1 were linearly correlated to the concentrations with correlation coefficients of 0.92 for water and 0.88 for milk. The method developed in this study can field-detect residual concentrations of tetracycline in milk and water. Results serve as a foundation to adopt the method for further research to detect other possible veterinary drugs in animal products.

Author Contributions

Sagar Dhakal and Kuanglin Chao conceived and designed the experiment; Sagar Dhakal and Kuanglin Chao conducted most of the experiments with assistance of Qing Huang in preparing the samples; Sagar Dhakal, Kuanglin Chao and Walter Schmidt analyzed the data, with other co-authors Moon Kim, Jianwei Qin, and C. Leigh Broadhurst also participating in the discussion of the results; Sagar Dhakal and Kuanglin Chao wrote the manuscript.

Conflicts of Interest

The authors declare no conflict of interest.

Disclaimer

Mention of specific products is for identification only and does not imply endorsement by the US Department of Agriculture to the exclusion of other suitable products or suppliers.

References

  1. Chopra, I.; Roberts, M. Tetracycline antibiotics: Mode of action, applications, molecular biology, and epidemiology of bacterial resistance. Microbiol. Mol. Biol. Rev. 2001, 65, 232–260. [Google Scholar] [CrossRef] [PubMed]
  2. Roberts, M.C. Tetracycline resistance determinants: Mechanisms of action, regulation of expression, genetic mobility, and distribution. FEMS Microbiol. Rev. 1996, 19, 1–24. [Google Scholar] [CrossRef] [PubMed]
  3. Schwarz, S.; Roberts, M.C.; Werckenthin, C.; Pang, Y.; Lange, C. Tetracycline resistance in Staphylococcus spp. from domestic animals. Vet. Microbiol. 1998, 63, 217–227. [Google Scholar] [CrossRef]
  4. Levy, S.B. The Antibiotics Paradox: How Miracle Drugs Are Destroying the Miracle; Plenum Press: New York, NY, USA, 1992. [Google Scholar]
  5. Witte, W. Medical consequences of antibiotics use in agriculture. Science 1998, 279, 996–997. [Google Scholar] [CrossRef] [PubMed]
  6. Gwee, M.C.E. Can tetracycline-induced fatty liver in pregnancy be attributes to choline deficiency? Med. Hypotheses 1985, 9, 157–162. [Google Scholar] [CrossRef]
  7. Cinquina, A.L.; Longo, F.; Anastasi, G.; Giannetti, L.; Cozzani, R. Validation of a high-performance liquid chromatography method for the determination of oxytetracycline, tetracycline, chlortetracycline and doxycycline in bovine milk and muscle. J. Chromatogr. A 2003, 987, 227–233. [Google Scholar] [CrossRef]
  8. Andersen, W.C.; Roybal, J.E.; Conzales, S.A.; Turnipseed, S.B.; Pfenning, A.P.; Kuck, L.R. Determination of tetracycline residues in shrimp and whole milk using liquid chromatography with ultraviolet detection and residue confirmation by mass spectrometry. Anal. Chim. Acta 2005, 529, 145–150. [Google Scholar] [CrossRef]
  9. Zwald, A.G.; Ruegg, P.L.; Kaneene, J.B.; Warnick, L.D.; Wells, S.J.; Fossler, C.; Halbert, L.W. Management practices and reported antimicrobial usage on conventional and organic dairy farms. J. Dairy Sci. 2004, 81, 191–201. [Google Scholar] [CrossRef]
  10. Ouderkirk, L.A. Bacillus stearothermopbilus disk assay for detection of residual penicillin in milk: Collaborative study. J. Assoc. Off. Anal. Chem. 1979, 62, 985–988. [Google Scholar] [PubMed]
  11. Mitchell, J.M.; Griffiths, M.W.; McEwen, S.A.; McNab, W.B.; Yee, A.J. Antimicrobial drug residues in milk and meat: Causes, concerns, prevalence, regulations, tests, and test performance. J. Food Prot. 1998, 61, 742–756. [Google Scholar] [CrossRef] [PubMed]
  12. Sundlof, S.F. Drug and chemical residues in livestock. Vet. Clin. N. Am. Food Anim. Pract. 1989, 5, 411–449. [Google Scholar] [CrossRef]
  13. McEwen, S.A.; Meek, A.H.; Black, W.D. A dairy farm survey of antibiotic treatment practices, residue control methods and associations with inhibitors in milk. J. Food Prot. 1991, 54, 454–459. [Google Scholar] [CrossRef]
  14. Paige, J.C. Analysis of tissue residues. FDA Vet. 1994, 9, 4–6. [Google Scholar]
  15. Milk Drug Residue Sampling Survey; Food and Drug Administration: Silver Spring, MD, USA, 2015; p. 10.
  16. Granados-Chinchilla, F.; Rodriguez, C. Tetracyclines in food and feedingstuffs: From regulation to analytical methods, bacterial resistance, and environmental and health implications. J. Anal. Methods Chem. 2017, 2017. [Google Scholar] [CrossRef] [PubMed]
  17. Bilandzic, N.; Kolanovic, S.; Varenina, I.; Jurkovic, Z. Concentrations of veterinary drug residues in milk from individual farms in Croatia. Mljekarstvo 2011, 61, 260–267. [Google Scholar]
  18. Pogurschi, E.; Ciric, A.; Zugrav, C.; Patrascu, D. Identification of antibiotic residue in raw milk samples coming from the metropolitan area of Bucharest. Agric. Agric. Sci. Procedia 2015, 6, 242–245. [Google Scholar] [CrossRef]
  19. Kijak, P.J.; Leadbetter, M.G.; Thomas, M.H.; Thompson, E.A. Confirmation of oxytetracycline, tetracycline and chlortetracycline residues in milk by particle beam liquid chromatography/mass spectrometry. Biol. Mass Spectrom. 1991, 20, 789–795. [Google Scholar] [CrossRef] [PubMed]
  20. Blasco, C.; Corcia, A.D.; Pico, Y. Determination of tetracyclines in multi-specie animal tissue by pressurized liquid extraction and liquid chromatography-tandem mass spectrometry. Food Chem. 2009, 116, 1005–1012. [Google Scholar] [CrossRef]
  21. Wasch, K.D.; Okerman, L.; Croubels, S.; Brabander, H.D.; Hoof, J.V.; Backer, P.D. Detection of residues of tetracycline antibiotics in pork and chicken meat: Correlation between results of screening and confirmatory test. Analyst 1998, 123, 2737–2741. [Google Scholar] [CrossRef] [PubMed]
  22. Samanidou, V.F.; Nikolaidou, S.I.; Papadoyannis, I.N. Laboratory of analytical development and validation of an HPLC confirmatory method for the determination of tetracycline antibiotics residues in bovine muscle according to the European Union regulation 2002/657/EC. J. Sep. Sci. 2005, 28, 2247–2258. [Google Scholar] [CrossRef] [PubMed]
  23. Fritz, J.W.; Zuo, Y. Simultaneous determination of tetracycline, oxytetracycline, and 4-epitetracycline in milk by high-performance liquid chromatography. Food Chem. 2007, 105, 1297–1301. [Google Scholar] [CrossRef]
  24. Okerman, L.; Wasch, K.D.; Hoof, J.V. Detection of antibiotics in muscle tissue with microbiological inhibition tests: Effects of the matrix. Analyst 1998, 123, 2361–2365. [Google Scholar] [CrossRef] [PubMed]
  25. Kurittu, J.; Lonnberg, S.; Virta, M.; Karp, M. A group-specific microbial test for the detection of tetracycline residues in raw milk. J. Agric. Food Chem. 2000, 48, 3372–3377. [Google Scholar] [CrossRef] [PubMed]
  26. Kurittu, J.; Lonnberg, S.; Virta, M.; Karp, M. Qualitative detection of tetracycline residues in milk with luminescence-based microbial method: The effect of milk composition and assay performance in relation to an immunoassay and a microbial inhibition assay. J. Food Prot. 2000, 63, 953–957. [Google Scholar] [CrossRef] [PubMed]
  27. Pikkemaat, M.G.; Dijk, S.O.; Schouten, J.; Rapallini, M.; Egmond, H.J. A new microbial screening method for the detection of antimicrobial residues in slaughter animals: The Nouws antibiotic test (NAT-screening). Food Control 2008, 19, 781–789. [Google Scholar] [CrossRef]
  28. Zhou, L.; Li, D.J.; Gai, L.; Wang, J.P.; Li, Y.B. Electrochemical aptasensor for the detection of tetracycline with multi-walled carbon nanotubes amplification. Sens. Actuators B Chem. 2012, 162, 201–208. [Google Scholar] [CrossRef]
  29. Luo, Y.; Xu, J.; Li, Y.; Gao, H.; Guo, J.; Shen, F.; Sun, C. A novel colorimetric aptasensor using cysteamine-stabilized gold nanoparticles as probe for rapid and specific detection of tetracycline in raw milk. Food Control 2015, 54, 7–15. [Google Scholar] [CrossRef]
  30. Okerman, L.; Croubels, S.; Cherlet, M.; De Wasch, K.; De Backer, P.; Van Hoof, J. Evaluation and establishing the performance of different screening tests for tetracycline residues in animal tissues. Food Addit. Contam. 2004, 21, 145–153. [Google Scholar] [CrossRef] [PubMed]
  31. Peng, Y.; Dhakal, S. Optical methods and techniques for meat quality inspection. Trans. ASABE 2015, 58, 1371–1386. [Google Scholar]
  32. Chao, K.; Dhakal, S.; Qin, J.; Peng, Y.; Schmidt, W.; Kim, M.; Chan, D. A spatially offset Raman spectroscopy method for non-destructive detection of gelatin-encapsulated powders. Sensors 2017, 17, 618. [Google Scholar] [CrossRef] [PubMed]
  33. Dhakal, S.; Chao, K.; Schmidt, W.; Qin, J.; Kim, M.; Chan, D. Evaluation of turmeric powder adulterated with metanil yellow using FT-Raman and FT-IR spectroscopy. Foods 2016, 5, 36. [Google Scholar] [CrossRef] [PubMed]
  34. Dhakal, S.; Qin, J.; Kim, M.S.; Chao, K. Raman Spectroscopy. In Spectroscopic Methods in Food Analysis; Franca, A.S., Nollet, L., Eds.; CRC Press: Boca Raton, FL, USA, 2017; pp. 111–142. [Google Scholar]
  35. Chu, H.; Huang, Y.; Zhao, Y. Silver nanorod arrays as a surface-enhanced Raman scattering for foodborne pathogenic bacteria detection. Appl. Spectrosc. 2008, 62, 922–931. [Google Scholar] [CrossRef] [PubMed]
  36. He, L.; Liu, Y.; Lin, M.; Mustapha, A. Detecting single Bacillus spores by surface enhanced Raman spectroscopy. Sens. Instrum. Food Qual. Saf. 2008, 2, 247–253. [Google Scholar] [CrossRef]
  37. Mecker, L.C.; Tyner, K.M.; Kauffman, J.F.; Arzhantsev, S.; Mans, D.J.; Gryniewicz-Ruzicka, C.M. Selective melamine detection in multiple sample matrices with a portable Raman instrument using SERS-active gold nanoparticles. Anal. Chim. Acta 2012, 733, 48–55. [Google Scholar] [CrossRef] [PubMed]
  38. Lee, K.M.; Herman, T.J. Determination and prediction of fumonisin contamination in maize by surface-enhanced Raman spectroscopy. Food Bioprocess Technol. 2016, 9, 588–603. [Google Scholar] [CrossRef]
  39. Jancr, T.; Valinger, D.; Kljusuric, J.G.; Mikac, L.; Vidacek, S.; Ivanda, M. Determination of histamine in fish by surface enhanced Raman spectroscopy using silver colloid SERS substrates. Food Chem. 2017, 224, 48–54. [Google Scholar]
  40. Zhai, C.; Peng, Y.; Li, Y.; Chao, K. Extraction and identification of mixed pesticides Raman signal and establishment of their prediction models. J. Raman Spectrosc. 2017, 48, 494–500. [Google Scholar] [CrossRef]
  41. Clarke, S.J.; Littleford, R.E.; Smith, W.E.; Goodacre, R. Rapid monitoring of antibiotics using Raman and surface-enhanced Raman spectroscopy. Analyst 2005, 130, 1019–1026. [Google Scholar] [CrossRef] [PubMed]
  42. Mckeating, K.S.; Couture, M.; Dinel, M.P.; Tsodikova, S.G.; Masson, J.F. High throughput LSPR and SERS analysis of aminoglycoside antibiotics. Analyst 2016, 141, 5120–5126. [Google Scholar] [CrossRef] [PubMed]
  43. Xie, Y.; Zhu, X.; Sun, Y.; Wang, H.; Qian, H.; Yao, W. Rapid detection method for nitrofuran antibiotic residues by surface-enhanced Raman spectroscopy. Eur. Food. Res. Technol. 2012, 235, 555–561. [Google Scholar] [CrossRef]
  44. Li, R.; Zhang, H.; Chen, Q.W.; Yan, N.; Wang, H. Improved surface-enhanced Raman scattering on micro-scale Au hollow spheres: Synthesis and application in detecting tetracycline. Analyst 2011, 136, 2527–2532. [Google Scholar] [CrossRef] [PubMed]
  45. Qin, J.; Chao, K.; Kim, M.S. Raman chemical imaging system for food safety and quality inspection. Trans. ASABE 2010, 53, 1873–1882. [Google Scholar] [CrossRef]
  46. Ma, S.; Huang, Q. A SERS study of oxidation of glutathione under plasma irradiation. RSC. Adv. 2015, 5, 57847–57852. [Google Scholar] [CrossRef]
  47. Leypold, C.F.; Reiher, M.; Brehm, G.; Schmitt, M.O.; Schneider, S.; Matousek, P.; Towrie, M. Tetracycline and derivatives-assignment of IR and Raman spectra via DFT calculations. Phys. Chem. Chem. Phys. 2003, 5, 1149–1157. [Google Scholar] [CrossRef]
  48. El-Abassy, R.M.; Eravuchira, P.J.; Donfack, P.; von der Kammer, B.; Materny, A. Fast determination of milk fat content using Raman spectroscopy. Vib. Spectrosc. 2011, 56, 3–8. [Google Scholar] [CrossRef]
  49. Mazurek, S.; Szostak, R.; Czaja, T.; Zachwieja, A. Analysis of milk by FT-Raman spectroscopy. Talanta 2015, 138, 285–289. [Google Scholar] [CrossRef] [PubMed]
  50. Singh, H.; Sharma, R.; Taylor, M.W.; Creamer, L.K. Heat-induced aggregation and dissociation of protein and fat particles in recombined milk. Nederlands Melk en Zuiveltijdschrift 1996, 50, 149–166. [Google Scholar]
  51. Pellon, J.T.; McLean, L.R. Spectroscopic methods for analysis of protein secondary structure. Anal. Biochem. 2000, 227, 167–176. [Google Scholar]
  52. Siddhanta, S.; Narayana, C. Surface-enhanced Raman spectroscopy of proteins: Implications for drug designing. Nanomater. Nanotechnol. 2012, 2, 1–13. [Google Scholar] [CrossRef]
  53. Munro, C.H.; Smith, W.E.; Garner, M.; Clarkson, J.; White, P.C. Characterization of the surface of a citrate-reduced colloid optimized for use as a substrate for surface-enhanced resonance Raman scattering. Langmuir 1995, 11, 3712–3720. [Google Scholar] [CrossRef]
  54. Shirtcliffe, N.; Nickel, U.; Schneider, S. Reproducible preparation of silver sols with small particle size using borohydride reduction: For use as nuclei for preparation of larger particles. J. Colloid Interface Sci. 1999, 211, 122–129. [Google Scholar] [CrossRef] [PubMed]
  55. Iliescu, T.; Baia, M.; Vaclaus, V. A Raman spectroscopic study of the diclofenac sodium-β-cyclodextrin interaction. Eur. J. Pharm. Sci. 2004, 22, 487–495. [Google Scholar] [CrossRef] [PubMed]
  56. Bell, A.F.; Hecht, L.; Barron, L.D. New evidence for conformational flexibility in cyclodextrins from vibrational Raman optical activity. Chem. Eur. J. 1997, 3, 1292–1298. [Google Scholar] [CrossRef]
  57. Das, S.K.; Rajabalaya, R.; David, S.; Gani, N.; Khanam, J.; Nanda, A. Cyclodextrins-the molecular container. Res. J. Pharm. Biol. Chem. Sci. 2013, 4, 1694–1720. [Google Scholar]
  58. Broadhurst, C.L.; Schmidt, W.F.; Kim, M.S.; Nguyen, J.K.; Qin, J.; Chao, K.; Bauchan, G.L.; Shelton, D.R. Continuous gradient temperature Raman spectroscopy of oleic and linoleic acids from −100 to 50 °C. Lipids 2016, 51, 1289–1302. [Google Scholar] [CrossRef] [PubMed]
Figure 1. Schematic of the portable surface-enhanced Raman spectroscopic system.
Sensors 18 00424 g001
Figure 2. Raman spectra of tetracycline hydrochloride powder (a) and whole milk (b).
Sensors 18 00424 g002
Figure 3. SEM image of silver colloid nanoparticles.
Sensors 18 00424 g003
Figure 4. Raman spectra of mean and ±SD of six batches of silver colloids.
Sensors 18 00424 g004
Figure 5. Surface-enhanced Raman spectra of water-tetracycline solution at seven concentration levels.
Sensors 18 00424 g005
Figure 6. Linear relationship between tetracycline peak intensity at 1285 cm1 and its concentration in water. Inset: 0.01 ppm, 0.1 ppm and 1 ppm.
Sensors 18 00424 g006
Figure 7. Surface-enhanced Raman spectra of milk-tetracycline solution at seven concentration levels.
Sensors 18 00424 g007
Figure 8. Linear relationship between tetracycline peak intensity at 1322 cm−1 and its concentration in milk. Inset: 0.01 ppm, 0.1 ppm and 1 ppm.
Sensors 18 00424 g008

