Abstract
Sulfur hexafluoride (SF6) is widely utilized in gas-insulated switchgear (GIS). However, part of SF6 decomposes into different components under partial discharge (PD) conditions. Previous research has shown that the gas responses of intrinsic and 4 Å-type molecular sieve-deposited multi-wall carbon nanotubes (MWNTs) to SOF2 and SO2F2, two important decomposition components of SF6, are not obvious. In this study, a K-type molecular sieve-deposited MWNTs sensor was developed. Its gas response characteristics and the influence of the mixture ratios of gases on the gas-sensing properties were studied. The results showed that, for sensors with gas mixture ratios of 5:1, 10:1, and 20:1, the resistance change rate increased by nearly 13.0% after SOF2 adsorption, almost 10 times that of MWNTs sensors, while the sensors’ resistance change rate with a mixture ratio of 10:1 reached 17.3% after SO2F2 adsorption, nearly nine times that of intrinsic MWNT sensors. Besides, a good linear relationship was observed between concentration of decomposition components and the resistance change rate of sensors.
1. Introduction
Sulfur hexafluoride (SF6), a type of gas with high stability under normal temperature and pressure conditions, is colorless, odorless, non-toxic, and nonflammable. SF6 has become the best electric insulation and arc-quenching medium because of its excellent properties, and for this reason it is widely utilized in the electric power industry [1,2,3,4]. However, under the effect of partial discharge (PD) conditions, SF6 gas inside a gas-insulated switchgear (GIS) decomposes and reacts with infiltrating traces of O2 and H2O and several stable gas byproducts, such as SOF2, SO2F2, SO2, and H2S, are then generated [5,6]. These components are not only difficult to mix with SF6 but they also degrade the insulation performance of SF6. Several decomposition components, such as HF and SO2, can corrode solid insulating materials and metal parts of the equipment. Such corrosion accelerates insulation aging and ultimately leads to sudden failures in GIS.
Numerous GIS internal insulation defects of different types and degrees have been reported [1,2,7]. Research has shown that under the effect of PD caused by different types of defects, SF6 decomposition components vary in type, content, and rate of formation. The research results so far have shown that SO2, H2S, SOF2 and SO2F2 are the four kinds of gases that are detected to possess the largest concentration in the mixed gases resulting from SF6 decomposition, and to some extent the four gases can be considered the characteristic decomposition components [8,9,10,11,12]. Based on the fact that the contents of SO2, H2S, SOF2 and SO2F2 differ largely under different insulation failure conditions, different methods of detecting the four kind of gases have been developed, in order to determine the type of PD inside GIS [13,14].
Among several currently available methods to detect the components of SF6 gas decomposition products, the gas sensor method has the advantages of fast detection speed, high efficiency, and easy access to achieve online monitoring. Gas sensors made of carbon nanotubes (CNTs) possess excellent properties, such as high sensitivity, low energy consumption, fast response, small size, and the ability to operate at room temperature [15,16]. Extensive research on the detection of SF6 decomposition components through the use of carbon nanotube gas sensors is currently being conducted. The detection of SO2 and H2S, two types of important decomposition components of SF6, has been thoroughly investigated. However, studies on the detection of two other types of components, namely, SOF2 and SO2F2, are rare, and no breakthrough progress has been reported [17,18,19,20,21,22,23].
The gas-sensing characteristics of intrinsic carbon nanotube sensors can be improved through deposition of different types and concentrations of molecular sieves. In [23] the authors adopted the 4 Å molecular sieve deposition method and performed gas sensing experiments. The results showed that carbon nanotubes of different concentrations exhibit good sensitivity and selectivity to SO2 and H2S. However, in the current study, the 4 Å molecular sieve-deposited carbon nanotube sensors exhibited almost no sensitivity to SOF2 and SO2F2. Hence, we propose a K-type molecular sieve deposition method to modify multi-walled carbon nanotubes (MWNTs) to achieve improved sensitivity and selectivity, which could lay the foundation for the development of sensors for online detection of SF6 decomposition components.
2. Experimental Section
2.1. Structure and Characteristics of K-Type Molecular Sieve
KDHF-03 zeolite (K-type molecular sieve) is a synthetic and modified molecule sieve used for high-voltage electrical equipment. Its main components are 13X zeolite, 5 Å zeolite and clay. Its chemical formula is Al2O3·4SiO2·xFe2O3·yMgO·nH2O. A molecular sieve is essentially a type of aluminosilicate of which the basic structures are silicon–oxygen tetrahedra and aluminum-oxygen tetrahedra (Figure 1). Two adjacent silicon-oxygen (or aluminum-oxygen) tetrahedra constitute the chamfered octahedral (β cage) by sharing an oxygen atom.
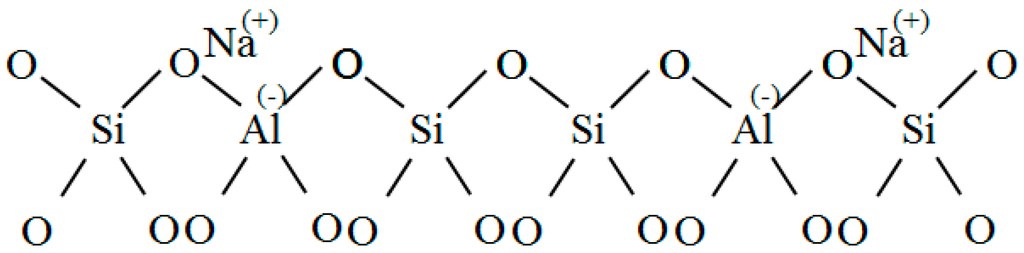
Figure 1.
Tetrahedral framework structure.
X zeolite is composed of cubic crystals; the mole ratio of SiO2/A12O3 in X zeolite is approximately 2.2 to 3.0. The ideal cell of X zeolite is Na86(Al86Si106O384)·264H2O. Each structural unit is composed of eight β cages arranged in a diamond crystal pattern. Adjacent β cages are interconnected by six rings and oxygen bridges. The structure of an X-type molecular sieve is shown in Figure 2.
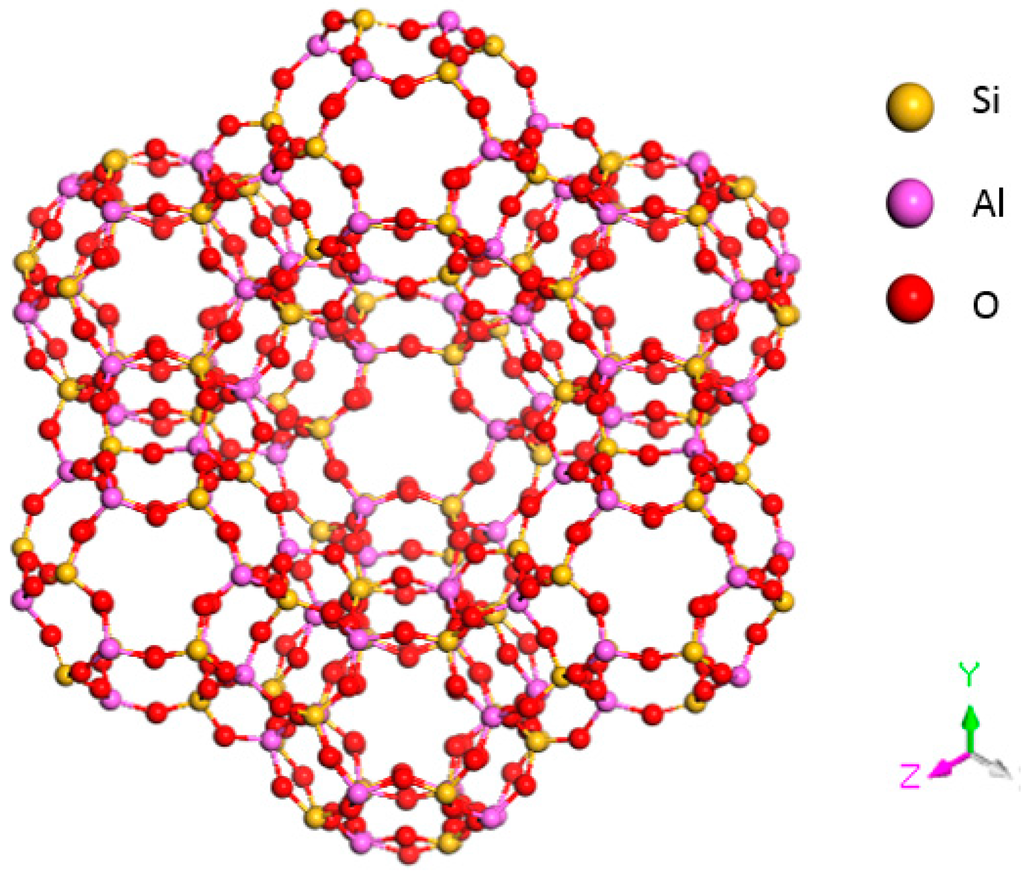
Figure 2.
Structural model of an X-type molecular sieve.
The structure of 4 Å zeolite is similar to that of a NaCl crystal (see Figure 3). Each vertex of the cube has a β cage, and two adjacent β cages are interconnected by four rings through an oxygen bond. Eight β cages connect to form a large α cage in the center.
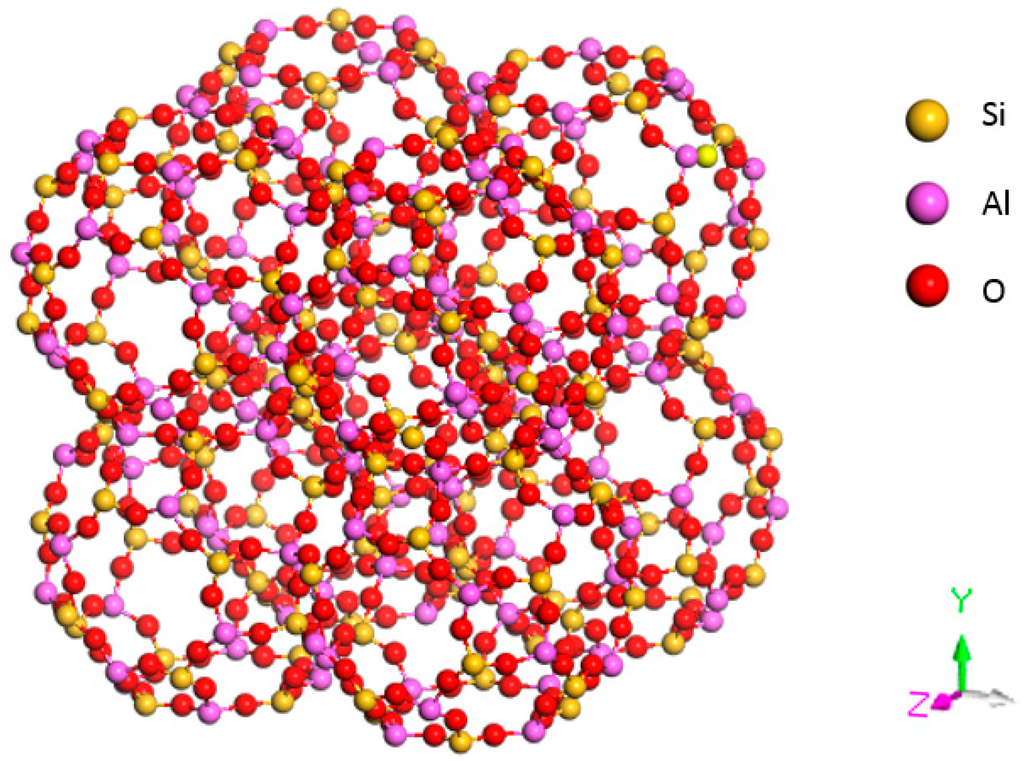
Figure 3.
Structural model of an A-type molecular sieve.
As shown in Figure 1, aluminum is trivalent, and four oxygen atoms surround an aluminum atom in the tetrahedral framework structure of zeolite. The aluminum-oxygen tetrahedron has a negative charge, and the valence electron of an oxygen atom is not neutralized. To maintain charge balance, cations (usually an alkali metal or alkaline earth metal ion) neutralize the negative charge. The metal cations in 4 Å zeolite, which obtained its name because of its effective aperture of 4 Å, are sodium ions. A 5 Å zeolite is obtained by replacing more than 70% of the Na+ with Ca2+ in a 4 Å zeolite based on zeolites’ ion exchange properties. The metal cations in a 5 Å molecular sieve are Ca2+ and Na+. These metal cations and oxygen atoms of the molecular sieve’s skeleton constitute a relatively stable structure. Therefore, such particular zeolite structure possesses a large surface area and a strong surface field. In the tetrahedron, that metal cations and anion skeleton formg dipoles makes it easier for strong polar gases to be adsorbed.
2.2. Preparation of K-Type Molecular Sieve-Deposited MWNT Thin-Film Sensors
The MWNTs in this study are made of black powder, which was purchased from the Chinese Academy of Sciences Chengdu Institute of Organic Chemistry and prepared through chemical vapor deposition. The parameters of the MWNTs are listed in Table 1.

Table 1.
Parameters of MWNTs.
| Diameter (nm) | Length (μm) | Surface area (m2/g) | Purity (wt%) | Residual Catalyst (wt%) | |
|---|---|---|---|---|---|
| MWNTs | 20–30 | 10–30 | >100 | >95 | <1.5 |
KDHF-03 molecular sieves, of which the parameters are shown in Table 2, were purchased from Shanxi Yixiu Co., Ltd. (Xi’an, China).
Table 2.
Technique specification of K molecules.
| Shape | Granularity | Surface Area (m2/g) | Effective Substance Contents (wt%) | Packing Density (g/mL) | |
|---|---|---|---|---|---|
| K zeolite | globular | 3–5 mm | 500 ± 30 | >99.99 | 0.68 |
The MWNTs and molecular sieves were weighed, and different mass ratios of 1:1, 3:1, 5:1, 10:1, and 20:1 were selected. It should be noted that, at different mass ratios, the mass of MWNTs was measured at a certain value of 1 g, in order to obtain mixed solutions with the same concentration of MWNTs. The materials were then dispersed into anhydrous ethanol to prepare 200 mL of mixed solution. After 90 min of stirring with an ultrasonic oscillator, a uniformly dispersed suspension was obtained. A portion of the supernatant (50 mL) was taken out and dispersed in anhydrous ethanol to again prepare 200 mL of mixed solution. The mixed solution was then dispersed for 60 min using an ultrasonic oscillator.
The MWNT sensor substrate is made of printed circuit boards. Copper interdigital electrodes with thickness of 30 µm, width of 1 mm and gap spacing of 1 mm are etched on the substrate, shown in Figure 4. A burette was utilized to place a trace of mixture solution on the surface of the interdigital electrodes. The interdigital electrodes were then placed in an oven at 80°C to create a uniform, dense, smooth film. The film served for the detection of characteristics of the decomposed SF6 components.
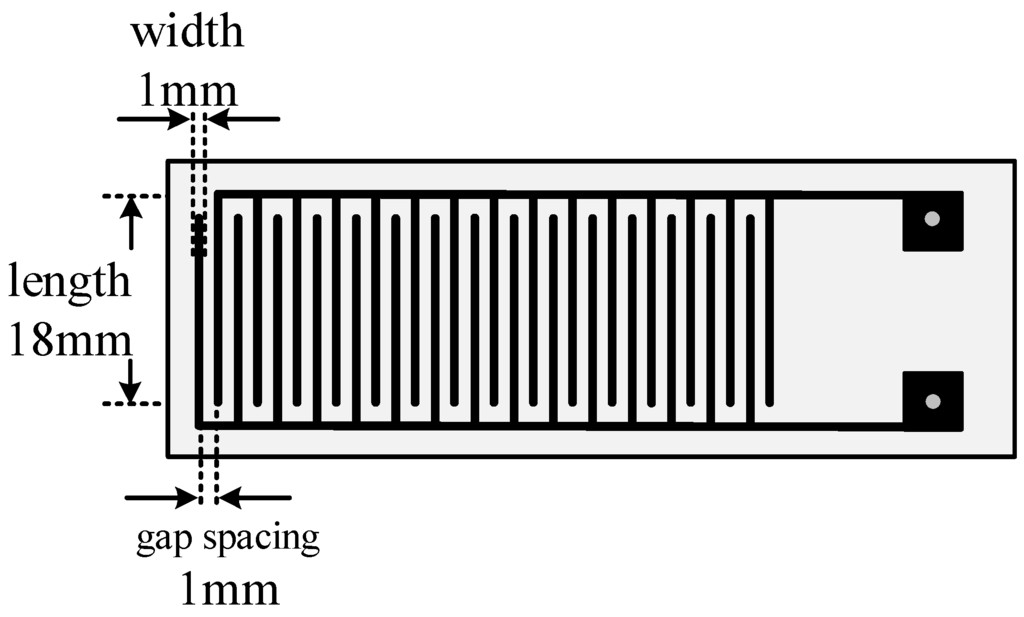
Figure 4.
Diagram of the interdigital electrode structure.
Figure 5 shows X-ray diffraction (XRD) images of intrinsic MWNTs, K-type molecular sieve-deposited MWNTs, and K-type molecular sieve. With 2-Theta ranging from 20° to 50°, there are six characteristic peaks observed in the XRD image of molecular sieve, which appear at the degree of approximately 20°, 22°, 24°, 27°, 31°, and 34°. Correspondingly, the above characteristic peaks at six degrees of approximately 20°, 22°, 24°, 27°, 31°, and 34°, also existed in the XRD spectrum of the mixture of intrinsic MWNTs and K-type molecular sieve. No other obvious characteristic peak is inconsistent between the XRD image of intrinsic MWNTs and XRD image of K-type molecular sieve. This accordance indicates that the K-type molecular sieve was deposited on the MWNTs.
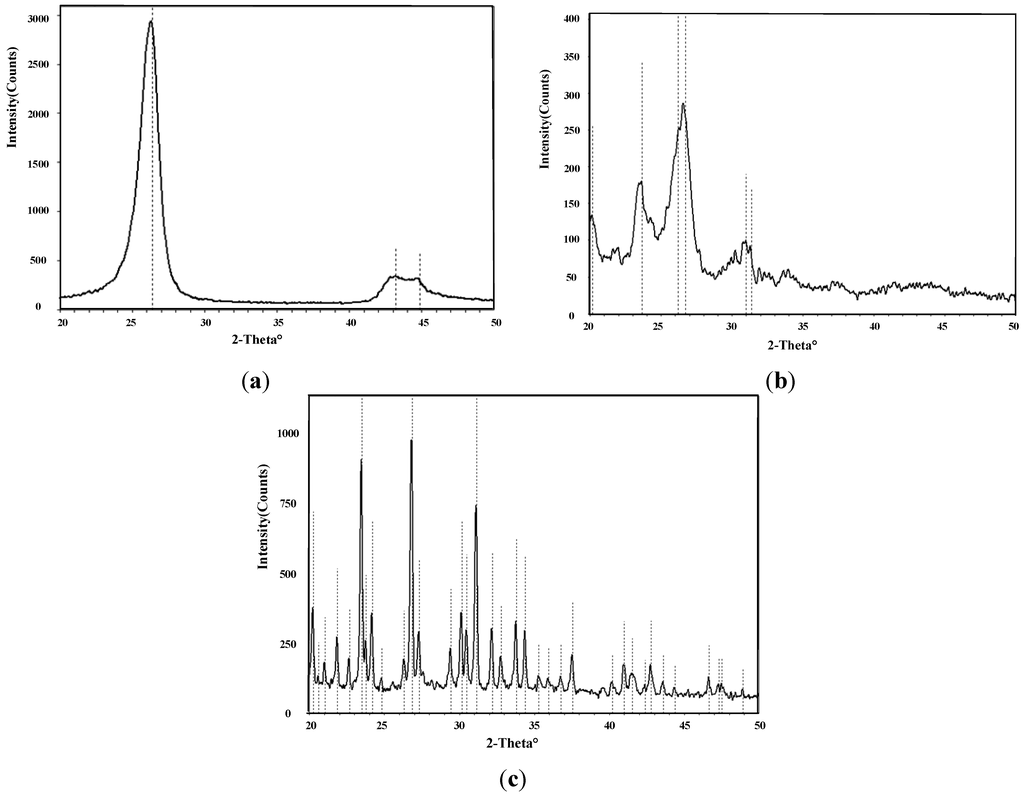
Figure 5.
(a) XRD of MWNTs; (b) XRD of molecular sieve-deposited MWNTs; (c) XRD of K-type molecular sieve.
The infrared absorption spectra method was used to provide additional evidence to estimate whether some molecules were mixed with the intrinsic MWNTs. Figure 6 shows a comparison of the intrinsic and K-type molecular sieve-deposited MWNTs; the comparison was conducted with a Nicolet 5DXCFT-IR infrared spectrometer (Thermo Nicolet Corporation, Madison, WI, USA).
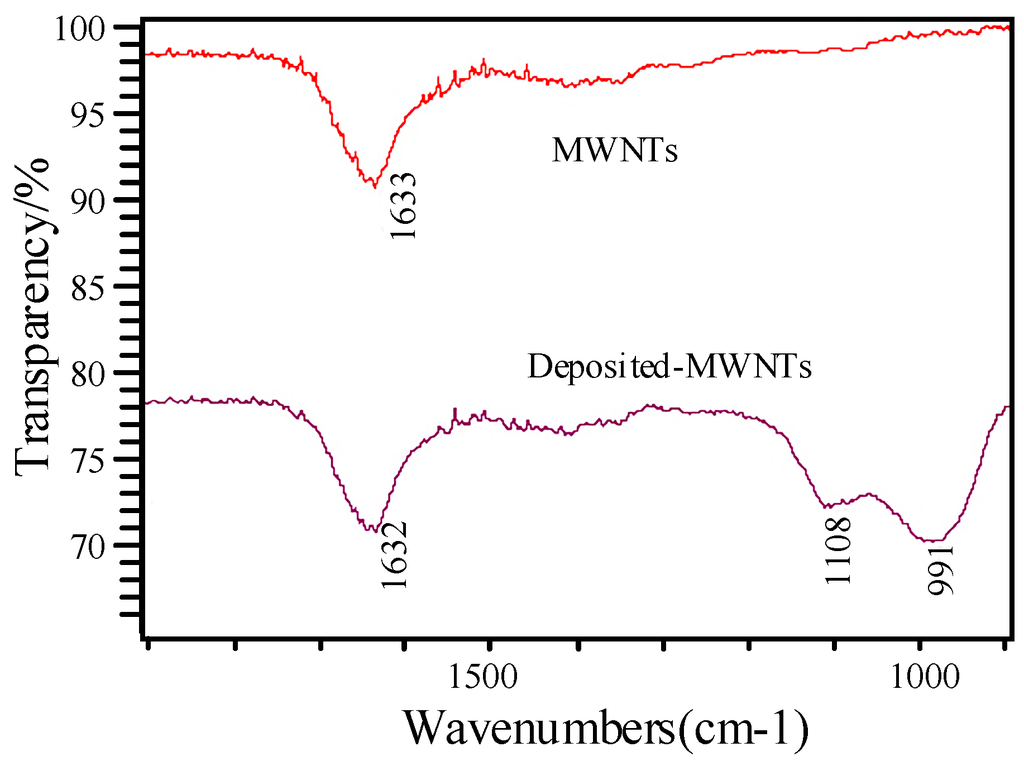
Figure 6.
Infrared absorption spectra of MWNTs and deposited MWNTs.
The infrared spectra in Figure 6 show an evident absorption peak from 1000 cm−1 to 1100 cm−1 in the MWNTs deposited with K-type molecular sieve. The reason for this may be the asymmetric stretching vibration of the tetrahedron in the molecular sieve, which can be treated as supporting evidence that proves the K-type molecular sieve was deposited on the MWNTs.
2.3. Gas Sensing Test Platform
The entire test system includes cylinders, a gas sample compounder, a gas chamber, an air pressure gauge, an inlet/outlet valve, a CHI electrochemical analyzer (Chenhua Instruments Corporation, Shanghai, China), a computer, a vacuum pump, and an exhaust gas treatment device (Figure 7). Two cylinders contain different gases: pure SF6 and some SF6 decomposition component gases (such as SO2, H2S, SOF2, or SO2F2) whose carrier gas are SF6. A gas sample mixer with four inlets is used to obtain different concentrations of gases. The cylinder of pure gas SF6 is connected to the fourth inlet while the cylinder containing SF6 decomposition component gases is connected to any one of inlets 1, 2, and 3. What’s more, there are two knobs to allow the gas mixtures to flow either to the gas chamber or to the tail gas treatment device. The air pressure of cylinders should be controlled at 0.2–0.3 MPa to meet the requirements of gas sample mixer.
Gas sensitivity tests were performed in a sealed gas chamber at atmospheric pressure. An air pressure gauge outside the gas chamber was used to measure the pressure of the gas chamber. The flow rate of the gas mixture output was controlled at 0.2 L/min by the gas sample mixer. The conductivity changes of the sensor were detected with a CHI electrochemical analyzer, and test data were recorded on a computer.
The gas chamber is approximately cylindrical, with a radius of 100 mm, height of 115 mm, and an inner volume of around 3.6 L, which includes the following parts: (1) a gas chamber cover made of glass; (2) an O-shape seal ring; (3) quartz glass cover; (4) gas outlet; (5) vacuum pump; (6) supporting foot; (7) sensor fixation apparatus; (8) digital thermometer; (9) AC voltage regulator; (10) electrochemical analyzer; (11) wiring terminal; (12) flowmeter which plays a subsidiary function; (13) gas inlet; (14) cylinder block; (15) guideway; (16) electrode; (17) mechanical spring; (18) platinized platinum; (19) sensor; (20) ceramic heating plate; (21) square groove. Figure 8 shows the structure of the gas chamber used in the experiment.
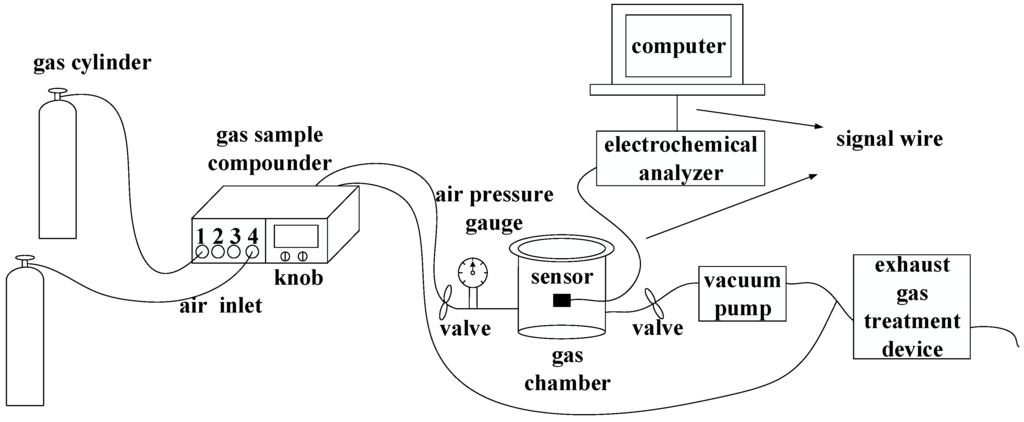
Figure 7.
Schematic of the experimental and testing system.
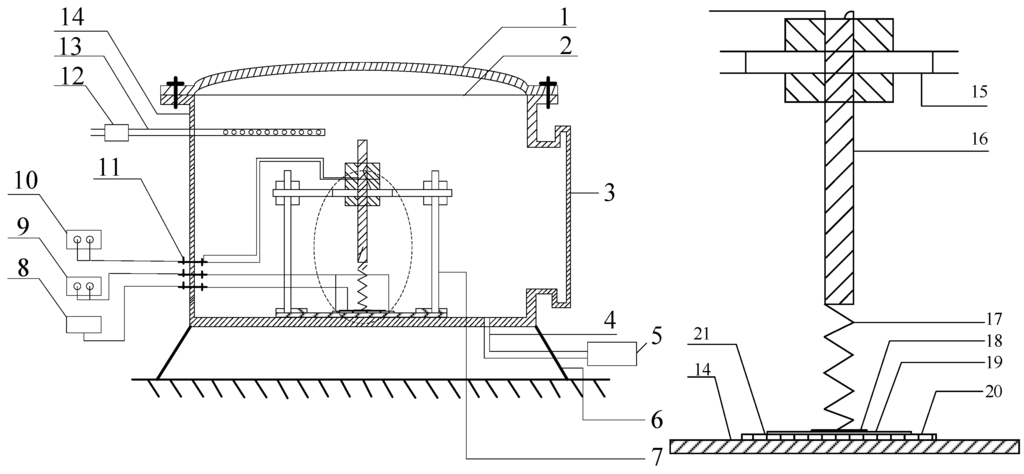
Figure 8.
Schematic diagram of the gas chamber.
The electrochemical analyzer is a common electrochemical measurement system. The CHI600D series instruments employed in the tests integrates many common electrochemical measurement techniques, including constant voltage, constant current, potential scanning, current scanning, potential step, AC impedance, current voltammetry, and other techniques. The real-time resistance of sensors can be directly obtained according to the output files of the CHI600D electrochemical analyzer which measures the impedance of sensors. By setting the sample time and measurement precision, numerous accurate resistance parameters can be obtained. Moreover, using an electrochemical analyzer to collect data avoids errors caused by the inadequate precision of resistance measuring tools, such as impedance analyzers and human eyes.
2.4. Procedures of the Gas-Sensing Test for MWNT Sensors
The experimental steps were as follows:
(1) The test device was checked to confirm that the connections were correct and complete. With the test method of the electrochemical analyzer selected and parameters set, the initial resistance value R0 of the MWNT sensor was recorded.
(2) A gas tightness test was carried out with vacuum gauge and outlet valves open, and the inlet valve closed. The vacuum pump was switched on to pump air from the cylinder. The data display on the vacuum gauge was observed. Thereafter, the gas outlet valve and the vacuum pump were turned off after the cylinder was under vacuum. The number displayed on the vacuum gauge was recorded. After 12 h, the number displayed on the vacuum gauge was recorded again and compared with the previous number. No change indicates good airtightness of the chamber. Afterward, the resistance value R0’ of the MWNT sensor was recorded and compared with R0, which is the resistance value before vacuum pumping. No change indicates that the resistance of the sensor is stable with no zero drift.
(3) The SF6 decomposition products were injected into the sealed chamber through an inlet valve. The resistance values (R) of the MWNT sensor were recorded with an electrochemical analyzer when no change was observed.
(4) When the test was completed, N2 gas was passed into the chamber to ensure that the sensor regained its initial resistance value. After implementing all the steps, test data recording was stopped, and the results were saved. The above steps were repeated to test the other sensors.
3. Results and Discussion
3.1. Characteristic Curves of Gas Sensors
The gas sensitivity of K-type molecular sieve-deposited MWNT gas sensors to the SF6 gas decomposition products (SOF2 and SO2F2) was tested. Before the experiment, the stability of the gas sensors was tested to ensure that no sensor zero drift occurred. All the response diagrams include the action time of MWNT gas sensors on the horizontal axis (the tested gas was pumped into the gas chamber from 0 s), and the resistance change rate of sensors on the vertical axis.
Figure 9 shows the gas response curves of intrinsic and deposited MWNT sensors to SOF2 at a concentration of 100 ppm; the mixture ratios of the sensors are 1:1, 3:1, 5:1, 10:1, and 20:1.
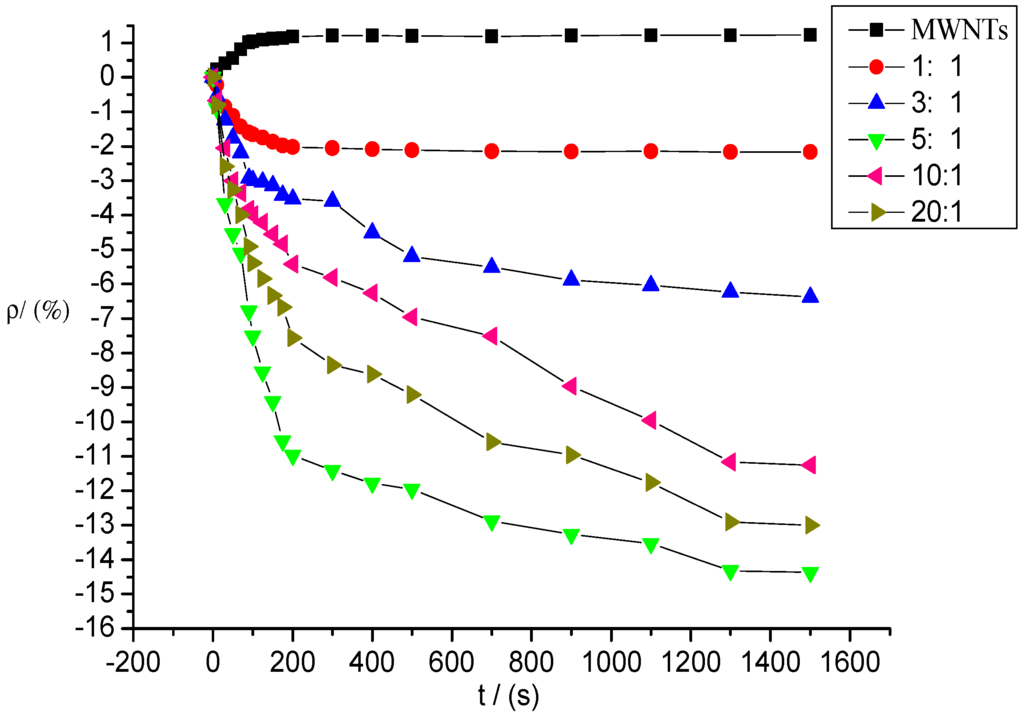
Figure 9.
Response of MWNT sensor to SOF2 at 100 ppm concentration.
As shown in Figure 9, the response curves of the five deposited MWNT sensors began to decline significantly after contact with SOF2 gas. The sensor resistance values began to decrease, whereas the resistance values of the intrinsic MWNT sensors increased. The response curves of the sensors gradually stabilized over time before finally reaching a steady value, that is, the maximum resistance change rate mentioned above. Compared with the intrinsic MWNT sensors, the resistance changes in the K-type molecular sieve-deposited MWNT sensors after SOF2 adsorption were significantly higher. The curves were steeper, and the resistance values decreased more rapidly.
During the detection of SOF2 gas with a concentration of 100 ppm, the resistance of the intrinsic MWNT sensors increased, and the absolute value of resistance change was 1.23%. The absolute values of the gas sensors’ resistance changes produced at different mixture ratios were enhanced at various degrees after SOF2 adsorption. The resistance change rates of sensors with mixture ratios of 1:1, 3:1, 5:1, 10:1, and 20:1 were −2.17%, −6.37%, −14.37%, −11.27%, and −13.0%, respectively. The deposited molecular sieve not only improved the sensitivity of MWNTs to SOF2 gas (the resistance change rate of sensors increased significantly), but also changed the absolute tendency of the resistance change (the resistance values of the deposited sensors decreased, whereas the resistance values of the intrinsic sensors increased). In the deposited sensors, the resistance change rates of sensors at mixture ratios of 5:1, 10:1, and 20:1 increased to 14.37%, 11.27%, and 13%, respectively, which are 10 times that of intrinsic sensors. The response rate was markedly improved when the adsorption property of the deposited MWNT sensors increased significantly.
Similarly, the intrinsic MWNT gas sensors and deposited MWNT sensors whose mixture ratios were 1:1, 3:1, 5:1, 10:1, and 20:1 were utilized to detect SO2F2 gas at a concentration of 100 ppm. Figure 10 shows the gas response curves of these sensors to SO2F2. Similar the SOF2 detection, the gas response curves of the five deposited MWNT sensors began to decline to different degrees after the sensors came into contact with SO2F2. The resistance values of the intrinsic MWNT sensors increased. The response curves of the sensors stabilized gradually over time and finally reached a stable value.
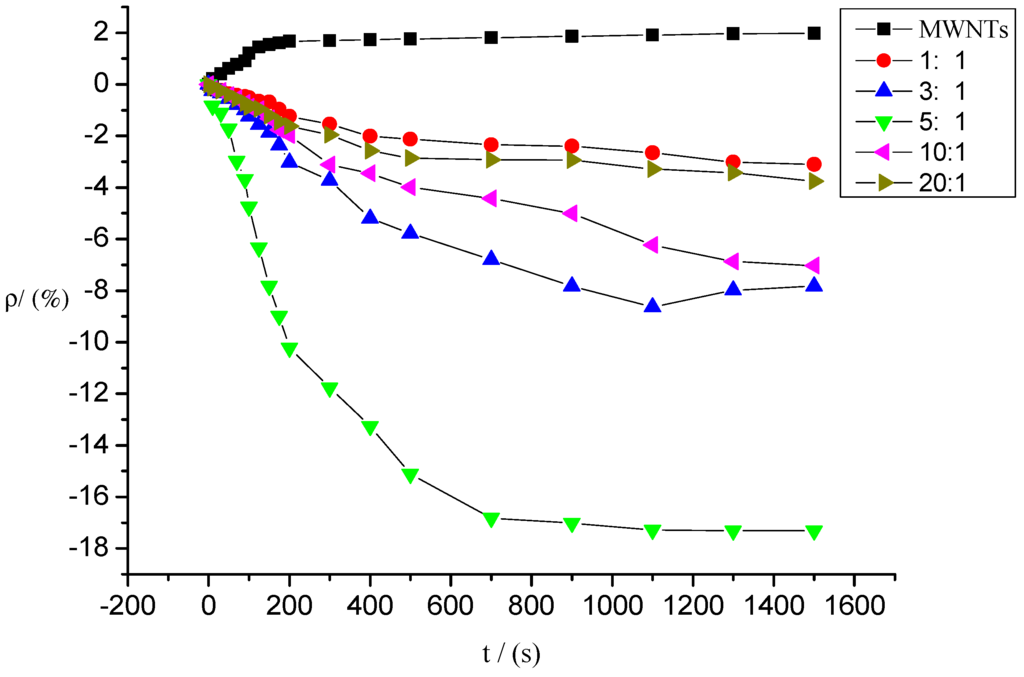
Figure 10.
Response of MWNT sensor to SO2F2 at 100 ppm concentration.
Compared with the intrinsic MWNT gas sensors, the resistance changes in the MWNT gas sensors deposited with K-type molecular sieve were significantly larger, and the resistance values decreased rapidly. Consequently, the response curve to SO2F2 was steeper.
During SO2F2 detection at 100 ppm concentration, the resistance of the intrinsic MWNT sensors increased, and their absolute value changed by 1.98%. The absolute values of gas sensors’ resistance change with different mixture ratios improved to various degrees after SOF2 adsorption. The resistance change rates of sensors with mixture ratios of 1:1, 3:1, 5:1, 10:1, and 20:1 were −2.17%, −6.37%, −14.37%, −11.27%, and −13.0%, respectively. Similar to the results in SOF2 detection, the molecular sieves mixed with MWNTs improved the sensitivity to SO2F2, significantly enhanced the sensors’ resistance change rate, and changed the absolute tendency of the resistance change (i.e., the resistance values of the deposited sensors decreased, whereas the resistance values of the intrinsic sensors increased). In the deposited sensors, the resistance change rate of the MWNT sensors with a mixture ratio of 5:1 showed the largest improvement of 17.32%, which was approximately nine times that of the intrinsic sensors. The adsorption ability and response rate of the MWNT sensors to SO2F2 at a mixture ratio of 10:1 evidently increased.
Figure 9 and Figure 10 show that the response time of deposited carbon nanotubes to SOF2 and SO2F2 was shortened, especially the response time to SO2F2. In terms of resistance change rate and response time, K-type molecular sieve-deposited MWNTs exhibited better response characteristics to SO2F2 and SOF2 than the intrinsic MWNT gas sensors.
3.2. Selectivity of Different Sensors to SOF2 and SO2F2
Figure 9 and Figure 10 reveal that large differences exist among the responses of different sensors to SOF2 and SO2F2. The gas-sensing response of sensors with different mixture ratios to SOF2 and SO2F2 is shown in Figure 11. The resistance change rate of the sensor with a mixture ratio of 5:1 was considerably larger than that of the sensor with other mixture ratios after SO2F2 adsorption. Furthermore, the resistance change rates of sensors whose mixture ratios were 5:1, 10:1, and 20:1 showed similar values after SOF2 adsorption. Based on this property, we conclude that gas sensors with different mixture ratios can be utilized to better distinguish the two types of gases.
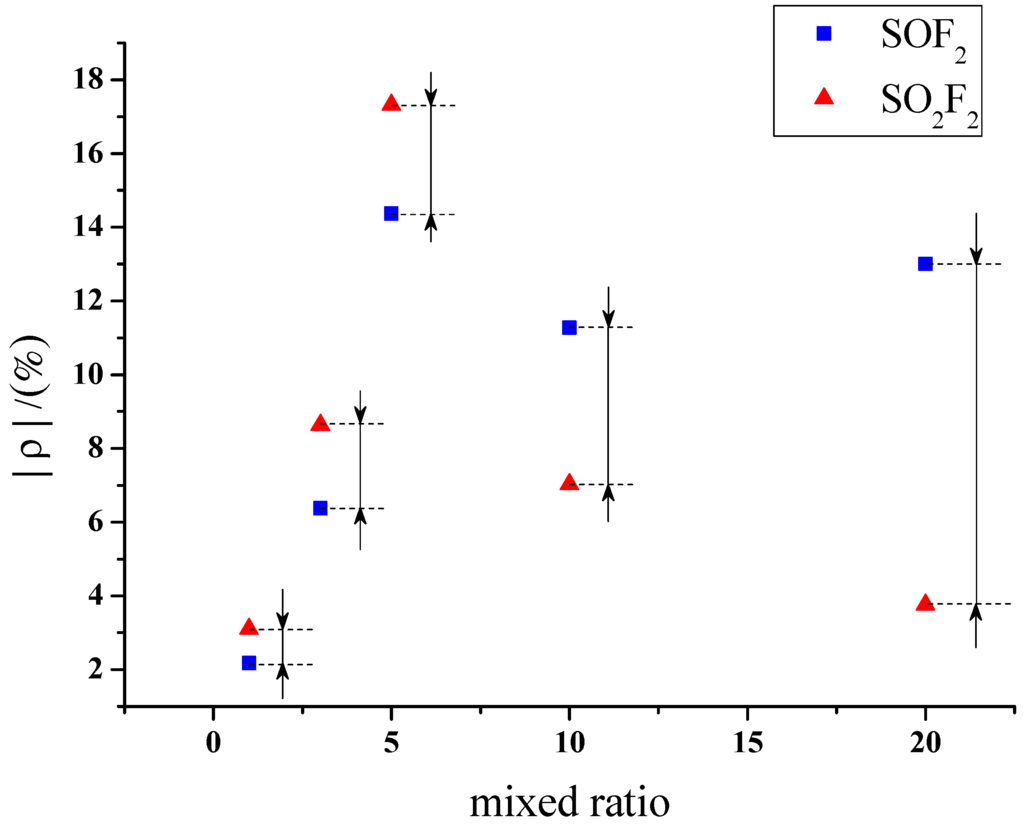
Figure 11.
Response of MWNT sensor to SOF2 and SO2F2.
Accordingly, sensors with a mixture ratio of 20:1 were selected to detect SOF2 and SO2F2 at 100 ppm concentration. The results were then analyzed. K-type molecular sieve is an adsorbent dedicated to SF6 high-voltage equipment; therefore, its ability to adsorb SF6 can be regarded as extremely weak, and the influence of SF6 as background gas can be neglected. Figure 12 shows that the resistance change rates of K-type molecular sieve-deposited sensors to SOF2 and SO2F2 at 100 ppm were 13% and 3.7%, respectively. Previous research has shown that 4 Å molecular sieve-deposited sensors exhibit almost no sensitivity to SOF2 and SO2F2 (0.37% and 0.51%, respectively). A comparison of the sensitivity of both K-type and 4 Å-type molecular sieve-deposited MWNT sensors to SOF2 and SO2F2 is shown in Figure 12.
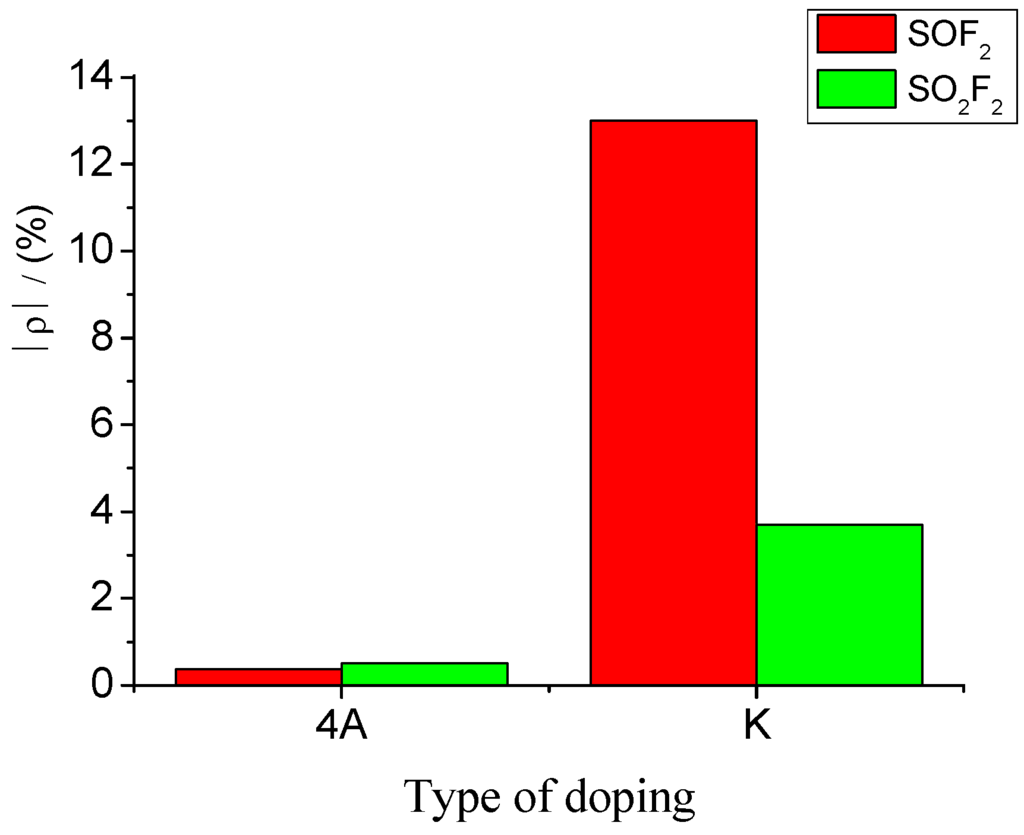
Figure 12.
Gas-sensing selectivity of MWNT sensors to SOF2 and SO2F2.
The results illustrate that compared with 4 Å-type molecular sieve deposition, K-type molecular sieve deposition can obviously improve gas sensitivity of carbon nanotube sensors to SOF2 and SO2F2. Furthermore, sensors with a mixture ratio of 20:1 possess good selectivity towards SOF2; this advantage is suitable for SOF2 detection.
3.3. MWNT Sensor Response to SOF2 and SO2F2 at Different Concentrations
According to the analytical results presented in Section 3.3, sensors with mixture ratios of 20:1 and 5:1 were selected to detect SOF2 and SO2F2 at different concentrations, respectively, so that the relationship between resistance change rate of gas sensors and gas concentration could be investigated.
Sensors with a mixture ratio of 20:1 were utilized to detect SOF2 at different concentrations of 10, 25, 50, 70, and 100 ppm. The response curves are shown in Figure 13. The resistance change rates of sensors to SOF2 at these five concentrations were approximately −1.03%, −2.23%, −4.81%, −6.71%, and −13.0%, respectively.
A certain relationship between gas concentration and change rate of sensor’s resistance can be inferred from Figure 13. The data were linearly fitted with SOF2 gas concentration as the independent variable and resistance change rate of the gas sensor as the dependent variable. The fitting curve is shown in Figure 14. The fitting function is y= 0.128x − 1.012, and the linear correlation coefficient (R2) equals 0.941.
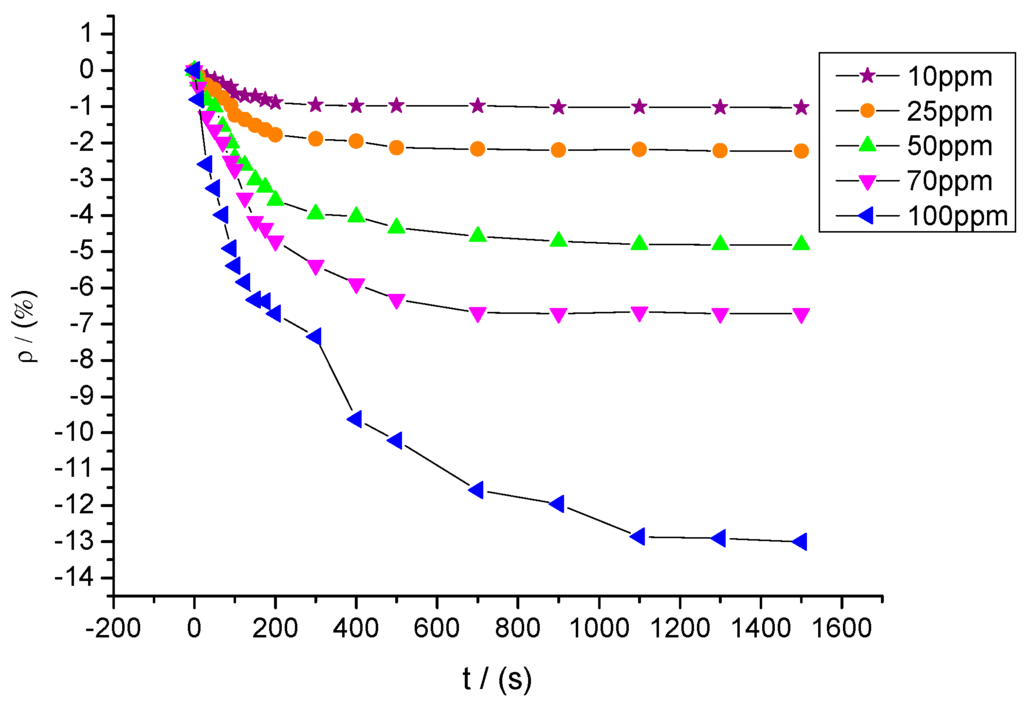
Figure 13.
Gas-sensing response of MWNT sensors to different concentrations of SOF2.
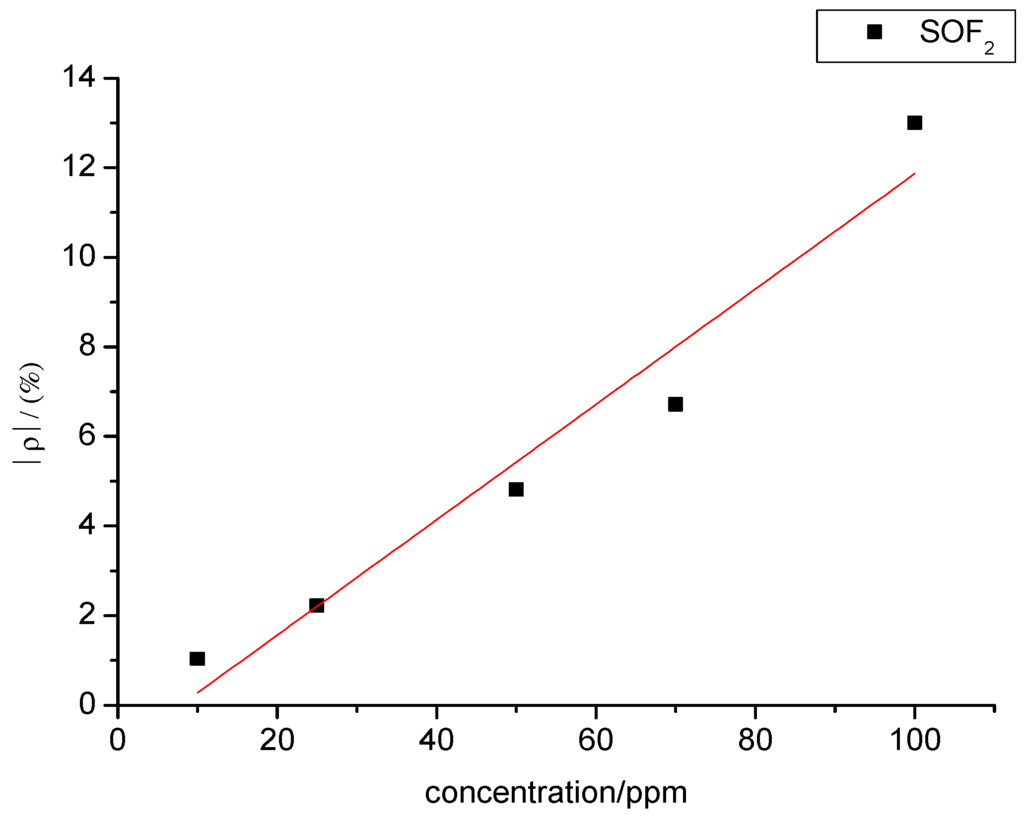
Figure 14.
Linear relationship in the gas-sensing response of MWNT sensors to different concentrations of SOF2.
Figure 15 shows the response curves of sensors with a mixture ratio of 5:1 to SO2F2 at different concentrations of 10, 25, 50, 70, and 100 ppm. The resistance change rates of sensors to SO2F2 at these five concentrations were approximately −1.65%, −3.91%, −8.05%, −11.42%, and −17.32%.
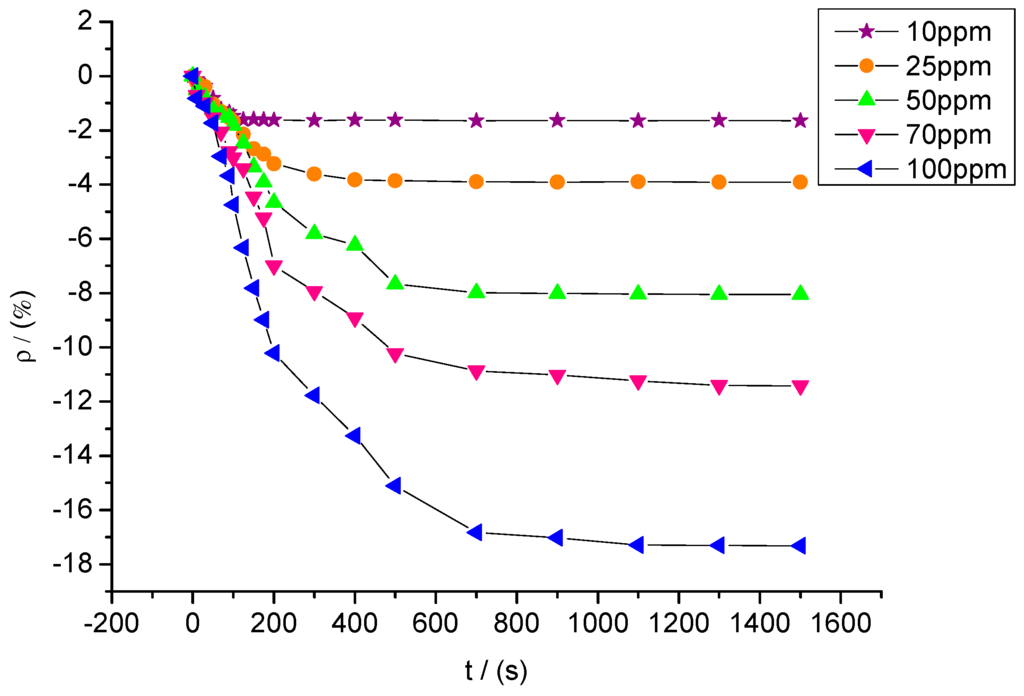
Figure 15.
Response of MWNT sensors to different concentrations of SO2F2.
Likewise, a certain relationship was observed between SO2F2 gas concentration and sensor resistance change rate. The experimental data were linearly fitted, and the fitting curve between SO2F2 gas concentration and resistance change rate of the gas sensors is shown in Figure 16. The fitting function is y= 0.173x − 0.378, and R2 equals 0.996.
Figure 14 and Figure 16 show that SOF2 and SO2F2 concentrations and sensor resistance change rates are linearly associated with each other when the concentration ranges from 10 ppm to 100 ppm. Therefore, gas concentration can be inferred based on the resistance change rate of the sensor.
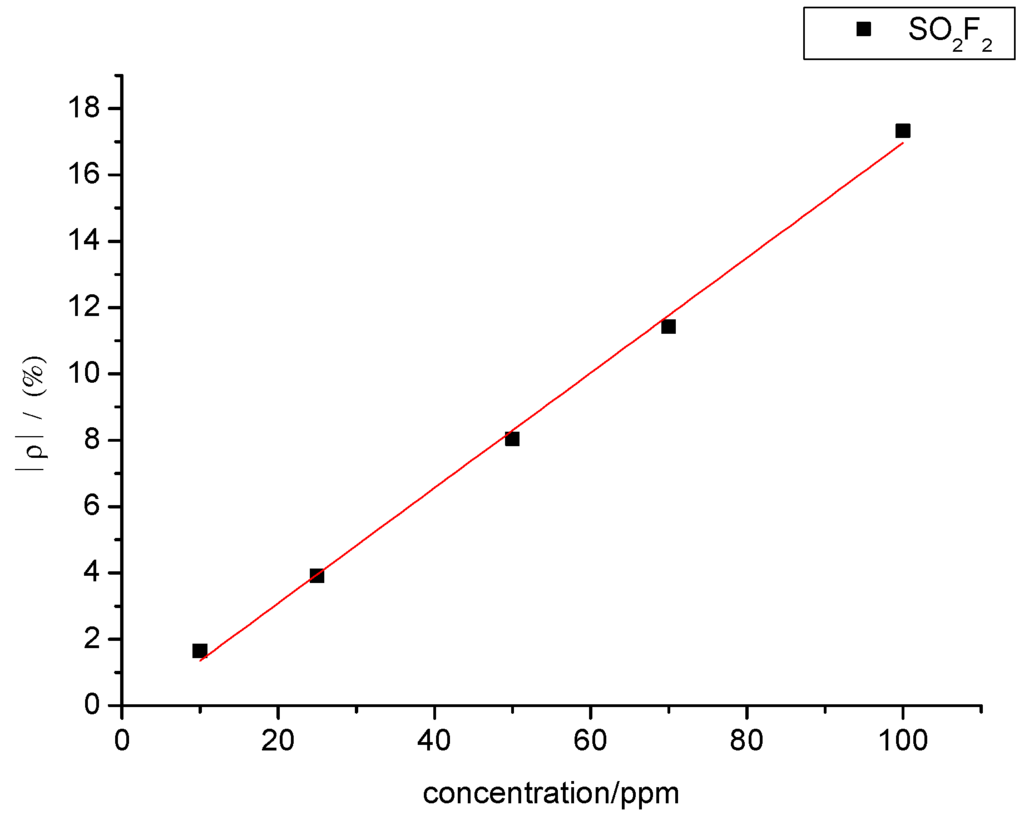
Figure 16.
Linear relationship in the gas-sensing response of MWNT sensors to different concentrations of SO2F2.
3.4. Desorption and Repeatability Test for the MWNT Sensors
To investigate the stability and recovery properties of K-type molecular sieve-deposited MWNT gas sensors, the sensor with a mixture ratio of 5:1, which had been operating for five months, was selected as the research object. The sensor’s gas-sensing property was investigated through repeated experiments. The specifications of UV light exposure are a power of 8 W, wavelength of 365 nm, duration of 15 min, light intensity 3.5 mW·cm−2. For illustration, the sensor’s response and recovery curves to SO2F2 are on the same coordinate system. The gas sensitivity test to SO2F2 was repeated three times according to the experimental methods and procedures presented in Section 2.4. The result is shown in Figure 17.
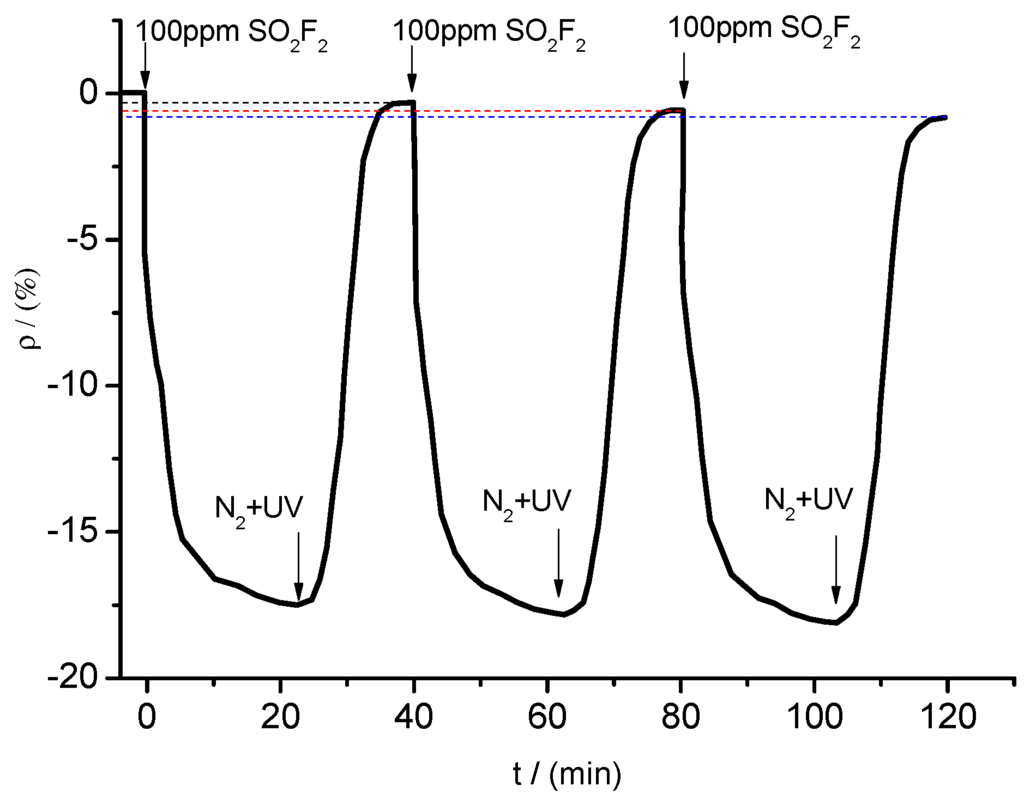
Figure 17.
Response and recovery curves.
When SO2F2 at a concentration of 100 ppm was pumped into the chamber, the resistance of the sensor changed obviously and eventually reached a stable value (fluctuating around a certain resistance value). After injection of N2 and UV light irradiation of the tested sensor, its resistance increased rapidly, eventually stabilizing close to its initial value. However, as the times of repeatability increased, the resistance value cannot reach exactly the initial value. The resistance change rate were in sequence of −0.302%, −0.584% and −0.819% for three times. The resistance change trends shown in Figure 17 show that desorption processes, such as N2 treatment and UV light irradiation, enabled the sensor’s resistance value to return to a certain value around the initial value. During the test, the resistance change trends remained similar for at least three times. Moreover, the maximum change rate remained similar and stable. Therefore, the gas sensor may be used repeatedly to detect gases with good stability and reproducibility.
3.5. Response Mechanism of MWNT Gas-Sensitive Sensors
As can be concluded from the above figures, the adsorption of intrinsic MWNTs to SOF2 and SO2F2 was very weak, which can be explained by the fact that no electron transfer occurs between intrinsic MWNTs and SOF2, or SO2F2. The adsorption process should be considered as physical adsorption in which van der Waals’ force plays the main part. The resistance of intrinsic MWNTs increased by approximately 2% because SOF2 and SO2F2 are gases possessing oxidizing capacity. As a result, the adsorption on MWNTs will restrict the electron transfer on the surface of MWNTs, causing decreasing amount of charge carrier and increase of sensor’s resistance.
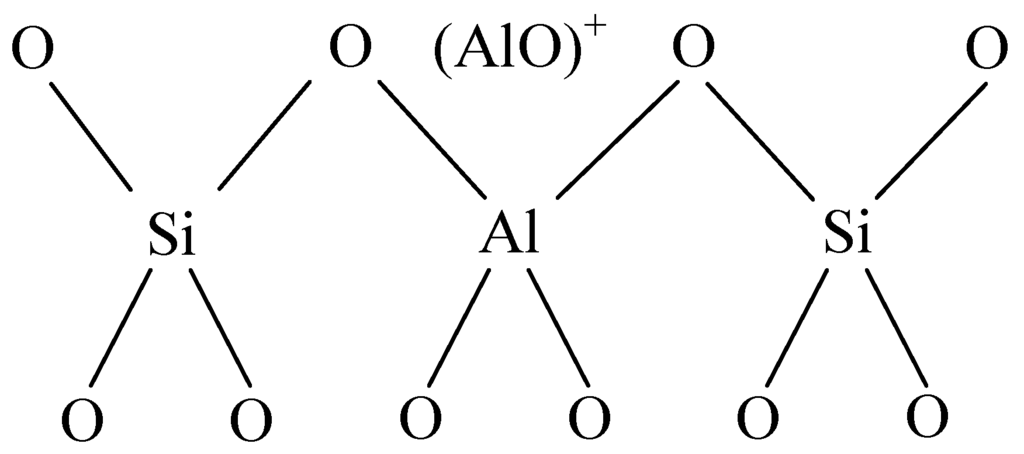
Figure 18.
Framework structure of the acidity center.
The resistance of sensors, however, dropped after the decomposition of K-type molecular sieve, which was considered to be caused by the acidic properties due to aluminum atoms and aluminum ions from the framework and pores of the molecular sieve. Aluminum ions outside the framework can strengthen the acidity because aluminum ions which take the three-coordination break away from framework and exist in the empty space in the form of (AlO)+ or (AlO) P+, which can be seen in Figure 18, and thus an acidity center can be produced [24], which makes it easier for electrons to transfer from SOF2 and SO2F2 to the deposited MWNTs. Besides, the porous structure of K-type molecular sieve with a specific surface area ranging from 500 m2/g to 1000 m2/g, which is larger than that of MWNTs, provides more effective adsorption sites and a larger surface area. Generally speaking, increases of both surface area and adsorption sites are in favor of the permanence of gas molecular on the surface of MWNTs, thus promoting more interaction between gas molecules and the surface of the sensors.
Furthermore, the gas-sensing differences of K-type molecular sieve-deposited MWNTs to SOF2 and SO2F2 were also discussed. Based on the analysis above, electron transfer from gases to sensors occurs during the adsorption period. Compared with SO2F2, SOF2 possesses a weak oxidizing ability. That is to say, easier electron transfer from SOF2 to sensor may happen compared with that of SO2F2. According to the bond character of the sulfur atoms of SOF2 and SO2F2, the S of SOF2 can interact easier with C=O and C=OH groups on the surface of MWNTs introduced during the process of preparation in anhydrous ethanol. Therefore, the sensor has a stronger adsorption effect on SOF2 than SO2F2.
The experimental results of 4 Å-type molecular sieve-deposited MWNTs sensors showed almost no adsorption to SOF2 and SO2F2 while K-type molecular sieve-deposited ones showed good gas-sensing characteristics were also investigated. Preliminary interpretation was that, the main components of K-type molecular are 13X zeolite and 5 Å zeolite, which is different from 4 Å zeolite in microcosmic structures, more preciously, interconnection pattern of β cages varies, which needs to be dissected in following research.
In conclusion, compared with intrinsic MWNTs, the adsorption capacity and charge transfer ability of K-type molecular sieve-deposited MWNT sensors to SOF2 and SO2F2 was greatly improved. The deposited sensors performed well in terms of sensitivity and response rate. The enhancements in the sensitivity of the deposited MWNT sensors to SOF2 and SO2F2 also facilitated the low-concentration detection of these two gases. This finding is of great significance for the preparation of sensor arrays detecting early defects in SF6 gas-insulated equipment.
It should be noted that the above mechanistic discussions based on the characteristics of materials used in the experiments are still speculative, and the analysis should be considered more empirical. Therefore, a separate, detailed investigation of the sensing mechanism is essential and will be part of another manuscript. More detailed investigations are necessary for an elaborate explanation of the experimental phenomena.
4. Conclusions
(1) This paper focused on the detection of SF6 decomposition products. The 4 Å-type molecular sieve-deposited carbon nanotubes exhibited good sensitivity and selectivity to SO2 and H2S. However, these nanotubes demonstrated almost no response to SOF2 and SO2F2. Moreover, the gas-sensing response of intrinsic carbon nanotubes to SOF2 and SO2F2 were unapparent. Therefore, K-type molecular sieve-deposited carbon nanotube sensors of different mixed ratios were prepared. Gas-sensing experiments were conducted to detect two important characteristic components, namely, SOF2 and SO2F2.
(2) The resistance change rates of the K-type molecular sieve-deposited MWNT gas sensors to SOF2 and SO2F2 increased considerably. In addition, the response time was shorter compared with that of the intrinsic MWNTs. The gas concentrations of SOF2 and SO2F2 and the sensors’ resistance change rates exhibited a good linear relationship.
(3) The sensitivity responses of sensors deposited with different mixture ratios to SOF2 and SO2F2 were different from each other. Based on their sensing property, gas sensors with different mixture ratios were prepared to investigate the selectivity to the two types of gases. The adsorption capacity of sensors with mixture ratios of 5:1, 10:1, and 20:1 to 100 ppm of SOF2 increased significantly, whereas the adsorption capacity and response speed of MWNT sensors with a mixed ratio of 10:1 to 100 ppm of SO2F2 were enhanced.
(4) UV light was utilized to desorb residual gas molecules from the gas sensors; such light can be used to avoid chemical poisoning and prolong the sensor service time, so the sensors can be stored well and utilized repeatedly.
Acknowledgments
We gratefully acknowledge financial support from the National Natural Science Foundation of China (51277188), the research project of State Key Laboratory of Power Transmission Equipment & System Security and New Technology (No. 2007DA10512713207), the program for China New Century Excellent Talents (NCET-12-0590) and project No. 0213005202042 supported by the Fundamental Research Funds for the Central Universities, in China.
Author Contributions
Xiaoxing Zhang designed the project, directed the research and modified the manuscript. Xin Li, Chenchen Luo and Xingchen Dong performed the experiments and wrote the manuscript. Lei Zhou modified the manuscript.
Conflicts of Interest
The authors declare no conflict of interest.
References
- Suehiro, J.; Zhou, G.; Hara, M. Detection of partial discharge in SF6 gas using a carbon nanotube-based gas sensor. Sens. Actuators B Chem. 2005, 2, 164–169. [Google Scholar] [CrossRef]
- Kurte, R.; Heise, H.M.; Klockow, D. Quantitative infrared spectroscopic analysis of SF6 decomposition products obtained by electrical partial discharges and sparks using PLS-calibrations. J. Mol. Struct. 2001, 565, 505–513. [Google Scholar] [CrossRef]
- Christophorou, L.G.; Olthoff, J.K. Electron interactions with SF6. J. Phys. Chem. Ref. Data 2000, 29, 267–330. [Google Scholar] [CrossRef]
- Beyer, C.; Jenett, H.; Kfockow, D. Influence of reactive SFX gases on electrode surfaces after electrical discharges under SF6 atmosphere. IEEE Trans. Dielectr. Electr. Insul. 2000, 7, 234–240. [Google Scholar] [CrossRef]
- Zhang, X.X.; Liu, W.T.; Tang, J.; Xiao, P. Study on PD detection in SF6 using multi-wall carbon nanotube gas sensor. IEEE Trans. Dielectr. Electr. Insul. 2010, 17, 838–844. [Google Scholar]
- Piemontesi, M.; Niemeyer, L. Sorption of SF6 and SF6 Decomposition Products by Activated Alumina and Molecular Sieve 13X. In Proceedings of the IEEE International Symposium on Electrical Insulation, Montreal, QC, Canada, 16–19 June 1996.
- Guidelines for the Checking and Treatment of Sulfur Hexafluoride (SF6) Taken from Electrical Equipment and Specification for its Re-Use; IEC Webstore: Geneva, Switzerland, 2004.
- Tang, J.; Zeng, F.; Pan, J.; Zhang, X.; Yao, Q.; He, J.; Hou, X. Correlation analysis between formation process of SF6 decomposed components and partial discharge qualities. IEEE Trans. Dielectr. Electr. Insul. 2013, 20, 864–875. [Google Scholar] [CrossRef]
- Tang, J.; Zeng, F.; Zhang, X.; Pan, J.; Qiu, Y.; Liu, Y.; Yuan, J. Relationship between decomposition gas ratios and partial discharge energy in GIS, and the influence of residual water and oxygen. IEEE Trans. Dielectr. Electr. Insul. 2014, 21, 1226–1234. [Google Scholar] [CrossRef]
- Tang, J.; Zeng, F.; Zhang, X.; Pan, J.; Qiu, Y.; Liu, Y.; Yuan, J. Influence regularity of trace O2 on SF6 decomposition characteristics and its mathematical amendment under partial discharge. IEEE Trans. Dielectr. Electr. Insul. 2014, 21, 105–115. [Google Scholar] [CrossRef]
- Tang, J.; Liu, F.; Meng, Q.; Zhang, X.; Tao, J. Partial discharge recognition through an analysis of SF6 decomposition products part 2: Feature extraction and decision tree-based pattern recognition. IEEE Trans. Dielectr. Electr. Insul. 2012, 19, 37–44. [Google Scholar] [CrossRef]
- Tang, J.; Liu, F.; Zhang, X.; Meng, Q.; Zhou, J. Partial discharge recognition through an analysis of SF6 decomposition products part 1: decomposition characteristics of SF6 under four different partial discharges. IEEE Trans.Dielectr. Electr. Insul. 2012, 19, 29–36. [Google Scholar] [CrossRef]
- Zhang, X.; Tie, J.; Zhang, J. A Pt-doped TiO2 nanotube arrays sensor for detecting SF6 decomposition products. Sensors 2013, 12, 14764–14776. [Google Scholar] [CrossRef] [PubMed]
- Zhang, X.; Zhang, J.; Jia, Y.; Xiao, P.; Tang, J. TiO2 nanotube array sensor for detecting the SF6 decomposition product SO2. Sensors 2012, 12, 3302–3313. [Google Scholar] [CrossRef] [PubMed]
- Jung, D.; Han, M.; Lee, G.S. Gas sensor using a multi-walled carbon nanotube sheet to detect hydrogen molecules. Sens. Actuators A Phys. 2014, 211, 51–54. [Google Scholar] [CrossRef]
- Zhang, X.; Yang, B.; Liu, W.; Zhang, J. Detection of Partial Discharge in SF6 Decomposition Gas Based on Modified Carbon Nanotubes Sensors. Procedia Eng. 2012, 29, 4107–4111. [Google Scholar] [CrossRef]
- Qi, P.; Vermesh, O.; Grecu, M. Toward large arrays of multiplex functionalized carbon nanotube sensors for highly sensitive and selective molecular detection. Nano Lett. 2003, 3, 347–351. [Google Scholar] [CrossRef]
- Shivani, D.; Neena, J.; Rashi, N. Functionalized multiwalled carbon nanotubes based hydrogen gas sensor. Sens. Actuators A Phys. 2013, 201, 321–327. [Google Scholar] [CrossRef]
- Ding, W.; Hayashi, R.; Suehiro, J.; Zhou, G.; Imasaka, K.; Hara, M. Calibration methods of carbon nanotube gas sensor for partial discharge detection in SF6. IEEE Trans. Dielectr. Electr. Insul. 2006, 13, 353–361. [Google Scholar] [CrossRef]
- Ding, W.; Hayashi, R.; Ochi, K.; Suehiro, J.; Imasaka, K.; Hara, M.; Sano, N.; Nagao, E.; Minagawa, T. Analysis of PD-generated SF6 decomposition gases adsorbed on carbon nanotubes. IEEE Trans. Dielectr. Electr. Insul. 2006, 13, 1200–1207. [Google Scholar] [CrossRef]
- Zhang, X.; Yang, B.; Wang, X.; Luo, C. Effect of Plasma Treatment on Multi-Walled Carbon Nanotubes for the Detection of H2S and SO2. Sensors 2012, 12, 9375–9385. [Google Scholar] [CrossRef] [PubMed]
- Zilli, D.; Bonelli, P.R.; Cukierman, A.L. Room temperature hydrogen gas sensor nanocomposite based on Pd-decorated multi-walled carbon nanotubes thin films. Sens. Actuators B Chem. 2011, 157, 169–176. [Google Scholar] [CrossRef]
- Zhang, X.; Luo, C.; Tang, J. Sensitivity Characteristic Analysis of Adsorbent-Mixed Carbon Nanotube Sensors for the Detection of SF6 Decomposition Products under PD Conditions. Sensors 2013, 13, 15209–15220. [Google Scholar] [CrossRef] [PubMed]
- He, Z.; Dai, Z.; Long, J. Formation and Structural Characteristics of Acidic Centers of Silica-Alumina Catalyst. Acta Pet. Sin. 2011, 1, 11–19. [Google Scholar]
© 2015 by the authors; licensee MDPI, Basel, Switzerland. This article is an open access article distributed under the terms and conditions of the Creative Commons Attribution license (http://creativecommons.org/licenses/by/4.0/).