Abstract
Yueqing Bay in China supports important marine resources that sustain local fisheries and food security, but increasing anthropogenic pressures and natural environmental changes threaten its biodiversity. This study used morphological identification, COI DNA barcoding, and 12S DNA metabarcoding to assess ichthyoplankton composition and fish spawning patterns. A total of 13,415 eggs and 17,291 larvae were collected using horizontal and vertical plankton nets. Morphological analysis identified 58 taxa, while molecular methods detected 21 species (COI) and 48 species (12S), with an overall total of 105 species from 78 genera and 42 families. Spawning activity showed clear seasonal and spatial patterns, with the highest abundance and diversity in spring and summer, particularly around Ximen Island and the Bay mouth. These areas function as key spawning and nursery grounds. 12S DNA metabarcoding contributed strongly to species detection, especially for cryptic and morphologically indistinguishable larvae, complementing traditional surveys. The findings provide essential baseline information for monitoring fish stocks, protecting critical habitats, and improving fishery management strategies under increasing anthropogenic and climate-related pressures in Yueqing Bay.
1. Introduction
Yueqing Bay in China supports abundant marine and coastal resources that contribute to the local economy [1]. However, its location within a densely populated area makes it highly vulnerable to human activities. The bay is increasingly threatened by combined anthropogenic and environmental pressures, placing its marine and coastal [2]. Overfishing, pollution, land reclamation, aquaculture expansion, agriculture, and coastal development are among the anthropogenic disturbances expected to drive continued declines in wild coastal fish stocks in China [3,4,5,6]. The loss of marine biodiversity is one of the most serious environmental issues in the 21st century [7,8], raising international concern due to its impacts on ecosystem services, livelihoods, food security, and economic prosperity [9]. These concerns underscore the need for precautionary measures to protect marine ecosystems and restore fishery resources.
Addressing these issues requires effective assessment and monitoring of aquatic environments, supported by appropriate management plans [10,11]. Traditional methods face limitations, especially for the early life stage, because eggs and larvae are small, cryptic, and often morphologically similar. These challenges hinder accurate identification and comprehensive biodiversity assessments [12,13]. Nevertheless, new molecular techniques, such as DNA barcoding and metabarcoding [14,15,16,17], have revolutionized the field and allowed for the cost-effective, quick, and precise monitoring and assessment of fish across all their life stages [8,18,19,20,21]
DNA barcoding, using a short mitochondrial sequence of the first subunit of mitochondrial Cytochrome C oxidase (COI) gene [12,22], is widely accepted as the practical and standardized tool for identifying and delineating animal species throughout their life stages [20]. This is because it utilizes the suitable level of existing nucleotide polymorphisms in the gene [20,23]. DNA metabarcoding, on the other hand, offers a potentially speedy and low-cost tool for biodiversity assessment and monitoring that maximizes accurate species identification with minimal sampling effort [24]. By using short DNA segments, it can quantify, detect, and identify various taxa of aquatic species in complex samples [21,25,26,27,28]. Thus, molecular techniques enable researchers to discriminate between morphologically identical and cryptic species and provide reliable data on fish eggs and larvae, aiding management and conservation efforts. The aim of this study was to provide a comprehensive and multi-method assessment of the ichthyoplankton community in Yueqing Bay to support conservation and management efforts. This included characterizing the species composition and diversity of fish eggs and larvae using a combination of morphological identification, COI barcoding, and 12S metabarcoding; describing spatial and seasonal patterns of spawning activity to identify key spawning and nursery areas; and evaluating how morphological and molecular approaches complement one another for ichthyoplankton monitoring in a coastal marine system.
2. Materials and Methods
2.1. Study Area
Yueqing Bay is one of the four major bays along the Zhejiang coast [29]. It lies between 27°59′09″ and 28°24′26″ N, and 120°57′55″ and 121°17′09″ E (Figure 1), positioned on the southern coast of Zhejiang Province and directly north of the Oujiang River estuary [30]. The bay is semi-enclosed and strongly influenced by tidal mixing, river discharge, and seasonal monsoon patterns, which together shape its hydrology and the distribution of marine organisms. Shallow waters, mudflats, estuarine channels, and adjacent islands form a mosaic of habitats that support spawning, nursery, and feeding grounds for many coastal fish species. The surrounding region has undergone rapid urbanization and industrial expansion since the 1980s, leading to notable declines in water quality and increased ecological pressure [2]. Despite these challenges, Yueqing Bay remains an ecologically important area, sustaining fisheries, aquaculture activities, and coastal communities. Its combination of environmental gradients, high biological productivity, and anthropogenic stressors makes it a key location for studying ichthyoplankton dynamics and coastal ecosystem change.
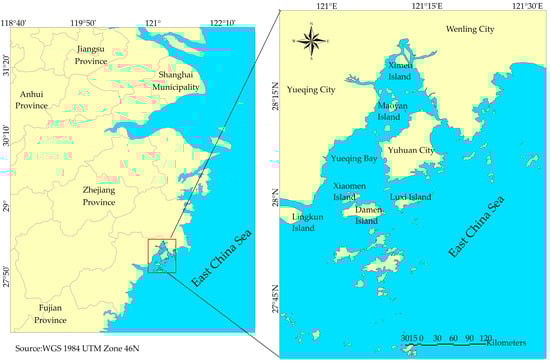
Figure 1.
Study area showing Yueqing Bay and the surrounding coastline, and the location of the bay in Zhejiang, China.
2.2. Marine Survey and Sample Collection
Plankton samples were collected at twenty different stations, i.e., Y1–Y20 (Figure 2), across all four seasons from May 2016 to May 2017, using a shallow horizontal planktonic net and a vertical drag trawl net (trawl for 10 min at a ship speed of 1–2 km/h). For sampling, a digital flow meter was installed at the net port to measure density (Ind./100 m3). Fish eggs and larvae were separated from other plankton samples and preserved in separate jars with 100% ethanol based on sampling stations and season. Using the morphological characteristics outlined by [31], all fish eggs and larvae were identified to the lowest possible taxonomic level under a Nikon SMZ800 (Tokyo, Japan) dissecting microscope equipped with a camera.
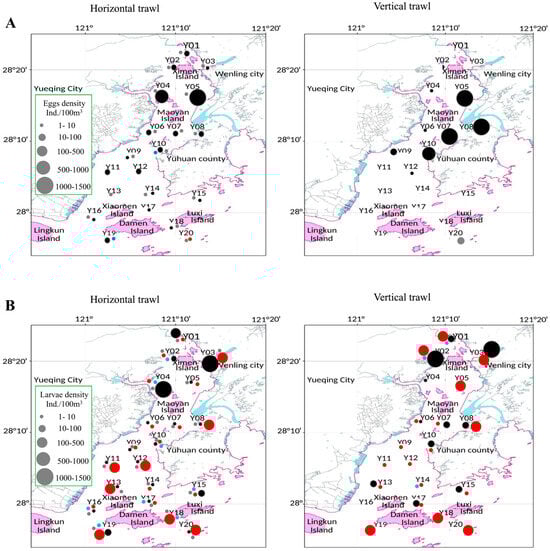
Figure 2.
Spatial-temporal distribution of ichthyoplankton in Yueqing Bay: (A) = Fish eggs and (B) = Fish larvae. Each sampling season is indicated with a specific color: Black = Spring, Red = Summer, Gray = Autumn, and Blue = Winter. The size of the circle reflects the density of eggs in a specific site.
2.3. DNA Extraction
Samples collected in summer from 13 stations (Y01, Y02, Y03, Y04, Y05, Y06, Y07, Y08, Y09, Y10, Y11, Y15, and Y18) were used for 12S DNA metabarcoding analysis. In contrast, samples from other sampling stations and seasons were used for DNA barcoding due to lower egg and larval abundance per jar, making them unsuitable for metabarcoding under the available budget. Genomic DNA from fish eggs and larvae was extracted using the DNeasy® Blood and Tissue Kits (Qiagen, Valencia, CA, USA). DNA quality was verified on a 1% agarose gel in 1X TAE buffer, stained with DNA Green fluorescent dye, and analyzed using a Gel Imaging System (Tanon Science & Technology Co., Ltd., Shanghai, China).
2.4. PCR and DNA Sequencing
The universal primers, FishF1 and FishR1 as described by [22], were used to amplify ~600 bp of the COI gene. The PCR was performed in a 25 μL reaction mixture containing 8.5 μL sterile H2O, 12.5 μL GoTaq® Green MasterMix (Promega Inc., Madison, WI, USA), 1 μL of each primer, and 2 μL of template DNA. The thermal cycling condition included a preliminary denaturation step at 95 °C for 2 min, followed by 35 cycles of denaturation (95 °C, 30 s), annealing (50 °C, 30 s), and extension (72 °C, 60 s), with a final extension at 72 °C for 10 min. Amplification success was verified by running the PCR products on a 1.5% agarose gel in 1X TAE buffer. Staining was performed with a fluorescent DNA dye, and visualization was conducted using a Gel Imaging System. The confirmed COI amplicons were sent for Sanger sequencing at Sangon Biotech Cooperation Ltd. (Shanghai, China).
12S DNA metabarcoding was performed by LC-Bio Ltd. (Hangzhou, Zhejiang, China) on 13 composite samples. Approximately 100 bp of the 12S gene were amplified using primers teleo_F_L1848 and teleo_R_H1913 following [21], with library preparation and sequencing on the Illumina MiSeq PE300 platform (San Diego, CA, USA).
2.5. Data Analyses
2.5.1. Morphology Analyses
Surfer® v.28.4.300 was used to generate 2D graphs for assessing spatial and temporal distribution patterns of eggs and larvae. Abundance was quantified as density (D = N/V), where N represents the number of eggs or larvae per sample, and V denotes the filtration volume, with results expressed as individuals per cubic meter. Species dominance was evaluated based on percentage composition, with the species having the highest proportion considered dominant per sampling period and region. Seasonal differences in egg and larval densities were tested using one-way ANOVA with season as the fixed factor. When ANOVA indicated significant effects, Tukey HSD tests were applied to identify pairwise differences among seasons. Spatial variation was examined using a separate one-way ANOVA among locations (Ximen Island, Maoyan Island, Xiaomen Island, Damen Island, and Luxi Island) as the fixed factor. For this analysis, sampling stations surrounding each island were pooled to represent a single spatial unit. All density values were square root transformed to reduce variance heterogeneity, and model assumptions were assessed through inspection of residuals. Statistical significance was considered at p ≤ 0.05.
2.5.2. DNA Barcoding Analyses
COI DNA sequences assembled using Sequencher v.4.8 (Gene Codes), and the final alignments were performed using BioEdit v.7.0.4.1 [32]. The number of haplotypes and polymorphic sites was determined using DnaSP v.5.0 [33]. Sequence divergence was calculated using the Kimura 2-parameter (K-2-P) distance model [34] in MEGA v.5.0 [35]. A neighbor-joining (NJ) tree was constructed with 10,000 bootstrap replicates to depict the relationships among the sequence taxa visually. BLASTN search 2.6.0+ [36], an algorithm on the NCBI database, was used to compare the unknown sequences with known reference sequences deposited in GenBank. It should be noted that reliance on public reference databases such as GenBank may introduce limitations, as some sequences could be misidentified or absent, potentially affecting species-level identifications.
2.5.3. DNA Metabarcoding Analyses
12S DNA metabarcoding analyses were performed using MacQIIME v1.9.1. [37], according to the workflow described by [38]. All MiSeq raw data were received in FASTQ format and preprocessed by trimming barcodes and adapter sequences. Paired-end reads were merged using FLASH v1.2.11 [39], and the merged reads were quality-filtered with Trimmomatic [40] by removing sequences with more than 5% ambiguous bases, ≥20% low-quality bases, or insufficient length. Read quality was checked using FastQC v. 0.12.1 [41]. Clean reads were imported into the QIIME pipeline (MacQIIME v1.9.1), and low-quality sequences were removed. Reads were then demultiplexed based on nucleotide barcodes using split_libraries_fastq.py, and clustered into OTUs at ≥97% similarity with CD-HIT via pick_otus.py. For both markers, representative sequences for each OTU were selected with pick_rep_set.py. Taxonomic assignment was performed by comparing these sequences against custom 12S and Cyt b reference databases built following the method in [38]. Assignments were generated with assign_taxonomy.py using a minimum identity threshold of 95% and a maximum e-value of 0.001. OTU tables were constructed using make_otu_table.py, and singletons were removed with filter_otus_from_otu_table.py. Species-level summaries were generated with summarize_taxa_through_plots.py. A phylogenetic tree was built after aligning and filtering representative sequences in QIIME. Community structure was assessed using within-community (alpha) and between-community (beta) diversity metrics. Alpha diversity (Shannon, Simpson, Chao1) was calculated with alpha_diversity.py. Beta diversity among sampling sites and months was evaluated using Bray–Curtis distances and visualized through principal coordinate analysis using beta_diversity_through_plots.py and make_2d_plots.py.
All identifications (morphology, COI, and 12S) were then compiled into a single presence–absence table, where each row represented a taxon, and each column represented an identification method. Taxon names were standardized to ensure consistency across methods. The three datasets were then merged based on matched taxon names to determine which taxa were uniquely detected by one method and which were shared among methods. This integrated dataset formed the basis for evaluating agreement among approaches and was visualized using a Venn diagram to summarize overlapping and non-overlapping detections.
3. Results
3.1. Morphological Identification of Species Composition and Spawning Activities
A total of 13,415 eggs and 17,291 larvae were collected using horizontal and vertical trawls.
Horizontal trawls accounted for 13,175 eggs and 16,894 larvae, while vertical trawls yielded 240 eggs and 397 larvae. The highest abundance and diversity of eggs and larvae were observed in the northern part of the Bay, near Ximen Island, during spring (Table 1). Morphological identification classified the ichthyoplankton into 58 distinct taxa, comprising 18 egg morphotypes from 5 orders and 9 families, and 40 larval morphotypes from 9 orders and 23 families. Among these, 44 were identified to species level, 7 to genus level, and 7 to family level. These identification levels apply to the combined dataset of eggs and larvae and are detailed in (Supplementary Table S1). Additionally, 1% of the total number of eggs (approximately 134 of 13,175 eggs) were morphologically unidentified.

Table 1.
Number of species, eggs, and larvae in Yueqing Bay collected in Spring, Summer, Autumn, and Winter of 2016 and 2017.
Sciaenidae, Gobiidae, Engraulidae, Trichiuridae, and Lateolabracidae emerged as the most common families within Yueqing Bay. Eggs of Larimichthys crocea (12,648) accounted for 96% of the total annual eggs in horizontal trawling (seasonal average density: 612.96 ind./100 m3), while larvae of Gobiidae (10,745) comprised 63.6% of annual larvae (seasonal average density: 485.81 ind./100 m3). In vertical trawls, L. crocea eggs (219) made up 91.25% of annual eggs (seasonal average density: 886.54 ind./100 m3), and Gobiidae larvae (289) represented 72.8% of annual larvae (average density: 1085.19 ind./100 m3) (Figure 3).
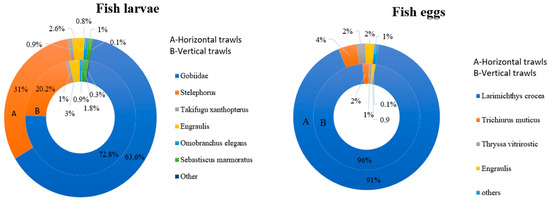
Figure 3.
Species composition of dominant fish taxa in Yueqing Bay revealed from morphological analysis of fish eggs and fish larvae.
Seasonal and spatial trends showed that spring had the highest densities, followed by summer, with Ximen Island and the Bay mouth consistently acting as hotspots (Figure 2). In spring, average densities per horizontal trawl were 125.17 ind./100 m3 (eggs) and 72.25 ind./100 m3 (larvae); for vertical trawls, 187.11 ind./100 m3 (eggs) and 234.59 ind./100 m3 (larvae). In summer, egg density was 0.02 ind./100 m3 horizontal, none in vertical, and larval densities were 83.11 ind./m3 in horizontal and 84.36 ind./m3 in vertical. In autumn, egg density was sparse (0.50 ind./m3 in horizontal; 0.79 ind./m3 in vertical), with larvae (0.43 ind./m3 horizontal; 0 vertical). In winter, eggs were rare (0.02 ind./m3 in horizontal samples and 0 in vertical samples), and larval densities were 0.26 ind./m3 horizontal; 5.03 ind./m3 vertical.
ANOVA analysis indicated significant seasonal variation in egg density (F = 18.6, p = 0.0041) and larval density (F = 12.3, p = 0.0019). Tukey HSD tests showed that spring had significantly higher egg and larval densities than summer, autumn, and winter (p = 0.002 for eggs and p = 0.006 for larvae). Summer larval density was also higher than in autumn and winter (p = 0.02). ANOVA further showed significant spatial variation in egg density (F = 17.9, p = 0.0034) and larval density (F = 11.7, p = 0.0029). Tukey HSD tests indicated that Ximen Island had significantly higher egg and larval densities compared with Maoyan, Xiaomen, Damen, and Luxi Islands (p = 0.0026 for eggs and p = 0.0066 for larvae).
3.2. Molecular Identification of Species Composition and Spawning Activities
3.2.1. COI DNA Barcoding Results
Sixty ichthyoplankton DNA samples (35 larvae, 25 eggs) were successfully sequenced, yielding 624 bp COI partial sequences and 41 haplotypes (Table 2). These contained 290 polymorphic sites (268 parsimony-informative, 22 singleton). NJ phylogenetic analysis identified 21 distinct species, with each clade supported by 99% bootstrap values (Figure 4). Mean K-2-P distances were 0.001–0.006 within species and 0.131–0.329 between species, confirming species-level resolution. Gobiidae species were widespread year-round, with spring dominated by Eupleurogrammus sp., Setipinna tenuifilis eggs, and L. crocea and L. polyactis larvae; autumn by Lateolabrax maculatus eggs and Stolephorus commersonnii larvae; and winter by Mugil cephalus larvae (Table 2).
Table 2.
Species of fish eggs and larvae, specific haplotype belonging to specific species, sampling station, and season. Values in parentheses indicate the number of egg or larvae samples belonging to a specific haplotype. For Sampling seasons S = Spring, W = Winter, and A = Autumn.
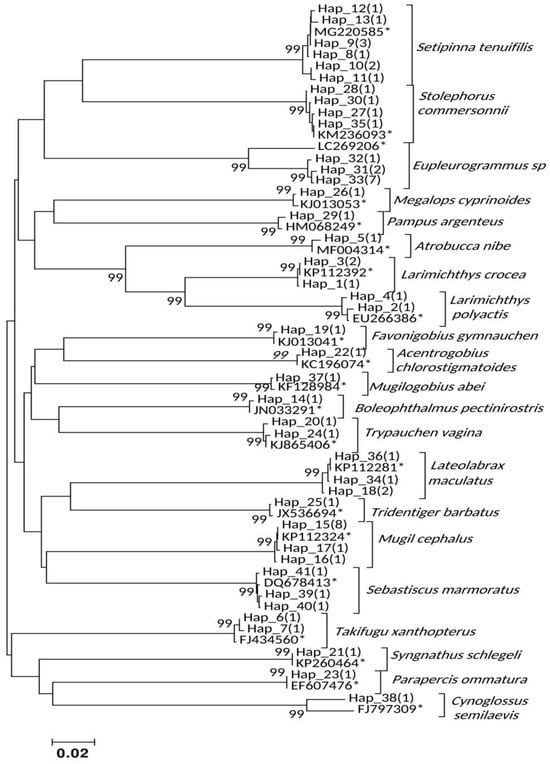
Figure 4.
NJ clustering for the COI haplotypes of ichthyoplankton identified from Yueqing Bay. The values ≥ 99% shown at the nodes represent the statistical supports derived from 10,000 bootstrapping permutations. Asterisk (*) indicates a GenBank accession code of a reference sequence. Values in parentheses indicate the number of ichthyoplankton samples belonging to a specific haplotype.
3.2.2. 12S DNA Metabarcoding Results
The 12S analysis produced 282,870 reads, with 255,337 high-quality reads retained after preprocessing (average fragment length < 200 bp, GC content 44.23%). These yielded 201 operational taxonomic units (OTUs), representing 48 fish species from 43 genera, 23 families, and 18 orders (Figure 5; Supplementary Table S1). Dominant families were Gobiidae (62.6%), Ogcocephalidae (30.8%), and Pristigasteridae (5.8%). Coelophrys brevicaudata (30.8%), Acentrogobius sp. (17.4%), Boleophthalmus pectinirostris (12.3%), and Gillichthys seta (10.6%) were most abundant. Species richness peaked at Y08, followed by Y02, with highest diversity near Ximen Island and the Bay mouth.
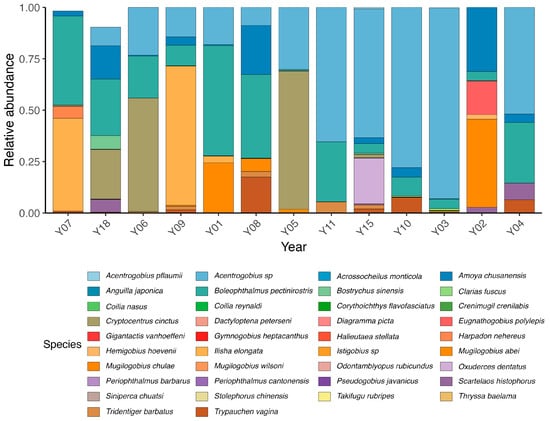
Figure 5.
Taxonomic profiles represented in barplots showing relative abundance of taxonomic lineages of fish eggs and larvae collected in summer.
Morphology, COI barcoding, and 12S metabarcoding showed clear differences in species detection capacity (Figure 6). Morphology recovered the highest number of species overall, but this outcome was based on 20 samples collected across all four seasons. In contrast, both molecular approaches detected a substantial portion of the total diversity from far fewer samples, demonstrating higher taxonomic coverage and finer resolution. The 12S marker identified a wide range of taxa from only 13 samples collected in summer, while COI barcoding resolved 21 species from 60 individual eggs and larvae. When combined, the three approaches confirmed 105 species in Yueqing Bay, with the molecular datasets contributing several taxa that could not be identified through morphology alone. Spawning activity varied significantly across seasons and locations, peaking in spring and summer near Ximen Island and the Bay mouth, indicating that these areas are key spawning and nursery grounds.
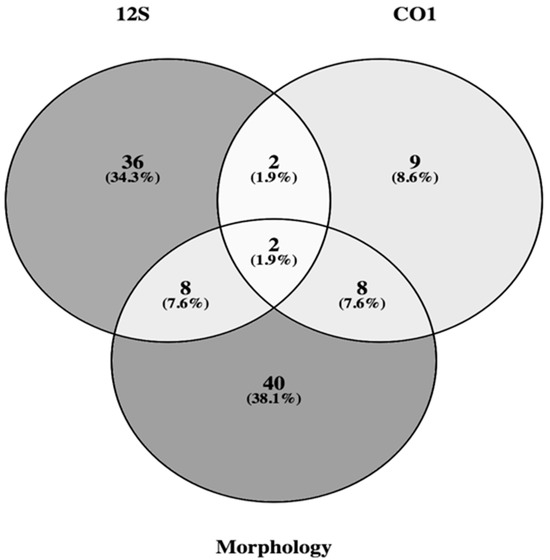
Figure 6.
Venn diagram showing the overlap between the numbers of species identified by molecular and morphological methods in Yueqing Bay.
4. Discussion
4.1. Morphological Insights into Species Composition and Spawning
Morphological analysis provided insights into species composition, assemblage, spatial and temporal distribution of ichthyoplankton, highlighting association with spawning seasons and areas in Yueqing Bay. Traditional morphological assessments have been a primary source of data for fish evolutionary and taxonomic studies [12,13]. Indeed, taxonomic identification of ichthyoplankton using morphology is time-consuming and necessitates the expertise of professionals with extensive taxonomic knowledge. To minimize misidentification risks, morphological identification to genus and species levels must be performed cautiously. When in doubt, identifying species at the family level, rather than the species and genus levels, is preferable [13].
Accurate and consistent identification of fish eggs and larvae poses a significant challenge when relying solely on morphology. The small size of eggs and larvae, lack of diagnostic features, cryptic nature, intraspecific variation, and dramatic morphological changes during development complicate identification [19,42]. The high abundance and diversity of fish eggs and larvae in Yueqing Bay highlight Ximen Island and the Bay mouth as key spawning and nursery grounds, particularly during the peak breeding seasons of spring and summer for dominant species. These concentrations of early life stages in specific areas also point to ecologically sensitive zones where local fisheries depend on successful annual recruitment. These findings align with previous studies [43,44,45]. Evidently, the Bay provides an ideal spawning ground for a diverse array of coastal fishes such as Trichiuridae, Lateolabracidae, Mugilidae, and Gobiidae, alongside pelagic species like Engraulidae. Spawning activities revealed distinct spawning hotspots, with the highest abundance and diversity of fish eggs and larvae recorded around Ximen Island and the Bay mouth, indicating that these are the spawning and nursery grounds. Given that these areas also overlap with zones affected by coastal development and pollution, identifying such hotspots is directly relevant for habitat protection and fisheries planning. Fish spawning activities in Yueqing Bay revealed seasonal patterns, with the highest catch of eggs recorded in spring, implying that spring is the intensive breeding season followed by summer for most fishes in the Bay. Seasonal peaks of spawning also provide a biological basis for timing management interventions such as seasonal closures or gear restrictions. Eggs or larvae of some species were only present during certain seasons, while others were found throughout the year. The key breeding and nursery seasons for fish species in Yueqing Bay were indicated by the high presence of eggs and larvae of common dominant families in the spring, followed by summer. Studies by [45,46] reported that the peak spawning seasons for most fishes in the East China Sea and Eastern Beibu Gulf occurred between spring and summer, a pattern that aligns closely with the findings of this study.
Sciaenidae eggs and larvae were found in almost every sampling season. These species spawn from spring to summer [47], and their abundance reaches its maximum in autumn [48]. Engraulidae eggs and larvae were abundant in all seasons except winter. Their main spawning seasons are spring and summer [49]. Many Gobiidae species spawn between spring and summer [45,46], while only a few Acentrogobius species spawn between winter and spring [50]. Seasonal shifts in ichthyoplankton abundance likely reflect environmental and oceanographic conditions [51], including food availability and migration behaviors. Notably, the increase in larval density observed in winter may relate to the low egg abundance recorded during summer and autumn, suggesting that some species may experience delayed hatching or extended larval development, resulting in larvae appearing later in the year than their peak spawning period. Our findings are consistent with earlier studies on the spatial and temporal composition and variation of fish eggs and larvae in the Sea [45,46]. Together, these morphological patterns also provide baseline indicators for detecting long-term shifts driven by climate variability or intensified human activity in the Bay.
4.2. DNA Barcoding Identification of Species and Spawning Patterns
The nucleotide polymorphisms recovered from DNA barcoding of the COI sequences identified 21 fish species from 60 ichthyoplankton samples, which is similar to 26 fish species from 70 larva samples collected in Dongsha Island, the South China Sea, reported by [15]. The 21 taxa were recognized by NJ clustering as separate species, corroborated by mean K-2-P distances within and between groups, similar to previous COI barcoding studies [12,20,22,52]. The seasonal composition and distribution of common species identified in this study align closely with previous research, reinforcing established ecological patterns [45,49,53,54]. DNA barcoding using a small segment of the COI sequence has been successful in identifying and differentiating fish eggs and larvae [13]. This success stems from its ability to leverage enough nucleotide polymorphisms for precise species discrimination [12,23]. Our findings highlight COI barcoding as a reliable tool for identifying fish eggs and larvae, providing trustworthy information on fish eggs and larvae communities crucial for management and conservation planning. Importantly, the clear temporal shifts detected by COI barcoding also provide insight into changes in spawning timing and species turnover, offering managers an early indicator of how anthropogenic pressures or climate-driven variability may influence recruitment patterns in Yueqing Bay.
4.3. DNA Metabarcoding Assessment of Community Structure and Spawning
Our 12S DNA metabarcoding analyses identified 48 fish species, ranging from common to rare in Yueqing Bay. The fish species found in this survey were similar to those found in prior research [43,44,45,46,47,55]. Notably, spatial variations were observed in the community structure, with changes in fish eggs and larval species composition, diversity, distribution, and abundance across sampling sites. These fine-scale spatial differences are especially important for identifying vulnerable spawning habitats, as early life stages respond rapidly to environmental stressors such as pollution, eutrophication, and habitat modification. Our findings highlight the Bay Mouth and Ximen Island as key spawning and nursery grounds in Yueqing Bay during summer. DNA metabarcoding effectively identifies fish eggs and larvae across taxonomic levels, aiding community structure assessment [8,18,19]. Its ability to describe and monitor biodiversity with minimal sampling effort suggests metabarcoding will become a critical tool for assessing environmental responses to anthropogenic and environmental changes [11], particularly because it can detect shifts in species presence before such changes become visible in adult populations. The results obtained from DNA metabarcoding can inform further genetic research to enhance fishery management and conservation.
Despite considerable overlap in taxonomic identification between morphological and molecular data, there was a disagreement between the methods, as each tool missed certain taxa detected by the other. In agreement with earlier findings [19,56], molecular methods assign most taxa to species level and discriminate cryptic species, whereas morphology often cannot. Based on [13], molecular tools are essential for reliably identifying fish eggs and larvae at the species level. DNA metabarcoding surpasses morphology in species detection due to its ability to generate and analyze millions of sequences from complex samples [18,21,57]. Thus, DNA metabarcoding proves a reliable approach for assessing fish egg and larval community structure and can accelerate monitoring and management planning of coastal marine fisheries by providing timely and cost-effective data on ichthyoplankton community characteristics. However, it should be noted that molecular analysis is not a substitute for morphological analysis but rather a supplement to morphology-based biodiversity assessment and monitoring. In this context, combining morphology with metabarcoding greatly strengthens the ability to detect changes in species composition linked to fishing pressure or environmental degradation, thereby improving the evidence base for habitat protection and stock management strategies in Yueqing Bay.
5. Implications for Fishery Management
This study provides essential baseline information for the sustainable utilization and management of coastal and marine fishery resources in Yueqing Bay. The identification of approximately 105 fish species that use the Bay as spawning and nursery grounds highlights the ecological significance of this region for both commercially and ecologically important taxa in the East China Sea. The concentration of ichthyoplankton around Ximen Island and the Bay mouth, combined with observed seasonal peaks in spring and summer, directly identifies the spatial and temporal windows in which management actions would be most effective. These hotspots coincide with areas experiencing increased coastal development, habitat modification, and declining water quality, underscoring the urgency of targeted protection. Comprehensive fisheries management strategies that align with these spawning seasons and critical habitats should be developed to safeguard reproductive stocks and maintain ecosystem function. Seasonal closures, gear restrictions, and spatio-temporal zoning informed by the observed peaks in ichthyoplankton density can help minimize fishing pressure on vulnerable early life stages. Beyond China’s established summer fishing ban, additional measures such as habitat protection zones, nursery-area reserves, and improved mesh size regulations would help reduce juvenile bycatch and prevent habitat degradation. The strong spatial and seasonal signals in ichthyoplankton also provide a biological foundation for long-term stock monitoring, allowing managers to detect shifts in species composition, spawning timing, or recruitment that may arise from climate-driven warming, altered circulation patterns, or nutrient loading. Consequently, the dataset generated in this study serves not only as a snapshot of current spawning dynamics but also as a baseline against which future environmental and anthropogenic impacts can be evaluated. By integrating ecological findings with practical management considerations, this study supports the development of more adaptive, ecosystem-based approaches to fisheries governance in Yueqing Bay.
6. Conclusions
This study presents a comprehensive assessment of the ichthyoplankton community in Yueqing Bay using an integrated approach that combines morphology, COI barcoding, and 12S metabarcoding. Morphological analysis revealed well-defined spatial and seasonal patterns in spawning activity, with Ximen Island and the Bay mouth consistently emerging as key hotspots, especially during spring and summer. COI barcoding provided species-level resolution for dominant taxa and confirmed temporal changes in species composition. The 12S metabarcoding data expanded the detected diversity by uncovering additional taxa present during summer. Together, these complementary methods documented approximately 105 fish species that rely on Yueqing Bay for spawning and early development, highlighting the high ecological value of the bay. By integrating traditional and molecular datasets, the study not only improves the accuracy of species detection but also enhances the interpretation of spatial and temporal spawning dynamics in ways that directly inform fisheries management. The detection of concentrated spawning habitats, coupled with strong seasonal signals, provides actionable guidance for habitat protection, stock monitoring, and adaptive management planning under ongoing anthropogenic pressures and climate-related changes.
Supplementary Materials
The following supporting information can be downloaded at: https://www.mdpi.com/article/10.3390/d18010008/s1. Table S1: List of identified fish species in Yueqing Bay; taxonomy description; identification method; sampling season; eggs and larvae density.
Author Contributions
All authors contributed to the study’s conception and design. Material preparation, data collection, and morphological analysis were performed by R.J. and R.Y.; DNA extraction, PCR, and molecular analysis were performed by J.L.L.; the first draft of the manuscript was prepared by J.L.L., A.R.M., and T.M.M. Y.E.A. conducted extensive revisions. R.J. acquired funding. Y.C. supervised the project. All authors have read and agreed to the published version of the manuscript.
Funding
This study was supported by the National Key R&D Program of China (Grant/Award Numbers: 2024YFD2400404, 2018YFD0900903 and 2018YFD0900904) and Zhejiang Ocean University Independent Voyage for Sophisticated Ocean Front and Fisheries Investigation (SOPHI).
Institutional Review Board Statement
The study was conducted according to the Zhejiang Ocean University and Zhejiang Marine Fisheries Research Institute Code of Conduct for Research Ethics. No specific ethics approval was needed.
Data Availability Statement
The COI and 12S sequences generated in this study are available in the NCBI BioProject database under accession number PRJNA934329.
Acknowledgments
We are grateful to Liang Jing Xiang of Zhejiang Ocean University for their assistance in sampling and data collection.
Conflicts of Interest
All authors declare that they have no conflicts of interest.
References
- Liu, J.Y. Status of Marine Biodiversity of the China Seas. PLoS ONE 2013, 8, e50719. [Google Scholar] [CrossRef]
- Wang, C.; Cui, L.; Wang, D. Distribution and Pollution Assessment of Heavy Metals in Surface Sediments of Aquaculture Area in Yueqing Bay. Trans. Chin. Soc. Agric. Eng. 2015, 31, 204–210. [Google Scholar]
- Mehmood, T.; Janke, D.; Gaurav, G.K.; Sardar, M.F. Coastal Guardian: Mangroves in Pakistan at Risk from Microplastic Threats Jeopardizing Their Crucial Role in Global CO2 Dynamics. Environ. Sci. Pollut. Res. 2025, 32, 7799–7807. [Google Scholar] [CrossRef] [PubMed]
- Crain, C.M.; Halpern, B.S.; Beck, M.W.; Kappel, C.V. Understanding and Managing Human Threats to the Coastal Marine Environment. Ann. N. Y. Acad. Sci. 2009, 1162, 39–62. [Google Scholar] [CrossRef] [PubMed]
- FAO. The State of World Fisheries and Aquaculture; FAO: Rome, Italy, 2016. [Google Scholar]
- FAO. Global Capture Production Database Updated to 2015 Summary Information. Fisheries and Aquaculture Department; FAO: Rome, Italy, 2017. [Google Scholar]
- Barber, P.H.; Ablan-Lagman, M.C.A.; Berlinck, R.G.S.; Cahyani, D.; Crandall, E.D.; Ravago-Gotanco, R.; Juinio-Meñez, M.A.; Mahardika, I.G.N.; Shanker, K.; Starger, C.J.; et al. Advancing Biodiversity Research in Developing Countries: The Need for Changing Paradigms. Bull. Mar. Sci. 2014, 90, 187–210. [Google Scholar] [CrossRef]
- Thomsen, P.F.; Willerslev, E. Environmental DNA—An Emerging Tool in Conservation for Monitoring Past and Present Biodiversity. Biol. Conserv. 2015, 183, 4–18. [Google Scholar] [CrossRef]
- Jacques, P.J. Are World Fisheries a Global Panarchy? Mar. Policy 2015, 53, 165–170. [Google Scholar] [CrossRef]
- USAID. A Guide for USAID Staff and Partners; USAID: Washington, DC, USA, 2013.
- Willette, D.A.; Allendorf, F.W.; Barber, P.H.; Barshis, D.J.; Carpenter, K.E.; Crandall, E.D.; Cresko, W.A.; Fernandez-Silva, I.; Matz, M.V.; Meyer, E.; et al. So, You Want to Use next-Generation Sequencing in Marine Systems? Insight from the Pan-Pacific Advanced Studies Institute. Bull. Mar. Sci. 2014, 90, 79–122. [Google Scholar] [CrossRef]
- Hebert, P.D.N.; Cywinska, A.; Ball, S.L.; deWaard, J.R. Biological Identifications through DNA Barcodes. Proc. R. Soc. Lond. Ser. B Biol. Sci. 2003, 270, 313–321. [Google Scholar] [CrossRef]
- Ko, H.-L.; Wang, Y.-T.; Chiu, T.-S.; Lee, M.-A.; Leu, M.-Y.; Chang, K.-Z.; Chen, W.-Y.; Shao, K.-T. Evaluating the Accuracy of Morphological Identification of Larval Fishes by Applying DNA Barcoding. PLoS ONE 2013, 8, e53451. [Google Scholar] [CrossRef]
- Gleason, L.U.; Burton, R.S. High-throughput Molecular Identification of Fish Eggs Using Multiplex Suspension Bead Arrays. Mol. Ecol. Resour. 2011, 12, 57–66. [Google Scholar] [CrossRef]
- Chen, I.-S.; Shao, K.-T.; Hsu, S.-L.; Gong, G.-C.; Chen, Y.-C.; Liu, T.-K. DNA Barcoding of Coastal Larval Fish Communities of Dongsha Island, South China Sea Revealed by Mitochondrial CO I Sequences. J. Mar. Sci. Technol. 2013, 21, 252–257. [Google Scholar] [CrossRef]
- Kumar, G.; Kocour, M. Applications of Next-Generation Sequencing in Fisheries Research: A Review. Fish. Res. 2017, 186, 11–22. [Google Scholar] [CrossRef]
- Lo, P.-C.; Liu, S.-H.; Nor, S.A.M.; Chen, W.-J. Correction: Molecular Exploration of Hidden Diversity in the Indo-West Pacific Sciaenid Clade. PLoS ONE 2017, 12, e0181511. [Google Scholar] [CrossRef]
- Bucklin, A.; Lindeque, P.K.; Rodriguez-Ezpeleta, N.; Albaina, A.; Lehtiniemi, M. Metabarcoding of Marine Zooplankton: Prospects, Progress and Pitfalls. J. Plankton Res. 2016, 38, 393–400. [Google Scholar] [CrossRef]
- Harvey, J.B.J.; Johnson, S.B.; Fisher, J.L.; Peterson, W.T.; Vrijenhoek, R.C. Comparison of Morphological and next Generation DNA Sequencing Methods for Assessing Zooplankton Assemblages. J. Exp. Mar. Biol. Ecol. 2017, 487, 113–126. [Google Scholar] [CrossRef]
- Valdez-Moreno, M.; Vásquez-Yeomans, L.; Elías-Gutiérrez, M.; Ivanova, N.V.; Hebert, P.D.N. Using DNA Barcodes to Connect Adults and Early Life Stages of Marine Fishes from the Yucatan Peninsula, Mexico: Potential in Fisheries Management. Mar. Freshw. Res. 2010, 61, 655. [Google Scholar] [CrossRef]
- Valentini, A.; Taberlet, P.; Miaud, C.; Civade, R.; Herder, J.; Thomsen, P.F.; Bellemain, E.; Besnard, A.; Coissac, E.; Boyer, F.; et al. Next-generation Monitoring of Aquatic Biodiversity Using Environmental DNA Metabarcoding. Mol. Ecol. 2016, 25, 929–942. [Google Scholar] [CrossRef]
- Ward, R.D.; Zemlak, T.S.; Innes, B.H.; Last, P.R.; Hebert, P.D.N. DNA Barcoding Australia’s Fish Species. Philos. Trans. R. Soc. B Biol. Sci. 2005, 360, 1847–1857. [Google Scholar] [CrossRef]
- Kress, W.J.; García-Robledo, C.; Uriarte, M.; Erickson, D.L. DNA Barcodes for Ecology, Evolution, and Conservation. Trends Ecol. Evol. 2015, 30, 25–35. [Google Scholar] [CrossRef]
- Harms-Tuohy, C.A.; Schizas, N.V.; Appeldoorn, R.S. Use of DNA Metabarcoding for Stomach Content Analysis in the Invasive Lionfish Pterois Volitans in Puerto Rico. Mar. Ecol. Prog. Ser. 2016, 558, 181–191. [Google Scholar] [CrossRef]
- Hänfling, B.; Lawson Handley, L.; Read, D.S.; Hahn, C.; Li, J.; Nichols, P.; Blackman, R.C.; Oliver, A.; Winfield, I.J. Environmental DNA metabarcoding of Lake Fish Communities Reflects Long-term Data from Established Survey Methods. Mol. Ecol. 2016, 25, 3101–3119. [Google Scholar] [CrossRef]
- Kelly, R.P.; Port, J.A.; Yamahara, K.M.; Crowder, L.B. Using Environmental DNA to Census Marine Fishes in a Large Mesocosm. PLoS ONE 2014, 9, e86175. [Google Scholar] [CrossRef] [PubMed]
- Miya, M.; Sato, Y.; Fukunaga, T.; Sado, T.; Poulsen, J.Y.; Sato, K.; Minamoto, T.; Yamamoto, S.; Yamanaka, H.; Araki, H.; et al. MiFish, a Set of Universal PCR Primers for Metabarcoding Environmental DNA from Fishes: Detection of More than 230 Subtropical Marine Species. R. Soc. Open Sci. 2015, 2, 150088. [Google Scholar] [CrossRef] [PubMed]
- Thomsen, P.F.; Kielgast, J.; Iversen, L.L.; Møller, P.R.; Rasmussen, M.; Willerslev, E. Detection of a Diverse Marine Fish Fauna Using Environmental DNA from Seawater Samples. PLoS ONE 2012, 7, e41732. [Google Scholar] [CrossRef]
- Fang, J.; Wang, K.X.; Tang, J.L.; Wang, Y.M.; Ren, S.J.; Wu, H.Y.; Wang, J. Copper, Lead, Zinc, Cadmium, Mercury, and Arsenic in Marine Products of Commerce from the Zhejiang Coastal Area, China, May 1998. Bull. Environ. Contam. Toxicol. 2004, 73, 583–590. [Google Scholar] [CrossRef]
- Song, G.; Fu, C.; Yong, E. The Analysis of Ecosystem Service Value’s Change in Yueqing Bay Wetland Based on RS and GIS. Procedia Environ. Sci. 2011, 11, 1365–1370. [Google Scholar] [CrossRef]
- Zukan, N. An Atlas of the Early Stage Fishes in Japan; Okiyama, M., Ed.; University of Tokyo Press: Tokyo, Japan; Northwest and Alaska Fisheries Center, National Marine Fisheries Service: Seattle, WA, USA, 1989; Volume 89. [Google Scholar]
- Hall, T.A. BioEdit: A User-Friendly Biological Sequence Alignment Editor and Analysis Program for Windows 95/98/NT. Nucleic Acids Symp. Ser. 1999, 41, 95–98. [Google Scholar]
- Librado, P.; Rozas, J. DnaSP v5: A Software for Comprehensive Analysis of DNA Polymorphism Data. Bioinformatics 2009, 25, 1451–1452. [Google Scholar] [CrossRef]
- Kimura, M. A Simple Method for Estimating Evolutionary Rates of Base Substitutions through Comparative Studies of Nucleotide Sequences. J. Mol. Evol. 1980, 16, 111–120. [Google Scholar] [CrossRef]
- Tamura, K.; Peterson, D.; Peterson, N.; Stecher, G.; Nei, M.; Kumar, S. MEGA5: Molecular Evolutionary Genetics Analysis Using Maximum Likelihood, Evolutionary Distance, and Maximum Parsimony Methods. Mol. Biol. Evol. 2011, 28, 2731–2739. [Google Scholar] [CrossRef]
- Zhang, Z.; Schwartz, S.; Wagner, L.; Miller, W. A Greedy Algorithm for Aligning DNA Sequences. J. Comput. Biol. 2000, 7, 203–214. [Google Scholar] [CrossRef]
- Caporaso, J.G.; Kuczynski, J.; Stombaugh, J.; Bittinger, K.; Bushman, F.D.; Costello, E.K.; Fierer, N.; Peña, A.G.; Goodrich, J.K.; Gordon, J.I.; et al. QIIME Allows Analysis of High-Throughput Community Sequencing Data. Nat. Methods 2010, 7, 335–336. [Google Scholar] [CrossRef] [PubMed]
- Jiang, R.; Lusana, J.L.; Chen, Y. High-Throughput DNA Metabarcoding as an Approach for Ichthyoplankton Survey in Oujiang River Estuary, China. Diversity 2022, 14, 1111. [Google Scholar] [CrossRef]
- Magoč, T.; Salzberg, S.L. FLASH: Fast Length Adjustment of Short Reads to Improve Genome Assemblies. Bioinformatics 2011, 27, 2957–2963. [Google Scholar] [CrossRef]
- Bolger, A.M.; Lohse, M.; Usadel, B. Trimmomatic: A Flexible Trimmer for Illumina Sequence Data. Bioinformatics 2014, 30, 2114–2120. [Google Scholar] [CrossRef]
- Andrews, S.; Krueger, F.; Segonds-Pichon, A.; Biggins, L.; Krueger, C.; Wingett, S. FastQC. A Quality Control Tool for High Throughput Sequence Data; Babraham Institute: Cambridge, UK, 2010; Volume 370. [Google Scholar]
- Rodríguez, J.M.; Alemany, F.; Garcia, A. A Guide to the Eggs and Larvae of 100 Common Western Mediterranean Sea Bony Fish Species; Naciones Unidas: New York, NY, USA, 2017; ISBN 9251098956. [Google Scholar]
- Lee, M.-A.; Wang, Y.-C.; Chen, Y.-K.; Chen, W.-Y.; Wu, L.-J.; Liu, D.-C.; Wu, J.-L.; Teng, S.-Y. Summer Assemblages of Ichthyoplankton in the Waters of the East China Sea Shelf and Around Taiwan in 2007. J. Mar. Sci. Technol. 2013, 21, 41–51. [Google Scholar] [CrossRef]
- Zhang, J.; Takita, T.; Zhang, C. Reproductive Biology of Ilisha Elongata (Teleostei: Pristigasteridae) in Ariake Sound, Japan: Implications for Estuarine Fish Conservation in Asia. Estuar. Coast. Shelf Sci. 2009, 81, 105–113. [Google Scholar] [CrossRef]
- Zhou, M.; Lin, Y.; Yang, S.; Cao, W.; Zheng, L. Composition and Ecological Distribution of Ichthyoplankton in Eastern Beibu Gulf. Acta Oceanol. Sin. 2011, 30, 94–105. [Google Scholar] [CrossRef]
- Lin, H.-Y.; Chiu, M.-Y.; Shih, Y.-M.; Chen, I.-S.; Lee, M.-A.; Shao, K.-T. Species Composition and Assemblages of Ichthyoplankton during Summer in the East China Sea. Cont. Shelf Res. 2016, 126, 64–78. [Google Scholar] [CrossRef]
- Wan, R.; Zeng, D.; Bian, X.; Ni, X. Species Composition and Abundance Distribution Pattern of Ichthyoplankton and Their Relationship with Environmental Factors in the East China Sea Ecosystem. J. Fish. China 2014, 38, 1375–1398. [Google Scholar]
- Sambou, O.S.; Xu, H.-X.; Yongdong, Z. Structure and Diversity of Fish Communities in the Hairtail Protected Area of the East China Sea. Aquac. Aquar. Conserv. Legis. 2016, 9, 105–112. [Google Scholar]
- Zhu, D. Anchovy and Other Fish Resources in the Yellow Sea and East China Sea November 1984–April 1988. Mar. Fish. Res. 1990, 11, 1–143. [Google Scholar]
- Breder, C.M.; Rosen, D.E. Modes of Reproduction in Fishes; The American Museum of Natural History by the Natural History Press: New York, NY, USA, 1966. [Google Scholar]
- Okazaki, Y.; Nakata, H. Effect of the Mesoscale Hydrographic Features on Larval Fish Distribution across the Shelf Break of East China Sea. Cont. Shelf Res. 2007, 27, 1616–1628. [Google Scholar] [CrossRef]
- Pegg, G.G.; Sinclair, B.; Briskey, L.; Aspden, W.J. MtDNA Barcode Identification of Fish Larvae in the Southern Great Barrier Reef—Australia. Sci. Mar. 2006, 70, 7–12. [Google Scholar] [CrossRef]
- Bester, C. Ichthyology at the Florida Museum of Natural History; Florida Museum of Natural History: Gainesville, FL, USA, 2004. [Google Scholar]
- Islam, M.S.; Ueno, M.; Yamashita, Y. Recruitment in Japanese Sea Bass, Lateolabrax japonicas (Cuvier, 1828): Effects of Timing on Spawning and Larval Quality and Quantity. J. Appl. Ichthyol. 2015, 31, 1064–1071. [Google Scholar] [CrossRef]
- Mahmood, K.; Ayub, Z.; Siddiqui, G. Sex-Ratio, Maturation and Spawning of the Indian Ilisha, Ilisha Melastoma (Clupeiformes: Pristigasteridae) in Coastal Waters of Pakistan (Northern Arabian Sea). Indian J. Mar. Sci. 2011, 40, 516. [Google Scholar]
- Shaw, J.L.A.; Clarke, L.J.; Wedderburn, S.D.; Barnes, T.C.; Weyrich, L.S.; Cooper, A. Comparison of Environmental DNA Metabarcoding and Conventional Fish Survey Methods in a River System. Biol. Conserv. 2016, 197, 131–138. [Google Scholar] [CrossRef]
- Cowart, D.A.; Pinheiro, M.; Mouchel, O.; Maguer, M.; Grall, J.; Miné, J.; Arnaud-Haond, S. Metabarcoding Is Powerful yet Still Blind: A Comparative Analysis of Morphological and Molecular Surveys of Seagrass Communities. PLoS ONE 2015, 10, e0117562. [Google Scholar] [CrossRef]
Disclaimer/Publisher’s Note: The statements, opinions and data contained in all publications are solely those of the individual author(s) and contributor(s) and not of MDPI and/or the editor(s). MDPI and/or the editor(s) disclaim responsibility for any injury to people or property resulting from any ideas, methods, instructions or products referred to in the content. |
© 2025 by the authors. Licensee MDPI, Basel, Switzerland. This article is an open access article distributed under the terms and conditions of the Creative Commons Attribution (CC BY) license.