Abstract
The Wutong River, located in northeastern China’s Heilongjiang Province, serves as an important habitat and spawning ground for fish and freshwater shellfish. To investigate the influence of geographic and geomorphic changes on the river basin ecology, the water environment and spatial heterogeneity of freshwater shellfish distribution were monitored in both summer and autumn of 2024. Key water quality indicators were analyzed, including basic parameters (pH and dissolved oxygen), eutrophication indices (nitrogen, phosphorus, and chlorophyll), and pollutant levels (nitrite nitrogen, petroleum, and volatile phenol). Water quality was assessed using the single-factor index method and the Nemerow pollution index method. Results indicated that in 2024, the Wutong River was weakly acidic in summer and weakly alkaline in autumn, with overall high dissolved oxygen levels. The Guanmenzuizi Dam site exhibited the best water quality. According to the single-factor evaluation, water quality in autumn was better than in summer, with iron, manganese, and volatile phenol as the primary pollutants, followed by total nitrogen and permanganate index. Based on the Nemerow index, the river generally met China’s Class III surface water standards. Water quality showed a trend of initial improvement followed by deterioration along the river course. Among 100 sampling points, Unio douglasiae had the highest occurrence rate (76%), followed by Cipangopaludina cahayensis (66%). Other species occurred in ≤50% of samples, with Polypylis hemisphaerula being the rarest (3%). The average species occurrence rate increased from upstream to downstream. This study provides a data baseline for understanding the water environment of the Wutong River and supports research on biodiversity and ecological conservation.
1. Introduction
The Songhua River, the largest tributary of the Heilongjiang River (the world’s sixth longest river), drains the Northeast Plain—one of only three global black soil regions, responsible for one-third of China’s grain production [1]. As a major downstream tributary, the Wutong River is a vital water source for local communities. Changes in its water environment affect basin biodiversity and threaten agricultural, industrial, and drinking water safety. In recent years, international economic growth, population increase, and water conservancy projects have posed significant challenges to freshwater river ecosystems. Pesticide and fertilizer use have raised nitrogen, phosphorus, and potassium levels in riparian soils [1,2]. These nutrients, upon entering rivers, influence indigenous microbial populations. Moreover, excessive nitrogen and phosphorus discharges promote algal and plankton blooms; subsequent decomposition consumes dissolved oxygen, leading to hypoxia and fish mortality [3,4]. Industrial expansion has also increased heavy metal discharges into rivers, elevating metal concentrations in aquatic organisms such as fish and ultimately posing risks to human health [5].
As an important fish habitat and spawning ground, the Wutong River historically supported over 40 native economic fish species. However, recent socioeconomic development has degraded spawning, feeding, and wintering grounds and disrupted migration pathways. Consequently, fisheries have declined, manifested as reduced population sizes, smaller individuals, decreased species diversity, and dwindling stocks [5]. Preliminary surveys indicate that small-sized fish dominate catches, while larger species such as carp, silver carp, Esox reicherti, and catfish are now caught at smaller sizes [5]. Notably, large carnivorous and migratory fishes (e.g., salmonids) have not been reported in the river for 30 years. Industrialization and hydropower development along the river have degraded the environment, reducing zooplankton and phytoplankton diversity and abundance, thereby accelerating biodiversity loss and resource depletion [6,7]. Agricultural modernization has increased land-use efficiency and local populations [8,9]. Increased fertilizer application to meet food demand has exacerbated eutrophication in the Wutong River. Reservoir and dam construction for economic development and irrigation [10] has altered local landforms and river ecology. To monitor these changes, we investigated the water environment of the Wutong River [11]. Considering the impact of reservoir operation, river development history, and surrounding environment, we selected a suite of indicators: basic water quality parameters (pH value, dissolved oxygen (DO), hardness (DH) and Alkalinity (TA)), the eutrophication indices (nitrogen (TN, NH3-N), phosphorus (TP) and chlorophyll (Chl), and the pollutant indices such as nitrite nitrogen (NO2-N), petroleum and volatile phenol (VP)). These were evaluated using two widely applied methods—the single-factor index and the Nemerow pollution index—to assess water quality trends and identify drivers of environmental change [12,13]. Freshwater shellfish belong to the Mollusca phylum, including the Gastropoda and Bivalvia classes that live in freshwater. They are widely distributed in freshwater bodies such as ponds, lakes, and rivers, and are an important component of freshwater biological communities [14]. Freshwater shellfish are not only important links in material cycling and energy flow in freshwater ecosystems, but also play a crucial role in water purification, habitat construction, ecological restoration, and biological monitoring [15,16,17]. Studying the interaction between shellfish, distribution, and the water environment is crucial for protecting the water environment and aquatic biodiversity.
This study presents the first analysis of spatial heterogeneity in water quality and shellfish distribution in the Wutong River. Two water quality assessment methods are applied and compared in the context of hydrological conditions, human activities, and shellfish distribution patterns. The results provide a foundation for future theoretical research and ecological restoration practices.
2. Materials and Methods
2.1. Overview of Sampling Areas and Distribution of Sampling Sites
The Wutong River basin (4516 km2) is situated in Heilongjiang Province, northeastern China. Major right-bank tributaries include the Xilin and Heli Rivers. The northwestern basin lies in the Lesser Khingan Mountains, while the southeast extends into the Sanjiang Plain, resulting in a general topographic gradient from high northwest to low southeast (Figure 1). The region experiences a mid-temperate continental monsoon climate, with runoff primarily driven by rainfall—high in summer and low in winter. The river freezes from mid-November to mid-April, and flow is unevenly distributed, concentrated mainly in summer and autumn floods [18].
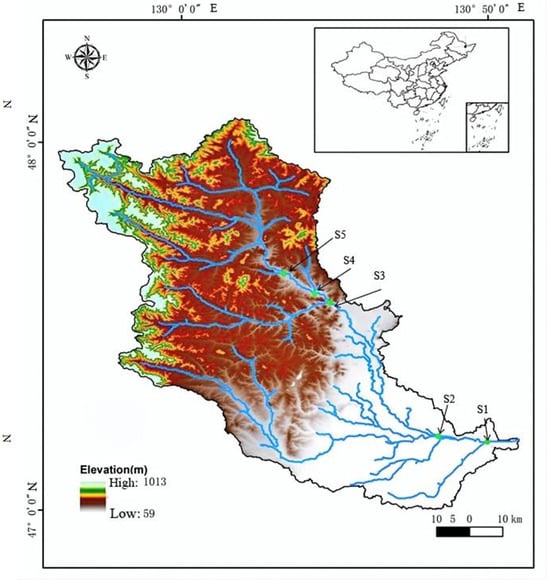
Figure 1.
Distribution of sampling sites in Wutong River.
Sampling was conducted in summer (June) and autumn (October) 2024. Based on tributary confluences and benthic habitat characteristics, five sampling sections were selected. Due to ongoing reservoir construction in the mid-reach, two sites were set upstream and downstream of the reservoir, two at the mouths of the Xilin and Heli Rivers, and one in the upper Wutong River. Site coordinates are listed in Table 1.

Table 1.
Longitude, latitude, and altitude of sampling sites in Wutong River.
2.2. Sample Collection and Test Method
The water environment samples were collected with the internationally accepted methods. The indices, such as water temperature (T), salinity (S), conductivity (Cc), PH, and dissolved oxygen (DO), were measured by a portable water quality analyzer (VSI) on the spot, and the river flow velocity (V) by a flowmeter. Other indices were tested, such as alkalinity (TA), hardness (DH), suspended solids (SSs), chlorophyll (Chl), total phosphorus (TP), total nitrogen (TN), ammonia nitrogen (NH3-N), nitrite nitrogen (NO2-N), permanganate index (CODMn), petroleum, volatile phenol (VP), and metal elements. Because some river sections have shallow water depths, for the convenience of comparison, water samples were collected with a 5 L water sampler from the upper and middle levels of the river, and then sent to the lab in sample bottles to be analyzed [12].
Analytical methods followed standard protocols [10,11]: hardness by EDTA titration; alkalinity by acid–base titration; suspended solids by gravimetry; total phosphorus, total nitrogen, ammonia nitrogen, and nitrite nitrogen by UV spectrophotometry; permanganate index by acidic potassium permanganate oxidation; petroleum by infrared spectrophotometry; volatile phenol by UV spectrophotometry; chlorophyll a by spectrophotometry. Metal elements were analyzed using inductively coupled plasma mass spectrometry (ICP-MS) after filtration and acidification [13]. Quality control included spike recovery tests to minimize interference.
Shellfish sampling points were established around each water sampling site to ensure spatial representativeness [16]. Twenty points were arranged in a 4 × 5 matrix within 200 m upstream and downstream of each water sampling location (Figure 2). Sampling employed triangular trawls, nets, a modified Peterson grab (deep areas), and manual collection along banks. Three collectors worked for 1 h per point, covering 200 m intervals and collecting all shellfish encountered. Live specimens were preserved in 95% ethanol or 10% formalin; empty shells were cleaned, dried, and stored as reference material. All samples were identified in the laboratory.
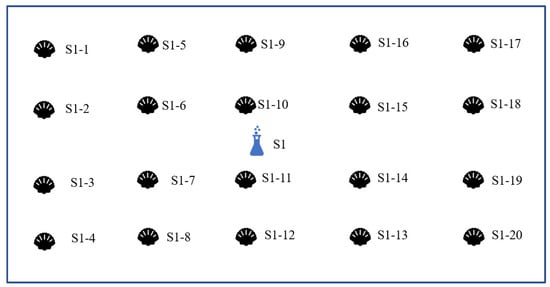
Figure 2.
Schematic diagram of shellfish sampling point setting. S1: Water sampling point. S1-1~S1-20: Shellfish sampling point.
2.3. Data Processing and Evaluation Method
2.3.1. Water Quality Evaluation Methods
At present, there are many ways to evaluate the water quality of freshwater rivers. Based on the characteristics of the Wutong River’s water environment, the single factor evaluation method and Nemero water pollution index method were used to analyze the water environment in this paper [12,13]. The single-factor evaluation method is to make a comparison between the concentration of the test index and the limit value of the evaluation standard, and then to take the index with the worst result as the factor for evaluating the overall water quality. Then the water quality is classified according to the test result of the evaluation factor. In case one of the test results rises above the limit value, its waters fail to meet the corresponding water quality standard. The Nemero water pollution index method, one of the most commonly used methods for calculating the composite pollution index at home and abroad, is a kind of multi-factor water quality analysis method, in which the outstanding maximum index is weighted [13]. However, in practical analysis, some indices have a large impact on the water environment, though their concentration is low. To improve those traditional methods which emphasize the concentration value but neglect the influence of pollution factor, the weight of pollution factor in water environment evaluation was introduced. In this way, the improved Nemero water pollution index method was obtained after improving the traditional method [19].
The improved Nemero water pollution index method is as follows: the weight is worked out as shown in Formulas (1) and (2), while the improved Nemero index is worked out as shown in Formulas (3)–(5).
In these formulas, is the weight of the ith pollution factor, is the relativity ratio of the ith pollution factor, is the standard value of the pollution factor i under the jth type standard, P is the Nemero index, is the measured concentration of the ith pollutant, and is the F value of the index with the biggest weight [20].
2.3.2. Method for Calculating the Occurrence Rate of Shellfish Species
In this study, we use the occurrence rate of shellfish species as a parameter to measure the spatial heterogeneity of shellfish species distribution, and the calculation method adopts classical formulas [21,22].
Pj = Nj/N
Pj: The occurrence rate of shellfish species;
Nj: The frequency of occurrence of the th species in all sampling points;
N: The total number of sampling points.
2.3.3. Correlation Analysis Methods for Water Quality Parameters
In statistics, the Pearson product-mode correlation coefficient (PPMCC) is used to measure the linear correlation between two variables X and Y, with values ranging from −1 to 1. In the field of natural sciences, this coefficient is widely used to measure the degree of correlation between two variables. The sample correlation coefficient refers to the degree of linear correlation between variables in a sample [11,22]. Specific statistical tests used t-tests, and the significance level (p ≤ 0.05) was adopted.
2.3.4. Data Processing
Excel 2016 was used to process the experimental data. Origin 2021 was used to draw and analyze the graphics, and SPSS22.0 software was used to analyze the significance between the sites and between the seasons. The Pearson correlation coefficient of 15 pollution indicators (T, pH, DO, TA, SS, VP, Chl, TP, TN, NH3-N, NO2-N, CODMn, Fe, Mn) of the Wutong River was calculated. The unit of T is Celsius, the unit of pH is dimensionless, and the unit of other parameters is mg/L.
3. Results
3.1. The Water Environment Situation of Wutong River
On the whole, the flow rate of the Wutong River is slow and varies slightly (Figure 3b). The salinity and conductivity in summer are almost the same as those in autumn (Figure 3c,d). In summer, the River is weakly acidic, while in autumn it is weakly alkaline (Figure 3f). There is sufficient dissolved oxygen in the river. The content of dissolved oxygen is higher in summer than in autumn, and is higher in the upstream than in the downstream (Figure 3e). It begins to decline after reaching the maximum at S4. In summer and autumn, the hardness, suspended solids content, and nitrite nitrogen content do not vary greatly (Figure 3h,i,o). The contents of volatile phenol, total phosphorus, ammonia nitrogen, and permanganate index go slightly higher in summer than in autumn (Figure 3j,l,n,p). The content of total nitrogen is significantly higher in summer than in autumn (Figure 3m). Some water quality indices come to the lowest level at some sites, including the hardness at S2, the suspended solids and permanganate index at S3, the volatile phenol, total phosphorus, and total nitrogen at S4, and the alkalinity, chlorophyll a, and ammonia nitrogen at S5. Some water quality indices reach the highest level at some sites, including the alkalinity, total phosphorus, and total nitrogen at S1, the suspended solids and chlorophyll a at S2, the permanganate index at S4, and the hardness, volatile phenol, ammonia nitrogen, as well as nitrite nitrogen at S5. In addition, in the Wutong River’s physicochemical indices, the content of volatile phenol at S1, S3, and S5 in summer, the content of total nitrogen at S1 and S2 in summer, and the permanganate index except at S4 in summer, exceed the limit value of the Class III surface water standard.
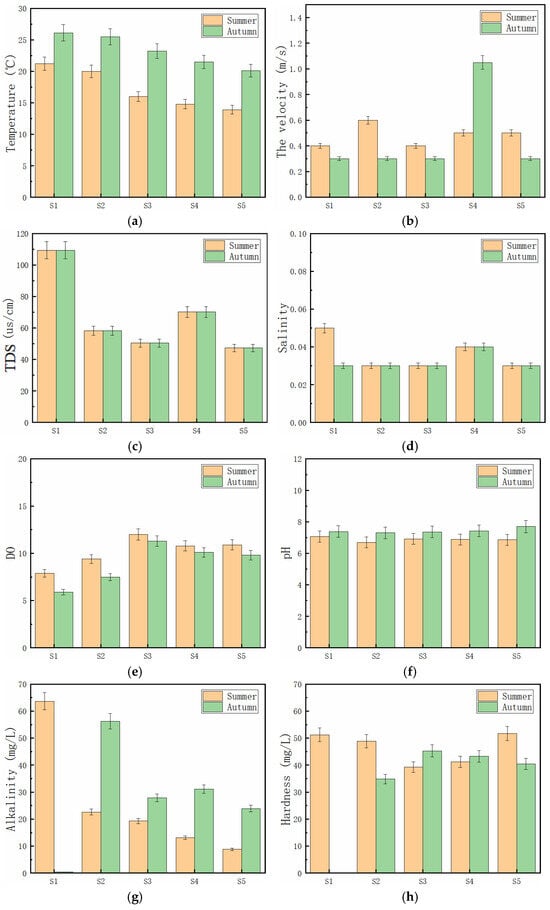
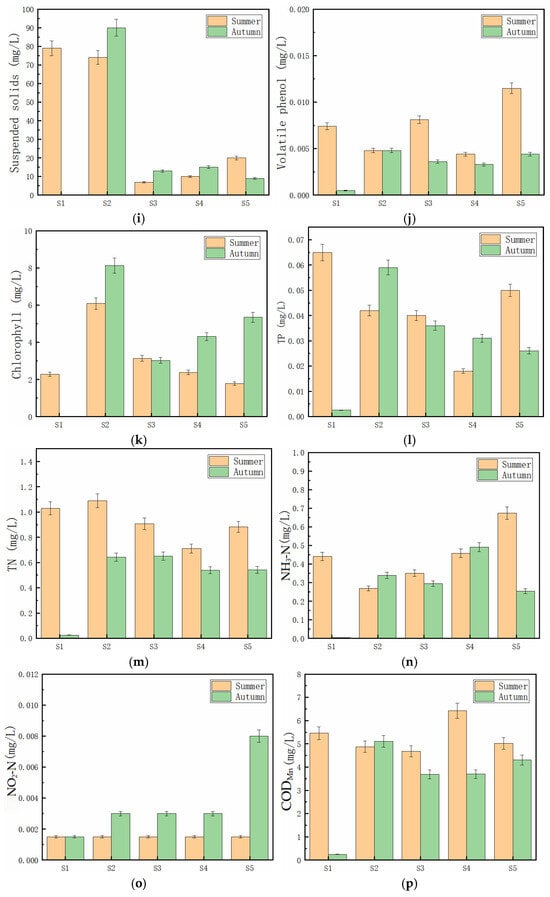
Figure 3.
Physical and chemical parameters of Wutong River water quality. (a) Temperature of Wutong River water; (b) The verlocity of Wutong River water; (c) TDS of Wutong River water; (d) The salinity of Wutong River water; (e) DO of Wutong River water; (f) The pH of Wutong River water; (g) The alkilinity of Wutong River water; (h) The hardness of Wutong River water; (i) The suspended solids of Wutong River water; (j) The volatile phenoof Wutong River water; (k) The chlorophyll a of Wutong River water; (l) The TP of Wutong River water; (m) The TN of Wutong River water; (n) The NH3-N of Wutong River water; (o) The NO2-N of Wutong River water; (p) The CODMn of Wutong River water.
In the Wutong River, the contents of Cd, Zn, Fe, and Mn are apparently higher in summer than in autumn (Figure 4a,d–f), the contents of Pb are remarkably higher in autumn than in summer (Figure 4c), and the contents of Cu are slightly higher in autumn than in summer (Figure 4b). Some metal elements reach the highest point at some sites, including the contents of Cd and Zn at S1, the content of Cu at S2, the content of Pb at S4, and the contents of Fe and Mn at S5. Furthermore, the contents of Fe and Mn in the Wutong River at S3, S4, and S5 in summer go above the limit value of the standard for Class III surface water.
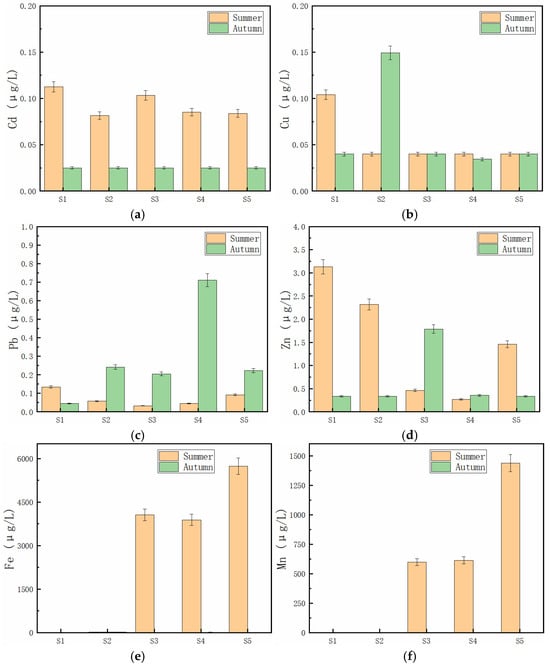
Figure 4.
Metal elements in water of Wutong River. (a) The concentration of Cd of Wutong River water; (b) The concentration of Cu of Wutong River water; (c) The concentration of Pb of Wutong River water; (d) The concentration of Zn of Wutong River water; (e) The concentration of Fe of Wutong River water; (f) The concentration of Mn of Wutong River water.
3.2. Correlation Analysis of Indus River Pollution Indicators
Correlation analysis of 15 pollution indicators was conducted (T, pH, DO, TA, SS, VP, Chl, TP, TN, NH3-N, NO2-N, CODMn, Fe, and Mn), obtaining data using SPSS22.0 (Table 2). The results showed that volatile phenol had a strong correlation with Fe and Mn, and had a moderate correlation with temperature, NH3-N, and Cd. TN has a strong correlation with PH and Cd, and a moderate correlation with NO2-N, Pb, and Zn. There is a moderate correlation between CODMn and Cd. Fe has strong correlations with temperature and Mn, and moderate correlations with PH, alkalinity, and Cd. Mn has strong correlations with temperature, and moderate correlations with alkalinity and NH3-N. Comprehensive analysis showed that the pollution of physical and chemical indicators of the Wutong River was significantly correlated with pH, Cd, Fe, and Mn, and the pollution of metal indicators was significantly correlated with temperature, volatile phenol, Fe, and Mn (Figure 5).
Table 2.
Water quality categories and determinants of Wutong River.
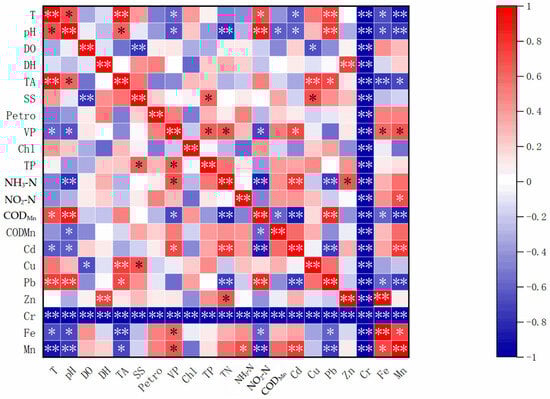
Figure 5.
Significance analysis results of water quality indicators of Wutong River. * p ≤ 0.05; ** p ≤ 0.01.
3.3. Single Factor Evaluation Method
The evaluation results, according to the single-factor index method, water quality is divided into five classes as shown in Table 2 and Figure 6. It can be seen from Figure 4 that the water quality of the Wutong River was better in autumn than in summer. As some physicochemical indices, such as volatile phenol, total nitrogen, and permanganate index, and some metal elements, such as iron and manganese, exceed the permissible levels, the volatile phenol, total nitrogen, permanganate index, and iron and manganese were taken as the limiting factors to categorize the water quality, with the results shown in Figure 5. It can be seen that iron, manganese, and volatile phenol are the major pollutants in the Wutong River, followed by total nitrogen and permanganate index. If the volatile phenol is taken as the limiting factor, the water quality first rises and then declines as the river flows. If the total nitrogen is taken as the limiting factor, the water quality first rises, then declines and rises again, as the river flows. If the permanganate index is taken as the limiting factor, the water quality declines with fluctuation as the river flows. If the iron is taken as the limiting factor, the water quality first declines, then rises, and again declines, as the river flows. If the manganese is taken as the limiting factor, the water quality first declines, then rises, and again declines, as the river flows.
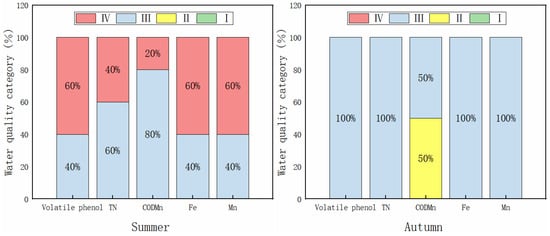
Figure 6.
Evaluation results of Wutong River water quality by single-factor index method.
3.4. Nemero Pollution Index Method
According to the improved Nemero pollution index method, water quality is divided into five classes as shown in Table 3 and Table 4. Based on the improved Nemero pollution index method and the Class III water quality as specified by the Water Quality Standards for the Surface Water in China, the weights were calculated, as shown in Table 3. It can be seen that the volatile phenol shows the highest weight, suggesting that it causes the most pollution in this pollution evaluation system.
Table 3.
Calculation of factor weight based on the Nemero index method.
Table 4.
Water quality categorization.
Then, based on the standard concentration of pollution index, the value of improved Nemero index was worked out for the corresponding water quality category, with the results shown in Table 4.
The monitoring data, collected from the Wutong River twice in 2024, were calculated with the Nemero index method to categorize the water quality, as shown in Table 5.
Table 5.
Category of Wutong River water quality.
3.5. Distribution of Shellfish Species in Sampling Area
The highest occurrence rate of shellfish species is 76% in 100 sampling points of Unio Douglas, followed by Cipangopaludina cahayensis with an occurrence rate of 66%. The occurrence rates of other shellfish species do not exceed 50%, while Polypylis hemisphaerula is the smallest, with only 3%. The average occurrence rate of shellfish species increases from upstream to downstream (Table 6).
Table 6.
Incidence of shellfish species in sampling area.
4. Discussion
As a major Songhua River tributary, the Wutong River shares common issues with many Chinese rivers, including eutrophication and elevated metal concentrations. The average total phosphorus in the Yangtze Basin is 0.058 mg/L, yet TP remains a primary exceeding pollutant, with 96.92% of loads originating from agricultural and domestic sources [23,24,25]. Reservoir construction further transforms river ecology. Thus, exceeded parameters require attention to prevent water quality deterioration. Common pollution drivers include agricultural runoff, water conservancy projects, and human activities.
4.1. The Spatial Variation in Water Quality in Wutong River
In 2024, the Wutong River was weakly acidic in summer, weakly alkaline in autumn, and abundant in oxygen. The water environmental pollution indicators are volatile phenol and total nitrogen of S1, total nitrogen of S2, volatile phenol of S3, permanganate index of S4, and volatile phenol of S5. The pollution phenomenon is presented with significant correlations regarding PH, Cd, Fe, and Mn. The pollution indicators of metal elements are Fe and Mn in S3, S4, and S5, and the pollution phenomenon has a significant correlation with temperature, volatile phenol, as well as Fe and Mn. The high concentration of Fe and Mn is closely related to the increase in suspended solids and leaching of heavy metals caused by precipitation erosion in the region [25,26]. The distribution of pollutants and the degree of pollution are obtained based on the single-factor evaluation method. The water environment of the Wutong River is better in autumn than in summer, with the major pollutants being iron, manganese, and volatile phenol, followed by total nitrogen and permanganate index. As the single-factor evaluation method fails to give a comprehensive assessment due to its singleness, the Nemero pollution index method is adopted to categorize the water quality of the Wutong River. According to the analysis, the Wutong River water meets the standard of Class III water on the whole, and the water quality first rises and then declines as the river flows. In addition, as the original ecological environment is changed by the reservoir, it is likely that the habitats of rare aquatic life will be destroyed, which will bring a transformation to the ecological structure of the original species in the river [26].
4.2. The Impact of Agricultural Pollution and Climate Change on the Water Quality
With the increase in the world’s population and the growing demand for food, the corresponding land area occupied by agricultural production is also increasing. The non-point source pollution generated by agricultural production has become one of the main factors leading to river water pollution. According to the general survey results of agricultural production and sewage discharge in the Wutong River basin, the pollution load of agricultural non-point source pollution, rural life, scattered livestock and poultry breeding, farmland chemical fertilizer loss and water and soil loss in the basin, and the chemical oxygen demand emissions of agricultural non-point source pollution in the basin are 2989.91 tons, including 2736.1 tons of scattered livestock and poultry, accounting for 91.51%; The emission of ammonia nitrogen is 115.32 tons, of which 83.6 tons are scattered livestock and poultry, accounting for about 72.49%; The total nitrogen emissions are 204.5 tons, including 47.54 tons of soil erosion and 29.51 tons of rural living, accounting for 23.2% and 14.4%, respectively; The total phosphorus emissions were 58.54 tons, of which 27.7 tons were from scattered livestock and poultry breeding, accounting for 47.3% of the emissions.
According to the results listed in Table 2, the main pollutants in the water quality of the Wutong River are TN, volatile phenol, and CODMn, which is consistent with the investigation results of non-point source pollution along the Wutong River.
Generally, in rainy seasons, the content of volatile phenol exceeds the permitted level, which is consistent with the studies performed by Jiaqi Wang et al. [27]. It can be seen from Jiaqi Wang’s research that both agricultural activities and factory discharge result in the rising concentration of volatile phenol in rivers. The phenolic substances that are contained in pesticides and washed by rain into rivers, and those that are discharged by factories, cause the content of volatile phenol to rise, and consequently will enter the body after gathering in aquatic creatures such as fish. Climate change affects water quality by increasing land and water temperatures and exacerbating extreme weather events. A study has evaluated the water quality risks caused by climate change. The significant warming trend exacerbates the seasonal vulnerability of the water environment in spring and summer. Direct effects, such as depletion of dissolved oxygen and changes in nutrient dynamics, pose urgent challenges, while long-term effects lead to algal blooms, microbial pollution, and ecosystem instability. Based on these findings, strategies including mitigation, nutrient control, and ecosystem-based approaches have been proposed to enhance the resilience of aquatic ecosystems and address climate change-driven water quality challenges [2].
4.3. Influence of Water Conservancy Project Construction on Water Quality
Driven by the demands for flood control and power generation, an increasing number of water conservancy projects, including reservoirs and dams, are being constructed along rivers, which consequently impact the water quality. Firstly, these projects alter the flow of rivers, exerting a diluting effect on water pollutants. Secondly, dam construction modifies the flow velocity of rivers, thereby prolonging the sedimentation period of pollutants [28]. Therefore, water conservancy projects influence river water quality through their control over flow velocity and volume. In the Wutong River, a high TN level is found in the upstream. For the reason that the River has self-purification ability and is far from cities, the TN content has dropped below the limit value. However, reservoirs are under construction on the Wutong River. The research shows that in reservoirs, nitrogen fixation, denitrification, and sediments will cause the N:P ratio to rise performed by Zahra Akbarzadeh et al. [28]. Therefore, the construction of reservoirs may further raise the content of TN above the permitted level, as it has approached the limit value. In 2024, the content of CODMn basically hovered around the limit value, probably for the reason that the agricultural development and the rainy season increased and gathered the organic pollutants. If it is not paid enough attention to, the content of organic pollutants may likely rise above the permitted level. In order to reduce the impact of reservoir construction on aquatic ecology, it is recommended to maintain the ecological flow of rivers in reservoir design, construction, and operation, construct buffer zones in relevant water areas, and scientifically and reasonably allocate water resources according to ecological water demand during reservoir operation, in order to achieve the goal of protecting the ecological environment.
4.4. Seasonal Variation in Precipitation and Its Impact on River Water Quality
The erosion of seasonal rainwater can have a certain degree of impact on the water quality of rivers, especially those in mountainous areas [2]. The characteristic of this impact is that the water quality shows corresponding changes with the seasonal variation in rainfall, especially for substances with high content in soil and sediment, including metal elements such as iron and manganese. Metal element is a kind of important substance in rivers. As for the Wutong River, it has its own features in the content of metal elements, with the Fe and Mn contents being high. The Wutong River has a high Fe and Mn level in summer, but witnesses a drop in autumn.
4.5. Threatened Factors and Protection Countermeasures of Shellfish Species in Wutong River
The occurrence rate of shellfish showed a positive correlation with nutrients such as total phosphorus and total nitrogen. The total phosphorus and total nitrogen gradually decreased from S1 to S5 (Figure 3l,m), and the occurrence rate of shellfish also decreased accordingly (Table 6). There are relatively few species of benthic animals, mainly consisting of aquatic insects and annelids. Therefore, based on the current results, statistical analysis of factors such as biodiversity is of little significance. In the next step of work, we will continue to accumulate data and work on foundations for the analysis of biodiversity and other aspects.
Globally, freshwater shellfish face threats from habitat loss/fragmentation, overharvesting, pollution, eutrophication, invasive species, and climate change [15,18]. In the Wutong River, human activities—especially sluice/dam construction—fragment river connectivity, limiting dispersal for many species. Fast upstream flow and soil erosion degrade habitats, particularly for freshwater mussels with late maturity and slow recovery [16]. Conservation measures should include spatial planning to limit disruptive activities, establishment of protected reaches, and fishing bans during breeding seasons. Protecting fish hosts is also crucial for bivalve conservation.
5. Conclusions
This study provides the first comprehensive water quality assessment of the Wutong River using single-factor and Nemerow index methods. Autumn water quality was better than summer. Key exceeding parameters included volatile phenol, total nitrogen, permanganate index, iron, and manganese, with volatile phenol being the dominant pollutant. Elevated TN and volatile phenol are closely linked to agricultural non-point sources. Seasonal rainfall and tributary inputs drove increases in CODMn, Fe, and Mn. The shellfish community has shifted toward pollution-tolerant, small-bodied species (e.g., Cipangopaludina), while larger bivalves (e.g., Hyriopsis cumingii) have declined.
As a major Songhua tributary, the Wutong River’s ecological health significantly influences the broader basin. During ongoing reservoir development, mitigation measures—such as maintaining ecological flows, creating buffer zones, and implementing science-based water allocation—are essential to minimize environmental degradation. Proactive conservation efforts and cross-sector collaboration are needed to protect the Wutong River ecosystem.
Author Contributions
Conceptualization, H.W. and T.H.; methodology, H.W.; software, L.W. and W.Z.; validation, H.W. and L.W.; formal analysis, L.W.; investigation, H.W.; resources, H.W. and T.H.; data curation, L.W.; writing—original draft preparation, H.W. and W.Z.; writing—review and editing, H.W. and T.H.; visualization, H.W. and L.W.; supervision, H.W. and L.W.; project administration, H.W. and T.H.; funding acquisition, T.H. All authors have read and agreed to the published version of the manuscript.
Funding
The authors are thankful for the “Central Public-interest Scientific Institution Basal Research Fund, CAFS (NO. 2023TD07)” and the “Agricultural Finance Special Project of the Ministry of Agriculture and Rural Affairs Investigation of Fisheries Resources and Environment in Key Waters in Northeast China” for supporting the research of this thesis.
Institutional Review Board Statement
Not applicable.
Data Availability Statement
The original contributions presented in this study are included in the article. Further inquiries can be directed to the corresponding author.
Conflicts of Interest
The authors declare no conflicts of interest.
References
- Wang, Y.; Han, J.C.; Zhou, Y.; Wang, X.; Ikram, R.M.A.; Zhao, X.; Huang, Y. Application of novel deep learning model for high-frequency water quality prediction in multi-station river networks. J. Environ. Chem. Eng. 2025, 13, 119673. [Google Scholar] [CrossRef]
- Kim, M.; Jang, M.; Choong, C.E.; Han, J. Historical and future water quality risks driven by climate change: Strategic management and overcoming challenges. Water Res. 2026, 288, 124774. [Google Scholar] [CrossRef]
- Wang, Y.; Xie, X.; Liu, C.; Wang, Y.; Li, M. Variation of net anthropogenic phosphorus inputs (NAPI) and riverine phosphorus flfluxes in seven major river basins in China. Sci. Total Environ. 2020, 742, 140514. [Google Scholar] [CrossRef] [PubMed]
- Huang, X.; Qin, D.; Gao, L.; Hao, Q.; Chen, Z.; Wang, P.; Tang, S.; Wu, S.; Jiang, H.; Qiu, W. Distribution, contents and health risk assessment of heavy metal(loid)s in fifish from difffferent water bodies in Northeast China. RSC Adv. 2019, 9, 33130–33139. [Google Scholar] [CrossRef] [PubMed]
- Lei, L.; Feng, J.; Nian, W.; Jiang, H.; Zhang, J.; Ma, B. Investigation on the status quo of fishery resources in Wutong River, the first tributary of Songhua River. Chin. J. Fish. 2018, 31, 15–19. [Google Scholar]
- Xue, D.; Yan, J.; Sun, D.; Wang, H.; Jin, X.; Li, H.; Wu, L.; Huang, T. Community structure of macrobenthos in Chagan Lake and its relationship with environmental factors. Chin. J. Fish. 2020, 33, 61–67. [Google Scholar]
- Wang, H.; Huang, X.; Wang, J.; Xue, D.; Wang, Q.; Sun, D.; Huang, T. Effects of agricultural non-point source pollution on plankton and benthic community structure in a reservoir in Moridawa Banner. Chin. J. Fish. 2019, 32, 55–62. [Google Scholar]
- Han, Y.; Fan, Y.; Yang, P.; Wang, X.; Wang, Y.; Tian, J.; Xu, L.; Wang, C. Net anthropogenic nitrogen inputs (NANI) index application in Mainland China. Geoderma 2014, 213, 87–94. [Google Scholar] [CrossRef]
- Han, Y.; Yu, X.; Wang, X.; Wang, Y.; Tian, J.; Xu, L.; Wang, C. Net anthropogenic phosphorus inputs (NAPI) index application in Mainland China. Chemosphere 2013, 90, 329–337. [Google Scholar] [CrossRef]
- Xiang, R.; Wang, L.; Li, H.; Tian, Z.; Zheng, B. Temporal and spatial variation in water quality in the Three Gorges Reservoir from 1998 to 2018. Sci. Total Environ. 2021, 768, 144866. [Google Scholar] [CrossRef]
- Takeya, L.A.; Haque, K.E.; Ahmed, S.; Siddique, M.A.B.; Moniruzzaman, M.; Uddin, M.R.; Rahman, M.S. Hydrochemistry, quality, and potential health risk appraisal of arsenic-enriched groundwater in central-west Bangladesh using the integrated water quality index and Monte Carlo simulation. Sci. Total Environ. 2025, 1003, 180707. [Google Scholar] [CrossRef] [PubMed]
- Zhao, X.; Shi, B.; Wang, C.; Cheng, H.; Wang, C.; Ma, X.; Yan, K.; Chen, Y. Effects of compound probiotics on the growth of Conger myriaster, water quality parameters, and microbial communities in industrial recirculating aquaculture systems. Aquac. Rep. 2025, 45, 103138. [Google Scholar] [CrossRef]
- Shanmugasundaram, K.; Selvam, A.; Kuo, C.Y.; Govindasamy, M. Exploring water quality in villupuram district: Correlation analysis of physicochemical parameters and health risks for domestic consumption. J. Water Process Eng. 2025, 76, 108278. [Google Scholar] [CrossRef]
- Filippini, G.; Dafforn, K.A.; Bugnot, A.B. Shellfish as a bioremediation tool: A review and meta-analysis. Environ. Pollut. 2023, 316, 12061. [Google Scholar] [CrossRef]
- Martínez-Guijarro, R.; Paches, M.; Romero, I.; Aguado, D. Enrichment and contamination level of trace metals in the Mediterranean marine sediments of Spain. Sci. Total Environ. 2019, 693, 133566. [Google Scholar] [CrossRef]
- Feng, J.C.; Sun, L.; Yan, J. Carbon sequestration via shellfish farming: A potential negative emissions technology. Renew. Sustain. Energy Rev. 2023, 171, 113018. [Google Scholar] [CrossRef]
- Feil, G.W.; Pogue, R.; Cumann, F.; Cumann, E.; Rowan, N. Implications for the seafood industry, consumers and the environment arising from contamination of shellfish with pharmaceuticals, plastics and potentially toxic elements: A case study from Irish waters with a global orientation. Sci. Total Environ. 2022, 844, 157067. [Google Scholar]
- Lai, G.; Sun, J.; Xiao, J.; Li, Z.; Du, J.; Wen, X.; Xu, X.; Meng, L.; Li, X.; Zhong, K. Assessing the effect of human activity on sediment load in the Second Songhua River Basin, Northeast China, based on the SWAT model. Reg. Stud. Mar. Sci. 2025, 91, 104491. [Google Scholar] [CrossRef]
- Lin, C.; Chen, J.; Xu, J.; Li, Y.; Liu, Y.; Lin, H. Distribution and risk assessment of heavy metals in the economic fish of the Southern Fujian Province. Environ. Toxicol. Pharmacol. 2022, 92, 103834. [Google Scholar] [CrossRef]
- Samaei, F.; Emami, H.; Lakzian, A. Assessing soil quality of pasture and agriculture land uses in Shandiz county, northwestern Iran. Ecol. Indic. 2022, 139, 108974. [Google Scholar] [CrossRef]
- Fehrenbach, G.W.; Murphy, E.; Tanoeiro, J.R.; Pogue, R.; Major, I. Monitoring water contamination through shellfish: A systematic review of biomarkers, species selection, and host response. Ecotoxicol. Environ. Saf. 2025, 295, 118120. [Google Scholar] [CrossRef] [PubMed]
- Yang, Y.; Xiong, Y.; Wang, T.; Zhang, J.; Feng, L.; Gao, G. Seaweed and shellfish mariculture as nature-based solutions: Mitigating nutrient pollution from coastal fish mariculture and sewage. Mar. Pollut. Bull. 2026, 222, 118793. [Google Scholar] [CrossRef] [PubMed]
- Derakhshan-Babaei, F.; Mirchooli, F.; Mohammadi, M.; Nosrati, K.; Egli, M. Tracking the origin of trace metals in a watershed by identifying fifingerprints of soils, landscape and river sediments. Sci. Total Environ. 2022, 835, 155583. [Google Scholar] [CrossRef] [PubMed]
- Chen, X.; Strokal, M.; Kroeze, C.; Ma, L.; Shen, Z.; Wu, J.; Chen, X.; Shi, X. Seasonality in river export of nitrogen: A modelling approach for the Yangtze River. Sci. Total Environ. 2019, 671, 1282–1292. [Google Scholar] [CrossRef]
- Gao, C.; Zhang, M.; Song, K.; Wei, Y.; Zhang, S. Spatiotemporal analysis of anthropogenic phosphorus flfluxes in China. Sci. Total Environ. 2020, 721, 137588. [Google Scholar] [CrossRef]
- Wang, J.; Yuan, S.; Tang, L.; Pan, X.; Pu, X.; Li, R.; Shen, C. Contribution of heavy metal in driving microbial distribution in a eutrophic river. Sci. Total Environ. 2019, 712, 136295. [Google Scholar] [CrossRef]
- Wang, J.; Sui, Q.; Lyu, S.; Huang, Y.; Huang, S.; Wang, B.; Xu, D.; Zhao, W.; Kong, M.; Zhang, Y.; et al. Source apportionment of phenolic compounds based on a simultaneous monitoring of surface water and emission sources: A case study in a typical region adjacent to Taihu Lake watershed. Sci. Total Environ. 2020, 722, 137946. [Google Scholar] [CrossRef]
- Akbarzadeh, Z.; Maavara, T.; Slowinski, S.; Van Cappellen, P. Effects of Damming on River Nitrogen Fluxes: A Global Analysis. Glob. Biogeochem. Cycles 2019, 33, 1339–1357. [Google Scholar] [CrossRef]
Disclaimer/Publisher’s Note: The statements, opinions and data contained in all publications are solely those of the individual author(s) and contributor(s) and not of MDPI and/or the editor(s). MDPI and/or the editor(s) disclaim responsibility for any injury to people or property resulting from any ideas, methods, instructions or products referred to in the content. |
© 2025 by the authors. Licensee MDPI, Basel, Switzerland. This article is an open access article distributed under the terms and conditions of the Creative Commons Attribution (CC BY) license.