Article

Climate and Landscape Drivers of Endangered Bird Distributions and Richness in South Korea: Random Forest Projections Across Municipalities and National Parks Under SSP Scenarios


1
National Institute of Ecology, Seocheon 33657, Republic of Korea
2
Department of Biological Sciences, Konkuk University, Seoul 05029, Republic of Korea
*
Author to whom correspondence should be addressed.
Diversity 2026, 18(1), 6; https://doi.org/10.3390/d18010006
Submission received: 22 November 2025 / Revised: 17 December 2025 / Accepted: 19 December 2025 / Published: 21 December 2025
(This article belongs to the Section Biodiversity Conservation)

Abstract

Climate change poses an unprecedented threat to global biodiversity, with birds serving as critical indicators of ecosystem responses. This study assessed the impacts of climate change on 29 endangered bird species in South Korea, a critical stopover region within the East Asian-Australasian Flyway (EAAF). Using Random Forest models, we predicted current (2010 baseline) and future species distributions under two climate scenarios (SSP2-4.5 and SSP5-8.5) for four time periods (2030s, 2050s, 2070s, and 2090s). Model performance was robust, with a mean AUC of 0.844 ± 0.122 across all species and 72.4% of species achieving AUC ≥ 0.80. Elevation emerged as the most influential predictor for 44.8% of species, followed by precipitation of the driest month (17.2%) and distance to water bodies (10.3%). Current species richness patterns showed spatial heterogeneity, with higher concentrations along coastal wetlands, particularly in the western and southern coasts and Jeju Island. Under SSP2-4.5, species richness patterns remained relatively stable through 2090, while SSP5-8.5 projected more dramatic shifts, particularly after 2070. Coastal regions and national parks exhibited differential responses, with some areas showing increases and others experiencing declines in species richness. High-elevation national parks, including Mt. Hallasan, Mt. Seoraksan, and Mt. Odaesan, demonstrated potential to serve as climate refugia, maintaining relatively stable species richness under both scenarios. Our spatial analysis at municipality and national park levels identified priority conservation areas and emphasized the need for climate refugium identification, habitat connectivity along elevational gradients, and adaptive management strategies. The findings provide actionable guidance for science-based conservation planning and contribute to international efforts to protect migratory birds along the EAAF. Urgent conservation measures are needed to safeguard coastal wetlands and establish ecological corridors to facilitate species range shifts under changing climatic conditions.

1. Introduction

The Earth is currently experiencing an unprecedented biodiversity crisis often described as a sixth mass extinction, with a rapidly increasing number of species facing elevated extinction risk and associated erosion of ecosystem services essential to human well-being [1,2,3]. While multiple anthropogenic drivers—such as land-use change, overexploitation, pollution, and biological invasions—operate simultaneously and often synergistically, climate change is emerging as a dominant, cross-cutting threat that is expected to exacerbate biodiversity loss over the coming decades [4,5,6]. Recent assessments indicate that even under moderate warming scenarios, the proportion of species at high risk of extinction increases markedly with each additional degree of global temperature rise [5,6].
Birds represent one of the most intensively monitored vertebrate groups and are widely regarded as sensitive indicators of environmental change, including climate change [7]. Long-term monitoring has revealed substantial declines in bird populations worldwide. For example, North America has lost nearly 3 billion birds since 1970, corresponding to a net reduction of approximately 29% of the continental avifauna [8]. Projections further suggest that more than half of North American bird species could lose at least half of their current climatic range by the end of the century under high-emission scenarios [9], underscoring the severity of climate-related threats to avian biodiversity.
Climate change affects birds through multiple, interacting pathways. Direct effects include increased energetic costs for thermoregulation and heightened exposure to extreme weather events, whereas indirect effects operate through shifts in habitat quality, food availability, species interactions, and phenological mismatches between migrants and their resources [7,10]. Empirical evidence shows that many species are already tracking changing climates by shifting their distributions towards higher latitudes and elevations [6]. However, such range shifts are constrained by topography and habitat configuration, and high-elevation or range-restricted species are particularly vulnerable to “escalator to extinction” dynamics as suitable climate space contracts upslope [11,12]. These patterns raise critical questions about the capacity of existing protected-area networks to function as effective climate refugia in the long term and highlight the need for adaptive conservation planning under climate change.
Species distribution models (SDMs) have become essential tools for assessing the potential impacts of climate change on biodiversity, by statistically relating species occurrence data to environmental predictors and projecting suitable habitat under alternative climate scenarios [13,14]. SDMs are widely used to identify priority areas for conservation, evaluate the robustness of protected-area networks, and delineate potential climate refugia for threatened species. Methodological advances, including machine learning algorithms such as Random Forest, have improved predictive performance and the capacity to handle complex, nonlinear relationships between species and environmental gradients [13,14]. Despite these advances, SDM applications remain uneven across regions and taxa, and endangered species with limited data often receive less attention.
The Korean Peninsula constitutes a biodiversity hotspot within East Asia due to its complex topography, diverse climate, and broad range of habitats, from temperate forests and wetlands to coastal and island ecosystems. It also lies along the East Asian–Australasian Flyway (EAAF), one of the world’s major migratory bird flyways used by more than 50 million waterbirds and over 250 populations, including numerous globally threatened and near-threatened species [15,16]. Korean Yellow Sea tidal flats serve as critical staging and stopover sites for at least 101 waterbird species (40.4% of all EAAF waterbirds) and 47 shorebird species, including globally threatened taxa such as the Calidris tenuirostris, Numenius madagascariensis, and Calidris pygmaea [17]. These coastal wetlands thus hold outstanding ecological value at both national and international scales.
However, Korean wetlands, particularly intertidal mudflats, have undergone extensive degradation and loss due to large-scale land reclamation, coastal development, and associated human activities since the 1980s, resulting in the disappearance of more than 30% of historical tidal flats [16,17]. In response, the Korean government has designated numerous bird species as legally protected endangered wildlife, many of which depend on vulnerable habitats such as tidal flats, estuaries, reservoirs, and high-elevation forests and exhibit diverse ecological niches and migratory strategies [15,16]. For these species, climate change operates in addition to ongoing habitat loss and degradation, potentially reshaping spatial patterns of habitat suitability and species richness across administrative units and protected areas.
Despite the recognized importance of the Korean Peninsula within the EAAF and the legal protection of endangered bird species, quantitative assessments of how climate change may alter the distributions and richness patterns of these species remain limited. Previous studies have often focused on individual species or specific sites or have been restricted to current climatic conditions without explicitly considering future climate change scenarios. Consequently, there is a critical knowledge gap regarding where suitable habitats and climate refugia for endangered birds are likely to persist or emerge under different warming trajectories, and how well existing municipalities and national parks will safeguard these areas in the future.
To address this gap, we applied a Random Forest–based SDM framework to endangered bird species in South Korea. Specifically, we aimed to: (1) model the current potential distributions of 29 legally protected endangered bird species using high-resolution environmental predictors; (2) project future habitat suitability under shared socioeconomic pathway (SSP) climate scenarios; (3) quantify spatial patterns of endangered bird species richness under present and future climates; (4) identify potential climate refugia and priority conservation areas at the scales of municipalities and national parks; and (5) derive science-based implications for conservation and management strategies that enhance the climate change resilience of endangered birds along the EAAF.

2. Materials and Methods

2.1. Study Area

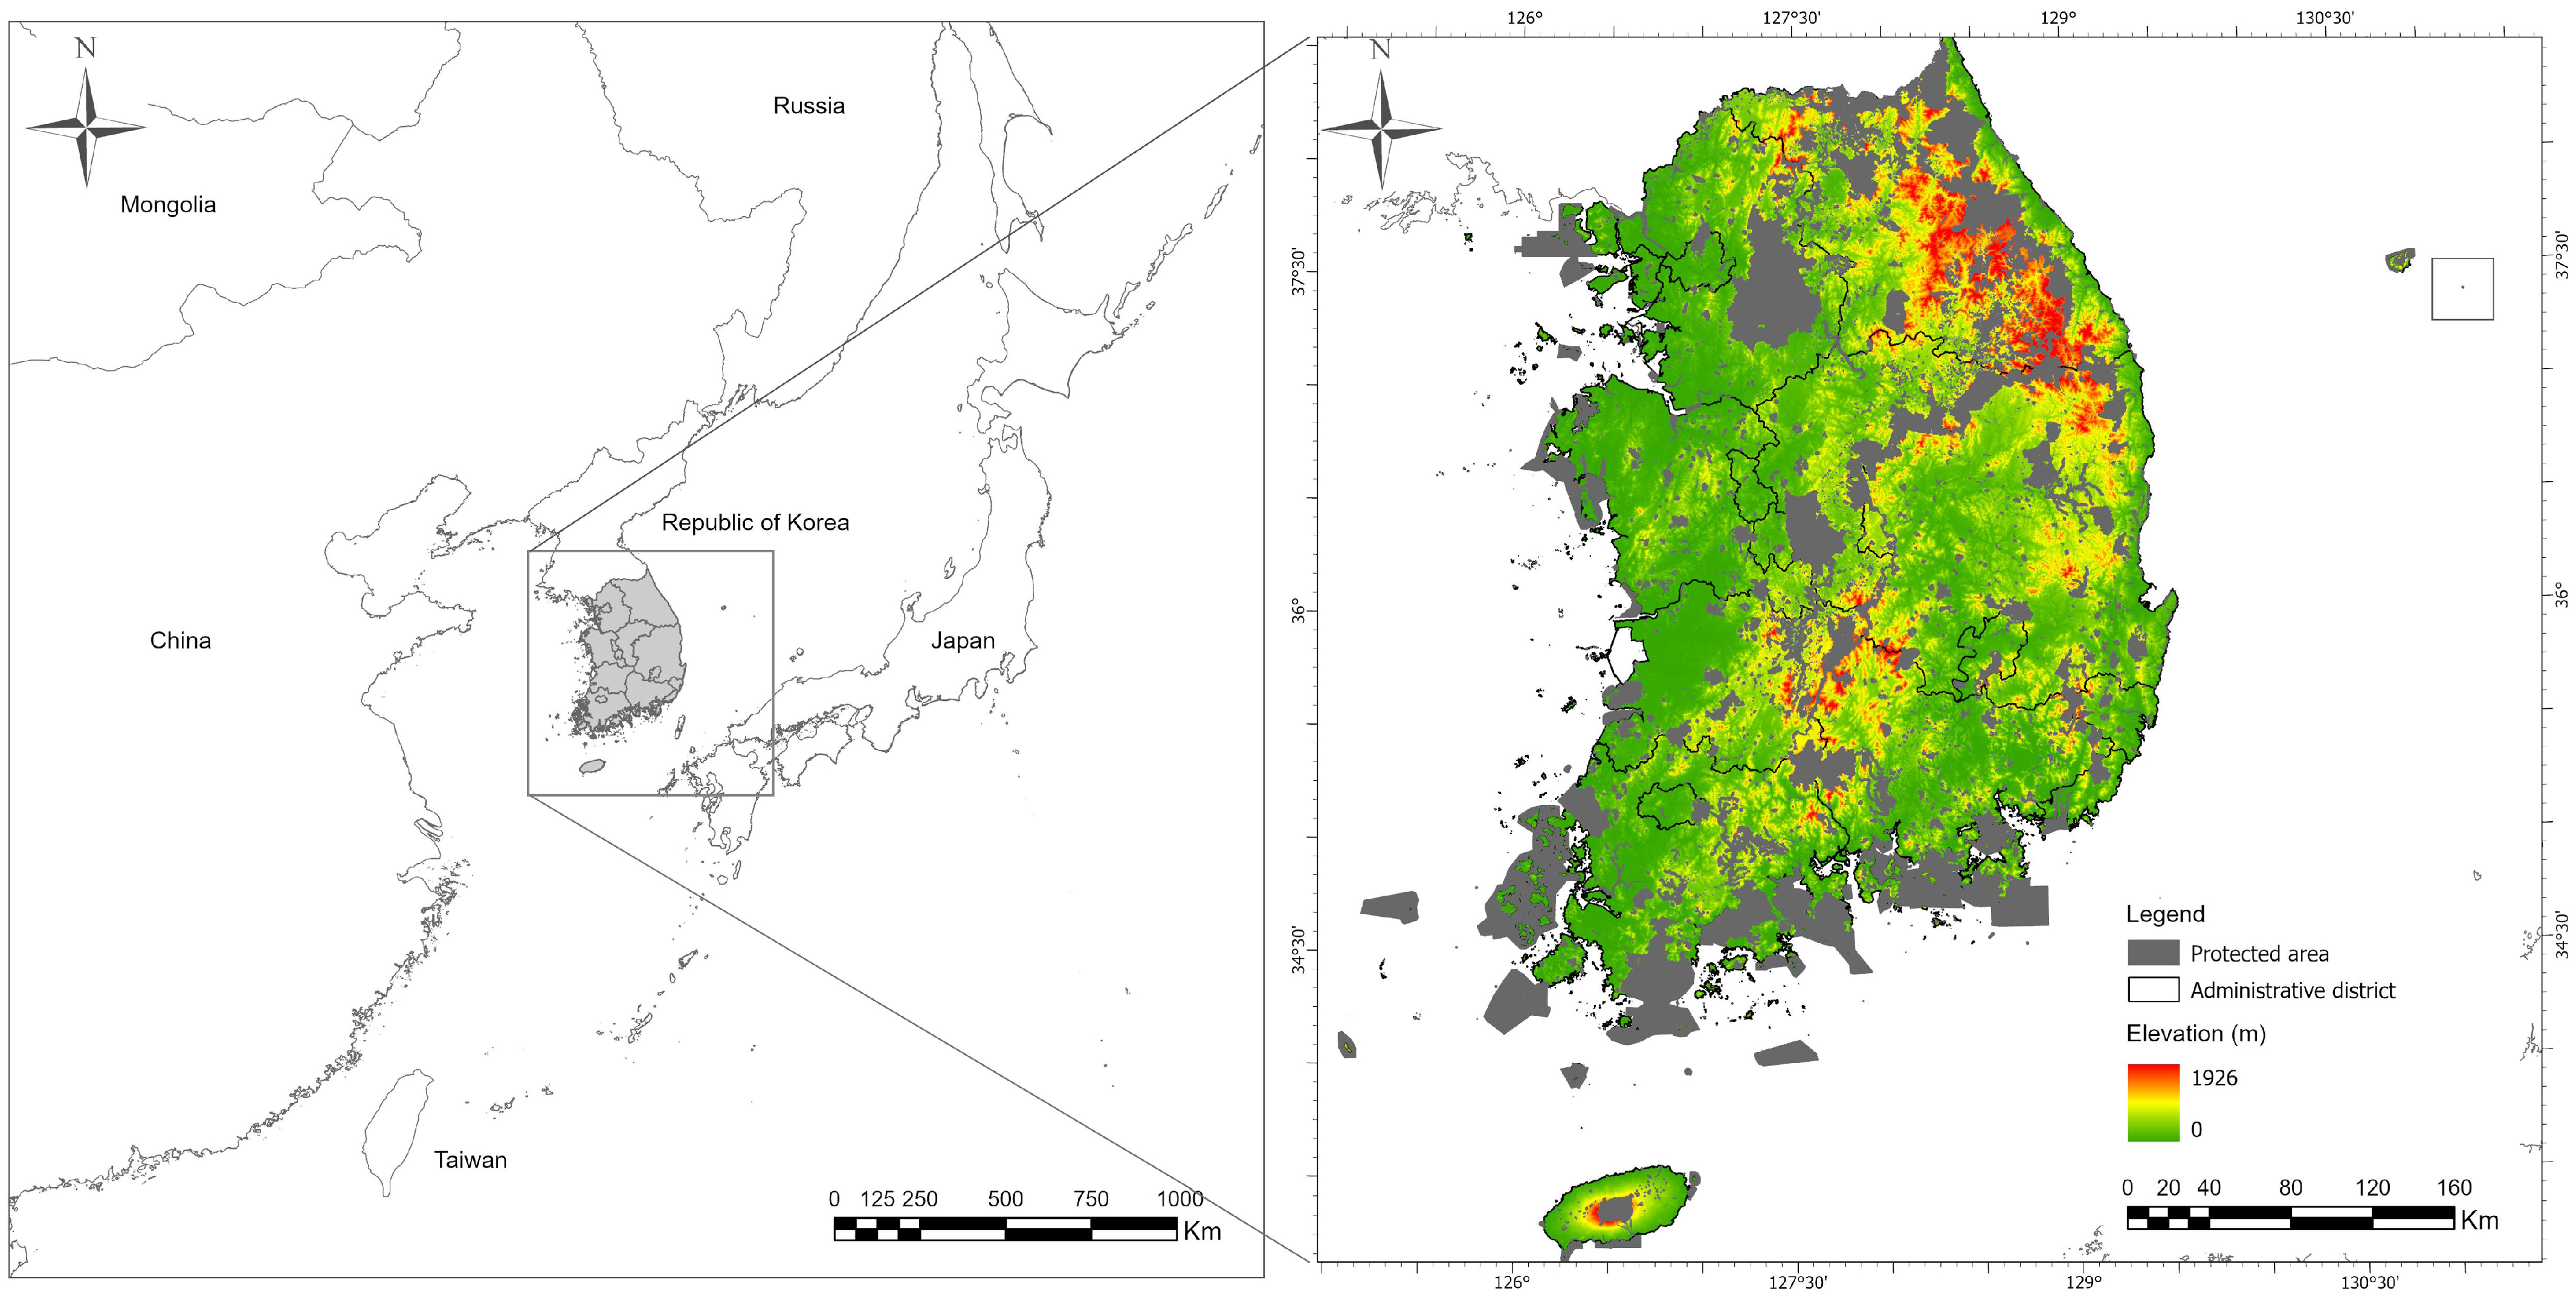
This study was conducted across the entire territory of the Republic of Korea, including all terrestrial areas of the Korean Peninsula south of the Demilitarized Zone (DMZ) (Figure 1). The country covers approximately 100,000 km2 and encompasses a broad elevational range from coastal lowlands at sea level to mountain peaks exceeding 1900 m a.s.l., resulting in highly heterogeneous topography [18]. About 70% of the land area consists of mountainous and hilly terrain, with major mountain ranges concentrated in the northern and eastern regions, while the western and southern parts are dominated by low-lying coastal plains and alluvial basins [19,20]. The climate is classified as temperate monsoon, with four distinct seasons strongly influenced by the East Asian monsoon system. Summers are typically warm and humid, whereas winters are cold and dry [20]. Climatic conditions vary along latitudinal and altitudinal gradients, forming warm-temperate zones in the south, temperate zones in central regions, and cooler temperate to subalpine climates in the north and high mountains [20]. Mean annual temperature generally ranges from about 10 to 15 °C, and mean annual precipitation ranges from approximately 1000 to 1800 mm, with higher rainfall in southern and mountainous areas [18,19].
Natural vegetation is dominated by temperate deciduous broadleaf forests and coniferous forests, while evergreen broadleaf forests occur along the southern coasts and on some offshore islands [19,20]. High-elevation areas support subalpine shrublands, grasslands, and montane ecosystems that harbor numerous endemic and range-restricted species, contributing to the region’s overall biodiversity value [19,20]. Korean coastal wetlands, including tidal flats, estuaries, and shallow coastal lagoons along the Yellow Sea and South Sea, form critical staging, stopover, and wintering habitats for migratory waterbirds along the East Asian–Australasian Flyway (EAAF) [17,21]. The EAAF is one of the world’s longest and most heavily used migratory flyways, extending from the Russian tundra to New Zealand and supporting more than 50 million waterbirds across numerous populations, including many globally threatened species [15,16]. These coastal ecosystems are therefore recognized as sites of outstanding international importance for waterbird conservation [17,21].
Considering this environmental heterogeneity and the presence of key habitats for migratory and resident birds, we defined the entire territory of the Republic of Korea south of the DMZ as the spatial domain for modeling current and future habitat suitability and species richness patterns of 29 legally protected endangered bird species.

2.2. Species Occurrence Data

2.2.1. Target Species Selection

The target species in this study are 29 bird species that are legally designated as endangered wildlife under the Wildlife Protection and Management Act of the Republic of Korea. These species are listed as Endangered Wildlife Class I or II by the Ministry of Environment and are subject to strict legal protection. We focused on species with sufficient and reliable occurrence records to enable robust species distribution modeling. The full list of target species, including their scientific names and legal conservation status, is provided in Table 1. The primary objective of this study is to analyze current and future changes in the distributions and habitats of these legally protected endangered bird species. The selected species encompass a wide range of ecological traits and habitat affinities. Based on dominant habitat use, they can be broadly grouped into waterbirds and shorebirds (e.g., Anser cygnoides, Saundersilarus saundersi, Haematopus ostralegus), forest-dwelling raptors (e.g., Aquila chrysaetos, Aegypius monachus, Buteo hemilasius), and species associated with agricultural landscapes, open lowlands, and inland wetlands (e.g., Cygnus cygnus, Anser fabalis, Circus cyaneus). This ecological diversity highlights the need for differentiated, species-specific conservation strategies that account for contrasting habitat requirements and sensitivities to environmental change [22].

2.2.2. Occurrence Data Compilation

Occurrence records for the 29 target species were compiled from three authoritative sources. First, we used data from the National Ecosystem Survey conducted by the National Institute of Ecology, which provides standardized nationwide biodiversity survey data collected between 1997 and 2021. Second, we incorporated long-term bird monitoring data from national parks and other protected areas, including systematic surveys carried out by relevant governmental and affiliated institutions between 2003 and 2022. Third, we used records from the national database of endangered species observations, which compiles legally reported occurrences of endangered wildlife from 2001 to 2022. Together, these datasets provide extensive spatial and temporal coverage of major habitats and seasons across South Korea and offer essential information on the habitat use and distributions of the target species [22]. To ensure data quality, we applied several filtering and preprocessing steps. Duplicate records within the same 1 km2 grid cell were merged, and records with obvious errors or uncertainty in species identification or geographic coordinates were removed. All occurrence points were then projected onto a 1 km × 1 km national grid system to match the spatial resolution of the environmental predictors. This approach helps reduce the influence of heterogeneous survey effort, mitigates spatial clustering of records, and decreases spatial autocorrelation in the input data [24,25].

2.3. Environmental Predictors

2.3.1. Bioclimatic Variables

Climatic predictors were obtained from 1 km × 1 km gridded datasets produced by the Korea Meteorological Administration (KMA). These products are based on a statistical ensemble of five regional climate models (HadGEM3-RA, WRF, CCLM, GRIMs, and RegCM4) and provide improved representation of regional climatic conditions over the Korean Peninsula. The ensemble mean of these models was used to reduce uncertainty associated with individual model outputs and to generate spatially continuous climate surfaces suitable for species distribution modeling. We selected six bioclimatic variables as climatic predictors: annual mean temperature (BIO1), mean diurnal temperature range (BIO2), isothermality (BIO3), annual precipitation (BIO12), precipitation of the wettest month (BIO13), and precipitation of the driest month (BIO14) (Table 2). These variables capture major thermal and moisture gradients that are known to influence the physiology, behavior, and habitat suitability of birds, including temperature and precipitation regimes as well as intra-annual variability [26,27]. All bioclimatic variables were derived for the baseline period corresponding to the climatological normal of 1995–2014 and were used as proxies for “current” climatic conditions (hereafter referred to as 2010).

2.3.2. Topographic and Anthropogenic Variables

Topographic predictors were derived from a 1 km2 digital elevation model (DEM) for South Korea. Elevation (m a.s.l.) was used as a proxy for combined climatic and habitat gradients that often co-vary with altitude, such as temperature, precipitation, vegetation structure, and land use [19,20]. Slope (degrees) was calculated from the DEM to represent local terrain steepness, which can influence habitat availability, nesting site suitability, and accessibility for both birds and human activities [19,20]. To represent human influences on species distributions, we included two distance-based variables. Distance to the nearest road (Dist_road, km) was calculated from a national road network map and used as a proxy for anthropogenic disturbance, habitat fragmentation, and accessibility. Distance to the nearest water body (Dist_water, km) was computed from national hydrographic data, including rivers, streams, lakes, and reservoirs, and was used to represent the availability and proximity of aquatic habitats that are critical for many waterbirds and wetland-associated species [22]. For both variables, Euclidean distance from the center of each 1 km2 grid cell to the nearest linear or polygonal feature was calculated.
All environmental layers (bioclimatic, topographic, and anthropogenic) were standardized to a common spatial resolution of 1 km2 and projected to a common coordinate reference system (WGS 1984) to ensure spatial consistency among predictors and with the gridded species occurrence data. Baseline environmental conditions used for model calibration thus represent the 1995–2014 climatological normal and associated static landscape variables, hereafter referred to as the 2010 baseline.

2.3.3. Assessment of Multicollinearity

To address potential multicollinearity among predictors, we calculated pairwise Pearson correlation coefficients for all environmental variables across the study area. Variables with high absolute correlations (|r| ≥ 0.7) were considered strongly correlated and examined carefully [28]. In such cases, we evaluated the ecological interpretability and complementary information content of each variable rather than applying a purely statistical exclusion rule. Random Forest models are relatively robust to multicollinearity because they rely on bootstrap sampling and random selection of predictors at each split, which tends to reduce the influence of correlated variables on overall model performance [13,29]. Therefore, we retained six bioclimatic variables, two topographic variables, and two anthropogenic distance variables (10 predictors in total) for species distribution modeling. This predictor set provided an ecologically meaningful representation of climatic, topographic, and anthropogenic gradients while maintaining acceptable levels of inter-correlation for robust model fitting [13,28,29].

2.4. Future Climate Scenarios

2.4.1. Selection of Climate Scenarios

Future projections of species distributions were generated under two Shared Socioeconomic Pathway (SSP) scenarios adopted in the IPCC Sixth Assessment Report: SSP2-4.5 and SSP5-8.5. These scenarios are part of the CMIP6 framework and represent contrasting futures in terms of socioeconomic development, energy use, and climate policy [30,31] (Table 3). SSP2-4.5 describes a “middle-of-the-road” pathway in which historical trends largely continue and climate policies lead to intermediate stabilisation of radiative forcing. In contrast, SSP5-8.5 describes a fossil fuel–intensive development pathway characterised by rapid economic growth, continued reliance on carbon-intensive energy, and high greenhouse-gas emissions [30,31]. SSP2-4.5 reaches a radiative forcing level of approximately 4.5 W/m2 by 2100 and represents a moderate mitigation pathway with intermediate emissions relative to more stringent and more extreme scenarios. SSP5-8.5 reaches about 8.5 W/m2 by 2100 and represents a high-emissions pathway with limited climate mitigation and strong dependence on fossil fuels [30,31]. These two scenarios were selected to bracket a plausible range of future climate conditions and to evaluate how endangered bird habitats and species richness may respond under intermediate versus high levels of warming.

2.4.2. Future Climate Data

Future climate data for each SSP scenario and time period were obtained from high-resolution projection products provided by the Korea Meteorological Administration (KMA). These datasets are based on an ensemble of regional climate models developed under the CMIP6 framework and statistically downscaled to a spatial resolution of 1 km2 over South Korea. The use of an ensemble mean reduces uncertainties associated with individual model outputs and provides spatially detailed climate projections suitable for species distribution modeling [32]. Projections were generated for four future time slices: the 2030s (2021–2040), 2050s (2041–2060), 2070s (2061–2080), and 2090s (2081–2100). Together with the 2010 baseline (1995–2014 climatology), these time periods capture both near-term changes relevant to immediate conservation planning and long-term trends that are important for understanding trajectories of habitat change [30,31]. Topographic variables (elevation and slope) were held constant across all time periods, and anthropogenic distance variables (distance to roads and distance to water bodies) were also kept at their baseline values to isolate the effects of climate change on species distributions.

2.5. Species Distribution Modeling

2.5.1. Random Forest Algorithm

Species distribution models were developed using the Random Forest (RF) algorithm [33]. RF is a machine learning ensemble method that has been widely applied in ecological modeling and has demonstrated high predictive performance for species with limited and heterogeneous occurrence data [24,25]. Random Forest constructs a large number of classification trees using bootstrap samples of the training data and a random subset of predictors at each split. The final prediction is obtained by aggregating (majority voting) the predictions of all individual trees, which reduces variance and improves overall predictive accuracy compared with single-tree models [29,33]. This approach is particularly suitable for modeling complex, nonlinear relationships and interactions between species occurrences and environmental gradients [13,29].
All models were implemented in R (version 4.3.0) using the randomForest package (version 4.7-1.2) [34,35]. For each species, presence records were combined with pseudo-absence data to fit binary RF models. The number of pseudo-absence points was set equal to the number of observed presences, and pseudo-absences were randomly sampled across the entire study area without explicit environmental or geographic restrictions, following recommendations for presence–pseudo-absence modeling in SDM applications [36,37].

2.5.2. Model Parameters

Model parameters were kept simple and consistent across species to facilitate comparison. The number of trees was set to ntree = 500, and the number of predictors randomly selected at each split was set to mtry = 3. The chosen ntree value ensured stabilisation of the out-of-bag (OOB) error rate, while the mtry value followed the commonly used rule of thumb for classification problems (mtry ≈ √p, where p is the number of predictors) [33,35].
Models were calibrated using the baseline environmental conditions representing the 1995–2014 climatological normal (hereafter 2010 baseline). The fitted RF models were then projected onto future environmental conditions under each SSP scenario and time period to generate spatial predictions of habitat suitability (occurrence probability) for each species, scenario, and time slice. This procedure assumes that species–environment relationships estimated from current conditions remain broadly conserved over the projection horizon, an assumption that is commonly adopted in climate change impact assessments using SDMs [26,27].

2.6. Model Evaluation

2.6.1. Cross-Validation Procedure

Model performance was evaluated using a repeated 5-fold cross-validation procedure. In each run, 80% of the available data (presence and pseudo-absence records) for a given species were randomly selected for model training, and the remaining 20% were used for independent testing. The data were randomly partitioned into five equal-sized folds; four folds were used to fit the Random Forest model, and the remaining fold was used for validation. This process was repeated so that each fold served once as the validation set. To reduce the influence of random data partitioning and to obtain stable performance estimates, the entire 5-fold cross-validation procedure was repeated 10 times with different random splits of the data. Model predictions for the held-out test data were stored for each fold and repetition, and performance metrics were calculated based on these predictions. For each species, final performance values were obtained by averaging the metrics across all folds and repetitions. This repeated cross-validation design provides robust estimates of predictive accuracy and reduces variance associated with single random partitions.

2.6.2. Performance Metrics

The predictive performance of the Random Forest models was assessed using three commonly applied metrics: the area under the receiver operating characteristic curve (AUC), the True Skill Statistic (TSS), and Cohen’s Kappa. All metrics were computed from confusion matrices derived from the predicted probabilities and observed presence–absence data for the held-out test sets in each fold and repetition and then averaged to obtain species-level performance indices. AUC is a threshold-independent measure that quantifies the ability of the model to discriminate between presences and absences across all possible probability thresholds. AUC values range from 0.5 (no better than random) to 1.0 (perfect discrimination), with higher values indicating better model performance. In this study, we considered AUC > 0.7 as acceptable, >0.8 as good, and >0.9 as excellent discrimination. In addition to AUC, we used two threshold-dependent metrics: TSS and Kappa [38]. Both are derived from sensitivity (true positive rate) and specificity (true negative rate) calculated at a selected probability threshold. TSS is defined as sensitivity + specificity − 1 and ranges from −1 to +1, where values ≤ 0 indicate performance no better than random and values close to +1 indicate high predictive accuracy. We interpreted TSS > 0.4 as useful, >0.6 as good, and >0.8 as excellent performance [38]. Cohen’s Kappa measures the agreement between observed and predicted occurrences after correcting for agreement expected by chance. Kappa values also range from −1 to +1, with values ≤ 0 indicating no or poor agreement and values close to +1 indicating almost perfect agreement. We interpreted Kappa > 0.4 as moderate, >0.6 as substantial, and >0.8 as almost perfect agreement. For TSS and Kappa, we selected the probability threshold that maximised TSS for each species, as this criterion balances sensitivity and specificity and is widely used in SDM applications [38]. The combination of AUC (threshold-independent) and TSS and Kappa (threshold-dependent) provides complementary information on model discrimination capacity and classification accuracy. Table 4 summarises the three performance metrics, their ranges, interpretation criteria, and key properties.

2.7. Variable Importance Analysis

To quantify the contribution of each environmental predictor to model performance, we used the permutation-based variable importance measure implemented in the Random Forest algorithm [13,29]. For a given fitted model, this procedure evaluates the decrease in predictive accuracy when the values of a specific variable are randomly permuted while all other variables are kept unchanged. A larger decrease in accuracy indicates a stronger influence of that variable on the model predictions [13,29]. For each species, variable importance was calculated for all 10 environmental predictors: six bioclimatic variables (BIO1, BIO2, BIO3, BIO12, BIO13, BIO14), two topographic variables (elevation and slope), and two anthropogenic distance variables (distance to roads and distance to water bodies). Importance scores were first computed for each cross-validation run and then averaged across all folds and repetitions to obtain stable species-level estimates [13,24]. The resulting raw importance scores were normalised within each species by dividing by the maximum score, so that the most influential variable had a value of 1 and all others ranged between 0 and 1. This normalisation facilitates comparison of relative variable importance among predictors and across species [13,24]. Based on the normalised scores, we ranked the 10 variables from 1 (most important) to 10 (least important) for each species. These ranks and normalised scores were then used to summarise dominant environmental gradients and to identify common patterns of variable combinations among species. In particular, we examined the frequency with which each variable appeared as the top-ranked predictor and within the top three predictors across all species, and we characterised typical sets of leading variables that jointly structured species distributions. These summaries provided a basis for interpreting the key climatic, topographic, and anthropogenic drivers of habitat suitability in the subsequent Results and Discussion sections [29,39].

2.8. Species Richness Analysis

2.8.1. Calculation of Species Richness

Species richness was defined, for each grid cell, time period, and climate scenario, as the number of species for which predicted climatic suitability exceeded a species-specific threshold. Predicted suitability values were obtained from the Random Forest models as occurrence probabilities ranging from 0 to 1 for each 1 km × 1 km grid cell. For each species, continuous suitability values were converted into binary presence–absence predictions using the threshold that maximised the True Skill Statistic (TSS). This criterion provides an optimal balance between omission and commission errors and is widely used in species distribution modeling [38,40]. Cells with predicted probabilities greater than or equal to the TSS-based threshold were classified as suitable (presence), whereas cells below the threshold were classified as unsuitable (absence).
Species richness in each grid cell was then calculated by summing the number of species classified as present in that cell. This procedure was applied to the baseline climate (2010; 1995–2014 climatological normal) and to future climate conditions under SSP2-4.5 and SSP5-8.5 for four projection periods (2030s, 2050s, 2070s, and 2090s). To facilitate interpretation in a management context, we summarised species richness at two spatial levels: (i) municipalities (si/gun/gu administrative units) and (ii) national parks. For each spatial unit, we counted the number of species for which at least one grid cell within the unit exceeded the species-specific TSS threshold. In other words, a species was considered present in a given municipality or national park if there was at least one suitable grid cell for that species within the unit. This approach yields species richness values that reflect the potential presence of endangered bird species at scales relevant to regional conservation planning and protected-area management.

2.8.2. Spatial Aggregation

For municipalities, species richness was aggregated within official si/gun/gu administrative boundaries, which represent key units for regional conservation policy, land-use planning, and local governance in the Republic of Korea [22]. Municipal-level richness patterns were used to assess how endangered bird diversity may shift among administrative units under different climate scenarios and to identify municipalities that are likely to gain or lose suitable habitats over time. For national parks, species richness was calculated within the boundaries of terrestrial and coastal national parks managed for biodiversity conservation [22]. National park-level summaries provide an indication of how effectively the existing protected-area network may function as a climate refugium for endangered bird species and how the conservation value of individual parks may change under future climates. The resulting municipal and national park species richness maps provide a spatially aggregated view of current and future patterns of endangered bird diversity. These patterns form a quantitative basis for identifying priority areas, evaluating the robustness of current protected-area and administrative frameworks, and supporting place-based conservation and climate change adaptation strategies [41,42].

3. Results

3.1. Model Performance

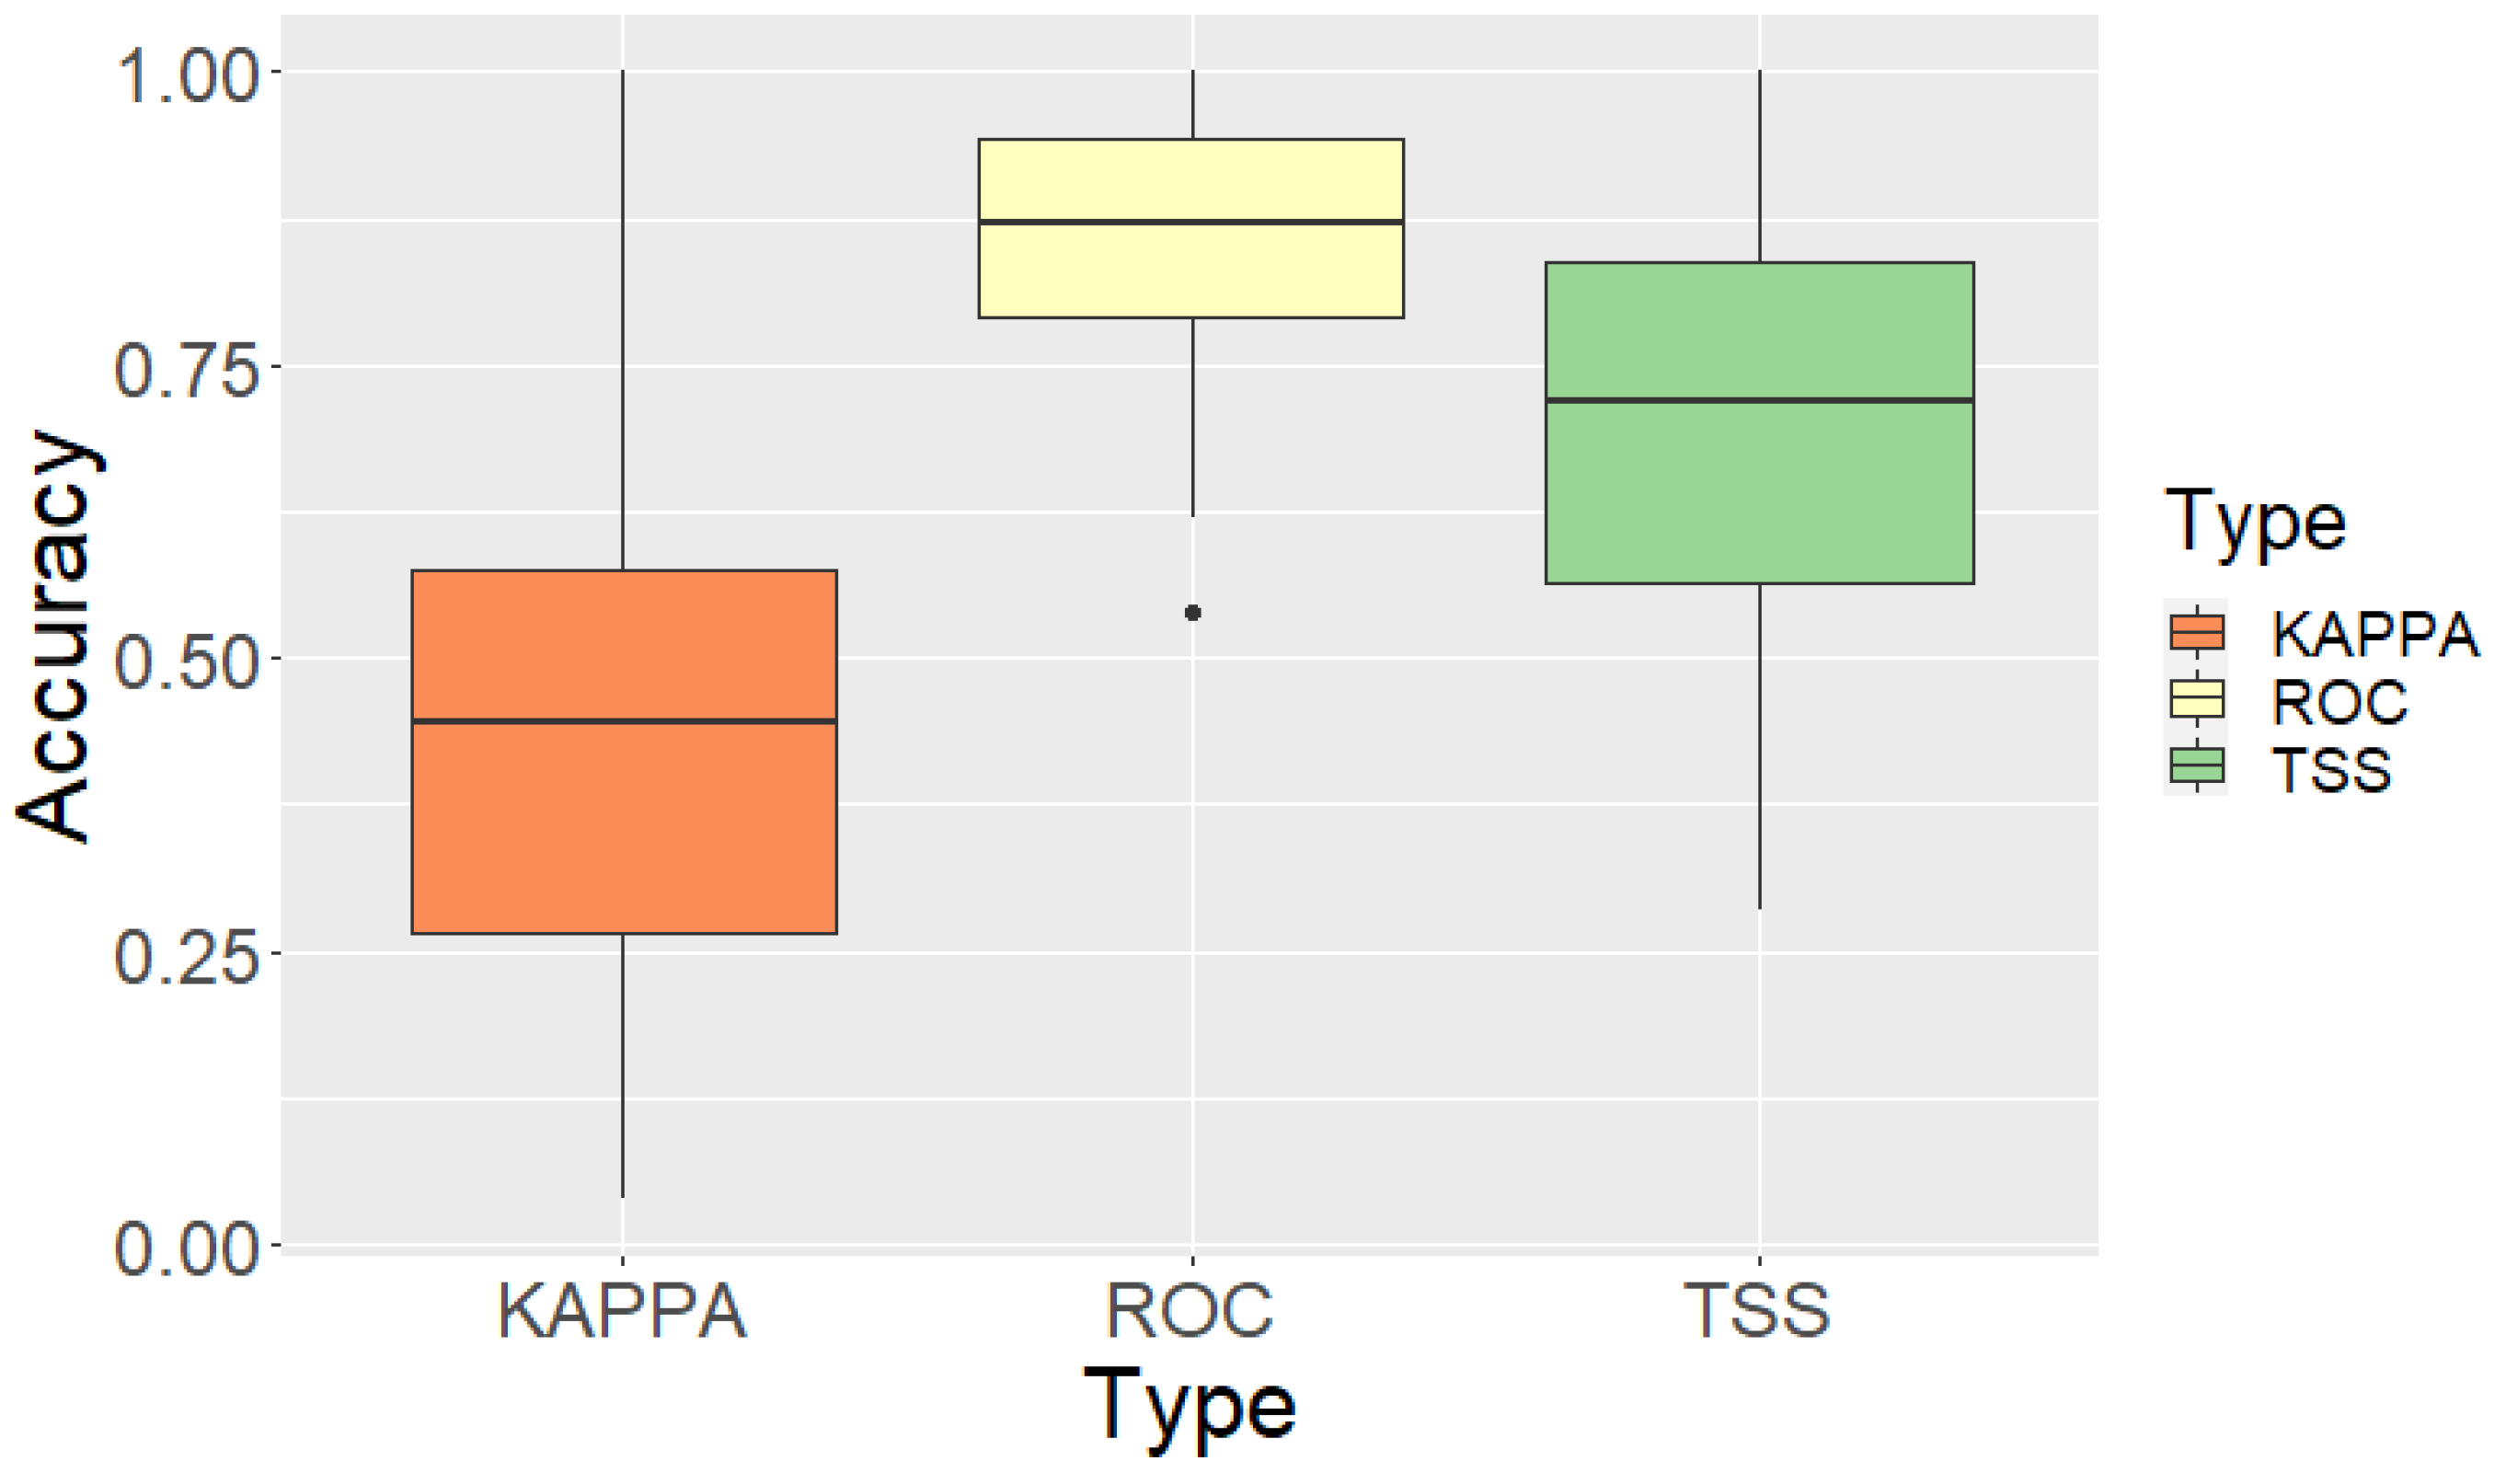
Cross-validation of the Random Forest models for the 29 endangered bird species yielded a mean AUC-ROC of 0.844 ± 0.122, with values ranging from 0.540 to 1.000 (Table 5). The mean TSS was 0.692 ± 0.197 (range: 0.285–1.000), and the mean Kappa was 0.432 ± 0.235 (range: 0.038–1.000). For most species, AUC-ROC values were ≥0.800, TSS values were ≥0.600, and Kappa values were ≥0.400. These three metrics were used in subsequent analyses to summarise model performance and to select species-specific thresholds for converting continuous suitability into binary presence–absence predictions under current and future climate conditions.
In subsequent analyses, we used AUC-ROC as the primary, threshold-independent measure of model discrimination, and TSS and Kappa as complementary, threshold-dependent measures of classification accuracy. The distributions of AUC-ROC, TSS, and Kappa values across species are summarised in Figure 2.

3.2. Species-Level Model Accuracy

Based on species-specific AUC-ROC values, model performance was classified into five categories (Perfect, Excellent, Good, Fair, and Poor). One species, Columba janthina, achieved Perfect performance with AUC = 1.000. Eleven species (37.9%) showed Excellent performance (0.900 ≤ AUC < 1.000), and nine species (31.0%) showed Good performance (0.800 ≤ AUC < 0.900). In total, 21 of the 29 endangered bird species (72.4%) had AUC ≥ 0.800 (Table 6). Within the group of species with the highest AUC-ROC values, Columba janthina (AUC = 1.000), Anser erythropus (0.989), Gallicrex cinerea (0.981), Grus monacha (0.960), and Platalea leucorodia (0.951) showed almost perfect discrimination. Other species such as Pitta nympha, Anser fabalis, Saundersilarus saundersi, Circus cyaneus, Anser cygnoides, and Cygnus cygnus also exhibited Excellent performance with AUC-ROC > 0.900.
By contrast, four species had AUC-ROC < 0.700: Accipiter gentilis (0.686), Strix aluco (0.637), Strix uralensis (0.620), and Cygnus columbianus (0.540). Four additional species (Mergus squamatus, Falco subbuteo, Clanga clanga, and Ciconia boyciana) fell into the Fair category with 0.700 ≤ AUC-ROC < 0.800.

3.3. Relative Importance of Environmental Variables

3.3.1. Overall Contribution of Environmental Predictors

Permutation-based importance analysis showed that elevation was the most influential predictor for 13 of the 29 endangered bird species (44.8%) (Table 7). Precipitation of the driest month (BIO14) was the first-ranked variable for 5 species (17.2%), and distance to water was the first-ranked variable for 3 species (10.3%). Within the set of bioclimatic variables, annual mean temperature (BIO1) and mean diurnal range (BIO2) each emerged as the most important predictor for 2 species (6.9%). Annual precipitation (BIO12), precipitation of the wettest month (BIO13), and isothermality (BIO3) were each ranked first for one species (3.4%). When considering average ranks across all species (1 = most important, 10 = least important), elevation had the lowest mean rank (2.93), followed by BIO14 (4.38), distance to water (4.76), BIO1 (4.86), and BIO2 (4.97). Slope and distance to roads had the highest mean ranks (6.90 and 6.79, respectively) and were not the first-ranked variable for any species.

3.3.2. Species-Level Combinations of Top Three Variables

Based on the combinations of the three most important variables, three main patterns were identified: elevation-centered, water-centered, and mixed types (Table 8). The elevation-centered type comprised species for which elevation had the highest normalised importance score and clearly dominated the top-ranked predictors. Two species (6.9%) belonged to this group: Buteo hemilasius and Platalea leucorodia. The water-centered type included species whose top three predictors were dominated by distance to water and related variables. Five species (17.2%) fell into this category: Aquila chrysaetos, Accipiter gentilis, Charadrius placidus, Anser erythropus, and Cygnus cygnus. The mixed type was the most common pattern. Twenty-two species (75.9%) showed mixed combinations of elevation, distance to water, and one or more bioclimatic variables (BIO1, BIO2, BIO12, or BIO14) among their top three predictors.

3.3.3. Species-Specific Dependence on Key Variables

Several species showed particularly high importance scores for a single variable. Buteo hemilasius had a normalised importance of 0.924 for elevation, and Platalea leucorodia had a normalised importance of 0.847 for elevation, indicating strong concentration of importance on this variable. Distance to water was the variable with the highest importance for some waterbirds and raptors. For example, Anser erythropus had a normalised importance of 0.351 for distance to water, and Accipiter gentilis had a normalised importance of 0.391 for distance to water. Among precipitation-related variables, Dryocopus martius showed the highest importance for precipitation of the wettest month (BIO13; 0.377), and Grus grus showed the highest importance for precipitation of the driest month (BIO14; 0.292). Distance to roads and slope were generally of low importance. For 25 species (86.2%), distance to roads appeared within the bottom three ranks, and slope was among the bottom three variables for 22 species (75.9%) (Table 9).

3.4. Species Distributions and Species Richness Under Baseline Climate

3.4.1. Species Richness at the Municipality Level

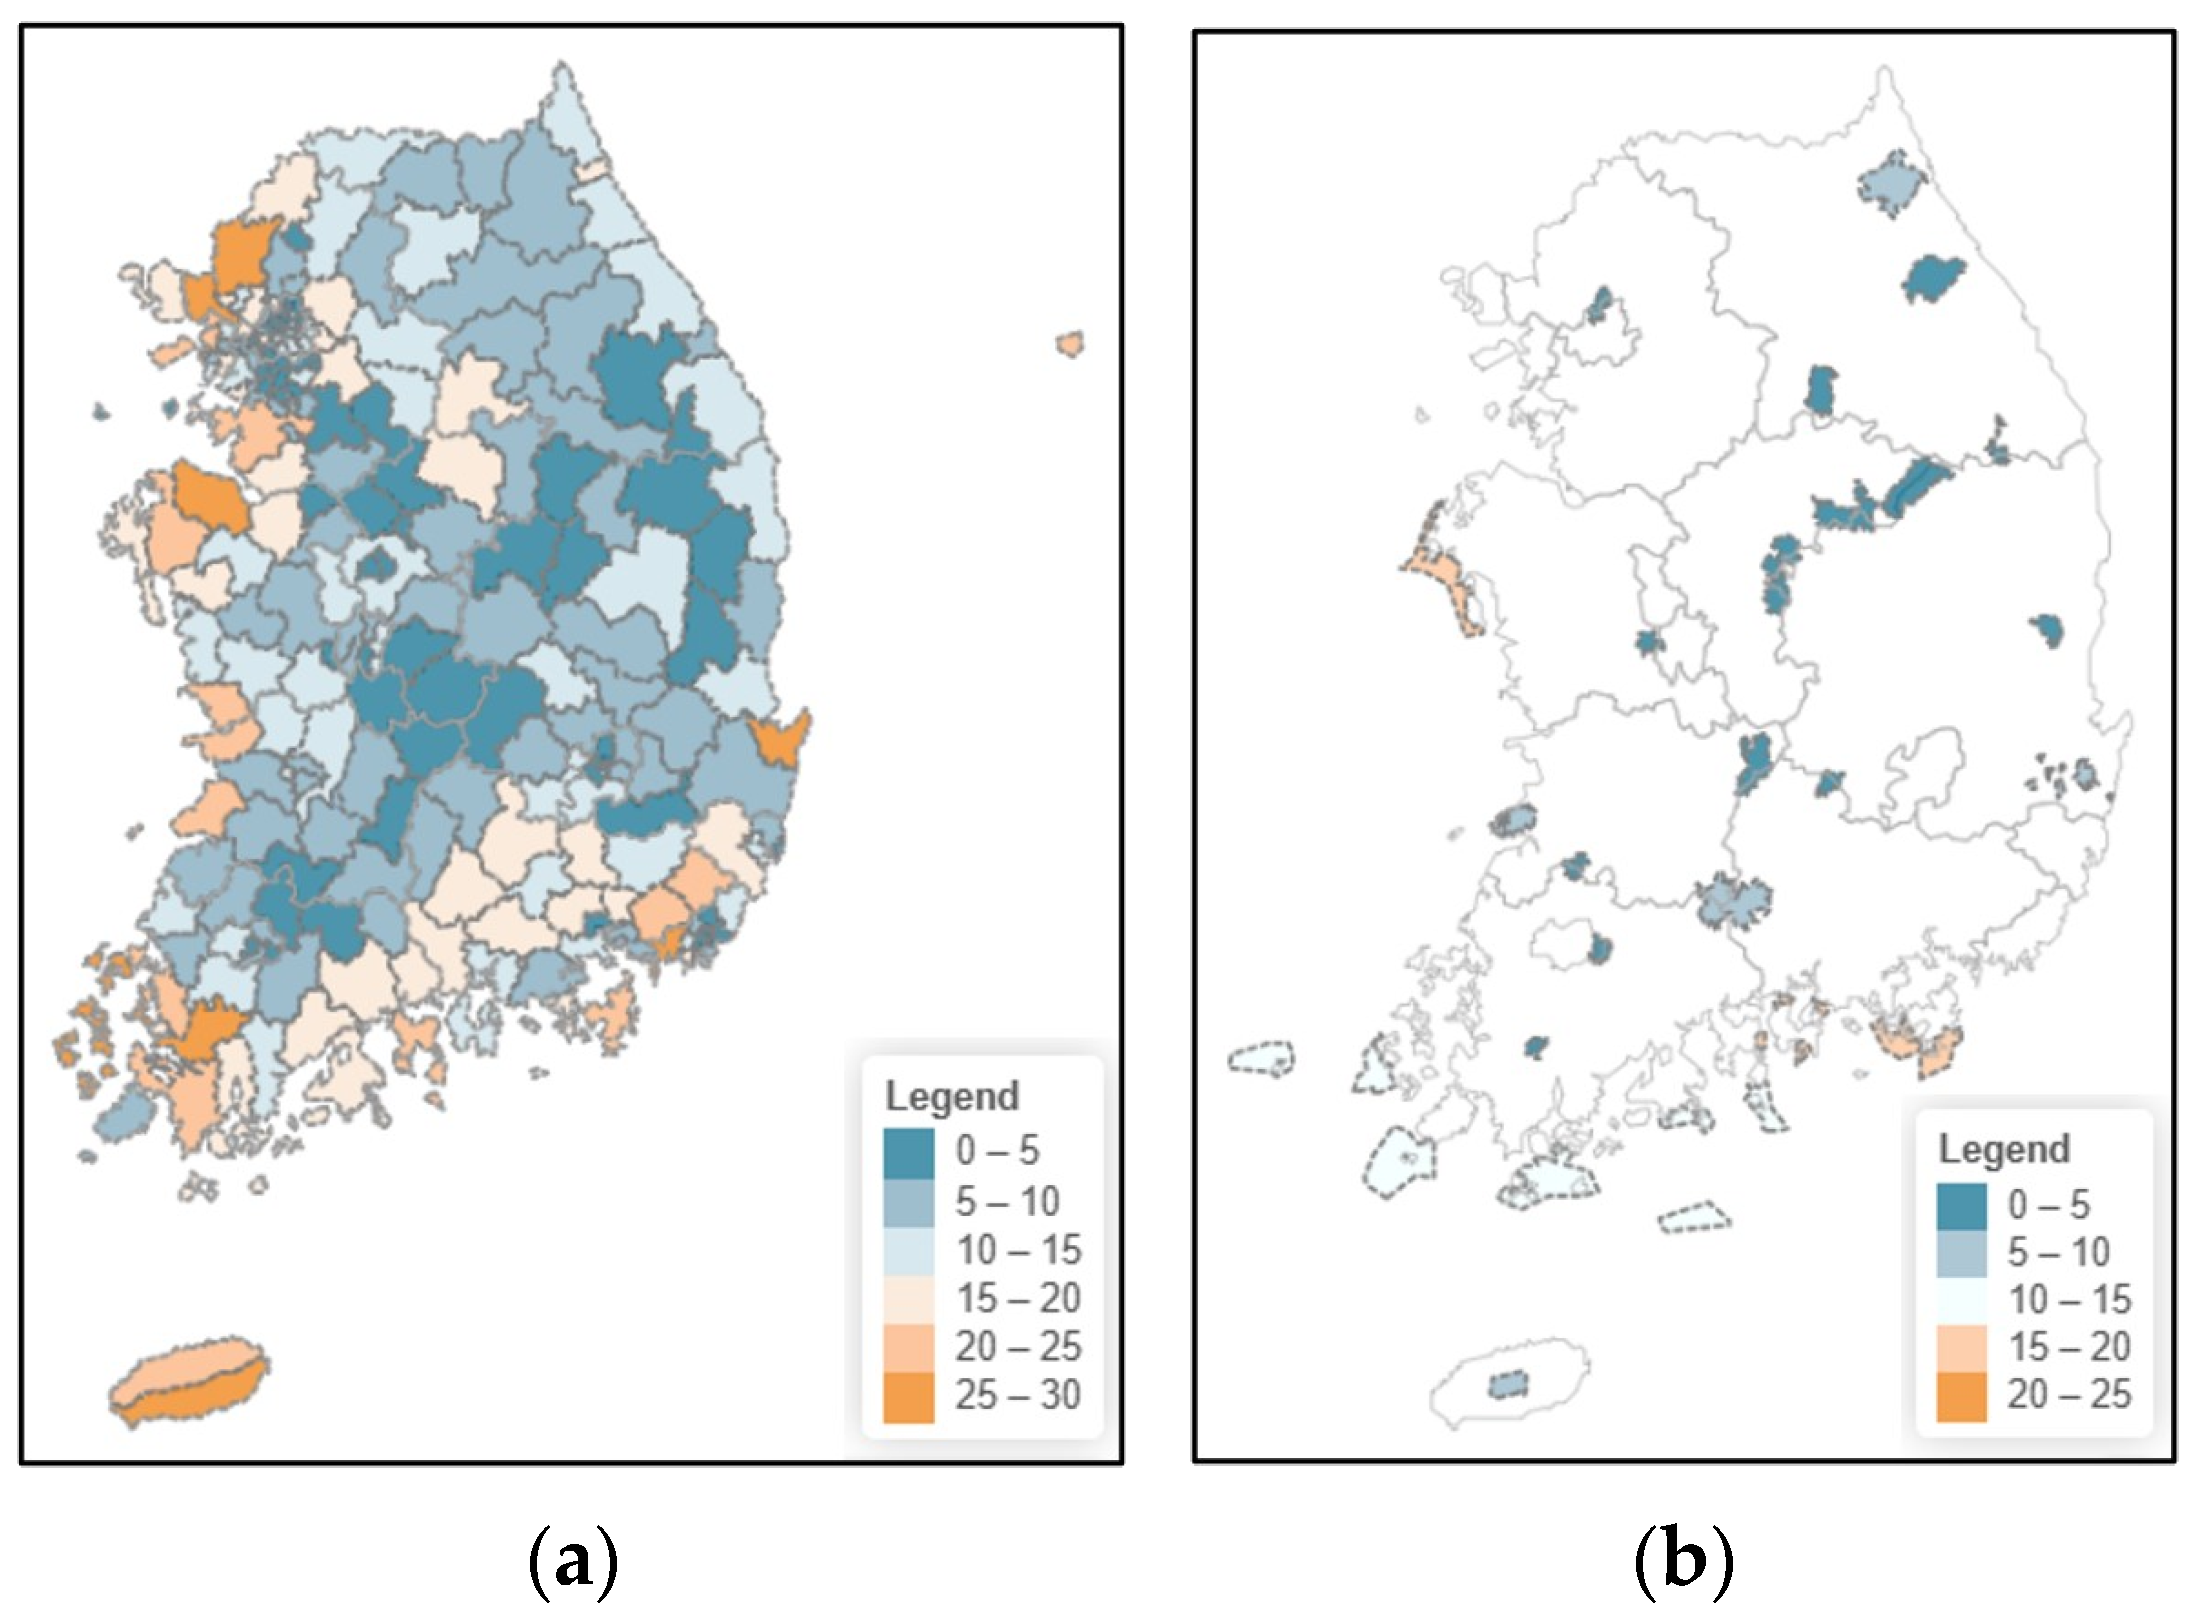
Under baseline climate conditions (2010), municipality-level species richness of the 29 endangered bird species ranged from 0–5 to 20–25 species and was classified into five richness classes (0–5, 5–10, 10–15, 15–20, and 20–25 species). The highest richness class (20–25 species) occurred in a limited number of coastal municipalities along the West Sea and South Sea, as well as on Jeju Island. These high-richness municipalities were mainly concentrated in parts of Incheon and surrounding coastal areas, the western and southwestern coasts of the Korean Peninsula, and segments of the southern coastline, reflecting the importance of coastal and island habitats for endangered birds. Intermediate richness levels (10–15 and 15–20 species) were observed in many other coastal municipalities along the West and South Seas and in some adjacent inland areas. Municipalities with 15–20 species tended to be located along major coastal wetland and estuarine systems, whereas those with 10–15 species were distributed across both coastal transition zones and lowland inland regions. Low richness (5–10 species) was the most widespread category at the national scale. Most inland mountainous and hilly municipalities, including large parts of inland Gangwon-do, northern and central Gyeongsangbuk-do, Chungcheongbuk-do, and inland Jeollabuk-do, fell within this class. The lowest richness class (0–5 species) was mainly restricted to some northern border municipalities near the Demilitarized Zone (DMZ) and a few high-elevation interior areas, where suitable habitats for multiple endangered bird species are scarce (Figure 3a).

3.4.2. Species Richness at the National Park Level

At the national park level, baseline species richness also ranged from 0–5 to 20–25 species and was grouped into the same five richness classes. The highest richness class (20–25 species) was observed in Hallasan National Park on Jeju Island and in parts of marine and coastal national parks in the southwestern region, including sections of Dadohaehaesang National Park. These parks support a diverse assemblage of endangered birds associated with coastal, marine, and montane habitats. High richness (15–20 species) was recorded in several other coastal and coastal–inland transition parks, such as Byeonsanbando National Park on the west coast, portions of Hallyeohaesang National Park along the south coast, and parts of Taebaeksan National Park along the east. Moderate richness (10–15 species) characterised a number of large inland montane national parks, including Seoraksan, Odaesan, and Sobaeksan, as well as some coastal parks with mixed marine–terrestrial environments. These parks provide important breeding and stopover habitats for a subset of the endangered species pool. Lower richness (5–10 species) was mainly found in mid-southern inland mountain parks such as Gyeryongsan, Songnisan, Deogyusan, and Jirisan, which harbour fewer of the 29 endangered species under current climate conditions. The lowest richness class (0–5 species) occurred in a small number of inland parks, including Naejangsan and Woraksan, indicating that these protected areas currently support only a limited fraction of the endangered bird assemblage (Figure 3b).

3.5. Changes in Species Richness Under Future Climate Scenarios

3.5.1. SSP2-4.5 Scenario: Municipality Level

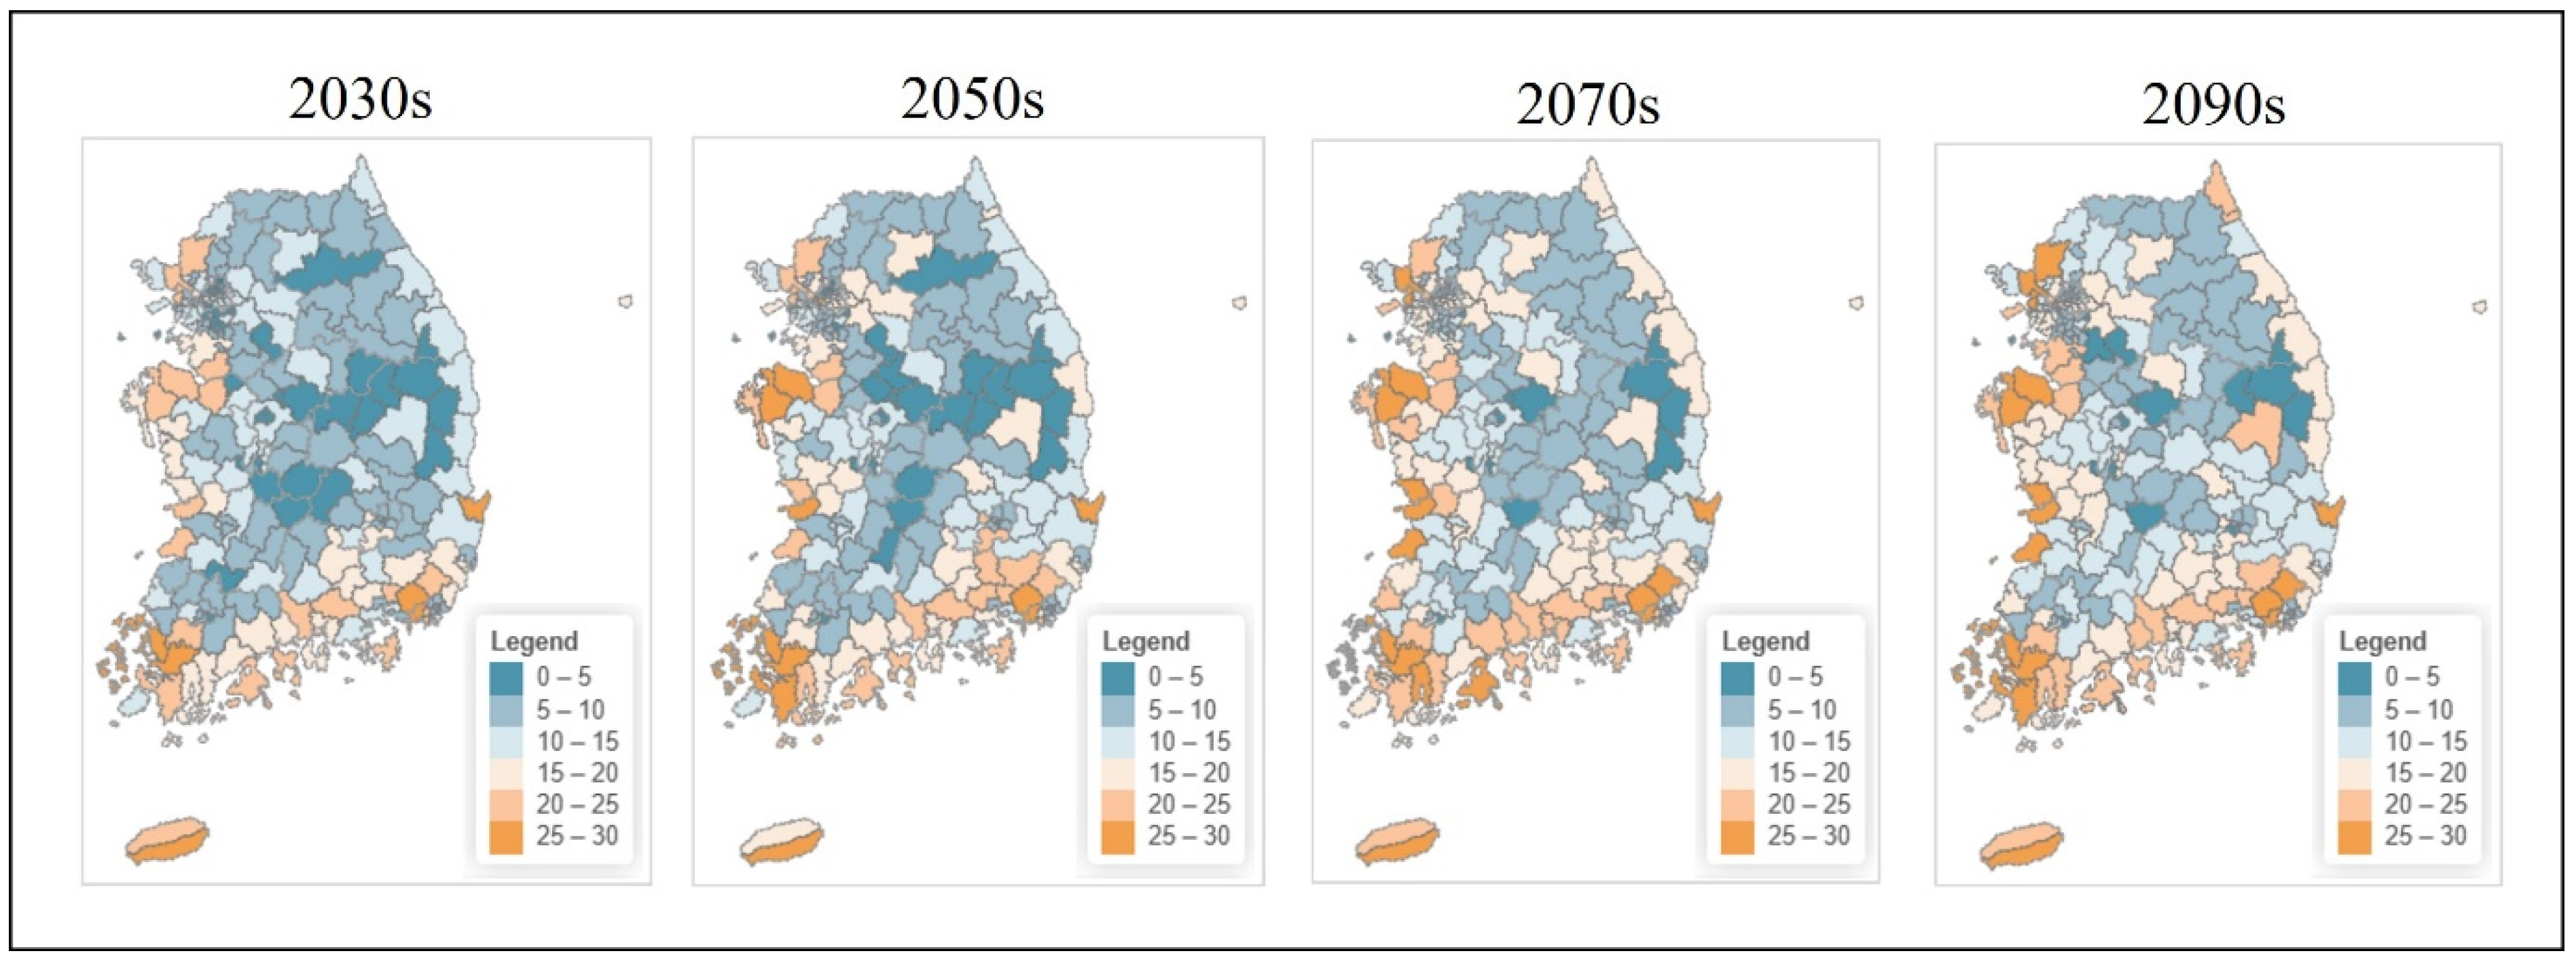
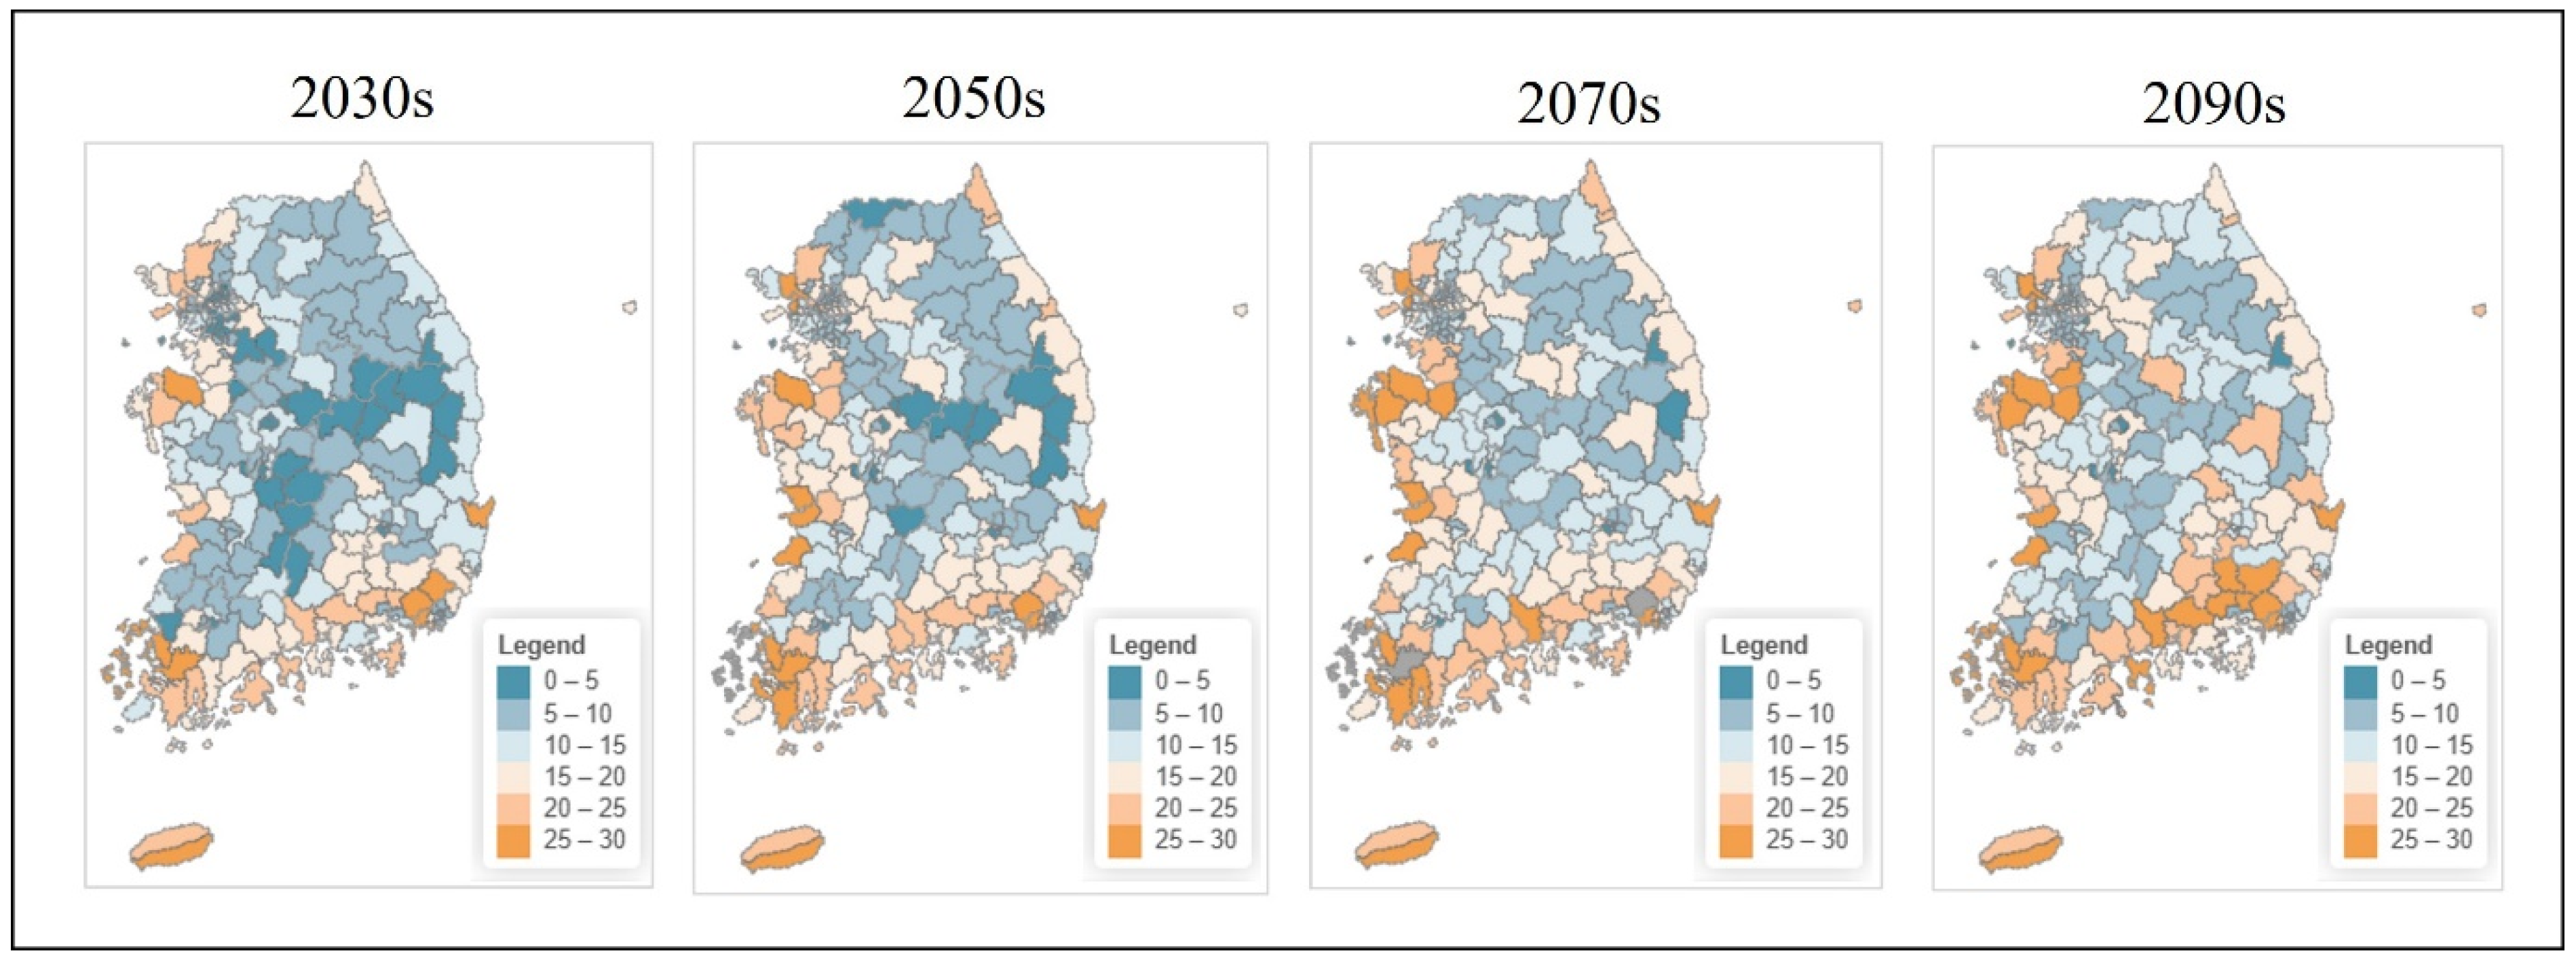
Under SSP2-4.5, municipality-level species richness showed gradual temporal changes (Figure 4). In the 2030s, the spatial pattern was broadly similar to the 2010 baseline: municipalities along the West and South Sea coasts and Jeju Island were mostly in the 20–25 species class, and most inland municipalities were in the 5–10 species class. In the 2050s, the 20–25 species class expanded locally in parts of the southwestern coastal region, while the 0–5 species class appeared in some southern inland and southeastern coastal municipalities. By the 2070s and 2090s, the 0–5 and 5–10 species classes occupied larger areas in southern inland and southeastern coastal municipalities. Municipalities in the northwestern and central western coastal regions were mainly in the 15–20 species class, and the 5–10 species class was the most widespread category at the national scale under SSP2-4.5.

3.5.2. SSP2-4.5 Scenario: National Park Level

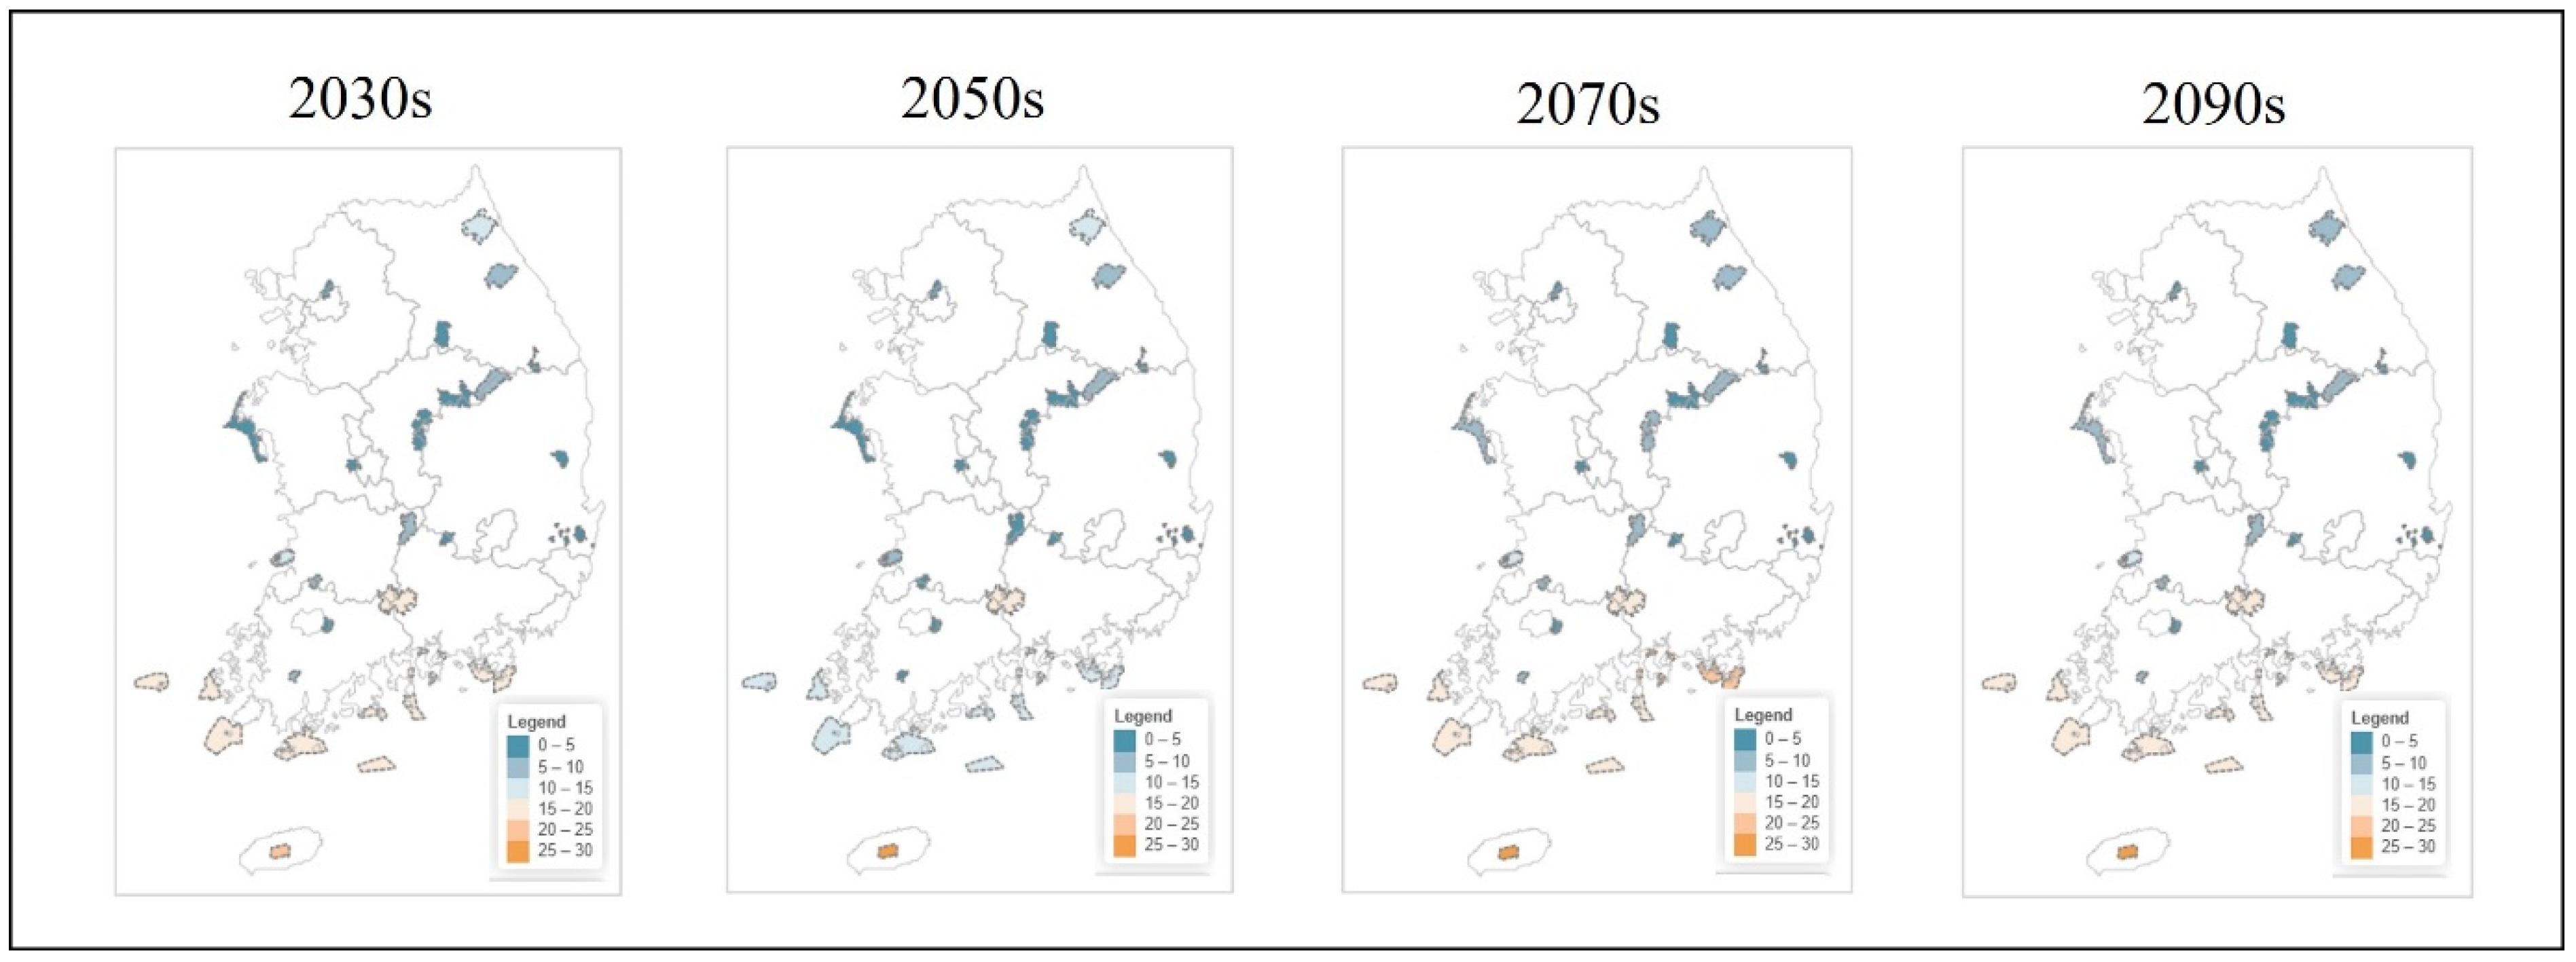
At the national park level, species richness under SSP2-4.5 changed little over time (Figure 5). Mt. Hallasan National Park on Jeju Island remained in the 20–25 species class across all future periods. Several coastal and coastal–inland parks, including parts of Dadohaehaesang, Byeonsanbando, and Hallyeohaesang National Parks, were in the 15–20 species class. Large inland montane parks such as Mt. Seoraksan, Mt. Odaesan, and Mt. Sobaeksan were generally in the 10–15 species class throughout the century. Some southern coastal and low-elevation parks shifted from the 10–15 species class to the 5–10 species class in the 2070s and 2090s, but most parks retained their baseline richness class or shifted by only one class under SSP2-4.5.

3.5.3. SSP5-8.5 Scenario: Municipality Level

Under SSP5-8.5, municipality-level species richness showed more pronounced temporal changes than under SSP2-4.5 (Figure 6). In the 2030s, the pattern was similar to the baseline and to SSP2-4.5, with high richness (20–25 species) along parts of the West and South Sea coasts and on Jeju Island, and 5–10 species in most inland municipalities. From the 2050s onward, the 0–5 species class expanded in southern and southeastern municipalities, and the 20–25 species class became confined mainly to parts of the southwestern and southern coasts and Jeju Island. By the 2070s and 2090s, extensive southern and southeastern inland and coastal municipalities were classified into the 0–5 species class, whereas some southwestern coastal municipalities and Jeju Island remained in the 15–20 or 20–25 species classes. In the 2090s, the spatial contrast between low richness (0–5 species) and high richness (15–25 species) municipalities was greater than in earlier periods.

3.5.4. SSP5-8.5 Scenario: National Park Level

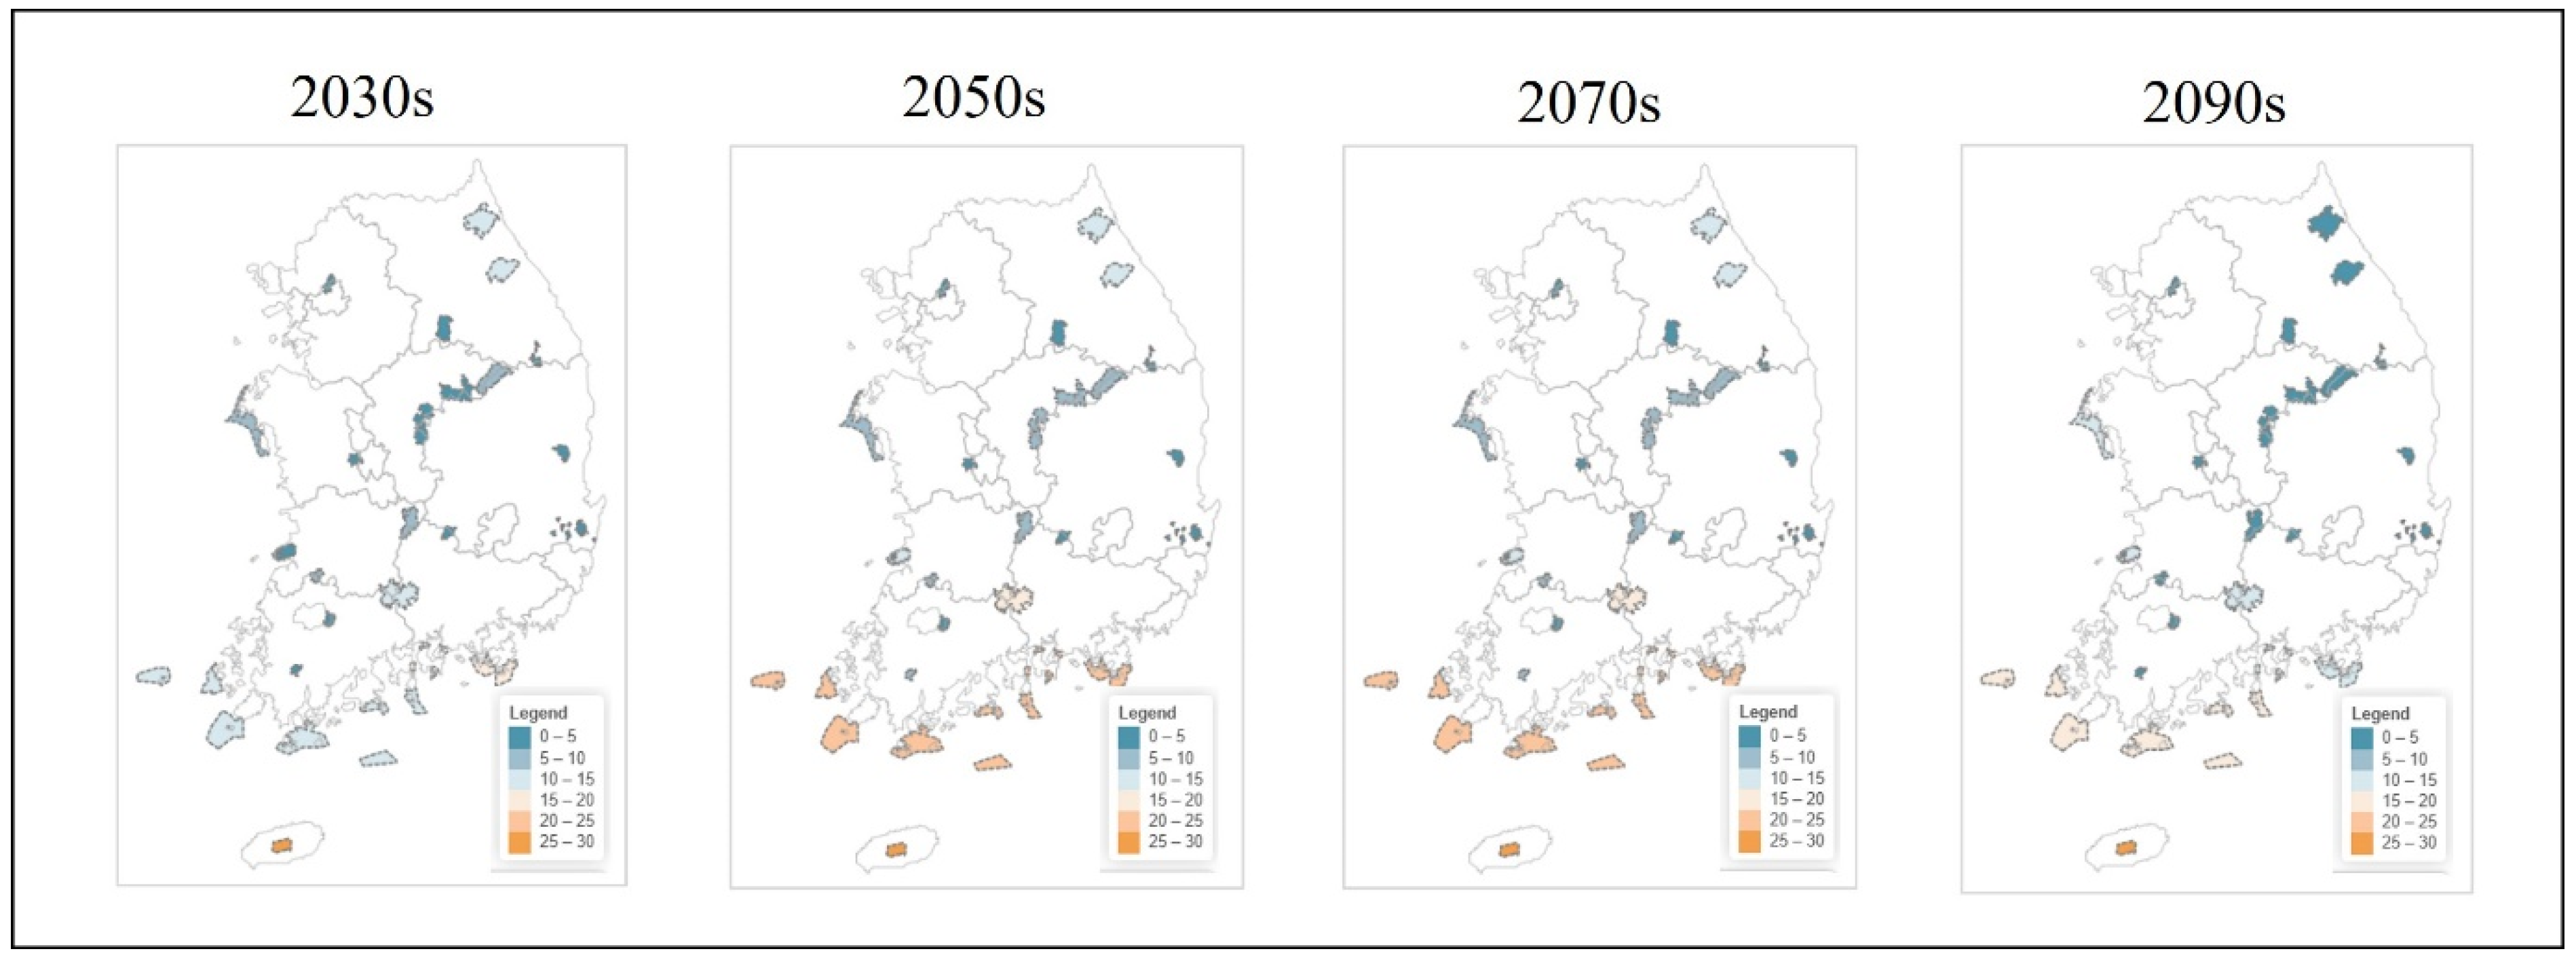
At the national park level, SSP5-8.5 produced clearer temporal shifts than SSP2-4.5 (Figure 7). In the 2030s and 2050s, the overall pattern was comparable to SSP2-4.5: Mt. Hallasan National Park remained in the 20–25 species class, and major northeastern montane parks such as Mt. Seoraksan and Mt. Odaesan were in the 10–15 species class. In the 2070s and 2090s, several low-elevation and southern parks moved to lower richness classes, mainly 5–10 species or below. Mt. Hallasan National Park retained the 20–25 species class across all periods, and northeastern high-mountain parks such as Mt. Seoraksan and Mt. Odaesan generally remained in the 10–15 species class, while more parks in other regions shifted downward compared with SSP2-4.5.

3.5.5. Temporal Patterns and Scenario Comparison

At baseline (2010), municipality-level species richness ranged from 0 to 30 species and national park richness from 0 to 25 species. In the 2030s, both SSP2-4.5 and SSP5-8.5 produced richness patterns that were close to the baseline at both spatial levels. From the 2050s onward, SSP2-4.5 was associated with relatively small shifts in richness classes. By the 2090s, most municipalities remained in the 5–15 species range, and most national parks retained their baseline classes or changed by one class. Under SSP5-8.5, changes were larger. By the 2090s, many southern and southeastern municipalities were in the 0–5 or 5–10 species classes, while a smaller number of southwestern coastal municipalities and Jeju Island were in the 20–25 species class. At the national park level, several low-elevation and southern parks moved to lower richness classes under SSP5-8.5 in the 2090s, whereas Mt. Hallasan National Park and northeastern high-mountain parks such as Mt. Seoraksan and Mt. Odaesan generally remained in higher richness classes (10–25 species). All richness values were calculated from binary presence–absence maps based on species-specific probability thresholds that maximised the True Skill Statistic (TSS) for each species.

4. Discussion

4.1. Model Performance and Methodological Strengths

The Random Forest models developed in this study showed generally high predictive performance for the 29 endangered bird species. Cross-validation yielded a mean AUC-ROC of 0.844, with 72.4% of species achieving AUC ≥ 0.800 and one species, Columba janthina, reaching AUC = 1.000. Several species, including Anser erythropus, Gallicrex cinerea, Grus monacha, and Platalea leucorodia, also showed AUC values close to 1.000. These results are consistent with previous applications of Random Forest in ecological studies, where the algorithm has been reported to perform well for rare and threatened species with limited and heterogeneous occurrence data [29,33]. The ensemble structure of Random Forest, based on bootstrap sampling and random selection of predictors at each split, enables it to capture complex, nonlinear responses and interactions while reducing overfitting through aggregation of multiple trees [29,33]. Species with very high AUC values tended to have relatively well-defined geographical and environmental ranges within South Korea. For example, Columba janthina, Anser erythropus, Gallicrex cinerea, and Grus monacha are associated with specific habitat types or limited regional distributions, which can result in a strong climatic and topographic signal in the occurrence data. Previous studies have reported that species with narrow ecological niches or spatially concentrated ranges often yield higher SDM accuracy because their distributions are more tightly constrained by environmental gradients that are captured by the model predictors [26,43]. In contrast, four species (Cygnus columbianus, Strix uralensis, Strix aluco, and Accipiter gentilis) showed relatively low discrimination performance (AUC < 0.700). These species include wide-ranging or behaviourally cryptic taxa whose distributions in South Korea may be influenced by factors that are not fully represented by the climatic and coarse-scale environmental predictors used here. For example, forest-dwelling owls such as Strix uralensis and Strix aluco are often detected primarily through acoustic surveys, and detection probability can vary with survey effort, time of day, and background noise. Similarly, wintering waterfowl such as Cygnus columbianus may respond to fine-scale habitat features (e.g., water depth, hunting disturbance, roost-site availability) that are not captured by 1 km2 climatic and topographic variables. Such factors can reduce apparent model performance even when broad-scale environmental associations exist [26,43].
This study also has several methodological limitations that are typical of climate-based SDMs. First, biotic interactions such as competition, predation, and trophic cascades were not explicitly incorporated. Climate change can alter species interactions and ecosystem processes, and these indirect effects may lead to distributional changes that are not predictable from climate alone. For example, changes in climate have been linked to shifts in insect outbreak dynamics and associated declines in forest bird populations [44]. Second, land-use and land-cover change were not included in the future projections. Previous work has shown that, particularly in temperate regions, land-use change can have effects on bird distributions that are comparable to or greater than those of climate change [45], and this is likely to be important for coastal and wetland habitats undergoing reclamation and development. Third, dispersal capacity and adaptive potential were not considered. Some species may track shifting climates through dispersal or adapt to new conditions, whereas others—especially non-migratory or habitat-specialist species—may be unable to reach emerging suitable areas because of natural barriers or anthropogenic fragmentation [26,43]. Overall, the Random Forest framework provided robust predictive performance for most endangered bird species and is appropriate for assessing broad-scale patterns of current and future habitat suitability. At the same time, the relatively low performance for a subset of species and the structural limitations of the models indicate that additional field surveys, incorporation of finer-scale habitat and land-use variables, and explicit consideration of biotic interactions and dispersal processes would improve future assessments.

4.2. Ecological Interpretation of Key Environmental Drivers

Permutation-based importance analysis showed that elevation was the most influential predictor for 13 of the 29 endangered bird species (44.8%) and had the lowest mean rank (2.93) among all variables. Precipitation of the driest month (BIO14), distance to water, annual mean temperature (BIO1), and mean diurnal range (BIO2) followed in importance, with mean ranks of 4.38, 4.76, 4.86, and 4.97, respectively. By contrast, slope and distance to roads had the highest mean ranks and did not emerge as the first-ranked variable for any species. The dominant role of elevation is consistent with its function as an integrated surrogate for several environmental gradients, including temperature, precipitation, vegetation zones, and land-use patterns [46,47]. In South Korea, steep altitudinal gradients from coastal lowlands to high mountains generate strong climatic and habitat transitions over relatively short distances [19,20]. Species such as Buteo hemilasius and Platalea leucorodia showed particularly high dependence on elevation, with normalised importance scores of 0.924 and 0.847, respectively. These results indicate that suitable habitats for these species are concentrated within specific altitudinal belts, in line with the well-documented importance of elevation for structuring bird distributions in mountainous regions [46,47]. The high importance of BIO14 (precipitation of the driest month) for several species is consistent with the role of dry-season water availability as a key limiting factor in temperate and monsoon climates [4]. In this study, BIO14 was the top-ranked variable for five species and frequently appeared among the three most important predictors. For example, Grus grus showed its highest importance score for BIO14, indicating a strong association with dry-season moisture conditions. Such patterns are consistent with the dependence of many wetland- and grassland-associated birds on soil moisture, hydrological regimes, and vegetation structure during low-precipitation periods [4,22].
Distance to water emerged as a key predictor for several waterbirds and raptors. Species such as Aquila chrysaetos, Accipiter gentilis, Charadrius placidus, Anser erythropus, and Cygnus cygnus had distance to water among their top three variables, with relatively high importance scores. This finding is in line with previous work showing that proximity to rivers, streams, lakes, reservoirs, and coastal wetlands is a primary determinant of habitat use for waterbirds and for raptors that forage along aquatic ecotones [16,17,22]. In the Korean context, where major estuaries and tidal flats along the West and South Seas form critical components of the East Asian–Australasian Flyway (EAAF), distance to water effectively captures the spatial configuration of these key habitats [46,47]. Analysis of the combinations of the three most important variables showed that 22 species (75.9%) belonged to a mixed type, in which elevation, distance to water, and one or more bioclimatic variables (BIO1, BIO2, BIO12, or BIO14) jointly structured species distributions. Only two species formed a clearly elevation-centred type and five species a water-centred type. This predominance of mixed combinations suggests that, for most endangered birds, broad-scale distributions are governed by the interaction of topographic, hydrological, and climatic gradients rather than by a single dominant factor (Guisan and Zimmermann, 2000; Araújo and Pearson, 2005) [46,47]. Slope and distance to roads consistently showed low importance. Distance to roads ranked within the bottom three variables for 25 species (86.2%), and slope was among the bottom three variables for 22 species (75.9%). At the 1 km2 resolution used in this study, fine-scale terrain heterogeneity and localised road effects are likely to be smoothed, whereas larger-scale gradients related to elevation, climate, and water availability are retained. Similar patterns of low importance for slope and simple road-distance metrics have been reported in other SDM studies that focus on broad spatial scales and large environmental gradients [46,47].

4.3. Spatial Structure of Current Distributions

Under baseline climate conditions (2010), modelled species richness of the 29 endangered bird species showed a clear coastal–inland gradient. The highest richness classes (20–25 species) were concentrated in municipalities along the West Sea and South Sea coasts and on Jeju Island, whereas most inland mountainous and hilly municipalities fell within the 5–10 species class, and some northern border and high-elevation interior areas were in the lowest class (0–5 species). At the national park level, Mt. Hallasan National Park on Jeju Island and several marine and coastal parks in the southwestern region showed the highest richness (20–25 species), while large inland montane parks such as Mt. Seoraksan, Mt. Odaesan, and Mt. Sobaeksan were generally in the intermediate class (10–15 species). Low-elevation inland parks such as Mt. Gyeryongsan, Mt. Songnisan, Mt. Deogyusan, and Mt. Jirisan mostly fell within the 5–10 species class. This spatial pattern is consistent with previous work identifying Korean coastal wetlands as key staging and non-breeding habitats along the East Asian–Australasian Flyway (EAAF) [15,16,17,21]. Extensive tidal flats along the Yellow Sea coast, including those of Incheon and Gyeonggi Bay, support large numbers of migratory waterbirds and shorebirds and have been recognised as internationally important sites for globally threatened species such as Calidris tenuirostris, Numenius madagascariensis, and Calidris pygmaea [17,21,48]. The concentration of high richness values in West and South Sea coastal municipalities and marine–coastal national parks in this study aligns with these empirical observations. The Incheon region, where 70.4% of Korea’s legally protected endangered bird species have been recorded [49], represents a notable example. Since the 1980s, this area has undergone intensive coastal development, including large-scale land reclamation, industrial and port expansion, and airport-related infrastructure, leading to substantial loss and fragmentation of tidal flats and associated coastal wetlands [17,48,50]. The recent inscription of parts of the Korean tidal flats on the UNESCO World Heritage List reflects both their outstanding global importance for migratory birds and the high level of conservation concern [21].
Overall, the baseline richness pattern derived from our models reinforces the view that Korean tidal flats, estuaries, and adjacent coastal zones are core areas for endangered bird diversity, while inland mountainous regions contribute a complementary set of species. These results provide a spatial context for interpreting projected changes in species richness under future climate scenarios and for identifying coastal and marine–terrestrial protected areas that are likely to remain central to the conservation of endangered birds along the EAAF.

4.4. Future Climate-Driven Changes in Species Richness

The projections under both SSP2-4.5 and SSP5-8.5 show spatial redistribution of endangered bird species richness across South Korea, with larger changes under the high-emissions scenario SSP5-8.5. At the municipality level, SSP2-4.5 was characterised by relatively gradual shifts: coastal municipalities along the West and South Seas and Jeju Island generally retained high richness classes (15–25 species) through the end of the century, whereas many inland municipalities remained in the 5–10 or 10–15 species classes. Under SSP5-8.5, more pronounced changes emerged from the 2050s onward. By the 2070s and 2090s, the 0–5 species class expanded across extensive southern and southeastern inland and coastal municipalities, while high richness (15–25 species) became increasingly confined to parts of the West and South Sea coasts and Jeju Island. This pattern represents a strengthening spatial contrast between areas with high and low endangered bird richness and reflects a progressive redistribution of climatically suitable habitat. These results are consistent with North American studies showing that the magnitude and direction of bird range shifts and richness changes depend strongly on emission scenarios, with high-emissions pathways producing larger projected range contractions and regional losses than intermediate scenarios [9]. The concentration of future high-richness areas in limited coastal and insular regions and the expansion of low-richness classes in interior lowlands and some southern regions also align with the global tendency for species distributions to track changing climates upslope and poleward, leading to spatial reorganisation of biodiversity across elevation and latitude [11,51].
At the national park level, SSP2-4.5 was associated with relatively stable species richness patterns. Most parks retained their baseline richness classes or shifted by only one class by the 2090s, and high values persisted in Mt. Hallasan National Park and several coastal and coastal–inland parks. Under SSP5-8.5, however, a growing number of low-elevation and southern parks shifted to lower richness classes, while Mt. Hallasan and major northeastern high-mountain parks maintained comparatively high richness values. Together, these results indicate that future climate change is likely to produce heterogeneous changes in endangered bird richness across administrative units and protected areas, with greater redistribution and stronger divergence between high- and low-richness regions under the high-emissions scenario.

4.5. Elevational Dependence and Extinction Risk

Elevationally restricted species are often highly vulnerable to climate warming. Narrow elevational ranges and upslope range shifts can substantially increase extinction risk for montane birds by compressing their climatic niches into progressively smaller areas near mountain summits [12]. In our study, several endangered species exhibited strong dependence on elevation, with modelled suitable habitat concentrated within relatively narrow altitudinal bands (e.g., Buteo hemilasius, Platalea leucorodia). Under future climate scenarios, suitable conditions for these species tend to move towards higher elevations, while the total vertical extent of suitable habitat becomes increasingly limited, a pattern consistent with the “elevational squeeze” mechanism described for other mountain bird assemblages [12]. In mountainous regions, climate-driven habitat loss interacts with strong topographic constraints. As upper treeline and other climatic isoclines shift upslope, the area of land available within suitable elevational zones declines and becomes more fragmented, particularly near ridge tops and isolated massifs. For high-mountain species in South Korea, which already occupy relatively restricted ranges in the Mt. Taebaeksan and Mt. Sobaeksan systems, the combination of limited elevational space and continued warming can result in substantial reductions in potential habitat area and increased isolation among remaining patches. Under such conditions, opportunities for upslope tracking of suitable climate are restricted, and local extirpation risk can increase relative to that of lowland or broad-elevational-range species [12,52].
At the same time, recent studies have documented more complex elevational responses, including downslope shifts and non-linear changes in montane bird distributions [52,53]. These patterns have been linked to changes in snow depth, vegetation structure, disturbance regimes, and biotic interactions, in addition to direct temperature effects. Such findings indicate that simple assumptions of uniform upslope movement may not fully capture the range dynamics of elevation-dependent species. For Korean high-mountain birds, a combination of approaches that integrates species distribution models with demographic information—such as breeding success, survival, and population growth rates—and long-term monitoring of elevational range limits will be necessary to evaluate extinction risk more accurately and to design effective conservation strategies under continued climate change.

4.6. Role of National Parks and Climate Refugia

National parks and other protected areas are expected to play a central role in biodiversity conservation under climate change. Protected-area networks can continue to retain suitable climate space for many target species, particularly where they encompass substantial environmental gradients [54]. In this study, national parks exhibited heterogeneous responses in endangered bird species richness across scenarios and time periods, indicating that the potential for climate buffering differs among parks according to their environmental settings and geographic locations. Mt. Hallasan National Park consistently maintained the highest richness class (20–25 species) under both SSP2-4.5 and SSP5-8.5. This pattern is consistent with the park’s wide elevational range from near sea level to the summit of Mt. Hallasan and the associated strong climatic and habitat gradients. Protected areas that span broad elevational or latitudinal ranges can provide internal climate refugia by allowing species to track shifting climate within their boundaries rather than requiring long-distance movements across unprotected landscapes [54]. In such cases, the probability that species will find suitable microclimates and habitats within a single park remains relatively high even under substantial regional warming. Northeastern high-mountain parks such as Mt. Seoraksan and Mt. Odaesan also retained comparatively high endangered bird richness under SSP5-8.5, whereas several low-elevation and southern parks showed marked reductions. These results highlight the role of high-elevation and topographically heterogeneous parks as potential climate refugia and stepping stones in a warming climate. Identifying and managing climate refugia both inside and outside existing protected areas has been recognised as a key strategy for supporting the short-term persistence and long-term adaptation of threatened species [55,56].
At the same time, recent studies on national parks elsewhere indicate that the buffering capacity of protected areas is not unlimited. More than 80% of U.S. national parks have already experienced temperatures outside their historical norms, implying that many protected areas are rapidly entering novel climatic conditions [56]. A substantial proportion of protected areas worldwide may fail to retain their original conservation targets under future climates if boundaries and management objectives remain static [57]. Together with our results, these findings underline the need to reassess management strategies in national parks and to integrate climate refugia, elevational and latitudinal gradients, and connectivity into future conservation planning.

4.7. Priority Conservation Areas and Management Strategies

The municipality- and national park-level analyses indicate that exposure to and capacity to buffer climate change differ markedly among management units. Coastal municipalities along the West and South Seas, Jeju Island, and several high-elevation national parks in the northeast consistently supported high endangered bird richness under the baseline and retained relatively high richness under SSP2-4.5. Under this intermediate-emissions scenario, these areas maintained 15–25 species through the end of the century, whereas many inland lowland municipalities remained in the 5–10 or 10–15 species classes. These coastal and montane units can be regarded as candidate climate refugia for endangered birds, particularly where they overlap with legally protected areas and existing wetland reserves. In such locations, stricter control of land-use change, prevention of further tidal-flat and estuarine reclamation, and expansion or zoning of protected areas are likely to be effective measures. At the same time, sea-level rise and coastal squeeze can reduce the extent and quality of intertidal habitats even where direct reclamation is absent [58]. For Korean tidal flats and estuaries that function as core sites along the East Asian–Australasian Flyway, securing landward migration space, restoring degraded wetlands, and establishing effective buffer zones around key roosting and foraging sites are therefore critical components of long-term conservation planning.
In contrast, many southern lowland municipalities and low-elevation national parks showed higher risk of richness decline under both SSP2-4.5 and SSP5-8.5. In these areas, site-based protection alone is unlikely to maintain current assemblages. Complementary strategies such as habitat restoration in surrounding landscapes, climate-informed land-use planning, and, where appropriate, dynamic or temporary conservation measures (e.g., seasonal protection of key agricultural or floodplain habitats) will become increasingly important [59,60]. For species associated with rice paddies, lowland wetlands, or open agricultural mosaics, maintaining landscape permeability and reducing fragmentation around existing parks may be as important as strict protection inside park boundaries. Identifying priority conservation areas for endangered species in South Korea can provide a basis for protected-area designation and habitat conservation strategies [22]. Our results complement that work by adding a climate change perspective, highlighting where current priority areas overlap with candidate climate refugia and where additional sites may be needed to maintain future connectivity. Linking municipalities and parks that are projected to retain high richness with surrounding landscapes through ecological corridors and stepping stones is essential for allowing species to track shifting climatic envelopes [55,61].
Recent analyses for the United States have reported that existing protected areas and conservation priority targets fail to encompass more than 55% of mapped climate refugia and corridor networks, indicating substantial gaps between traditional reserve systems and areas important for climate adaptation [55,61]. A similar mismatch is likely in South Korea if conservation planning remains focused solely on current distributions. Integrating climate refugia and connectivity into national and regional conservation strategies will therefore require expanding the focus beyond existing park boundaries, building broader ecological networks across administrative borders, and coordinating these networks with municipal land-use and coastal zone planning.

4.8. International Cooperation and Conservation Along the EAAF

A substantial proportion of endangered bird species in South Korea are migratory and move along the East Asian–Australasian Flyway (EAAF). For such species, conservation outcomes cannot be secured by domestic efforts alone, because population dynamics depend on habitat conditions and threats operating across the entire migration route. Effective conservation therefore requires governance frameworks that extend beyond national borders and coordinate actions among all range states, particularly for migratory birds whose annual cycles link multiple breeding, stopover, and non-breeding areas. The EAAF spans 22 countries, including Russia, China, South Korea, Japan, nations in Southeast Asia, Australia, and New Zealand. Within this flyway, the Yellow Sea region has been identified as a critical bottleneck, where large numbers of migratory shorebirds and waterbirds depend on intertidal mudflats for staging and refuelling. Rapid loss and degradation of these tidal flats in several countries have been shown to drive severe population declines in multiple long-distance migrants, indicating that habitat change in one part of the flyway can have direct consequences for populations using sites elsewhere, including South Korea [48,62]. In this context, conservation of Korean coastal wetlands has both national and international significance. Protecting and restoring tidal flats, estuaries, and adjacent coastal habitats in South Korea contributes not only to the persistence of domestic endangered bird populations but also to the maintenance of flyway-wide biodiversity along the EAAF. The recent inscription of parts of the Korean tidal flats on the UNESCO World Heritage List represents an important step in recognising their global value and strengthens the basis for international cooperation on their long-term conservation and climate change adaptation.

4.9. Limitations and Future Research

This study has several limitations that should be considered when interpreting the results. First, species interactions and other biotic processes were not explicitly incorporated into the models. Climate change can modify predator–prey relationships, competition, disease dynamics, and trophic cascades, and such indirect effects may alter distributions even where climatic suitability remains high. For example, Climate-driven changes in insect outbreaks can lead to indirect declines in forest bird populations [44]. Future work should therefore seek to integrate information on key biotic interactions, where available, into species distribution and population models.
Second, land-use and land-cover change were not included in the future projections. Particularly in temperate regions, land-use change can have impacts on bird distributions that are comparable to or greater than those of climate change [45]. In South Korea, ongoing urban expansion, agricultural intensification, and coastal reclamation are likely to interact with climate warming to modify habitat availability and quality. Coupling SDMs with spatially explicit land-use scenarios and habitat change projections would provide a more realistic assessment of future distributional dynamics.
Third, species’ dispersal capacity and adaptive potential were not considered. The projections assume unlimited dispersal to all newly suitable areas and no in situ adaptation to changing conditions. In reality, some species may be unable to track shifting climates because of limited dispersal, habitat fragmentation, or behavioural constraints, whereas others may persist through phenotypic plasticity or rapid evolutionary responses [59,63]. Future studies could explore alternative dispersal scenarios, incorporate estimates of dispersal distance and barriers, and evaluate the potential role of assisted migration for particularly vulnerable species [59,63].
Fourth, habitat quality was not explicitly modelled. Climatically suitable areas may include sites that are degraded or heavily disturbed, where food resources, vegetation structure, or human pressures do not support viable populations. For waterbirds, for instance, factors such as water depth, sediment characteristics, hunting disturbance, and roost-site availability can be critical, while for forest species, stand structure, cavity availability, and understory composition are important determinants of occupancy. Integrating indicators of habitat quality and demographic data (e.g., abundance, breeding success) with climatic suitability would allow more comprehensive evaluations of population viability and conservation status.
Fifth, model uncertainty was only partly addressed. We used a single ensemble of regional climate model outputs and a single SDM algorithm (Random Forest) and thus did not fully quantify the uncertainty associated with alternative climate models and modelling methods. Multi-GCM, multi-SDM ensemble approaches have been recommended to capture structural and parametric uncertainty in climate-impact assessments and to provide more robust projections [64,65]. In addition, our analysis focused on long-term average conditions for broad time slices, whereas temporal aspects of climate change—such as shifts in the timing of temperature and precipitation, and resulting phenological mismatches—can strongly influence migratory bird populations [10]. research should therefore incorporate multiple climate and modelling frameworks, finer temporal resolution, and explicit treatment of phenology to improve estimates of climate change impacts on endangered birds in South Korea.

4.10. Policy Implications and Conservation Recommendations

The results of this study provide several policy-relevant implications for the conservation of endangered birds in South Korea.
First, coastal wetlands, particularly tidal flats along the West Sea (Yellow Sea) and parts of the South Sea, emerge as core areas for endangered bird richness under both current and future climates. These areas function as key staging, moulting, and non-breeding sites along the East Asian–Australasian Flyway and support a high proportion of nationally listed and globally threatened species. Strengthening protection of remaining tidal flats, preventing further large-scale reclamation, restoring degraded wetlands, and expanding the coverage and effective management of existing protected and World Heritage tidal-flat areas are therefore central policy priorities. This includes the designation of additional core zones and the establishment or reinforcement of buffer zones around critical roosting and foraging habitats.
Second, high-mountain national parks such as Mt. Hallasan, Mt. Seoraksan, and Mt. Odaesan show persistent high or intermediate richness and play an important role as potential climate refugia. In these parks, management strategies that maintain intact altitudinal gradients and minimise fragmentation—such as restricting new infrastructure in upper-elevation zones, controlling recreational pressure in sensitive areas, and conserving subalpine and montane forest habitats—are likely to support long-term persistence of elevation-dependent species. At the same time, ecological networks that link these high-mountain parks with surrounding foothills, river valleys, and coastal wetlands will be necessary to maintain functional connectivity under changing climate conditions [55,61].
Third, southern lowland and southeastern regions are projected to experience higher risks of richness decline under both SSP scenarios. In these areas, in situ measures such as habitat restoration, maintenance of rice paddies and lowland wetlands with high value for waterbirds, and reduction in habitat fragmentation are important. For species with very restricted or declining populations, such as Ciconia boyciana, ex situ conservation and reintroduction programmes need to incorporate future climate suitability into site selection. Aligning reintroduction and reinforcement efforts with projections of suitable climate and habitat can reduce the risk of establishing populations in areas that may become unsuitable within a few decades.
Fourth, the municipality-level analyses can be directly used to support local and regional conservation planning. Municipalities with consistently high species richness under current and future climates can be considered priority areas for integrating biodiversity into land-use plans, environmental impact assessments, and coastal zone management. In contrast, municipalities where richness is projected to decline can prioritise the creation of ecological corridors, improvement of habitat quality in remaining wetlands and agricultural landscapes, and targeted restoration in locations that enhance connectivity between core areas. Such differentiated, municipality-specific strategies can increase the effectiveness of limited conservation resources.
Fifth, in the context of the East Asian–Australasian Flyway, international cooperation remains essential. South Korea needs to coordinate with other key range states, including China, Russia, Japan, and countries in Southeast Asia and Oceania, to secure a coherent network of breeding, staging, and non-breeding sites. Joint monitoring of migratory populations, information sharing on habitat changes, and coordinated responses to threats such as coastal reclamation, hunting, and pollution are all required. Participation in, and further strengthening of, multilateral frameworks such as the East Asian–Australasian Flyway Partnership provides an institutional basis for such collaboration [16].

5. Conclusions

This study used Random Forest species distribution models and 1 km2 climate data to assess current and future habitat suitability and species richness for 29 legally protected endangered bird species in South Korea. Model performance was generally high (mean AUC = 0.844), indicating that the modelling framework is appropriate for analysing broad-scale patterns and climate change responses at municipality and national park scales. Environmental variable importance analysis showed that elevation was the dominant predictor, followed by precipitation of the driest month (BIO14), distance to water, and temperature variables (BIO1, BIO2). This indicates that endangered bird distributions are primarily structured by altitudinal and moisture gradients and proximity to aquatic habitats, whereas slope and distance to roads contributed comparatively little at the 1 km2 scale. Under baseline conditions, species richness was highest in coastal municipalities along the West and South Seas and on Jeju Island and in several marine–coastal and high-elevation national parks, reflecting the importance of tidal flats, estuaries, and elevational gradients. Future projections revealed scenario-dependent changes. Under SSP2-4.5, shifts in species richness were relatively moderate, with many municipalities and national parks retaining their baseline richness classes or changing by one class. Under SSP5-8.5, low-richness classes (0–5 species) expanded across southern and southeastern regions, while high richness (15–25 species) became increasingly restricted to parts of the West and South Sea coasts and Jeju Island. High-mountain parks such as Mt. Hallasan, Mt. Seoraksan, and Mt. Odaesan retained comparatively high richness under both scenarios, suggesting an important role as potential climate refugia.
These findings highlight three main conservation priorities: (1) strengthening protection and restoration of tidal flats, estuaries, and other coastal wetlands along the West and South Seas; (2) maintaining intact elevational gradients and landscape connectivity around high-mountain national parks; and (3) implementing targeted habitat restoration and connectivity measures in southern lowland regions where richness declines are projected. Because many endangered species in South Korea are migratory and move along the East Asian–Australasian Flyway, these national-level actions need to be complemented by continued international cooperation to secure a coherent network of breeding, stopover, and non-breeding sites under a changing climate.

Author Contributions

Conceptualization, J.-H.L. and C.-W.S.; methodology, J.-H.L. and C.-W.S.; software, J.-H.L. and C.-W.S.; validation, J.-H.L., J.-S.L. and C.-W.S.; formal analysis, J.-H.L.; investigation, J.-H.L.; resources, C.-W.S.; data curation, J.-H.L. and C.-W.S.; writing—original draft preparation, J.-H.L.; writing—review and editing, J.-H.L., M.-S.S., E.-S.L., J.-S.L. and C.-W.S.; visualization, J.-H.L. and C.-W.S.; supervision, C.-W.S.; project administration, C.-W.S.; funding acquisition, C.-W.S. All authors have read and agreed to the published version of the manuscript.

Funding

This research was supported by the Korea Environment Industry & Technology Institute (KEITI) under the Climate Change R&D Project for the New Climate Regime (RS-2022-KE002369) and the National Institute of Ecology (NIE) under the project NIE-B-2025-4.

Data Availability Statement

The original contributions presented in this study are included in the article. Further inquiries can be directed to the corresponding author.

Conflicts of Interest

The authors declare no conflicts of interest.

Abbreviations

The following abbreviations are used in this manuscript:
EAAFEast Asian-Australasian Flyway
AUCArea under the receiver operating characteristic curve
TSSTrue Skill Statistic
SDMSpecies distribution model

References

  1. Ceballos, G.; Ehrlich, P.R.; Dirzo, R. Biological annihilation via the ongoing sixth mass extinction signaled by vertebrate population losses and declines. Proc. Natl. Acad. Sci. USA 2017, 114, E6089–E6096. [Google Scholar] [CrossRef] [Scilit]
  2. IPBES. Global Assessment Report on Biodiversity and Ecosystem Services; Díaz, S., Settele, J., Brondízio, E.S., Ngo, H.T., Guèze, M., Agard, J., Arneth, A., Balvanera, P., Brauman, K.A., Butchart, S.H.M., et al., Eds.; IPBES Secretariat: Bonn, Germany, 2019. [Google Scholar]
  3. Strona, G.; Bradshaw, C.J.A. Coextinctions dominate future vertebrate losses from climate and land use change. Sci. Adv. 2022, 8, eabn4345. [Google Scholar] [CrossRef] [Scilit]
  4. Bellard, C.; Bertelsmeier, C.; Leadley, P.; Thuiller, W.; Courchamp, F. Impacts of climate change on the future of biodiversity. Ecol. Lett. 2012, 15, 365–377. [Google Scholar] [CrossRef] [Scilit]
  5. Urban, M.C. Accelerating extinction risk from climate change. Science 2015, 348, 571–573. [Google Scholar] [CrossRef] [Scilit]
  6. IPCC. Climate Change 2022: Impacts, Adaptation and Vulnerability; Contribution of Working Group II to the Sixth Assessment Report; Pörtner, H.-O., Roberts, D.C., Tignor, M., Poloczanska, E.S., Mintenbeck, K., Alegría, A., Craig, M., Langsdorf, S., Löschke, S., Möller, V., et al., Eds.; Cambridge University Press: Cambridge, UK, 2022. [Google Scholar]
  7. Wormworth, J.; Şekercioğlu, Ç.H. Winged Sentinels: Birds and Climate Change; Cambridge University Press: Cambridge, UK, 2011. [Google Scholar]
  8. Rosenberg, K.V.; Dokter, A.M.; Blancher, P.J.; Sauer, J.R.; Smith, A.C.; Smith, P.A.; Stanton, J.C.; Panjabi, A.; Helft, L.; Parr, M.; et al. Decline of the North American avifauna. Science 2019, 366, 120–124. [Google Scholar] [CrossRef] [Scilit] [PubMed]
  9. Langham, G.M.; Schuetz, J.G.; Distler, T.; Soykan, C.U.; Wilsey, C. Conservation status of North American birds in the face of future climate change. PLoS ONE 2015, 10, e0135350. [Google Scholar] [CrossRef] [Scilit]
  10. Both, C.; Bouwhuis, S.; Lessells, C.M.; Visser, M.E. Climate change and population declines in a long-distance migratory bird. Nature 2006, 441, 81–83. [Google Scholar] [CrossRef] [Scilit]
  11. Chen, I.-C.; Hill, J.K.; Ohlemüller, R.; Roy, D.B.; Thomas, C.D. Rapid range shifts of species associated with high levels of climate warming. Science 2011, 333, 1024–1026. [Google Scholar] [CrossRef] [Scilit] [PubMed]
  12. Şekercioğlu, Ç.H.; Schneider, S.H.; Fay, J.P.; Loarie, S.R. Climate change, elevational range shifts, and bird extinctions. Conserv. Biol. 2008, 22, 140–150. [Google Scholar] [PubMed]
  13. Prasad, A.M.; Iverson, L.R.; Liaw, A. Newer classification and regression tree techniques: Bagging and random forests for ecological prediction. Ecosystems 2006, 9, 181–199. [Google Scholar] [CrossRef] [Scilit]
  14. Valavi, R.; Guillera-Arroita, G.; Lahoz-Monfort, J.J.; Elith, J. Predictive performance of presence-only species distribution models: A benchmark study with reproducible code. Ecol. Monogr. 2022, 92, e1486. [Google Scholar] [CrossRef] [Scilit]
  15. Bamford, M.; Watkins, D.; Bancroft, W.; Tischler, G.; Wahl, J. Migratory Shorebirds of the East Asian-Australasian Flyway: Population Estimates and Internationally Important Sites; Wetlands International-Oceania: Canberra, Australia, 2008. [Google Scholar]
  16. Amano, T.; Székely, T.; Sandel, B.; Nagy, S.; Mundkur, T.; Langendoen, T.; Blanco, D.; Soykan, C.U.; Sutherland, W.J. Successful conservation of global waterbird populations depends on effective governance. Nature 2018, 553, 199–202. [Google Scholar] [CrossRef] [Scilit] [PubMed]
  17. Moores, N.; Rogers, D.I.; Rogers, K.; Hansbro, P.M. Reclamation of tidal flats and shorebird declines in Saemangeum and elsewhere in the Republic of Korea. Emu 2016, 116, 136–146. [Google Scholar] [CrossRef] [Scilit]
  18. Hong, S.H.; Lee, Y.H.; Lee, G.; Lee, D.-H.; Adhikari, P. Predicting impacts of climate change on northward range expansion of invasive weeds in South Korea. Plants 2021, 10, 1604. [Google Scholar] [CrossRef] [Scilit] [PubMed]
  19. Adhikari, P.; Jeon, J.Y.; Kim, H.W.; Shin, M.-S.; Adhikari, P.; Seo, C. Potential impact of climate change on plant invasion in the Republic of Korea. J. Ecol. Environ. 2019, 43, 36. [Google Scholar] [CrossRef] [Scilit]
  20. Lim, C.-H.; Yoo, S.; Choi, Y.; Jeon, S.W.; Son, Y.; Lee, W.-K. Assessing climate change impact on forest habitat suitability and diversity in the Korean Peninsula. Forests 2018, 9, 259. [Google Scholar] [CrossRef] [Scilit]
  21. Lee, J.-H.; Kim, I.-C.; Lee, S.-W.; Son, J.-J.; Jang, J.-U.; Sung, H.-C. International importance of tidal flats in the Republic of Korea as shorebird stopover sites in the East Asian–Australasian flyway. Avian Conserv. Ecol. 2023, 18, 23. [Google Scholar] [CrossRef] [Scilit]
  22. Kim, M.; Koo, K.; Park, Y.; Kim, H.; Jeon, S.; Lee, W. Potential habitat and priority conservation areas for endangered species in South Korea. Animals 2025, 15, 1158. [Google Scholar] [CrossRef] [Scilit]
  23. Environment Ministry. Endangered Wild Species List (Revised in 2022); Ministry of Environment: Sejong, Republic of Korea, 2022. (In Korean)
  24. Mi, C.; Huettmann, F.; Guo, Y.; Han, X.; Wen, L. Why choose Random Forest to predict rare species distribution with few samples in large undersampled areas? Three Asian crane species models provide supporting evidence. PeerJ 2017, 5, e2849. [Google Scholar] [CrossRef] [Scilit]
  25. Zhang, L.; Liu, S.; Sun, P.; Wang, T.; Wang, G.; Zhang, X.; Wang, L. Consensus forecasting of species distributions: The effects of niche model performance and niche properties. PLoS ONE 2019, 14, e0217316. [Google Scholar] [CrossRef] [Scilit]
  26. Elith, J.; Leathwick, J.R. Species distribution models: Ecological explanation and prediction across space and time. Annu. Rev. Ecol. Evol. Syst. 2009, 40, 677–697. [Google Scholar] [CrossRef] [Scilit]
  27. Guisan, A.; Thuiller, W.; Zimmermann, N.E. Habitat Suitability and Distribution Models: With Applications in R; Cambridge University Press: Cambridge, UK, 2017. [Google Scholar]
  28. Dormann, C.F.; Elith, J.; Bacher, S.; Buchmann, C.; Carl, G.; Carré, G.; Marquéz, J.R.G.; Gruber, B.; Lafourcade, B.; Leitão, P.J.; et al. Collinearity: A review of methods to deal with it and a simulation study evaluating their performance. Ecography 2013, 36, 27–46. [Google Scholar] [CrossRef] [Scilit]
  29. Cutler, D.R.; Edwards, T.C., Jr.; Beard, K.H.; Cutler, A.; Hess, K.T.; Gibson, J.; Lawler, J.J. Random forests for classification in ecology. Ecology 2007, 88, 2783–2792. [Google Scholar] [CrossRef] [Scilit] [PubMed]
  30. O’Neill, B.C.; Tebaldi, C.; van Vuuren, D.P.; Eyring, V.; Friedlingstein, P.; Hurtt, G.; Knutti, R.; Kriegler, E.; Lamarque, J.-F.; Lowe, J.; et al. The Scenario Model Intercomparison Project (ScenarioMIP) for CMIP6. Geosci. Model Dev. 2016, 9, 3461–3482. [Google Scholar] [CrossRef] [Scilit]
  31. Riahi, K.; van Vuuren, D.P.; Kriegler, E.; Edmonds, J.; O’Neill, B.C.; Fujimori, S.; Bauer, N.; Calvin, K.; Dellink, R.; Fricko, O.; et al. The Shared Socioeconomic Pathways and their energy, land use, and greenhouse gas emissions implications: An overview. Glob. Environ. Chang. 2017, 42, 153–168. [Google Scholar] [CrossRef] [Scilit]
  32. Fick, S.E.; Hijmans, R.J. WorldClim 2: New 1-km spatial resolution climate surfaces for global land areas. Int. J. Climatol. 2017, 37, 4302–4315. [Google Scholar] [CrossRef] [Scilit]
  33. Breiman, L. Random forests. Mach. Learn. 2001, 45, 5–32. [Google Scholar] [CrossRef] [Scilit]
  34. R Core Team. R: A Language and Environment for Statistical Computing; R Foundation for Statistical Computing: Vienna, Austria, 2023. [Google Scholar]
  35. Liaw, A.; Wiener, M. Classification and regression by randomForest. R News 2002, 2, 18–22. [Google Scholar]
  36. Marmion, M.; Parviainen, M.; Luoto, M.; Heikkinen, R.K.; Thuiller, W. Evaluation of consensus methods in predictive species distribution modelling. Divers. Distrib. 2009, 15, 59–69. [Google Scholar] [CrossRef] [Scilit]
  37. Elith, J.; Graham, C.H.; Anderson, R.P.; Dudík, M.; Ferrier, S.; Guisan, A.; Hijmans, R.J.; Huettmann, F.; Leathwick, J.R.; Lehmann, A.; et al. Novel methods improve prediction of species’ distributions from occurrence data. Ecography 2006, 29, 129–151. [Google Scholar] [CrossRef] [Scilit]
  38. Allouche, O.; Tsoar, A.; Kadmon, R. Assessing the accuracy of species distribution models: Prevalence, kappa and the true skill statistic (TSS). J. Appl. Ecol. 2006, 43, 1223–1232. [Google Scholar] [CrossRef] [Scilit]
  39. Evans, J.S.; Murphy, M.A.; Holden, Z.A.; Cushman, S.A. Modeling species distribution and change using Random Forest. In Predictive Species and Habitat Modeling in Landscape Ecology; Drew, C.A., Wiersma, Y.F., Huettmann, F., Eds.; Springer: New York, NY, USA, 2011; pp. 139–159. [Google Scholar]
  40. Liu, C.; Berry, P.M.; Dawson, T.P.; Pearson, R.G. Selecting thresholds of occurrence in the prediction of species distributions. Ecography 2005, 28, 385–393. [Google Scholar] [CrossRef] [Scilit]
  41. Pressey, R.L.; Cabeza, M.; Watts, M.E.; Cowling, R.M.; Wilson, K.A. Conservation planning in a changing world. Trends Ecol. Evol. 2007, 22, 583–592. [Google Scholar] [CrossRef] [Scilit]
  42. Hannah, L.; Midgley, G.; Andelman, S.; Araújo, M.; Hughes, G.; Martinez-Meyer, E.; Pearson, R.; Williams, P. Protected area needs in a changing climate. Front. Ecol. Environ. 2007, 5, 131–138. [Google Scholar] [CrossRef] [Scilit]
  43. Wisz, M.S.; Pottier, J.; Kissling, W.D.; Pellissier, L.; Lenoir, J.; Damgaard, C.F.; Dormann, C.F.; Forchhammer, M.C.; Grytnes, J.-A.; Guisan, A.; et al. The role of biotic interactions in shaping distributions and realised assemblages of species: Implications for species distribution modelling. Biol. Rev. 2013, 88, 15–30. [Google Scholar] [CrossRef] [Scilit]
  44. Harte, J.; Shaw, R. Shifting dominance within a montane vegetation community: Results of a climate-warming experiment. Science 1995, 267, 876–880. [Google Scholar] [CrossRef] [Scilit]
  45. Jetz, W.; Wilcove, D.S.; Dobson, A.P. Projected impacts of climate and land-use change on the global diversity of birds. PLoS Biol. 2007, 5, e157. [Google Scholar] [CrossRef] [Scilit] [PubMed]
  46. Guisan, A.; Zimmermann, N.E. Predictive habitat distribution models in ecology. Ecol. Model. 2000, 135, 147–186. [Google Scholar] [CrossRef] [Scilit]
  47. Araújo, M.B.; Pearson, R.G.; Thuiller, W.; Erhard, M. Validation of species–climate impact models under climate change. Glob. Change Biol. 2005, 11, 1504–1513. [Google Scholar] [CrossRef] [Scilit]
  48. Murray, N.J.; Clemens, R.S.; Phinn, S.R.; Possingham, H.P.; Fuller, R.A. Tracking the rapid loss of tidal wetlands in the Yellow Sea. Front. Ecol. Environ. 2014, 12, 267–272. [Google Scholar] [CrossRef] [Scilit]
  49. Park, H.; Kim, S.; Lee, D. Analysis of the spatiotemporal changes in selected ecosystem services caused by free trade initiatives in Incheon, Korea. Sustainability 2022, 14, 3233. [Google Scholar]
  50. Moores, N.; Battley, P.; Rogers, D.I.; Yang, H.-Y.; Sung, H.-C. Wetlands: Korea’s most-threatened habitat. Orient. Bird Club Bull. 2008, 47, 21–30. [Google Scholar]
  51. Lenoir, J.; Gégout, J.-C.; Guisan, A.; Vittoz, P.; Wohlgemuth, T.; Zimmermann, N.E.; Dullinger, S.; Pauli, H.; Willner, W.; Svenning, J.-C. Going against the flow: Potential mechanisms for unexpected downslope range shifts in a warming climate. Ecography 2010, 33, 295–303. [Google Scholar] [CrossRef] [Scilit]
  52. Neate-Clegg, M.H.C.; Stuart, S.N.; Mtui, D.; Şekercioğlu, Ç.H.; Newmark, W.D. Afrotropical montane birds experience upslope shifts and range contractions along a fragmented elevational gradient in response to global warming. PLoS ONE 2021, 16, e0248712. [Google Scholar] [CrossRef] [Scilit]
  53. DeLuca, W.V.; King, D.I. Influence of snow depth on nest-site selection and reproductive success in a declining montane passerine. J. Field Ornithol. 2019, 90, 122–132. [Google Scholar]
  54. Hole, D.G.; Willis, S.G.; Pain, D.J.; Fishpool, L.D.; Butchart, S.H.M.; Collingham, Y.C.; Rahbek, C.; Huntley, B. Projected impacts of climate change on a continent-wide protected area network. Ecol. Lett. 2009, 12, 420–431. [Google Scholar] [CrossRef] [Scilit]
  55. Hannah, L.; Flint, L.; Syphard, A.D.; Moritz, M.A.; Buckley, L.B.; McCullough, I.M. Fine-grain modeling of species’ response to climate change: Holdouts, stepping-stones, and microrefugia. Trends Ecol. Evol. 2014, 29, 390–397. [Google Scholar] [CrossRef] [Scilit]
  56. Morelli, T.L.; Daly, C.; Dobrowski, S.Z.; Dulen, D.M.; Ebersole, J.L.; Jackson, S.T.; Lundquist, J.D.; Millar, C.I.; Maher, S.P.; Monahan, W.B.; et al. Managing climate change refugia for climate adaptation. PLoS ONE 2016, 11, e0159909. [Google Scholar] [CrossRef] [Scilit]
  57. Coetzee, B.W.T.; Robertson, M.P.; Erasmus, B.F.N.; Van Rensburg, B.J.; Thuiller, W. Ensemble models predict Important Bird Areas in southern Africa will become less effective for conserving endemic birds under climate change. Glob. Ecol. Biogeogr. 2009, 18, 701–710. [Google Scholar] [CrossRef] [Scilit]
  58. Galbraith, H.; Jones, R.; Park, R.; Clough, J.; Herrod-Julius, S.; Harrington, B.; Page, G. Global climate change and sea level rise: Potential losses of intertidal habitat for shorebirds. Waterbirds 2002, 25, 173–183. [Google Scholar] [CrossRef] [Scilit]
  59. Hällfors, M.H.; Vaara, E.M.; Hyvärinen, M.; Oksanen, M.; Schulman, L.E.; Siipi, H.; Lehvävirta, S. Coming to terms with the concept of moving species threatened by climate change—A systematic review of the terminology and definitions. PLoS ONE 2017, 12, e0167539. [Google Scholar] [CrossRef] [Scilit]
  60. Thomas, C.D. Translocation of species, climate change, and the end of trying to recreate past ecological communities. Trends Ecol. Evol. 2011, 26, 216–221. [Google Scholar] [CrossRef] [Scilit]
  61. Rosa, L.; Lacy, M.; Weber, T.; Delach, A.; Neiderman, T.; Malcom, J. Climate refugia and corridors are critical conservation objectives for adaptation in fragmented landscapes. Environ. Res. Lett. 2024, 19, 024036. [Google Scholar]
  62. Studds, C.E.; Kendall, B.E.; Murray, N.J.; Wilson, H.B.; Rogers, D.I.; Clemens, R.S.; Gosbell, K.; Hassell, C.J.; Jessop, R.; Melville, D.S.; et al. Rapid population decline in migratory shorebirds relying on Yellow Sea tidal mudflats as stopover sites. Nat. Commun. 2017, 8, 14895. [Google Scholar] [CrossRef] [Scilit] [PubMed]
  63. McLachlan, J.S.; Hellmann, J.J.; Schwartz, M.W. A framework for debate of assisted migration in an era of climate change. Conserv. Biol. 2007, 21, 297–302. [Google Scholar] [CrossRef] [Scilit]
  64. Araújo, M.B.; New, M. Ensemble forecasting of species distributions. Trends Ecol. Evol. 2007, 22, 42–47. [Google Scholar] [CrossRef] [Scilit] [PubMed]
  65. Thuiller, W.; Lafourcade, B.; Engler, R.; Araújo, M.B. BIOMOD—A platform for ensemble forecasting of species distributions. Ecography 2009, 32, 369–373. [Google Scholar] [CrossRef] [Scilit]
Figure 1. Study area. Left panel: Location of South Korea in East Asia. Right panel: Elevation (DEM; m) with administrative district boundaries and protected areas.
Diversity 18 00006 g001
Figure 2. Model accuracies of the Random Forest models by validation metric (AUC-ROC, TSS, and Kappa) for the 29 endangered bird species.
Diversity 18 00006 g002
Figure 3. Baseline species richness of 29 endangered bird species in South Korea under current climate (2010): (a) Species richness at the municipality level (Si/Gun/Gu administrative units), classified into five richness classes (0–5, 5–10, 10–15, 15–20, and 20–25 species). (b) Species richness at the national park level, classified into the same five richness classes.
Diversity 18 00006 g003
Figure 4. Future species richness projections at municipality level under the SSP2-4.5 scenario.
Diversity 18 00006 g004
Figure 5. Future species richness projections in national parks under the SSP2-4.5 scenario.
Diversity 18 00006 g005
Figure 6. Future species richness projections at municipality level under the SSP5-8.5 scenario.
Diversity 18 00006 g006
Figure 7. Future species richness projections at national park level under the SSP5-8.5 scenario.
Diversity 18 00006 g007
Table 1. List of 29 endangered bird species included in this study.
No.Scientific NameEnglish Common NameKorean Conservation Status IUCN Status
1Anser cygnoidesSwan GooseEndangered Class IIEN
2Aquila chrysaetosGolden EagleEndangered Class ILC
3Saundersilarus saundersiSaunders’s GullEndangered Class IIVU
4Haematopus ostralegusEurasian OystercatcherEndangered Class IINT
5Grus grusCommon CraneEndangered Class IILC
6Cygnus columbianusTundra SwanEndangered Class ILC
7Terpsiphone atrocaudataJapanese Paradise-FlycatcherEndangered Class IINT
8Strix uralensisUral OwlEndangered Class IILC
9Dryocopus martiusBlack WoodpeckerEndangered Class IILC
10Platalea leucorodiaEurasian SpoonbillEndangered Class IILC
11Aegypius monachusCinereous VultureEndangered Class IINT
12Gallicrex cinereaWatercockEndangered Class IILC
13Pernis ptilorhynchusOriental Honey-buzzardEndangered Class IILC
14Falco subbuteoEurasian HobbyEndangered Class IILC
15Strix alucoTawny OwlEndangered Class IILC
16Circus cyaneusHen HarrierEndangered Class IILC
17Accipiter gularisJapanese SparrowhawkEndangered Class IILC
18Accipiter gentilisNorthern GoshawkEndangered Class IILC
19Cygnus cygnusWhooper SwanEndangered Class IILC
20Anser fabalisTaiga Bean GooseEndangered Class IILC
21Buteo hemilasiusUpland BuzzardEndangered Class IILC
22Pitta nymphaFairy PittaEndangered Class IIVU
23Clanga clangaGreater Spotted EagleEndangered Class IIVU
24Mergus squamatusScaly-sided MerganserEndangered Class IEN
25Ciconia boycianaOriental StorkEndangered Class IEN
26Grus monachaHooded CraneEndangered Class IIVU
27Columba janthinaJapanese Wood PigeonEndangered Class IILC
28Charadrius placidusLong-billed PloverEndangered Class IILC
29Anser erythropusLesser White-fronted GooseEndangered Class IIVU
Note: Conservation status follows the official classification of endangered wildlife (Class I or II) under the Enforcement Rule of the Wildlife Protection and Management Act of the Republic of Korea [23]. IUCN conservation status follows the IUCN Red List Categories (IUCN 3.1): LC = Least Concern, NT = Near Threatened, VU = Vulnerable, EN = Endangered.
Table 2. Environmental variables used for species distribution modeling.
Variable TypeVariable CodeDescriptionUnitSourceResolution
BioclimaticBIO1Annual mean temperature°CKMA1 km
BioclimaticBIO2Mean diurnal range°CKMA1 km
BioclimaticBIO3Isothermality (BIO2/BIO7 × 100)KMA1 km
BioclimaticBIO12Annual precipitationmmKMA1 km
BioclimaticBIO13Precipitation of wettest monthmmKMA1 km
BioclimaticBIO14Precipitation of driest monthmmKMA1 km
TopographicElevationAltitude above sea levelmDEM1 km
TopographicSlopeTerrain slope°DEM1 km
AnthropogenicDist_roadDistance to nearest roadkmNational road map1 km
AnthropogenicDist_waterDistance to nearest river, stream,
or lake
kmNational hydrography1 km
Table 3. Characteristics of CMIP6 Shared Socioeconomic Pathway (SSP) scenarios used in this study.
ScenarioDescriptionRadiative Forcing (2100)Characteristics
SSP2-4.5Middle of the road4.5 W/m2
  • Continuation of historical trends
  • Moderate climate mitigation efforts
  • Intermediate greenhouse-gas emissions
  • Intermediate-emissions pathway
SSP5-8.5Fossil-fueled development8.5 W/m2
  • Rapid economic growth driven by fossil fuels
  • Limited climate policy implementation
  • High greenhouse-gas emissions
  • High-emissions pathway
Note: In this study, projections were produced for five time periods: 2010 (current baseline), the 2030s, 2050s, 2070s, and 2090s.
Table 4. Definitions and interpretation criteria for model performance metrics.
MetricAbbreviationRangeInterpretation CriteriaProperties
Area under the ROC curveAUC0.5–1.0>0.7: acceptable;
>0.8: good; >0.9: excellent
Threshold-independent; measures discrimination ability
True Skill
Statistic
TSS−1 to +1>0.4: useful; >0.6: good;
>0.8: excellent
Prevalence-independent; reflects balanced accuracy
Cohen’s
Kappa
Kappa−1 to +1>0.4: moderate; >0.6: substantial; >0.8: almost perfectChance-adjusted; sensitive to prevalence
Note: In this study, all three metrics (AUC, TSS, and Kappa) were used to provide a complementary and robust evaluation of model performance.
Table 5. Summary statistics of cross-validated model performance across the 29 species.
Performance MetricMeanMinMaxStandard Deviation
AUC-ROC0.8440.5410.122
TSS0.6920.28510.197
Kappa0.4320.03810.235
Note: Values represent cross-validated performance metrics averaged across the 29 species. AUC-ROC is a threshold-independent indicator of model discrimination, whereas TSS and Kappa are threshold-dependent indices that reflect classification accuracy beyond random expectation.
Table 6. Species-level model accuracy (AUC-ROC).
Scientific NameAUC-ROC
Columba janthina1.000
Anser erythropus0.989
Gallicrex cinerea0.981
Grus monacha0.960
Platalea leucorodia0.951
Pitta nympha0.948
Anser fabalis0.945
Saundersilarus saundersi0.945
Circus cyaneus0.934
Anser cygnoides0.932
Buteo hemilasius0.921
Cygnus cygnus0.905
Terpsiphone atrocaudata0.884
Grus grus0.873
Aegypius monachus0.871
Haematopus ostralegus0.863
Aquila chrysaetos0.841
Charadrius placidus0.838
Pernis ptilorhynchus0.837
Accipiter gularis0.816
Dryocopus martius0.809
Mergus squamatus0.791
Falco subbuteo0.727
Clanga clanga0.713
Ciconia boyciana0.709
Accipiter gentilis0.686
Strix aluco0.637
Strix uralensis0.620
Cygnus columbianus0.540
Note: Species are sorted in descending order of AUC-ROC value.
Table 7. Summary of relative importance of environmental variables.
VariableSpecies with 1st-Rank Importance (n)Percentage (%)Mean Rank
Elevation1344.82.93
BIO14 (Precipitation of driest month)517.24.38
Distance to water310.34.76
BIO1 (Annual mean temperature)26.94.86
BIO2 (Mean diurnal range)26.94.97
BIO3 (Isothermality)13.46.31
BIO12 (Annual precipitation)26.96.38
BIO13 (Precipitation of wettest month)13.46.72
Distance to roads006.79
Slope006.9
Mean ranks were calculated across all 29 species; lower values indicate higher importance (1 = most important, 10 = least important). Variable importance was determined using permutation importance in Random Forest.
Table 8. Classification of species by combinations of the top three environmental predictors.
Pattern TypeDefinitionNumber of SpeciesPercentage (%)
Elevation-centeredElevation dominates (>0.80 importance)
in top-3
26.9
Water-centeredDistance to water ranks 1st or
prominently in top-3
517.2
MixedVarious combinations of elevation, water,
and bioclimate
2275.9
Total 29100
Table 9. Top three environmental predictors and their normalised importance values for each species.
Scientific Name1st Variable (Importance)2nd Variable (Importance)3rd Variable (Importance)
Anser cygnoidesElevation (0.442)Distance to water (0.061)BIO14 (0.036)
Aquila chrysaetosDistance to water (0.310)Distance to roads (0.077)BIO14 (0.070)
Saundersilarus saundersiElevation (0.281)BIO1 (0.182)Distance to water (0.129)
Haematopus ostralegusBIO12 (0.128)BIO14 (0.112)BIO3 (0.075)
Grus grusBIO14 (0.292)Elevation (0.003)BIO1 (0.000)
Cygnus columbianusBIO14 (0.120)Distance to water (0.085)BIO13 (0.064)
Terpsiphone atrocaudataBIO2 (0.169)BIO14 (0.056)Elevation (0.045)
Strix uralensisBIO1 (0.205)Elevation (0.167)Distance to roads (0.149)
Dryocopus martiusBIO13 (0.377)BIO1 (0.143)Elevation (0.061)
Platalea leucorodiaElevation (0.847)BIO1 (0.096)Distance to water (0.068)
Aegypius monachusElevation (0.534)BIO1 (0.188)BIO2 (0.171)
Gallicrex cinereaElevation (0.687)BIO14 (0.109)BIO3 (0.098)
Pernis ptilorhynchusBIO14 (0.228)BIO2 (0.107)Elevation (0.054)
Falco subbuteoElevation (0.301)Slope (0.140)BIO2 (0.085)
Strix alucoBIO14 (0.115)Distance to water (0.035)BIO12 (0.018)
Circus cyaneusElevation (0.260)BIO14 (0.135)Distance to water (0.114)
Accipiter gularisBIO14 (0.227)BIO2 (0.189)Distance to roads (0.138)
Accipiter gentilisDistance to water (0.391)BIO2 (0.307)BIO13 (0.282)
Cygnus cygnusElevation (0.503)Distance to water (0.232)BIO2 (0.052)
Anser fabalisElevation (0.436)Distance to water (0.102)BIO1 (0.066)
Buteo hemilasiusElevation (0.924)BIO14 (0.194)Slope (0.109)
Pitta nymphaBIO12 (0.077)BIO14 (0.062)BIO2 (0.042)
Clanga clangaBIO1 (0.160)BIO13 (0.103)Elevation (0.019)
Mergus squamatusBIO3 (0.201)BIO2 (0.121)Distance to water (0.057)
Ciconia boycianaElevation (0.331)BIO2 (0.282)BIO3 (0.189)
Grus monachaElevation (0.485)Distance to water (0.103)Slope (0.030)
Columba janthinaBIO2 (0.034)BIO13 (0.022)BIO3 (0.014)
Charadrius placidusDistance to water (0.347)BIO3 (0.126)Distance to roads (0.089)
Anser erythropusElevation (0.514)Distance to water (0.351)BIO1 (0.312)
Disclaimer/Publisher’s Note: The statements, opinions and data contained in all publications are solely those of the individual author(s) and contributor(s) and not of MDPI and/or the editor(s). MDPI and/or the editor(s) disclaim responsibility for any injury to people or property resulting from any ideas, methods, instructions or products referred to in the content.