Abstract
We evaluated the impact of environmental variability on lobster Panulirus argus and Panulirus laevicauda resources in the waters off Brazil and southern Cuba. This study also covered aspects of larval recruitment associated with the availability of fishing resources in the Southern and Northern Hemispheres. Satellite-generated environmental data were sampled from 18 stations, 6 of which were in the sea off southern Cuba, 6 of which were in the coastal region of Brazil, and 6 of which were offshore near Brazil, covering important lobster fishing grounds and phyllosoma-rich areas of ocean surface circulation along the offshore boundary. The Southern Oscillation Index (SOI) was used to quantify the global ocean–atmosphere variability. Other environmental parameters included in the analysis were the monthly coastal sea levels, surface temperature (SST), salinity, wind/current speed, chlorophyll-a (Chl-a) concentrations, rainfall (RF), and Amazon River discharge (ARD). Variations in the level of puerulus settlement, juveniles, and population harvest in the coastal region of Brazil and Cuba were used to better understand the impact of environmental variability on organisms in their larval stages and their subsequent recruitment to fisheries. The surface temperature, chlorophyll-a concentration, and wind/current patterns were significantly associated with the variability in puerulus settlement. Larger-scale processes (as proxied by the SOI) affected RF, ARD, and sea levels, which reached a maximum during La Niña. As for Brazil, the full-year landings prediction model included Chl-a concentration, SST, RF, and ARD and their association with lobster landings (LLs). The landing predictions for Cuba were based on fluctuations in the Chl-a concentration and SST.
1. Introduction
Marine lobsters sustain one of the most profitable artisanal fishing industries in the world, with spiny lobsters being particularly important in small-scale artisanal fisheries in both the Northern and Southern Hemispheres. The species Panulirus argus (Latreille, 1804) is an abundant and valuable fishing resource in the tropical western Atlantic. The red spiny lobster (P. argus) and green spiny lobster (Panulirus laevicauda (Latreille, 1817)) are more abundant in Brazilian waters than on the Cuban insular shelf. Furthermore, as red and green spiny lobsters are sympatric species and are caught with the same type of artisanal gear on the continental shelf of Brazil, fluctuations in landings are similar for the two species. The brown spiny lobster (Panulirus echinatus Smith, 1869) and four species of slipper lobster are also occasionally caught and sold on the Brazilian domestic market [1].
Since 1970, the landing patterns of spiny lobsters have been highly irregular, with production declining sharply in years associated with increasing local growth overfishing. However, since 2012, the enforcement of a 6-month closed season (November–April) has decreased the fishing effort by approximately 45%, to some extent preventing the catch of undersized lobsters and favoring reproduction, juvenile recruitment, and migration of prerecruits to fishing grounds. This was followed by a renewed increase in landings in 2016 and a trend towards stabilization from 2017 to 2024 [1]. In the Cuban Archipelago, fisheries have been declining since 2000. In addition to poor management, other likely causes include dramatic weather events, such as hurricanes, and degradation of the coastal marine ecosystem, resulting in a reduced carrying capacity [2].
Gene technologies (CRISPR gene editing) may be used to explore the differences between spiny lobster species, subspecies, and hybrids in Brazilian waters and determine their origin. However, since such gene studies are still in an early stage, in this paper, we will use the name P. argus for both the Brazilian and Caribbean forms of red spiny lobster.
Puerulus settlement off northeastern Brazil takes place throughout the year, but two annual peaks have been identified, one in March–April and one in July–September, when the retroflection eddies of the North Brazil Current are more intense and feed into the eastward-flowing North Equatorial Countercurrent. Conceivably, Brazilian spiny lobster larvae become trapped in this oceanic system, leading to self-recruitment. Our findings support the hypothesis that lobster larvae are transported by ocean currents and free eddies from Brazil to the Caribbean via the Lesser Antilles, outlining south-to-north connectivity [3]. However, the impact of climate factors on lobster stocks and fisheries in Brazil has not been comprehensively addressed. To our knowledge, the study by Fonteles-Filho [4] is the only relevant previous study to have explored the relationship between climate variability (in this case, rainfall patterns) and the Brazilian landings of red and green spiny lobsters.
Field studies in the Cuban Archipelago have improved our understanding of pelagic puerulus development in the immature benthic phase and of the variability in recruitment strategies. During a 15-year window (1982–1996), juveniles were monitored in concrete block shelters that permitted a wider variation in juvenile recruitment and thus the prediction of regional and seasonal catch. Analyses of the relative abundance in the earliest stages make it possible to determine recruitment patterns and tendencies, predict recruitment, and establish the relationship between the abundance of adult stocks and fisheries. Since 1988, puerulus settlement has been studied on and off using artificial seaweed collectors, but the data series are too short for the construction of accurate predictive models. Recruitment overfishing, hurricanes, and other environmental events appear to be the main factors responsible for the decline in recruitment observed since 1988 [5].
In this study, we investigated the environmental factors that likely impact spiny lobster stocks. These included the Southern Oscillation Index (SOI), which is commonly used to quantify global ocean–atmosphere variability. Our analyses also included environmental data, such as sea surface temperature (SST), chlorophyll-a concentrations (Chl-a), salinity (Sal), wind and current speed, sea level (SL), rainfall (RF), and Amazon River discharge (ARD). We probed the extent to which these environmental parameters and their interrelations affect puerulus settlement, juvenile abundance, and population harvest in the Cuban archipelago and on the continental shelf of Brazil. However, despite the economic importance of spiny lobsters, little is known about the dynamics of larval recruitment and migration and the influence of climate and fishing effort on lobster biodiversity.
The datasets of environmental variables and the time series of recruitment and landings per month and year used in this study were obtained from a variety of sources in different locations. We provide these data to help understand the key environmental trends in the marine environment that potentially affect the lobster life cycle and fisheries as a subsidy to the management of this valuable resource in waters off Brazil and south of Cuba. These factors have previously been shown to affect different aspects of the life history of spiny lobster species in the western Atlantic [6,7].
In this study, we hypothesized that key environmental conditions have a significant impact on the lobster life cycle and population harvest, as observed over extended periods. The hypothesis was tested using statistical models, including regression, cross-correlation, and multivariate analyses. The tests made it possible to analyze the relationship between the selected variables and identify the strength, direction, and significance of each variable, in an attempt to validate our study hypothesis.
2. Materials and Methods
Consistent with the nature of our research, we decided to combine the Section 3, producing an integrated and fluid narrative and a more effective presentation. In this paper, the interpretation of results is closely intertwined with the presentation of the data, allowing the reader to immediately grasp the significance of the findings. Our conclusions are intended to encourage further investigations and debate on the effects of environmental variability on lobster stocks.
2.1. Statistical Analysis
The environmental data used in this study were retrieved from a range of sources in different locations. Thus, due to incomplete information, it was not always possible to correlate environmental variables with specific recruitment stages and fishing data.
To test for possible connections between the SOI, RF, ARD, puerulus settlement, juvenile index, and population harvest, we performed a set of cross-correlation analyses. The approximate formula 2/√n (where n is the total number of months or years) was used to assess the significance of the cross-correlation function at the level of 95%. We also conducted simple logistic regressions and multivariate analyses (MVAs) using the Variance Inflation Factor (VIF), where VIF = 1/(1 − R2). The VIF measures the extent to which multicollinearity increases the variance in the predicted regression coefficients [8]. The MVA and all the statistical tests were performed with the aid of Microsoft Excel (v.16.96.1).
2.2. Site Description
The environmental sampling design included 18 stations, 6 of which were on the Brazilian coast (CR), 6 of which were offshore (OR) (Figure 1), and 6 of which were in waters south of Cuba (Figure 2). The stations were used to register temporal patterns of SST, Chl-a concentrations, wind direction, and Sal, based on data collected with a MODIS (Moderate Resolution Imaging Spectroradiometer) sensor aboard the AQUA satellite.
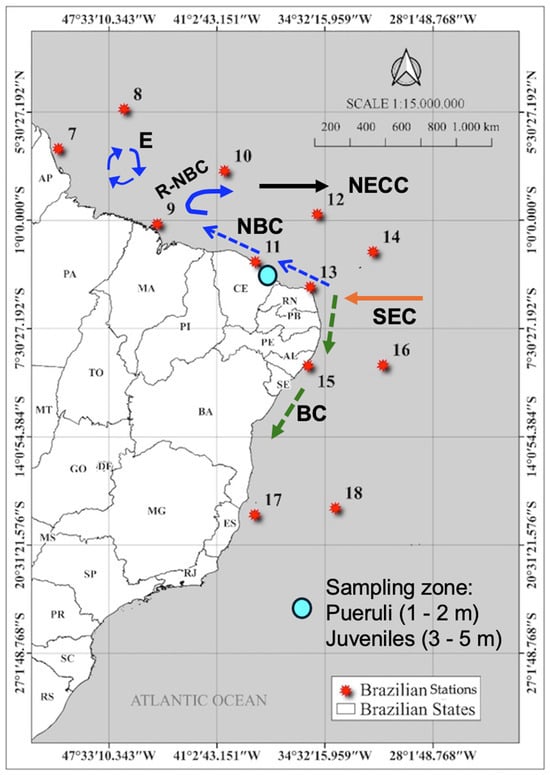
Figure 1.
Map of the continental shelf of Brazil showing the twelve stations in the oceanic region, with a schematic representation of the sampling zone and mean current and eddy generation. NBC: North Brazil Current; R-NBC: retroflexion of the NBC; E: eddy generation; NECC: North Equatorial Counter Current; SEC: South Equatorial Current; BC: Brazil current [9]. Appendix A shows the sampling stations and states along the Brazilian coast.
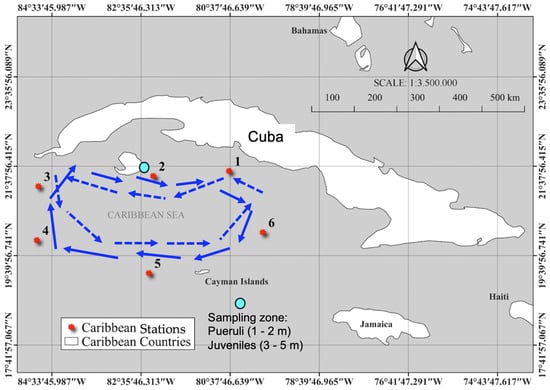
Figure 2.
Map of the insular shelf south of Cuba showing the six offshore stations and the sampling zone. Schematic representation of mean current circulation and anticyclonic (blue arrow) and cyclonic (blue dashed arrow) circulation south of Cuba [9]. Appendix B shows the sampling stations south of Cuba.
The 18 stations were considered representative of the spatial and temporal variability in the different habitats preferred by spiny lobsters during their life cycle (larva, puerulus settlement, and juvenile) and the mean current circulation (Figure 1 and Figure 2) potentially involved in the transport of large numbers of phyllosoma larvae and the return of pueruli to areas of settlement on the coast. The stations in Brazil were divided into offshore (8, 10, 12, 14, 16, and 18) and inshore (7, 9, 11, 13, 15, and 17). In Cuba, the stations were offshore (4, 5, and 6) and inshore (1, 2, and 3).
Landings of red, green, and slipper lobsters are concentrated in three regions along the Brazilian continental shelf. In the north, the Great Amazon Reef System (GARS) is an extensive mesophotic reef ecosystem located approximately 80 km offshore from the Amazon River mouth and covering an area of 9500 km2 [10]. Here, lobsters are caught at a depth of 50–100 m. In the northeastern and southeastern regions, lobster habitats are associated with different depth ranges (5–50 m), each of which is associated with a specific stock size and composition.
The Cuban archipelago is the largest insular shelf in the Caribbean. To the north, the shelf is bordered by Florida and the Bahamas, to the west by the Yucatán Peninsula, to the south by the Caribbean Sea, and to the east by the Atlantic Ocean. The red spiny lobster (P. argus) and the spotted spiny lobster (Panulirus guttatus) are widely distributed in this region, with a preference for shallow waters (1–6 m) and sandy, rocky, or coralline bottoms. The bottom is abrupt here and features a series of terraces [11]. Lobster stocks at depths between 15 and 30 m consist of larger animals that have been little exploited.
2.3. Southern Oscillation Index (SOI)
The Southern Oscillation is an irregular periodic variation in winds and sea surface temperatures in the tropical eastern Pacific, affecting large parts of the tropics and subtropics. Information (year and intensity) on El Niño and La Niña was obtained from NOAA, (https://ggweather.com/enso/oni.htm accessed on 4 September 2024), using the following definition: for an El Niño or La Niña event to be categorized as either weak (W), moderate (M), strong (S). or very strong (VS), it must have SST anomalies meeting specific thresholds (≥0.5 °C) for at least three consecutive overlapping 3-month periods. Monthly SOI values since 1951 are available from the website of the Bureau of National Centers for Environmental Information, https://www.ncei.noaa.gov/access/monitoring/enso/soi (accessed on 4 October 2024).
2.4. Sea Level (SL)
Sea levels reflect an interplay of oceanic and climate processes that we are just now beginning to understand. Monthly SL values for the period 1963–2016 are available from NOAA’s Center for Operational Oceanographic Products and Services (CO-OPS), https://tidesandcurrents.noaa.gov/sltrends/data/874-092_meantrend.txt (accessed on 10 September 2024). Metadata for the period 2017–2022 are available for Ilha Fiscal (22.89° S, 36.97° W), which is located about 1500 km from the center of the spiny lobster distribution area. Despite these limitations in SL data, it is possible to evaluate the interannual variability and test for possible associations with other environmental factors.
2.5. Chlorophyll-a (Chl-a) and Sea Surface Temperature (SST)
The Chl-a levels (measured in mg·m−3) and SST values (measured in °C) used in this study were generated by the AQUA/MODIS system, https://modis.gsfc.nasa.gov/ (accessed on 10 August 2024), using spectral thermal infrared bands at 11 and 12 µm (MODIS channels 31 and 32) and visible sensor bands in the 440–670 nm range, respectively, with a 4 km spatial resolution. The images were processed with Python (3.13.6.) software. The ‘nearest neighbor method’ was used to extract SST and Chl-a values from the images at the latitudes and longitudes closest to the in situ data points, based on a Euclidean distance metric. The two variables were recorded by month and year (2003–2024) at 6 oceanic stations south of Cuba, 6 stations on the Brazilian coast (CR), and 6 offshore stations (OR) (Figure 1 and Figure 2). Chl-a is used as an indicator of phytoplankton biomass, with higher values indicating higher concentrations. Ocean temperature plays a crucial role in the global climate system, impacting ocean currents and marine habitats.
The spiny lobster life cycle and fisheries are influenced by a set of environmental factors. Thus, SST and the retroflection eddies of the North Brazil Current were used to explain the dynamics of spiny lobster self-recruitment. The concentration of Chl-a in surface ocean waters is an indicator of the amount of photosynthetic plankton, or phytoplankton, present in the ocean. Some of the highest mean Chl-a concentrations are found near continental coasts. Phytoplankton populations are influenced by climate factors such as SST. Our time series includes mean pigment concentrations, standard deviations, and 95% confidence intervals (maximum and minimum) for the region.
2.6. Salinity (Sal)
The downloaded Sal maps cover monthly measurements of sea surface Sal centered on the Amazon River plume for the period 2011–2015. The monthly maps were generated from 1° × 1° spatial averages and objective analyses of all the data. The data were retrieved from the Copernicus Marine MyOcean Viewer.
2.7. Winds
For the analysis of wind speed and direction, we used the Global Ocean Monthly Mean Sea Surface Wind and Stress from Scatterometer and Model, sponsored by the Royal Netherlands Meteorological Institute (KNMI). This dataset is available for download on the Copernicus/European Space Agency platform. The product is provided in NetCDF4 format, with level 4 processing and a spatial resolution of 0.25 degrees. Data corresponding to the interval between January 2003 and December 2021 were retrieved. The product displays global monthly means of sea surface wind and stress fields derived from ERA5 (ECMWF) reanalysis wind fields and corrected using available level 3 satellite observations from Metop-A, Metop-B, Metop-C (ASCAT), QuikSCAT (SeaWinds), and ERS-1 and ERS-2 (SCAT). To construct the monthly time series of wind speed and direction for each point in the study area, the grid point (latitude and longitude) closest to the product was selected.
2.8. Monthly Sampling of Pueruli and Juveniles
In northeastern Brazil, pueruli were sampled in Flecheiras (39°13.5′ W 3°14.5′ S) at locations with extensive marine seaweed beds subject to experimental culture. Nearby, in Acaraú (40°05′ W 2°46′ S), juveniles and prerecruits were sampled from benthic artificial shelters at an average depth of 4 m. Figures for average annual puerulus settlement, juveniles, and prerecruits (red lobster) were estimated. The puerulus settlement index (Ip) was calculated for all samples based on the mean catch per collector, month, and station. The relative abundance of juveniles (the juvenile index, or IJ) was considered an indicator of the strength of the cohort recruited to shallow coastal waters. IJ was calculated per month and station by dividing the number of juveniles by the total number of lobsters captured.
South of Cuba, sites near the reefs east of the Isla de la Juventud (21°34′ N 83°31′ W) were included in a sampling program for pueruli (4–6 mm, CL), postpueruli or algal phase (6–16 mm, CL), and juveniles (16–50 mm, CL) of the Caribbean lobster (P. argus). The index of annual puerulus settlement on the coastal reef was obtained from Australian artificial seaweed Phillips collectors [12] based on the mean catch per collector per month. The index of juvenile abundance in concrete block shelters was based on the mean catch per concrete block per month. Prerecruits are lobsters between 50 and 79 mm (CL). The sampling methodology was described in detail elsewhere by Cruz [13].
2.9. Landing Data
Brazilian government agencies kept yearly updated databases of total lobster landings (LL) from 1965 to 2009. A LL time series (red and green spiny lobsters) is available for the period 1965–1990 [14]. Currently, LL data are provided by major fishing companies, exporters, and producers affiliated with Sindfrio (a trade union of fishing industries and cold chains in the State of Ceará), which represented 63% of the national lobster industry in the period 2018–2023. Figures for unaffiliated fishing companies were retrieved from the Comex Stat database, http://comexstat.mdic.gov.br/es/home (accessed on 20 November 2024). Information on 2024 lobster landings were obtained from the site of the Ministry of Fisheries and Aquaculture, https://www.gov.br/mpa/pt-br/assuntos/pesca/principais-recursos-pesqueiros/lagosta/painel-de-monitoramento-da-temporada-2024 (accessed on 12 August 2024).
Monthly landings of red and green lobsters by landing port in the coastal region of the State of Ceará (38°48.669′ W 3°32.981′ S) for the period 2000–2006 can be found in the CEPENE Bulletin database https://www.ibama.gov.br/phocadownload/biodiversidade/biodiversidade-aquatica/gestao-pesqueira/estatistica-pesqueira/2000-ibama-estatistica-da-aquicultura-e-pesca-no-brasil.pdf (accessed on 12 August 2024).
The seasonal fishing index was expressed as lobster catch per month per year, reflecting seasonal patterns. We also used total LL values. Red and green spiny lobsters are sympatric species/populations occurring in the same habitats and at the same time, in close enough proximity to interact as key predators in the benthic ecosystem. In addition, the two species are captured with the same type of artisanal fishing gear. Landing trends may therefore be assumed to be similar for the two species.
3. Results and Discussion
3.1. Environmental Variability Trends
3.1.1. Variability in the Southern Oscillation Index (SOI)
Figure 3 plots SOI data for the warm phase (El Niño) and cold phase (La Niña) in the central equatorial Pacific Ocean, covering the period 1971–2024.
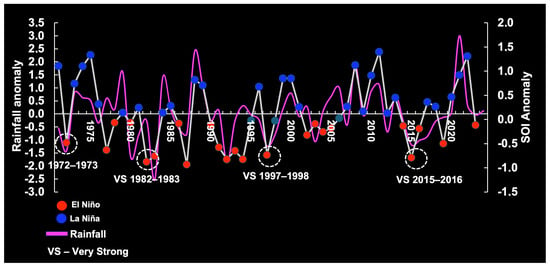
Figure 3.
Variability in the Southern Oscillation Index (SOI), showing threshold fluctuations (very strong = VS and strong = S) relevant to our understanding of rainfall anomalies on the continental shelf of Brazil. La Niña conditions, the strong years: 73–74, 75–76, 88–89, 98–00, 07–08, and 10–11. El Niño conditions, the strong years: 72–73, 87–88, 91–2, and 23–24.
Potential associations between anomalous SOI, RF, and ARD were tested. The SOI was significantly correlated with Brazilian RF at zero lag (n = 54 years; max. correl. = 0.56; p < 0.05). RF was notably reduced when the El Niño event was strong (1972–1973; 1987–1988; 1991–1992; 2023–2024) or very strong (1982–1983; 1997–1998; 2015–2016). Maximum RF anomaly was associated with La Niña mostly when the latter was strong (1973–1974; 1975–1976; 1988–1989; 1998–2000; 2007–2008; 2010–2011) (Figure 3). We also observed significant correlations for ARD, with a 1-year lag (n = 51 years; max. correl. = 0.47; p < 0.05).
On the other hand, the seasonal pattern of mean monthly RF and ARD shows peaks in the fall (March and June), with a lag of three months (R2= −0.76; p < 0.05) or four months (R2= −0.70; p < 0.05). RF was notably reduced in June–September (Figure 4).
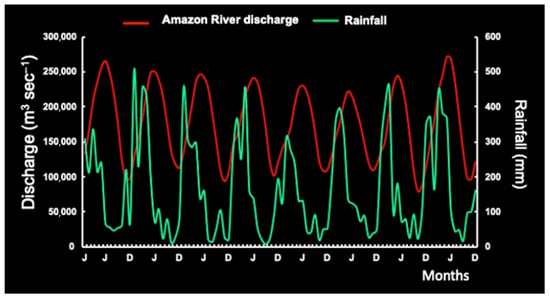
Figure 4.
Seasonal pattern of mean monthly rainfall vs. Amazon River discharge.
In the sea off southern Cuba, RF variability was associated with the transit of tropical waves during the years 2012–2020, similar to what happens during La Niña, but RF decreased perceptibly during El Niño. Variability in the amount and intensity of tropical waves can be explained by teleconnections with SOI patterns. During the El Niño phase, a decrease was observed in RF and in the number of tropical cyclones formed [15].
3.1.2. Variation in Sea Level (SL)
A visual comparison of sea levels by period shows a rising trend in the periods 1963–1986 and 2005–2022 and a falling trend in the period 1987–2004 (Figure 5), reflecting considerable variability over the past 59 years along the continental shelf of Brazil. In this region, sea levels fell during El Niño years (1987–2004), whereas La Niña years were associated with rising sea levels (Figure 6).
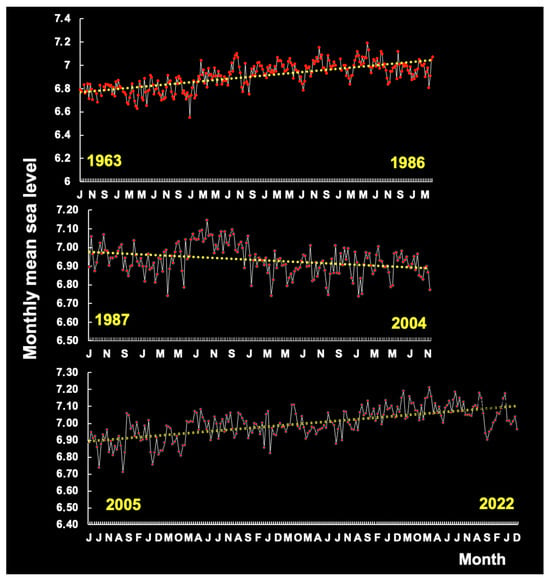
Figure 5.
Variation in the monthly sea level in three periods (1963–1986, 1987–2004, 2005–2016) on the continental shelf of Brazil.
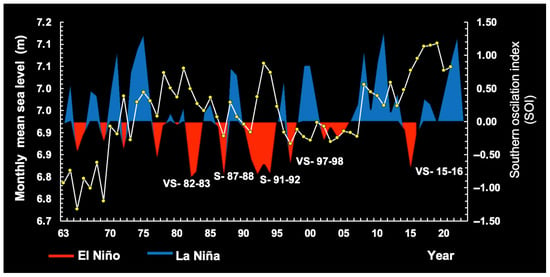
Figure 6.
Variation in the monthly mean sea level (1963–2022) over the continental shelf of Brazil observed during the Southern Oscillation Index (SOI) between 1963 and 2022.
In our dataset, the cross-correlation between ARD and SL was non-significant (n = 47; max. corr. = −0.23; lag 4 years; p > 0.05). In contrast, Piecuch et al. [16] proposed a formula to predict the observed interplay between river discharge and sea level on the US East Coast, suggesting a causal relation between the two variables.
According to Salas [17], on the coast of Brazil, SL is expected to increase by 9.96 cm (5.2 mm/year) over 20 years (2020–2039) and by 20.09 cm (11.0 mm/year) by mid-century (2040–2059), relative to the historic baseline. In the longer term, the author predicts an even faster rise (21.3 mm/year), totaling a 40.5 cm increase by the end of the period 2080–2099. However, the relationship between coastal current flow and sea levels has not been verified and quantified.
In the sea around Cuba, SL is known to be correlated with La Niña events. Currently, the annual rate of increase in SL, obtained from the longest tide gauge records, fluctuates between 0.214 cm/year (north coast) and 0.005 cm/year (south coast) [18]. However, this information requires confirmation, as very few relevant studies are available for the Cuban archipelago.
On the other hand, in Western Australia, a climate-related rise in coastal sea levels (1.62 mm/year) is generally a good predictor of the effect of oceanic conditions on larval transport and/or survival and hence, subsequent catches in a variety of West Australian fisheries [19,20]. Evidence suggests that an increase in sea level in two major spiny lobster fishing grounds, namely, Brazil and Cuba, could significantly impact coastal lobster communities, oceanic ecosystems, and landings over the following decade (2026–2036), but further research is needed to support decision-making and achieve effective outcomes.
3.1.3. Sea Surface Temperature (SST)
The variability in SST (°C) south of Cuba and on the Brazilian continental shelf (Figure 7) was studied for the period 2003–2024 to identify tendencies in each region.
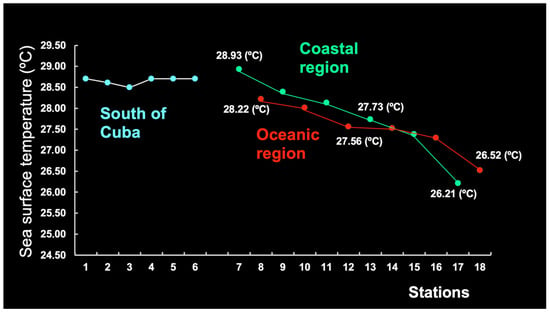
The six stations off southern Cuba (1–6) displayed a relatively stable SST (mean: 28.50–28.70 °C). The variation in weather patterns could be linked to a combination of seasonal weather variations and oceanic mixing. These seasonal changes can significantly influence local weather conditions and contribute to variations across the Cuban archipelago. Oceanic mixing and thermohaline dynamics in the surrounding waters play a role in regulating coastal temperatures and influencing weather patterns, including the intensity of tropical cyclones [21,22].
In contrast, the 12 stations on the coast of Brazil and offshore (7–18) showed a negative tendency towards the east. The lowest SST values were observed for station 17 (CR) and station 18 (OR), but, generally speaking, the CR was warmer than the OR (Figure 7). The westward-flowing South Equatorial Current bifurcates upon reaching the continental shelf and forms the Brazil Current, which flows southward along the Brazilian coast, causing the formation of southern eddies [23,24]. The average SST of the South Equatorial Current is reported to be 26–28 °C [25], matching our results fairly well (Figure 7).
South of Cuba, SST varied considerably from month to month, from 26.6 °C (January–March) to 30.89 °C (September), corresponding to a maximum temperature range (MTR) of ~4 °C (Figure 8A). In Brazilian waters, a marked variation in monthly SST patterns was perceptible for both the CR and the OR. In the northeastern region, the CR was warmest in April and coolest in August, with a monthly MTR of 1.4 °C (Figure 8B). The OR was warmest in May and coolest in August, with a much smaller MTR (0.6 °C) (Figure 8C).
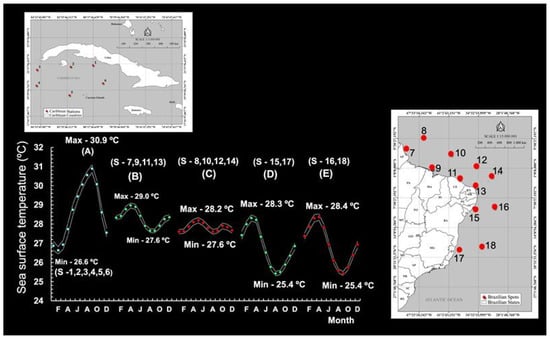
Figure 8.
Seasonal pattern of sea surface temperature (SST) (°C) in the Northern Hemisphere ((A)—south of Cuba) and the Southern Hemisphere (coastal and oceanic regions off Brazil), showing variation in the north–northeast (B,C) and northeast (D,E). Max = maximum temperature. Min = minimum temperature. S = station.
When reaching the Brazilian coast at approximately −10° S, the South Equatorial Current splits into the North Brazil Current (NBC) and the Brazil Current (which flows southwards) [26]. Monthly SST values fluctuated considerably in the CR and the OR, with an MTR of 2.9 °C (CR) and 3.0 °C (OR). The waters tended to be particularly warm in March–April, followed by a brief period of cooling in August–September (25 °C) (Figure 8D,E).
Overall, SST displayed a negative anomaly in the period 2003–2018 and a positive anomaly in the period 2019–2024 (Figure 9). No local SST data are available for the period prior to 2003. A comparative analysis of SST anomalies over the last 21 years (2003–2024) reveals a trend of temperature increase starting in 2019 in both the CR and the OR (Figure 9), although the temperature range was greater in the former (1.95 °C) than in the latter (1.70 °C) (Figure 9). The sea south of Cuba also displayed an anomaly in this period, with a temperature range (4.35 °C) 2.2 and 2.6 times higher than that of the OR and the CR, respectively (Figure 10).
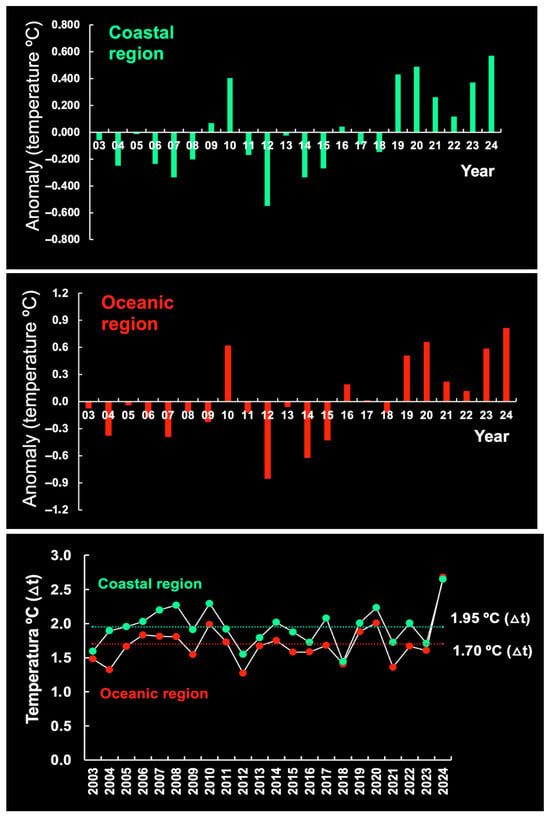
Figure 9.
Sea surface temperature (SST) (°C) anomalies by year in the coastal region (CR) and the oceanic region (OR) off Brazil. The period 2003–2024 was below the mean maximum SST range.
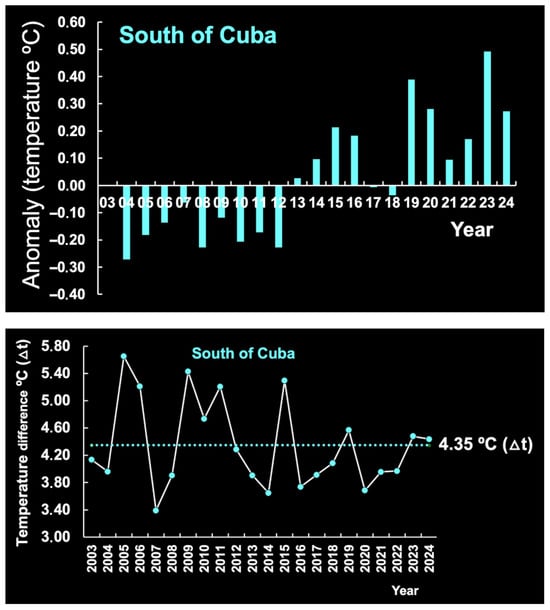
Figure 10.
Sea surface temperature (SST) (°C) anomalies by year in the sea south of Cuba. The period 2003–2024 was below the mean maximum SST range.
The years 2023 and 2024 registered the highest temperatures in the waters south of Cuba and off Brazil, respectively, coinciding with the global SST record of 2023–2024. Thus, in 2024, the average global temperature range was 1.29 °C, which is the highest observed in the period 1850–2024. This increase may have implications for sea levels and, consequently, for coastal fisheries. However, historical SL datasets from the coast of Brazil are incomplete and, according to some sources, SL is no longer monitored by the authorities. This severely limits the possibility of analyzing sea level variations along the country’s extensive coastline.
3.1.4. Variation in Salinity (Sal)
On the maps centered on the Amazon River plume, monthly surface salinity varies between 20 and 28 psu during maximum discharge in May or June. However, salinity variations in the open ocean, away from the direct riverine influence and evaporation from shallow nearshore waters, are comparatively small, depending on the month, with the greatest occurring from July to September. In waters off northeastern Brazil, below 0° latitude, salinity ranges from 32 to 36 psu (Figure 11).
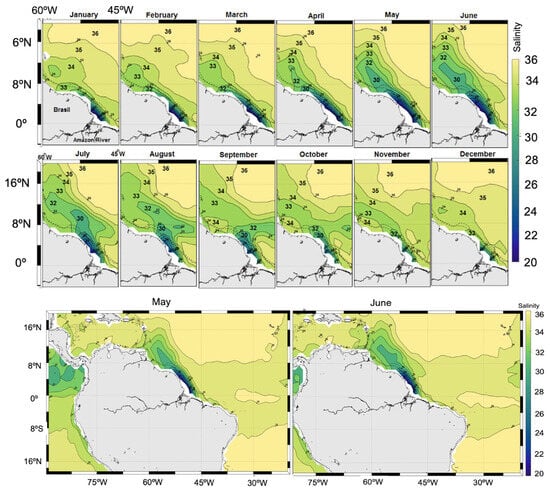
Figure 11.
Monthly surface salinity maps centered on the Amazon River plume (2011–2015). The maximum Amazon River discharge (0.23 Sv) was observed in May or June. In the northeastern region of Brazil (below latitude 0°), salinity was 32–36 psu from May to June.
In contrast, the retroflection and eddies of the North Brazil Current, as far as 46° W or 52° W (depending on the month), display a salinity between 34 and 36 psu. Retroflection is poorly established from December to February and weak or absent from April to June as it flows along the coast. Salinity is >30 psu in the northwestern jet and between 20 and 28 psu near the Amazon River mouth.
3.1.5. Effect of Winds on Currents
The joint analysis of wind fields and surface currents along the northern and northeastern coasts of Brazil reveals a clear seasonal modulation of ocean circulation by wind forcing. From July to September (JAS), the southeast trade winds (Figure 12A) are more intense and persistent, reaching velocities between 9 and 12 m s−1 and leading to the formation of North Brazil Current retroflection eddies. This wind pattern enhances the westward-flowing equatorial currents, with maximum velocities near the coast ranging from 0.8 to 1.0 m s−1 (Figure 12A, right).
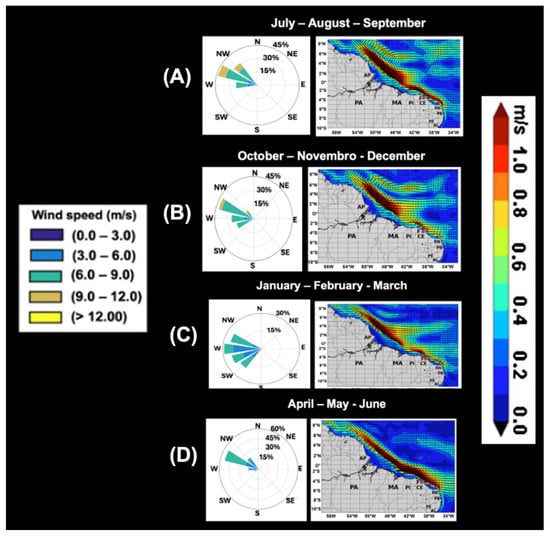
Figure 12.
Seasonal mean wind and surface current speed in m/s (modified from Cruz et al., [3]). Monthly and seasonal averages in the period 2003–2005 were used to identify wind speed and direction and the presence of rings arising from the North Brazil Current. Subfigures (A–D) represent the seasonal average of the winds and surface currents (m/s).
In the following quarter, from October to December (OND), although the winds maintain a similar direction (Figure 12B), a gradual decrease in intensity is observed, with values ranging from 6 to 9 m s−1. During this period, the retroflection of the North Brazil Current (NBC) remains well established, although average flow velocities vary between 0.4 and 0.8 m s−1 (Figure 12B, right).
The winds between January and March (JFM) exhibit lower intensity (6–9 m s−1) and greater directional variability, still predominantly from the east (Figure 12C), in response to the seasonal positioning of the intertropical convergence zone. This atmospheric configuration favors the weakening of ocean surface currents, which become less organized and more detached from the coastal flow. During this period, the retroflection of the NBC diminishes and becomes poorly defined (Figure 12C, right).
From April to June (AMJ), an intensification of the southeasterly trade winds is observed (Figure 12D), when compared to JFM, promoting the reorganization of currents and the reapproximation of the NBC to the coast, with surface velocities exceeding 1 m s−1 (Figure 12D, right).
Monthly analyses indicate that the configuration and positioning of the anticyclonic and cyclonic vortices south of Cuba are modulated by seasonal patterns of surface winds. In November, the trade winds predominantly blow east-northeastward and eastward, with intensities ranging from 6 to 9 m s−1 and occasional peaks at 12 m s−1. In December and January, the prevailing wind direction remains east-northeast, with velocities between 6 and 9 m s−1. In February, the trade winds exhibit a predominant easterly direction while maintaining their intensity. The persistence of these trade winds, as illustrated in Figure 13, induces changes in the position and intensity of the anticyclonic and cyclonic vortices.
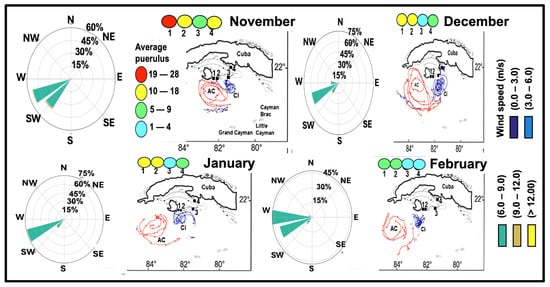
Figure 13.
Seasonal mean wind speed and a summary of cyclone (blue) and anticyclone (red) eddies southwest of Cuba (modified from Richardson, [9]), reflecting the surface currents in m/s. Summaries of westward wind during the months of November and December 1999 and January and February 2000.
3.1.6. Chlorophyll-a Concentrations (Chl-a)
In Brazilian waters, Chl-a levels are 6 times higher in the CR than in the OR, indicating significantly higher concentrations of phytoplankton biomass in the coastal region. In waters south of Cuba, the average Chl-a levels fluctuate very little (0.065–0.086 mg m−3) when compared to the gradient observed on the Brazilian continental shelf (Table 1).

Table 1.
Summarized chart of variation in chlorophyll-a (Chl-a) levels (mg m−3) on the continental shelf of Brazil and in the sea south of Cuba. The 18 sampling stations are represented by numbers in each region. The number of samples is the total time series of extractions from the satellite-based ocean color generated by the AQUA/MODIS system. Confidence intervals (±95% CIs) and bounds are given for the mean Chl-a value of each region.
Chl-a varied considerably depending on location and month, but was consistently higher in the CR (Figure 14). The highest Chl-a value (7.19 mg m−3) was observed at the mouth of the Amazon River (station 7, the CR). Interestingly, Galvão and Texeira [27] also found high Chl-a values on the continental slope, suggesting possible upwelling processes at the shelf break periodically. In general, the CR is more productive throughout the year due to enrichment by river drainage and semi-protected basins [28].
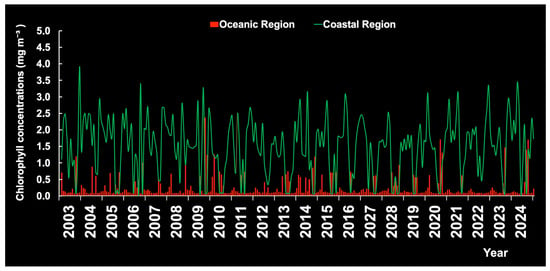
Figure 14.
Monthly chlorophyll-a concentrations by year in the coastal region (CR) and the oceanic region (OR) of the continental shelf of Brazil.
South of Cuba, Chl-a levels depend on depth and season (Figure 15A). The highest values are registered between November and February the following year, with a more prominent peak in December–January and a less prominent peak in May-August (Figure 15B). On the other hand, the fact that the line on the graph does not show a statistical trend (n = 72; R2 = 0.0513; p > 0.05) and the pattern observed in the data could be explained by random variation, rather than an actual relationship. Note that Caribbean lobster phyllosoma larvae are more abundant in the Chl-a-rich waters near the southern insular shelf (S1, S2, S3; Figure 2) than further offshore (S4, S5, S6; Figure 2).
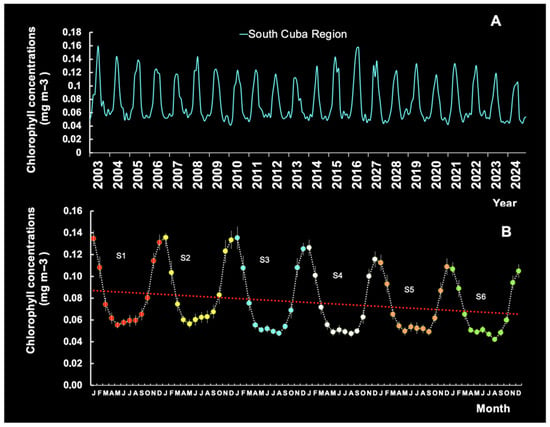
Figure 15.
Seasonal variation in chlorophyll-a levels by year (A) and seasonal patterns by station (B) south of Cuba (see Figure 1), with a trend line.
Inter-month variations were observed in Chl-a patterns from different sampling stations (the CR and the OR) during the period 2003–2024. Chl-a concentrations were averaged monthly throughout the year in a 21-year time series. In the CR, we identified only one peak period (June–October), which is often linked to increased river discharge and its subsequent impact on phytoplankton growth. Increased river discharge introduces nutrients into the water, stimulating phytoplankton blooms. The stations in the OR exhibited two peak periods (March–April and August–September) (Figure 16), suggesting that seasonal variation in Chl-a was consistent across locations.
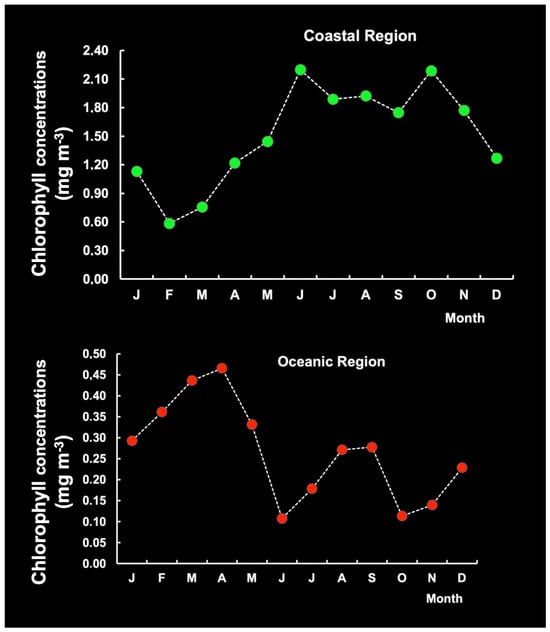
Figure 16.
Seasonal pattern of chlorophyll-a levels in the coastal region (CR) and the oceanic region (OR) on the continental shelf of Brazil.
The interannual Chl-a variability in the Southern Hemisphere (Figure 17A) and Northern Hemisphere (Figure 17B) may be influenced by various factors, such as sea temperature, nutrient availability, light availability, and SOI events [29]. However, Chl-a displayed a relevant increase in 2007–2008 associated with strong La Niña events in 2007–2009 and 2023–2024, especially in the CR. This observation was made possible by the fact that nutrient supply is mainly determined by local dynamics.
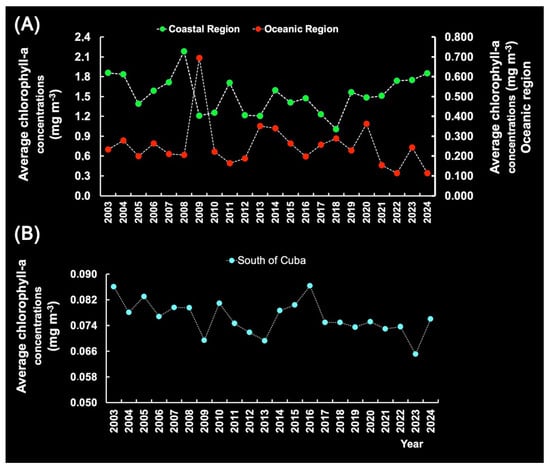
Figure 17.
Annual chlorophyll-a levels in the coastal region (CR) and the oceanic region (OR) off Brazil (A) and south of Cuba (B) in the period 2003–2024.
Chl-a levels vary greatly around the globe. For example, Chl-a levels were expected to rise in the South China Sea [30] despite the concomitant decline in global levels. Research has so far produced inconsistent results, such as those of Martinez et al. [31], who estimated the impact of the Pacific decadal oscillation on the Chl-a distribution in the Pacific basin, and Waliser et al. [32], who quantified the influence of the Madden–Julian oscillation on Chl-a variability in the tropical Indian and Pacific Oceans.
On the other hand, our study of the Southern and Northern Hemispheres points to a significant relationship between Chl-a and SST on the local scale (Figure 18), based on linear regressions using data for the OR and the CR (equation A) and polynomial models (order 2) fitted with data for southern Cuba (equation B).
Chl-a = 0.1606 × SST—3.4425 (R2 = 0.6549; p < 0.05)
Chl-a = 0.0143 × SST2 − 0.7916 × SST + 11.013 (R2 = 0.95; p < 0.05).
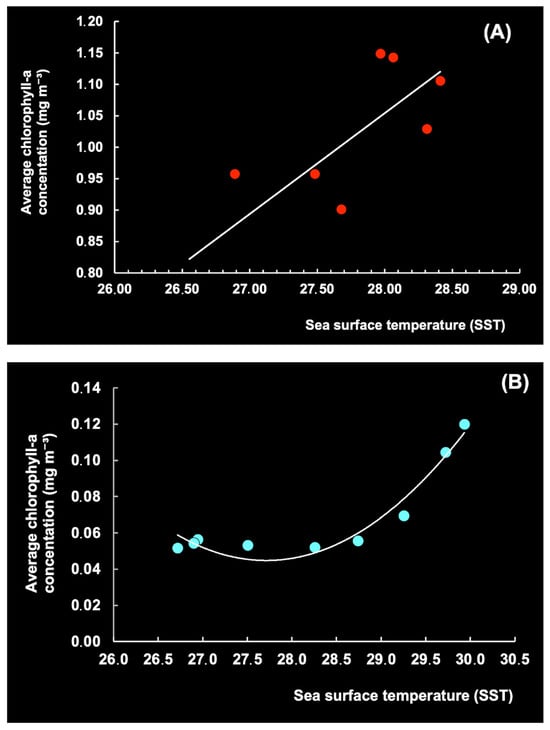
Figure 18.
Mean monthly sea surface temperature (SST) (°C) vs. chlorophyll-a level (mg m−3) in the period 2003–2024 for Brazil (A) and Cuba (B).
This indicates that changes in SST can significantly impact Chl-a concentrations and thereby alter growth, photosynthesis, and phytoplankton reproduction [33,34]. Thus, the production of Chl-a was relatively stable in the waters south of Cuba, with an SST of 26–28 °C, but increased at 28–30 °C. Sathicq et al. [35] also concluded that El Niño (SOI) impacts phytoplankton growth globally via changes in temperature, winds, and sea levels.
3.2. Environmental Effect on Recruitment and Landings
3.2.1. Environmental Factors Affecting Puerulus Settlement and Juvenile Development
In Brazil, the seasonal pattern (2003–2024) of average monthly RF and ARD features peaks in March and June, respectively, reflecting a significant relationship between the two, with a lag of 3 months (max. correl. = 0.99; n = 20; p < 0.05) or 4 months (max. correl. = 0.89; n = 20; p < 0.05). Maximum ARD occurs from April to July and is consistent over time. Puerulus settlement indices and juvenile abundance tend to increase at the time of ascendant (January) and descendent discharge (October) (Figure 19 and Figure 20), reflecting the months in which the range of AR discharge is most suitable for the settlement of pueruli (4.27–6.64 mm CL), the algal phase (6–16 mm CL), and juveniles (16–50 mm CL) [36]. These observations support the notion that the recruitment phase on the continental shelf is negatively associated with ARD.
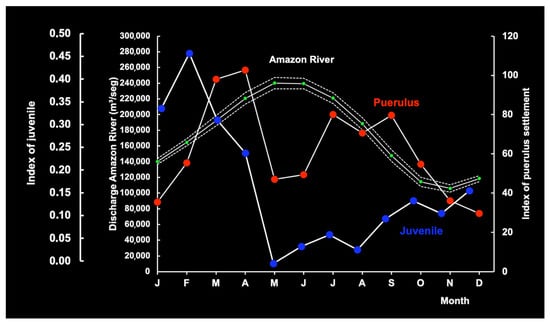
Figure 19.
Association between the mean red lobster puerulus settlement index and juvenile abundance index and the mean Amazon River discharge (m3/s) in the period 2003–2007 (solid white lines) with the respective 95% confidence intervals (dotted white lines).
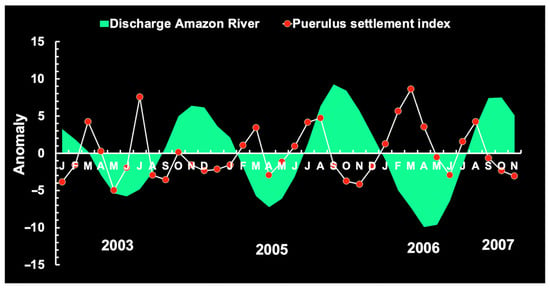
Figure 20.
Amazon River discharge anomaly, red lobster puerulus settlement, and rainfall.
A highly significant negative linear relationship between ARD and salinity off Brazil can be demonstrated (R2= –0.73; n = 12; p < 0.005). Fluctuations in ARD can explain the observed local variability in salinity (from 28.1 to 35.6 spu).
The relationship between puerulus settlement and environmental factors was examined individually and in combination. De Lestang et al. [37] concluded that low settlement indices were related to higher water temperatures at the time of the onset of spawning. In this study, a strong association was observed between SST and the puerulus settlement index (Ip), with significant seasonal fluctuations (Figure 21A). This was confirmed by using the quadratic equation below (Figure 21B):
where SST accounts for approximately 80% of the effect on puerulus settlement, while the remainder is attributed to other environmental parameters. These observations support the notion that puerulus settlement on the continental shelf is regulated by temperature, reflecting the months in which the range of temperature is most suitable, and that the decrease in puerulus settlement at 27.6–28 °C is related to low Chl-a concentrations offshore. In the CR, puerulus settlement generally occurs when SST is between 25 and 29 °C.
Ip = 66.362 (SST)2 − 3682.4 (SST) + 51121 (n = 12; R2 = 0.80; p < 0.005)
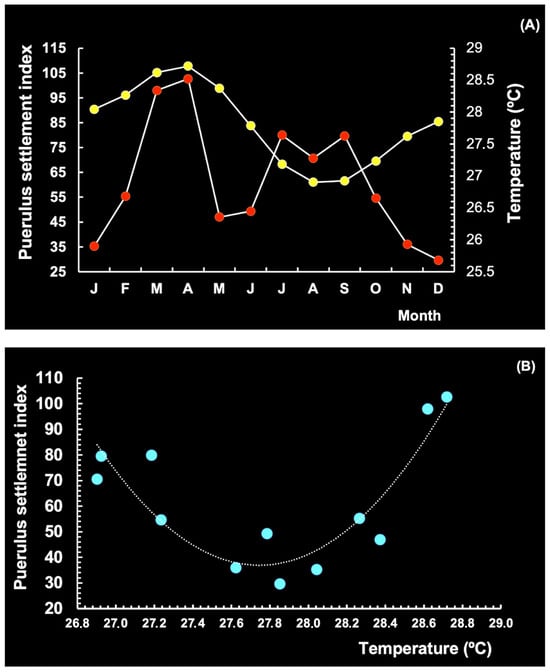
Figure 21.
Seasonal pattern of the puerulus settlement index (point red) for the spiny lobster Panulirus argus (red lobster) vs. sea surface temperature (point yellow) in the coastal and oceanic region of the continental shelf of Brazil (A). Relationship between SST and settlement index (B). Period 2003–2024.
The association between Chl-a and Ip has been investigated before. Thus, south of Cuba (Figure 22), Chl-a was found to be strongly correlated with puerulus settlement (n = 12; max. correl. = 0.95; p < 0.05; 1988–1996), with a 2-month lag. This is only possible due to the high concentration of phyllosoma larvae (>100 larvae/100 m2) along the offshore boundary of the currents, the elevated Ip on the insular shelf and in oceanic waters, and the distribution of plankton in the upper 100 m layer (mg/m3) during most of the year [36]. Greer et al. [38] observed that the relative abundance of gelatinous zooplankton is compatible with the phyllosoma food web, suggesting lobster larvae prey on this source. On the other hand, the gelatinous taxa of the phylum Cnidaria (gelatinous zooplankton) are widespread components of zooplankton communities and key consumers of basal production (phytoplankton, predators of zooplankton, and fish larvae) [39].
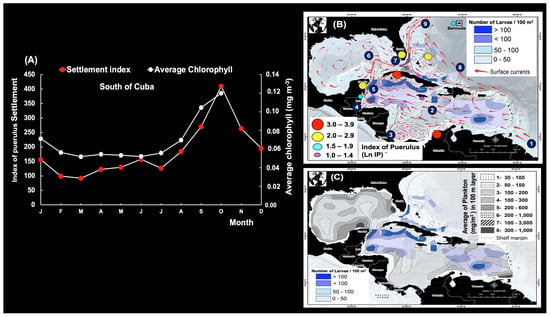
Figure 22.
(A) Association between the mean puerulus settlement index and chlorophyll pigment time series lagged by two months. (B) Mean density of Panulirus argus phyllosomata (number of larvae/100 m2) in the Wider Caribbean (different shades of blue). Schematic representation of mean current and eddy generation: 1, the Guiana Current; 2, the Caribbean Current; 3, the Colombia Basin gyre; 4, the cyclonic Honduras eddy; 5, the Yucatan Current; 6, the Loop Current Eddy; 7, the Florida Current; 8, the Antilles Current; and 9, the Gulf Stream. (C) Average density of P. argus phyllosomata (number of larvae/100 m2) and distribution of plankton in the upper 100 m layer (mg/m3) of the Wider Caribbean. Maps (B,C) were modified from Cruz et al. [40].
We also performed a comparative analysis of seasonal larval recruitment patterns and wind speed direction and oceanic circulation on the continental shelf of north–northeastern Brazil and south of Cuba. Brazilian Chl-a levels were correlated (n = 12; max. correl. = 0.52; p < 0.05) with Ip (red lobster) with a 3-month lag (Figure 23A). A complex circulation of the North Brazil Current was observed during 2003, 2005 and 2006, which seemed to have formed from elements of the current retroflection (between 48° W and 52° W) and different anticyclonic eddies between 52° W and 38° W and as far north as 9° N (Figure 23B), which may be responsible for transporting large numbers of phyllosoma larvae and for returning pueruli to areas of settlement on the coast.
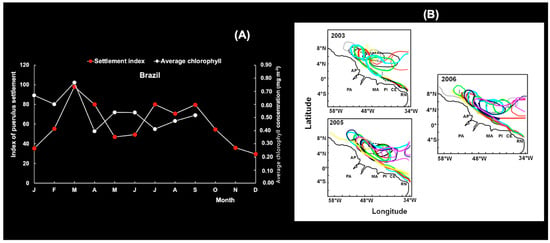
Figure 23.
(A) Association between the mean puerulus settlement index for the spiny lobster Panulirus argus (red lobster) and chlorophyll pigment time series lagged by three months. (B) The complex circulation of the North Brazil Current retroflection (between 48° W and 52° W) eddies (2003, 2005, 2006) is illustrated by different colors. This figure was modified from Cruz et al. [40].
The North Brazil Current retroflection was more established from July to September, with a prevailing strong southeast trade wind at an average speed of 9–12 m s−1. From October to December, the wind maintained a similar direction, at an average speed of 6–9 m s−1. South of Cuba, stronger winds increased the water circulation, favoring larval settlement (see Section 3.1.5). This dynamic was reflected in puerulus behavior; thus, according to a model proposed by Caputi et al. [41], pueruli (Panulirus cygnus) come to the surface and remain there at night but only when the wind speed is above 7.5 m s−1. So far, no detailed study has been conducted to clarify the extreme variations observed in recruitment, the mechanisms responsible for larval transport, and their relation to adult stocks. Likewise, few empirical data are available to explore the climate effects addressed in the present study, making it necessary to develop a climate model supported by an in situ study.
In northeastern Brazil, we found a significant linear association between the concentration of Chl-a and Ip (Ip = 38.3742 × Chl-a + 28.41819; n = 27; max. corr. = 0.58; p < 0.05), with a 9-month lag (Figure 24), compatible with the correlation between oceanic larval behavior and puerulus settlement observed in studies from the Northern and Southern Hemispheres. During their long planktonic stage, 6–10-month-old P. argus larvae can potentially disperse in the open sea [42,43] or, up until 12 months old, in the cooler waters off Bermuda [44].
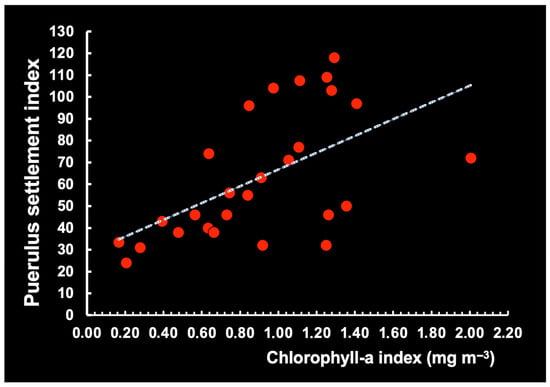
Figure 24.
Association between monthly chlorophyll-a levels and the red lobster puerulus settlement index nine months later in the northeastern region of Brazil in the period 2003–2006.
Despite the scarcity of information available on the distribution of phyllosoma larvae and plankton along the Brazilian continental shelf, we regard the concentration of Chl-a in surface ocean waters as a potential indicator of the abundance of photosynthetic plankton or phytoplankton related to gelatinous zooplankton, phyllosoma larvae, and puerulus settlement, as suggested by studies from Cuba. According to Jeffs [45], during their long pelagic stage, larvae are opportunistic predators that feed on various types of prey, including gelatinous zooplankton, shrimp, copepods, and amphipods. Unfortunately, due to ontogenetic vertical migration, it is not possible to determine how far away from the parental stock they travel [46,47,48].
The SST anomaly observed in the waters off Brazil and southern Cuba increased in 2024, matching global trends for 2023 [49]. The average SST in 2023 was between 27.83 °C (OR) and 28.06 °C (the CR) in Brazil and 29.27 °C in Cuba. However, this is still within the SST range tolerated by spiny lobsters during the larval stages.
On the other hand, laboratory and field data published by Field and Butler [50] show that very high (>33 °C) and very low (<18 °C) temperatures, as well as salinities above 33 psu, can compromise recruitment. Changes in water temperature are known to affect molting frequency, size at onset of female breeding, fecundity, reproduction patterns [51], mass migration [52], and disease [53], although the relationship is not uniform across seasons, regions, and spiny lobster species, and may be influenced by sampling method.
Despite the scarcity of information on pelagic larval survival and salinity ranges in the ocean, the observation by Goldstein et al. [54] that phyllosoma larvae can be reared under laboratory conditions at a salinity of 33 to 35 psu is compatible with the salinity gradients reported for the continental shelf of Brazil and Cuba.
There is a consensus among many authors that environmental variables decisively influence crustacean recruitment processes, but the mechanisms involved are still unclear and require further investigation [55].
3.2.2. Lobster Landings and Seasonal Rainfall Patterns
Lobster fishing is seasonal, with a peak at the beginning of the fishing season in May–June (fall season) (2000–2006). Red and green spiny lobsters display similar seasonal landing patterns. Landings increase rapidly and then gradually decrease in July until the end of the year (Figure 25).
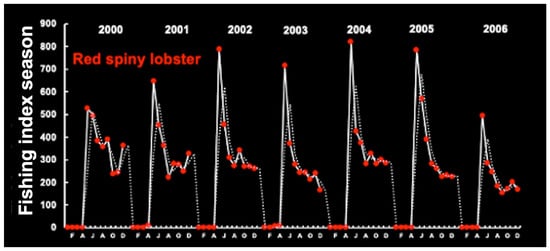
Figure 25.
Seasonal red and green lobster fishing patterns in the period 2000–2006. Time series from the continental shelf off Ceará (38°48.669′ W 3°32.981′ S). The data are expressed as the seasonal fishing index using the moving (random) average method. Appendix A shows the sampling stations and states along the Brazilian coast.
The association between rainfall anomaly and the monthly production of red and green spiny lobsters (Figure 26) supports the notion that LL is negatively associated with RF and ARD, indicating the season in which the range of rainfall is the least suitable for lobster production.
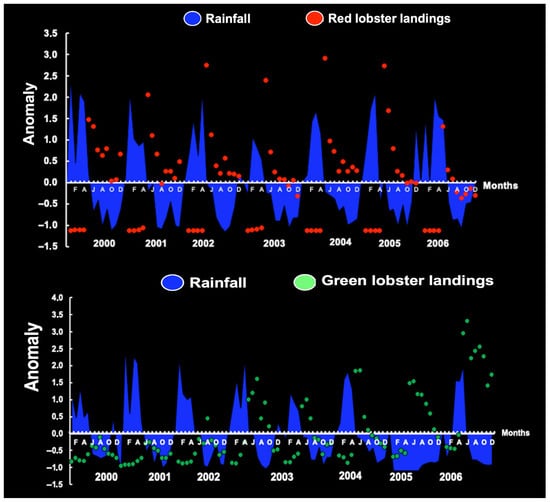
Figure 26.
Monthly anomalies in landings and rainfall on the continental shelf off Ceará (38°48.669′ W 3°32.981′ S). Appendix A shows the sampling stations and Brazilian coastal states.
Covering the period 1972–2022, we assessed the variability in strong RF anomalies from December to March and the interannual landings of red spiny lobsters on the continental shelf of Brazil (Figure 27). The period from 1972 to 1999 was drier than usual (negative RF anomaly), but RF increased after 2000, associated with a period of negative anomaly in LL. According to the dataset, RF increased by an average of 264 mm from 2000 to 2021. In the period 1972–1999, the average was less than 240 mm.
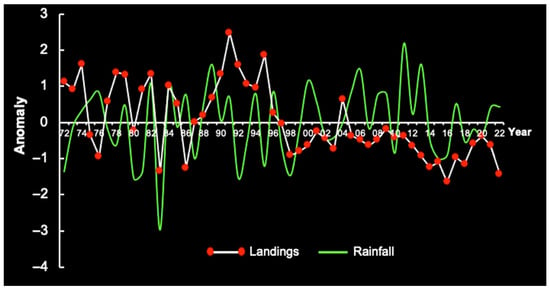
Figure 27.
Anomaly of annual rainfall (December to March) vs. red lobster landings in the period 1972–2022 on the continental shelf of Brazil.
Adult lobsters of both sexes are unaffected by rainfall because of their intrinsic defense mechanisms, which protect them against shelter disturbance, as observed for the autumnal mass migrations in the Bahamas and in Cuba under storm-induced changes in water temperature [56]. Nevertheless, inorganic and organic turbidities are likely circumstantially implicated as a triggering stimulus. Adult lobsters can navigate by way of the Earth’s magnetic field, traveling from 12 to 37 km [57]. In Brazil, Fonteles-Filho and Ivo [58] reported that red spiny lobsters travel approximately 20 km to reach habitats at depths of 10, 30, and 50 m. In the Cuban archipelago, prerecruits travel from 3 to 30 km in order to settle in southwestern habitats [59].
3.2.3. Chlorophyll-a Concentrations and Landings
Our above analysis of the association between Chl-a levels and Ip suggests the relevance of conducting investigations on the effect of Chl-a levels on LL. Based on the assumption of a correlation between Chl-a levels and LL, regression analysis can be used to clarify the observed variations in commercial LL (t).
An annual linear regression could be established between the Chl-a levels and LL (t) of the following year, but the association was not statistically significant, given the available data from the continental shelf of Brazil (p > 0.05) and southern Cuba (p > 0.05) (Figure 28). However, the data displayed little random variation, possibly due to the variation in environmental factors. This does not mean there is no relationship, but rather that the evidence from the current data is insufficient to support a statistically significant conclusion.
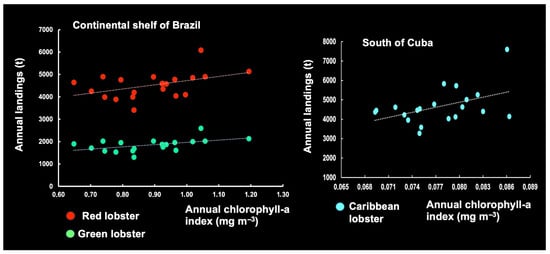
Figure 28.
Association between annual chlorophyll pigment (2003–2023) and total commercial landings on the continental shelf of Brazil (red lobster and green lobster) and south of Cuba (Caribbean lobster).
For Brazil, the relationship between LL and environmental parameters (Chl-a, SST, RF, ARD) was analyzed using MVA, where LL was the dependent variable, and the environmental parameters served as independent variables. The requirements for the best regression model were met. The VIF obtained was 1.0, indicating the absence of multicollinearity among the independent variables. The following equation represents the results of the regression analysis (2002–2024) for the continental shelf of Brazil using MVA.
Red lobster:
LL (t) = −17319.725 + Chl-a × (1596.60) + SST × (743.8656) + RF × (4.9410) + ARD × (−8.0525).
(n= 23 year; r= 0.61; R2 = 0.40; p < 0.1; 90% CI)
Green lobster:
LL (t) = −8665.0126 + Chl-a × (768.0328) + SST × (357.8311) + RF × (2.3768) + ARD × (−3.8736)
(n = 23 year; r = 0.60; R2 = 0.37; p < 0.1; 90% CI)
The complex model cannot fully account for the variability in the data since a considerable amount of variation in LL is associated with fluctuations in juvenile abundance and uncontrolled fishing effort.
In fact, in the absence of data on puerulus settlement and juvenile abundance, environmental parameters like Chl-a, SST, RF, and river discharge (depending on the oceanic region) may be used as proxies to predict LL. In Western Australia, similar methods have been developed that predict landings from puerulus settlement indices [60]. Fairly accurate predictions have been made four years in advance with these methods, which are regarded as a useful fishing management tool by the industry and the government.
No information on RF or river discharge was available for the sea south of Cuba. The relationship between LL and environmental parameters (Chl-a, SST) was analyzed using MVA, where LL was the dependent variable and Chl-a and SST served as the independent variables. The latter exhibited no multicollinearity. The regression analysis explained 65% of the variability in LL (n = 21 years; r = 0.80; R2 = 0.65; p < 0.05) as a result of fluctuations in Chl-a and SST.
LL = 71071.192 + 81287.5541(Chl-a) − 2538.7459(SST)
However, the regression model analyzing LL, Chl-a, and SST in the Brazilian dataset did not yield significant results (n = 21 years; r = 0.45; R2 = 0.21; p > 0.05). The Brazilian climate and weather patterns are strongly influenced by the discharge of rivers (of which there are nearly 1300) and by seasonal rainfall. Thus, the country’s vast river systems, particularly in the Amazon region, play a crucial role in water circulation and precipitation, as ‘flying rivers’ impact weather across the continent [61].
Combining size limits and quotas in catch policies to increase the economic yield of lobster fisheries has long been considered by Brazilian authorities. A predictive model for effective annual and seasonal planning would be a useful tool in these efforts.
4. Conclusions
The space–time variability in SL, RF, DAR, SST, Sal, and Chl-a was determined for the area of distribution of red (P. argus) and green lobsters (P. laevicauda) on the continental shelf of Brazil and the sea south of Cuba. The observed patterns suggest a direct or indirect influence of these environmental parameters on recruitment and population harvest.
In this study, a significant association was observed between puerulus settlement and SST. The number of pueruli successfully reaching coastal regions is highly variable and influenced, among other things, by current retroflection eddies (Brazil) and cyclone–anticyclone patterns (Cuba), reflecting the months when these factors are most suitable for the retention and supply of surviving larvae, thus promoting self-recruitment.
The influence of rainfall and river discharge on puerulus and juvenile abundance was determined, supporting the notion that the recruitment phase on the continental shelf is negatively associated with rainfall/river discharge in the coastal region.
In northeastern Brazil and south of Cuba, the association between Chl-a and puerulus settlement was assessed. The concentration of Chl-a is an indicator of phytoplankton biomass, meaning that higher Chl-a levels go hand in hand with greater concentrations of the plankton preyed on by lobster larvae.
The Chl-a, SST, RF, and ARD levels observed on Brazilian fishing grounds have proven to be reliable predictors of total landings per year. In the sea south of Cuba, the relationship between LL and environmental parameters (Chl-a, SST) was assessed. However, the complex model cannot fully account for the variability in the data since a considerable amount of variation in LL is associated with fluctuations in juvenile abundance and uncontrolled fishing effort.
The predictive models derived from these interactions need to be confirmed based on longer data series, and more in-depth studies are necessary. Nevertheless, it is safe to say that carefully designed biological studies, together with an expanded sampling program focusing on puerulus settlement and juveniles, will lead to a better understanding of the observed variations in recruitment.
Stock assessment models should incorporate environmental factors and puerulus settlement indices in order to regulate fishing effort and catch before the animals are recruited to the fishery. A more detailed understanding of lobster population dynamics will make predictions more accurate, protecting stocks in the long run by making fisheries more effective and sustainable in a changing environment.
Author Contributions
R.C. conceptualized the research, designed the sampling system, analyzed the biological material (Cuba–Brazil), prepared the original figures, and wrote the manuscript. A.G.F. conceptualized the time series extractions from the MODIS satellite (Chlorophyll-a, SST) and Copernicus/ESA platform (wind speed) and reviewed the manuscript. J.V.M.S. collected the data and analyzed the biological materials of the Brazilian coast. M.T.T. assisted in the investigation and reviewed the manuscript and literature. J.C.G. and J.L.S.D.S. assisted in the investigation and managed the funds. C.G.B. and C.A.B. assisted in the investigation, extraction, and analysis of salinity. J.O.A. performed series extractions of rainfall and river discharge. R.D.V. and F.R.d.L. completed software manipulations to extract data from the satellite. I.H.A.C. collected data and analyzed the biological material from the Great Amazon Reef System. All authors have read and agreed to the published version of the manuscript.
Funding
This study was supported by Fundação Cearense de Apoio ao Desenvolvimento Científico e Tecnológico (FUNCAP), under Project Avaliação Pesqueira e Comercialização da Lagosta Inteira Viva.
Institutional Review Board Statement
Not applicable.
Informed Consent Statement
Not applicable.
Data Availability Statement
The original contributions presented in this study are included in this article. Further inquiries can be directed to the corresponding author.
Acknowledgments
The authors would like to thank FUNCAP (Fundação Cearense de Apoio ao Desenvolvimento Científico e Tecnológico, Ceará, Brazil), Secretaria de Ciência, Tecnologia e Educação Superior (SECITECE), Earth Observation Labomar Laboratory (EOLLA), SPA (Secretaria de Pesca e Aquicultura, Brazil), IFCE (Instituto Federal de Educação, Ciências e Tecnologia do Ceará, Campus Acaraú), ISARH (Instituto Socioambiental e dos Recursos Hídricos), and UFRA (Universidade Federal Rural da Amazônia). Gratitude is extended to the exporters and producers affiliated with SINDFRIO (Sindicato das Indústrias de Frio e Pesca do Ceará, Brazil) and the FIEC System—Federation of Industries of the State of Ceará. We also extend our special thanks to anonymous referees and the academic editor.
Conflicts of Interest
The authors declare no conflicts of interest.
Appendix A. Sampling Stations and Brazilian Coastal States
Map of the continental shelf of Brazil showing the twelve stations in the coastal region (the CR) (7, 9, 11, 13, 15, 17) and the oceanic region (the OR) (8, 10, 12, 14, 16, 18). Latitudes and longitudes: station 7 (3.30; −50.59); station 8 (5.68; −46.64); station 9 (−1.22; −44.64); station 10 (1.97; −40.59); station 11 (−3.5; −38.74); station 12 (−0.64; −35.00); station 13 (−5.02; −35.43); station 14 (−2.9; −31.64); station 15 (−9.74; −35.57); station 16 (−9.70; −31.04); station 17 (18.70; −38.77); and station 18 (−18.30; −33.91).
Brazilian coastal states: Amapá (AP), Pará (PA), Maranhão (MA), Piauí (PI), Ceará (CE), Rio Grande do Norte (RN), Paraíba (PB), Pernambuco (PE), Alagoas (AL), Sergipe (SE), Bahia (BA), and Espírito Santo (ES). The Great Amazon Reef System (GARS) is a long mesophotic reef ecosystem, home to large spiny lobster stocks at 50–100 m.
Appendix B. Sampling Stations South of Cuba
Map of the continental shelf south of Cuba showing the six offshore stations (1, 2, 3, 4, 5, 6). Latitudes and longitudes: station 1 (21.52; −80.65); station 2 (21.41; −82.32); station 3 (21.18; −84.86); station 4 (20.00; −84.89); station 5 (19.27; −82.42); and station 6 (20.17; −79.9).
References
- Cruz, R.; Santana, J.V.M.; Barreto, C.G.; Borda, C.A.; Torres, M.T.; Gaeta, J.C.; Da Silva, J.L.S.; Saraiva, S.Z.R.; Salazar, I.O.; Cintra, I.H.A. Towards the rebuilding of spiny lobster stocks in Brazil: A review. Crustaceana 2020, 93, 957–983. [Google Scholar] [CrossRef]
- Puga, P.; Alzugaray-Martínez, R.; Piñeiro, R.; De León, M.E.; Cobas, S.; Morales, O. An overview of Cuban spiny lobster fishery status. Rev. Cub. Investig. Pesq. Tech. Rep. 2018, 1, 1–15. [Google Scholar]
- Cruz, R.; Teixeira, C.E.P.; Menezes, M.O.B.; Santana, J.V.M.; Neto, T.N.; Gaeta, J.C.; Freitas, P.P.; Silva, K.C.A.; Cintra, I.H.A. Large-scale oceanic circulation and larval recruitment of the spiny lobster Panulirus argus (Latreille, 1804). Crustaceana 2015, 88, 298–323. [Google Scholar] [CrossRef]
- Fonteles-Filho, A.A. Influência do recrutamento e da pluviosidade sobre a abundância das lagostas Panulirus argus (Latreille) e Panulirus laevicauda (Latreille, 1804) (Crustacea: Palinuridae), no Nordeste do Brasil. Arq. Ciên. Mar. Fortaleza 1986, 25, 13–31. [Google Scholar]
- Cruz, R.; Díaz, E.; Báez, M.; Adriano, R. Variability in recruitment of multiple life stages of the Caribbean spiny lobster, Panulirus argus, in the Gulf of Batabanó, Cuba. Mar. Freshw. Res. 2001, 52, 1263–1270. [Google Scholar] [CrossRef]
- Caputi, N.; Brown, R.S. The effect of environment on puerulus settlement of the western rock lobster (Panulirus cygnus) in Western Australia. Fish. Oceanogr. 1993, 2, 1–10. [Google Scholar] [CrossRef]
- Caputi, N.; Chubb, C.F.; Pearce, A. Environmental effects on recruitment of the western rock lobster, Panulirus cygnus. Mar. Freshw. Res. 2001, 52, 1167–1175. [Google Scholar] [CrossRef]
- Zar, J.H. Biostatistical Analysis, 5th ed.; Pearson: London, UK, 2018; p. 960. ISBN 978-0-13-100846-5. [Google Scholar]
- Richardson, P.L. Caribbean Current and eddies as observed by surface drifters. Deep-Sea Res. II Top. Stud. Oceanogr. 2005, 52, 429–463. [Google Scholar] [CrossRef]
- Moura, R.L.; Amado-Filho, G.M.; Moraes, F.C.; Brasileiro, P.S.; Salomon, P.S.; Mahiques, M.M.; Bastos, A.C.; Almeida, M.G.; Silva, J.M.; Araujo, B.F.; et al. An extensive reef system at the Amazon River mouth. Sci. Adv. 2016, 2, 11. [Google Scholar] [CrossRef]
- Claro, R.; Reshetnikov, Y.S.; Alcolado, P.M. Physical attributes of coastal Cuba. In Ecology of the Marine Fishes of Cuba; Claro, R., Lindenman, K.C., Parenti, L.R., Eds.; Smithsonian Institution Press: Washington, DC, USA, 2001; pp. 1–20. [Google Scholar]
- Phillips, B.F. A semi-quantitative collector of the puerulus larvae of the western rock lobster Panulirus longipes cygnus George (Decapoda: Palinuridea). Crustaceana 1972, 22, 147–154. [Google Scholar] [CrossRef]
- Cruz, R. Manual de Métodos de Muestreo para la Evaluación de las Poblaciones de Langosta Espinosa; FAO Documento Técnico de Pesca; FAO: Rome, Italy, 2002; pp. 1–43. [Google Scholar]
- Ivo, C.T.C.; Pereira, J.A. Sinopse das principais observações sobre a lagosta Panulirus argus (Latreille) e Panulirus laevicauda (Latreille), capturadas em águas costeiras do Brasil, entre os estados do Amapá e Espírito Santo. Bol. Téc. Cient. 1996, 4, 7–94. [Google Scholar]
- Guerra, L.E. Influence of the ENSO event on the behavior of rainfall associated with tropical waves during the period 2012–2020 in Cuba. Environ. Sci. Proc. 2023, 1–5. [Google Scholar]
- Piecuch, C.G.; Huybers, P.; Hay, C.C.; Kemp, A.C.; Little, C.M.; Mitrovica, J.X.; Ponte, R.M.; Tingley, M.P. Origin of spatial variation in US East Coast sea-level trends during 1900–2017. Nature 2018, 564, 400–404. [Google Scholar] [CrossRef] [PubMed]
- Salas, E.B. Sea Level Rise Projections in Brazil 2020–2099, by Scenario. Statistical. 2024. Available online: https://www.statista.com/statistics/1453774/sea-level-rise-projection-in-brazil-by-scenario/ (accessed on 1 February 2025).
- Hernández, M.; Martínez, C.A.; Marzo, O. Consequences of sea level variability and sea level rise for Cuban territory. Proc. IAHS 2015, 365, 22–27. [Google Scholar] [CrossRef]
- Pearce, A.F.; Feng, M. Observations of warming on the Western Australian continental shelf. Mar. Freshw. Res. 2007, 58, 914–920. [Google Scholar] [CrossRef]
- Caputi, N.; De Lestang, S.; Feng, M.; Pearce, A. Seasonal variation in the long-term warming trend in water temperature off the Western Australian coast. Mar. Freshw. Res. 2009, 60, 129–139. [Google Scholar] [CrossRef]
- Mitrani, I.A.; Hernández, I.; Evelio, E.; Mayo, A.H.; Rodríguez, O.O.D.; Llamo, A.V.; Zas, J.A.R. The Coastal Flood Regime around Cuba, the Thermohaline Structure Influence and Its Climate Tendencies. Environ. Ecol. Res. 2016, 4, 37–49. [Google Scholar] [CrossRef]
- Torres, R.R.; Latandret, S.; Salon, J.; Dagua, C. Water masses in the Caribbean Sea and sub-annual variability in the Guajira upwelling region. Ocean. Dyn. 2023, 73, 39–57. [Google Scholar] [CrossRef]
- Dengler, M.; Schott, F.A.; Eden, C.; Brandt, P.; Fischer, J.; Zantopp, R.J. Breakup of the Atlantic deep western boundary current into eddies at 88°S. Nature 2004, 432, 1018–1020. [Google Scholar] [CrossRef]
- Lumpkin, R.; Garzoli, S.L. Near surface circulation in the tropical Atlantic Ocean. Deep Sea Research Part I: Oceanogr. Res. Pap. 2005, 52, 495–518. [Google Scholar]
- Dennis, A.; Mayer, D.A.; Molinari, R.L.; Festa, J.F. The mean and annual cycle of upper layer temperature fields in relation to Sverdrup dynamics within the gyres of the Atlantic Ocean. J. Geophys. Res. 1998, 103, 18.545–18.566. [Google Scholar]
- Da Silveira, I.C.A.; De Miranda, L.B.; Brown, W.S. On the origins of the North Brazil Current. J. Geophys. Res. 1994, 99, 22501–22512. [Google Scholar] [CrossRef]
- Galvão, P.F.; Teixeira, C.E.P. Variabilidade espaço-temporal da concentração de Clorofila-a no Oceano Atlântico Equatorial baseados nos dados do sensor MODIS-AQUA. In Proceedings of the Anais XVII Simpósio Brasileiro de Sensoriamento Remoto-SBSR, João Pessoa, Brazil, 25–29 April 2015; INPE: Sao Jose dos Campos, Brazil, 2015; pp. 5272–5279. Available online: https://repositorio.ufc.br/handle/riufc/63800 (accessed on 1 February 2025).
- Loisel, J.; MacDonald, G.M.; Thomson, M.J. Little Ice Age climatic erraticism as an analogue for future enhanced hydroclimatic variability across the American Southwest. PLoS ONE 2017, 12, 16. [Google Scholar] [CrossRef] [PubMed]
- Yamada, K.; Ishizaka, J.; Yoo, S.S.; Kim, H.H.; Chiba, S. Seasonal and interannual variability of sea surface chlorophyll a concentration in the Japan/East Sea (JES). Prog. Oceanogr. 2004, 61, 193–211. [Google Scholar] [CrossRef]
- Yu, Y.; Xing, X.; Liub, H.; Yuana, Y.; Wang, Y.; Chai, F. The variability of chlorophyll-a and its relationship with dynamic factors in the basin of the South China Sea. J. Mar. Syst. 2019, 200, 103–230. [Google Scholar] [CrossRef]
- Martinez, E.; Antoine, D.; D’Ortenzio, F.; Gentili, B. Climate-driven basin-scale decadal oscillations of oceanic phytoplankton. Science 2009, 326, 1253–1256. [Google Scholar] [CrossRef]
- Waliser, D.E.; Murtugudde, R.; Strutton, P.; Li, J.-L. Subseasonal organization of ocean chlorophyll: Prospects for prediction based on the Madden-Julian Oscillation. Geophys. Res. Lett. 2005, 32, 4. [Google Scholar] [CrossRef]
- Dunstan, P.K.; Foster, S.D.; King, E.; Risbey, J.; O’Kane, T.J.; Monselesan, D.; Hobday, A.J.; Hartog, J.R.; Thompson, P.A. Global patterns of change and variation in sea surface temperature and chlorophyll a. Sci. Rep. 2018, 8, 9. [Google Scholar] [CrossRef]
- Trombetta, T.; Vidussi, F.; Mas, S.; Parin, D.; Simier, M.; Mostajir, B. Water temperature drives phytoplankton blooms in coastal waters. PLoS ONE 2019, 14, 28. [Google Scholar] [CrossRef]
- Sathicq, M.B.; Bauer, D.E.; Gómez, N. Influence of El Niño Southern Oscillation phenomenon on coastal phytoplankton in a mixohaline ecosystem on the southeastern of South America: Río de la Plata estuary. Ma. Pollut. Bull. 2015, 98, 26–33. [Google Scholar] [CrossRef]
- Cruz, R.; Silva, K.C.A.; Neves, S.D.S.; Cintra, I.H.A. Impact of lobster size on catches and prediction of commercial spiny lobster landings in Brazil. Crustaceana 2013, 86, 1274–1290. [Google Scholar] [CrossRef]
- de Lestang, S.; Caputi, N.; Feng, M.; Denham, A.; Penn, J.; Slawinski, D.; Pearce, A.; How, H. What caused seven consecutive years of low puerulus settlement in the western rock lobster fishery of Western Australia? ICES J. Mar. Sci. 2015, 72, i49–i58. [Google Scholar] [CrossRef]
- Greer, A.T.; Briseño-Avena, C.; Deary, A.L.; Cowen, R.K.; Hernández, F.J.; Graham, W.M. Associations between lobster phyllosoma and gelatinous zooplankton in relation to oceanographic properties in the northern Gulf of Mexico. Fish. Oceanogr. 2017, 26, 693–704. [Google Scholar] [CrossRef]
- Sugumar, R.; Mhatre, V.D.; Khandagale, P.A.; Rane, U.H.; Ranjith, L.; Saravanan, R. Jellyfish bloom: Abundance, distribution and impact analysis in the commercial dol net fishing ground of Northwest coast of India, Arabian Sea. Int. J. Adv. Biochem. Res. 2024, 8, 384–393. [Google Scholar] [CrossRef]
- Cruz, R.; Borda, C.A.; Santana, J.V.M.; Barreto, G.C.; Paiva, B.P.; Gaeta, J.C.; Torres, M.T.; Silva, J.L.S.; Cintra, I.H.A. Life cycle and connectivity of the spiny lobster, Panulirus spp.: Case studies from Brazil and the Wider Caribbean (decapoda, achelata). Crustaceana 2021, 94, 603–645. [Google Scholar] [CrossRef]
- Caputi, N.; Feng, M.; De Lestang, S.; Denham, A.; Penn, J.; Slawinski, D.; Pearce, A.; Weller, E.; How, J. Identifying Factors Affecting the Low Western Rock Lobster Puerulus Settlement in Recent Years Final FRDC Report–Project 2009/18; Fisheries Research Report No. 255; Department of Fisheries: Perth, WA, Australia, 2014; 144p. [Google Scholar]
- Lewis, J.B. The phyllosoma larvae of the spiny lobster Panulirus argus. Bull. Mar. Sci. 1951, 1, 78–103. [Google Scholar]
- Alfonso, I.; Frías, M.P.; Baisre, J.A.; Campos, A. Distribución y abundancia de larvas de la langosta Panulirus argus en aguas alrededor de Cuba. Rev. Investig. Mar. 1991, 12, 5–19. [Google Scholar]
- Farmer, M.W.; Ward, J.A.; Luckhurst, B.E. Development of spiny lobster (Panulirus argus) phyllosoma larvae in the plankton near Bermuda. Proc. Gulf Caribb. Fish. Inst. 1987, 39, 289–301. [Google Scholar]
- Jeffs, A. Revealing the natural diet of the phyllosoma larvae of spiny lobster. Bull. Fish. Res. Agen. 2007, 20, 9–13. [Google Scholar]
- Paris, C.B.; Cowen, R.K. Direct evidence of a biophysical retention mechanism for coral reef fish larvae. Limnol. Oceanogr. 2004, 49, 1964–1979. [Google Scholar] [CrossRef]
- Paris, C.B.; Chérubin, L.M.; Cowen, R.K. Surfing, diving or spinning: Effects on population connectivity. Mar. Ecol. Prog. Ser. 2007, 347, 285–300. [Google Scholar] [CrossRef]
- Woodson, C.B.; Mcmanus, M.A. Foraging behavior can influence dispersal of marine organisms. Limnol. Oceanogr. 2007, 52, 2701–2709. [Google Scholar] [CrossRef]
- NOAA National Centers for Environmental Information, Monthly Global Climate Report for Annual 2024. Available online: https://www.ncei.noaa.gov/access/metadata/landing-page/bin/iso?id=gov.noaa.ncdc:C00672 (accessed on 17 April 2025).
- Field, J.M.M.; Butler, M.J. The influence of temperature, salinity, and postlarval transport on the distribution of juvenile spiny lobster, Panulirus argus (Latreille, 1804), in Florida. Crustaceana 1994, 67, 26–45. [Google Scholar] [CrossRef]
- Quackenbush, L.S. Lobster Reproduction: A Review. Crustaceana 1994, 67, 82–94. [Google Scholar] [CrossRef]
- Herrnkind, W.F. Movement patterns in palinurid lobsters. In Biology and Management of Lobsters; Vol I Physiology and Behavior; Cobb, J.S., Phillips, B.F., Eds.; Academic Press: New York, NY, USA, 1980; pp. 349–407. [Google Scholar]
- Shields, J. Climate change enhances disease processes in crustaceans: Case studies in lobsters, crabs, and shrimps. J. Crustac. Biol. 2019, 39, 673–683. [Google Scholar] [CrossRef]
- Goldstein, J.S.; Matsuda, H.; Takenouchi, T. A description of the complete development of larval Caribbean spiny lobster, Panulirus argus (Latreille, 1804) in culture. J. Crustac. Biol. 2008, 28, 306–327. [Google Scholar] [CrossRef]
- Booth, J.D.; Phillips, B.F. Early life history of spiny lobster. Crustaceana 1994, 66, 271–294. [Google Scholar] [CrossRef]
- Kanciruk, P.; Herrnkind, W.F. Autumnal reproduction in the spiny lobster Panulirus argus, at Bimini, Bahamas. Bull. Mar. Sci. 1976, 26, 417–432. [Google Scholar]
- Boles, L.C.; Lohmann, K.J. True navigation and magnetic maps in spiny lobsters. Nature 2003, 421, 60–63. [Google Scholar] [CrossRef]
- Fonteles-Filho, A.A.; Ivo, T.C. Migratory behaviour of the spiny lobster Panulirus argus (Latreille), of Cearã State, Brazil. Arq. Ciên. Mar. 1980, 20, 25–32. [Google Scholar]
- Cruz, R.; Bertelsen, R. The spiny lobster (Panulirus argus) in the wider Caribbean: A review of life cycle dynamics and implications for responsible fisheries management. Proc. Gulf Caribb. Fish. Inst. 2009, 61, 433–446. [Google Scholar]
- Phillips, B.F. Prediction of commercial catches of the western rock lobster Panulirus cygnus. Can. J. Fish. Aquat. Sci. 1986, 43, 2126–2130. [Google Scholar] [CrossRef]
- Ferreira, A.G.; Mello, N.G.d.S. Principais sistemas atmosféricos atuantes sobre a região nordeste do brasil e a influência dos oceanos pacífico e atlântico no clima da região. Rev. Bras. Climatol. 2005, 1, 15–28. [Google Scholar] [CrossRef]
Disclaimer/Publisher’s Note: The statements, opinions and data contained in all publications are solely those of the individual author(s) and contributor(s) and not of MDPI and/or the editor(s). MDPI and/or the editor(s) disclaim responsibility for any injury to people or property resulting from any ideas, methods, instructions or products referred to in the content. |
© 2025 by the authors. Licensee MDPI, Basel, Switzerland. This article is an open access article distributed under the terms and conditions of the Creative Commons Attribution (CC BY) license (https://creativecommons.org/licenses/by/4.0/).