Article

Dual Influence of Rainfall and Water Temperature on Phytoplankton Diversity and Nutrient Dynamics in a Mountainous Riverine Reservoir

1
National and Local Joint Engineering Research Center of Ecological Treatment Technology for Urban Water Pollution, Zhejiang Provincial Key Laboratory for Water Environment and Marine Biological Resources Protection, College of Life and Environmental Sciences, Wenzhou University, Wenzhou 325035, China
2
Wenzhou Wencheng Ecological Environmental Monitoring Station, Wenzhou 325300, China
3
Wenzhou Shanxi Hydro-Junction Management Center, Wenzhou 325035, China
*
Authors to whom correspondence should be addressed.
Diversity 2025, 17(8), 573; https://doi.org/10.3390/d17080573
Submission received: 27 June 2025 / Revised: 11 August 2025 / Accepted: 12 August 2025 / Published: 15 August 2025
(This article belongs to the Special Issue 2025 Feature Papers by Diversity’s Editorial Board Members)

Abstract

The combined effects of anthropogenic activities and climate change, particularly the increasing frequency of extreme rainfall events, continue to pose significant threats to the security of reservoir ecosystems and water quality. Effective prediction and management of aquatic ecosystems require a comprehensive understanding of how environmental factors influence the dynamics of phytoplankton communities. However, the response patterns of phytoplankton community diversity, niche breadth, and cell density to rainfall disturbances in complex mountainous riverine reservoirs remain poorly understood. In this study, we systematically investigated the phytoplankton community structure and its environmental drivers in Zhaoshandu Reservoir (China) via field surveys, morphological identification of samples, and multivariate statistical analyses. Water temperature (WT), rainfall, and phytoplankton cell density in the study area ranged from 11.4 °C to 35.6 °C, from 0 to 72.5 mm, and from 3.33 × 10³ to 7.95 × 10⁷ cells/L, respectively. Total phosphorus and total nitrogen concentrations ranged from 0.002 to 0.633 mg/L and from 0.201 to 5.06 mg/L, respectively. Canonical correspondence analysis found that rainfall and WT were the pivotal drivers of phytoplankton density and biomass and were significantly correlated with phytoplankton diversity. Importantly, structural equation modeling revealed that the direct effects of both rainfall and WT on phytoplankton diversity and niche width, as well as the indirect effects of rainfall on ammonium nitrogen concentration, significantly modulated algal density and biomass in Zhaoshandu Reservoir. Our study highlights the role of rainfall as a potential major regulator of phytoplankton communities in this riverine reservoir.

1. Introduction

Phytoplankton (i.e., cyanobacteria) serve as primary producers in aquatic ecosystems and play a crucial role in carbon fixation through photosynthesis, with an estimated amount of carbon fixed annually reaching approximately 4.5 billion tons [1]. Such carbon fixation capacity underpins the energy and organic matter dynamics that support the entire aquatic ecosystems, allowing the development of a complex and intricate food web within them [2,3]. Additionally, phytoplankton are integral to nutrient cycling in these environments, especially in the carbon, nitrogen, and phosphorus cycles, which are essential for maintaining a stable ecosystem structure and function [4].
Phytoplankton are highly sensitive to environmental fluctuations, especially those in nutrient levels, and have been recognized as key indicators for environmental monitoring and risk assessment in aquatic systems [5]. Phytoplankton diversity, density, and biomass can directly or indirectly reflect the nutrient status of water bodies and fluctuations in it, which makes them valuable tools for ecological assessments [6].
The reservoir ecosystem is shaped by the cumulative effects of various factors, including nutrient levels, climate, hydrology, and geographical conditions [5,7,8,9]. Consequently, phytoplankton communities in different reservoirs exhibit different responses to environmental factors. In recent years, due to the increasing frequency of extreme weather events and higher temperatures associated with global warming, water eutrophication and algal blooms in lakes and reservoirs have become prominent research topics in the field of aquatic ecology. For instance, Kleinteich et al. revealed that temperature increase of 0.9–1.8 °C combined with a reduction in average river flow by 69–76% would result in the over-proliferation of phytoplankton in riverine ecosystems [7]. Kim et al. also reported that temperature fluctuations, especially in daily minimum and maximum temperatures, are the main drivers of cyanobacterial blooms, determining their onset and termination [8]. Moreover, a study of Xin’anjiang Reservoir by Shi et al. found that rainfall temporarily inhibited phytoplankton growth in the river areas by enhancing water flow and turbidity, but finally promoted it in the lake areas in the long term by increasing nutrients, particularly phosphorus [9].
River ecosystems are integral components of the hydrological cycle [10]. Unlike lakes and reservoirs, rivers typically have shallower depths and smaller cross-sectional areas, with larger water–land interfaces, which makes them more open as ecosystems [11,12,13]. Differences in meteorological, hydrological, and geomorphological conditions across a river basin determine the formation of diverse habitats. Rainfall intensity can affect numerous factors related to river hydrology (e.g., flow velocity and discharge rate), determining the establishment of distinct habitat gradients, including fast-flowing and stagnant zones. These hydrological dynamics play a crucial role in shaping the distribution patterns of riverine biotic communities [14,15,16,17,18]. However, there is a lack of comprehensive studies on the responses of phytoplankton communities to hydrological pulse effects driven by rainfall and temperature fluctuations in complex mountainous riverine reservoirs in subtropical regions [19]. Mountainous reservoirs are particularly vulnerable to heavy rainfall events, which also have a significant impact on their phytoplankton communities, but the mechanisms underlying these dynamics remain unclear [20]. Moreover, previous studies have shown that rainfall indirectly alters phytoplankton community structure by modifying the nutrient load of reservoirs, with phytoplankton responses varying under different rainfall patterns [21].
In the present study, we hypothesized that rainfall has a direct and significant impact on phytoplankton community structure and interacts with other environmental factors to influence phytoplankton density and biomass. To test these hypotheses, we selected Zhaoshandu Reservoir as the study area, which is a typical riverine reservoir located in Wenzhou (Zhejiang, China), a region characterized by a complex mosaic of mountains, villages, farmlands, and water bodies. This ecologically susceptible area is ideal for studying the responses of phytoplankton to rainfall [22]. We explored the effects of cumulative rainfall 7 days prior to sampling on the phytoplankton community, and attempted to clarify the underlying mechanisms by analyzing community composition and fluctuations in phytoplankton diversity, ecological niche, and density.

2. Materials and Methods

2.1. Study Area and Sampling

The Zhaoshandu Reservoir, located in Wenzhou City, Zhejiang Province, China, serves as the region’s largest drinking water source (Figure 1). The annual average temperature of the study area ranges from 14 °C to 18.5 °C, with July being the hottest month, having an average temperature of 28.2 °C. The annual average precipitation is approximately 1884.7 mm, and the maximum monthly rainfall can reach up to 422.2 mm. The reservoir maintains a normal water level of 22 m, with a total storage capacity of 34.1 million m3 and a regulated supply capacity of 4.3 million m3. It provides up to 1.34 billion m3 of water annually, including 770 million m3 designated for domestic use [22]. The reservoir covers a catchment area of approximately 15 km2, which is characterized by mountainous terrain and scattered villages. In addition to its role in water supply, the reservoir supports irrigation, fisheries, and tourism, with non-point source pollution from agriculture, livestock, and domestic wastewater being the primary contaminants. The Zhaoshandu Reservoir receives water not only from the upstream from the Shanxi Reservoir but also from several tributaries, including the Yuquanxi, Sixi, Lijingxi, Guixi, Jiuxi, and Pinghexi streams, with Sixi and Yuquanxi being the main contributors. This study was conducted from July 2022 to June 2023, with monthly sampling conducted at 17 sites across the main stream, tributaries, and reservoir zones. Stratified sampling was performed at key sites, Z1 (at 3 m and 8 m depths) and Z3 (at 3 m depth), yielding a total of 20 samples. The detailed sampling locations are listed in Table S1.

2.2. Data Collection

Daily precipitation data (July 2022–June 2023) were obtained from the Shanxi Reservoir Management Center, Wenzhou Water Resources Bureau. Cumulative rainfall over the seven days preceding each sampling event was used to assess rainfall-induced disturbances. The geographic base maps were generated using Tuxin Earth software, version 4.0 (accessed on 12 May 2023) and processed in ArcGIS (version 10.8).

2.3. Sample Analysis

Water samples were collected at a depth of 0.5 m. In situ measurements of water temperature (WT), dissolved oxygen (DO), pH, turbidity (Turb), electrical conductivity (EC), and total dissolved solids (TDS) were conducted using a portable multiparameter water quality analyzer (HACH HD 40d, Loveland, CO, USA), a portable turbidimeter, and a conductivity meter, respectively. For laboratory analysis, total phosphorus (TP) was determined using the ammonium molybdate spectrophotometric method, while total nitrogen (TN) was measured via alkaline potassium persulfate digestion followed by UV spectrophotometry. Nitrate (NO3-N) and ammonia (NH4-N) concentrations were quantified using UV spectrophotometry and Nessler’s reagent spectrophotometry, respectively. Chemical oxygen demand (COD) was determined using the acidic potassium permanganate method. Chlorophyll a (Chl-a) extraction and quantification were carried out by filtering 250 mL of water through a glass fiber membrane. The filtered material was transferred to a centrifuge tube, mixed with 90% ethanol, and the final volume was adjusted to 10 mL. After 24 h of dark incubation at 4 °C, the sample was centrifuged at 4000 rpm for 10 min. The supernatant was filtered through a syringe filter, and absorbance was measured at wavelengths of 750 nm, 665 nm, 645 nm, and 630 nm. Chl-a concentration was calculated from the measured absorbance values. Phytoplankton sampling and analysis involved collecting 1 L of surface water in brown PTFE bottles, followed by immediate fixation using 15 mL of Lugol’s solution. After 48 h of sedimentation in the laboratory, the supernatant was carefully removed by siphoning, and the remaining sediment (30–40 mL) was transferred to a 50 mL volumetric flask. A 0.1 mL aliquot of the homogenized concentrate was placed in a 0.1 mL counting chamber for microscopic enumeration at 10× and 40× magnifications. For samples with low phytoplankton density, full-field counting was performed, while highly concentrated samples were diluted before counting. To ensure accurate biomass estimation, the dimensions of at least 50 cells or individuals per species were recorded. Phytoplankton were identified to the genus or species level.

2.4. Statistical Analysis

In this study, water quality data, comprising physicochemical nutrients and results from phytoplankton microscopic examination, were initially compiled and processed using Excel 2019. The species composition of phytoplankton across different seasons was analyzed and visualized with Origin 2021. Phytoplankton α-diversity was assessed using the “picante” and “vegan” packages in R v4.2.3, incorporating the Shannon–Wiener, Simpson, richness, and Pielou’s evenness indices. Non-metric multidimensional scaling (NMDS), based on the Bray–Curtis distance of the phytoplankton community, was conducted with PRIMER to reveal community differences between seasons (e.g., summer and autumn). The “spaa” package in R v4.2.3 was employed to analyze the niche width and overlap of phytoplankton [23]. The same software was utilized to perform similarity analysis (ANOSIM) to examine temporal variations in the phytoplankton community. ANOVA was applied to analyze α- and β-diversity, as well as niche width, across different seasons. Tukey’s test was applied to compare differences in water quality parameters, α- and β-diversity, and niche width between seasons, with a significance threshold set at p < 0.05. Spearman’s correlation analysis was conducted on environmental factors using the “corrplot” function in R. Additionally, in R v4.2.3, the “ggplot2” and “ggpubr” packages were used to model the relationships between water temperature, rainfall, and phytoplankton α- and β-diversity, as well as niche width and overlap, to explore their interrelationships. Based on the results of detrended correspondence analysis (DCA), redundancy analysis (RDA) was conducted using the “vegan” package in R v4.2.3 to assess the relationship between phytoplankton communities and environmental factors. Additionally, variance inflation factors were calculated to confirm the absence of collinearity among these factors. Structural equation modeling (SEM) was performed using the “lavaan”, “semPlot”, “tidyverse”, and “vegan” packages in R v4.2.3 to determine the direct causal relationships between water temperature, rainfall, phytoplankton α-, and β-diversity, niche width and overlap, as well as the indirect effects of rainfall on phytoplankton diversity, density, biomass, and niche width through intermediary factors [24,25]. Resource use efficiency (RUE) in ecology refers to the ability of phytoplankton to produce biomass under conditions where specific resources (such as nitrogen, phosphorus, etc.) are available. The calculation method follows previous studies [26,27].

3. Results

3.1. Physicochemical Characteristics of Zhaoshandu Reservoir

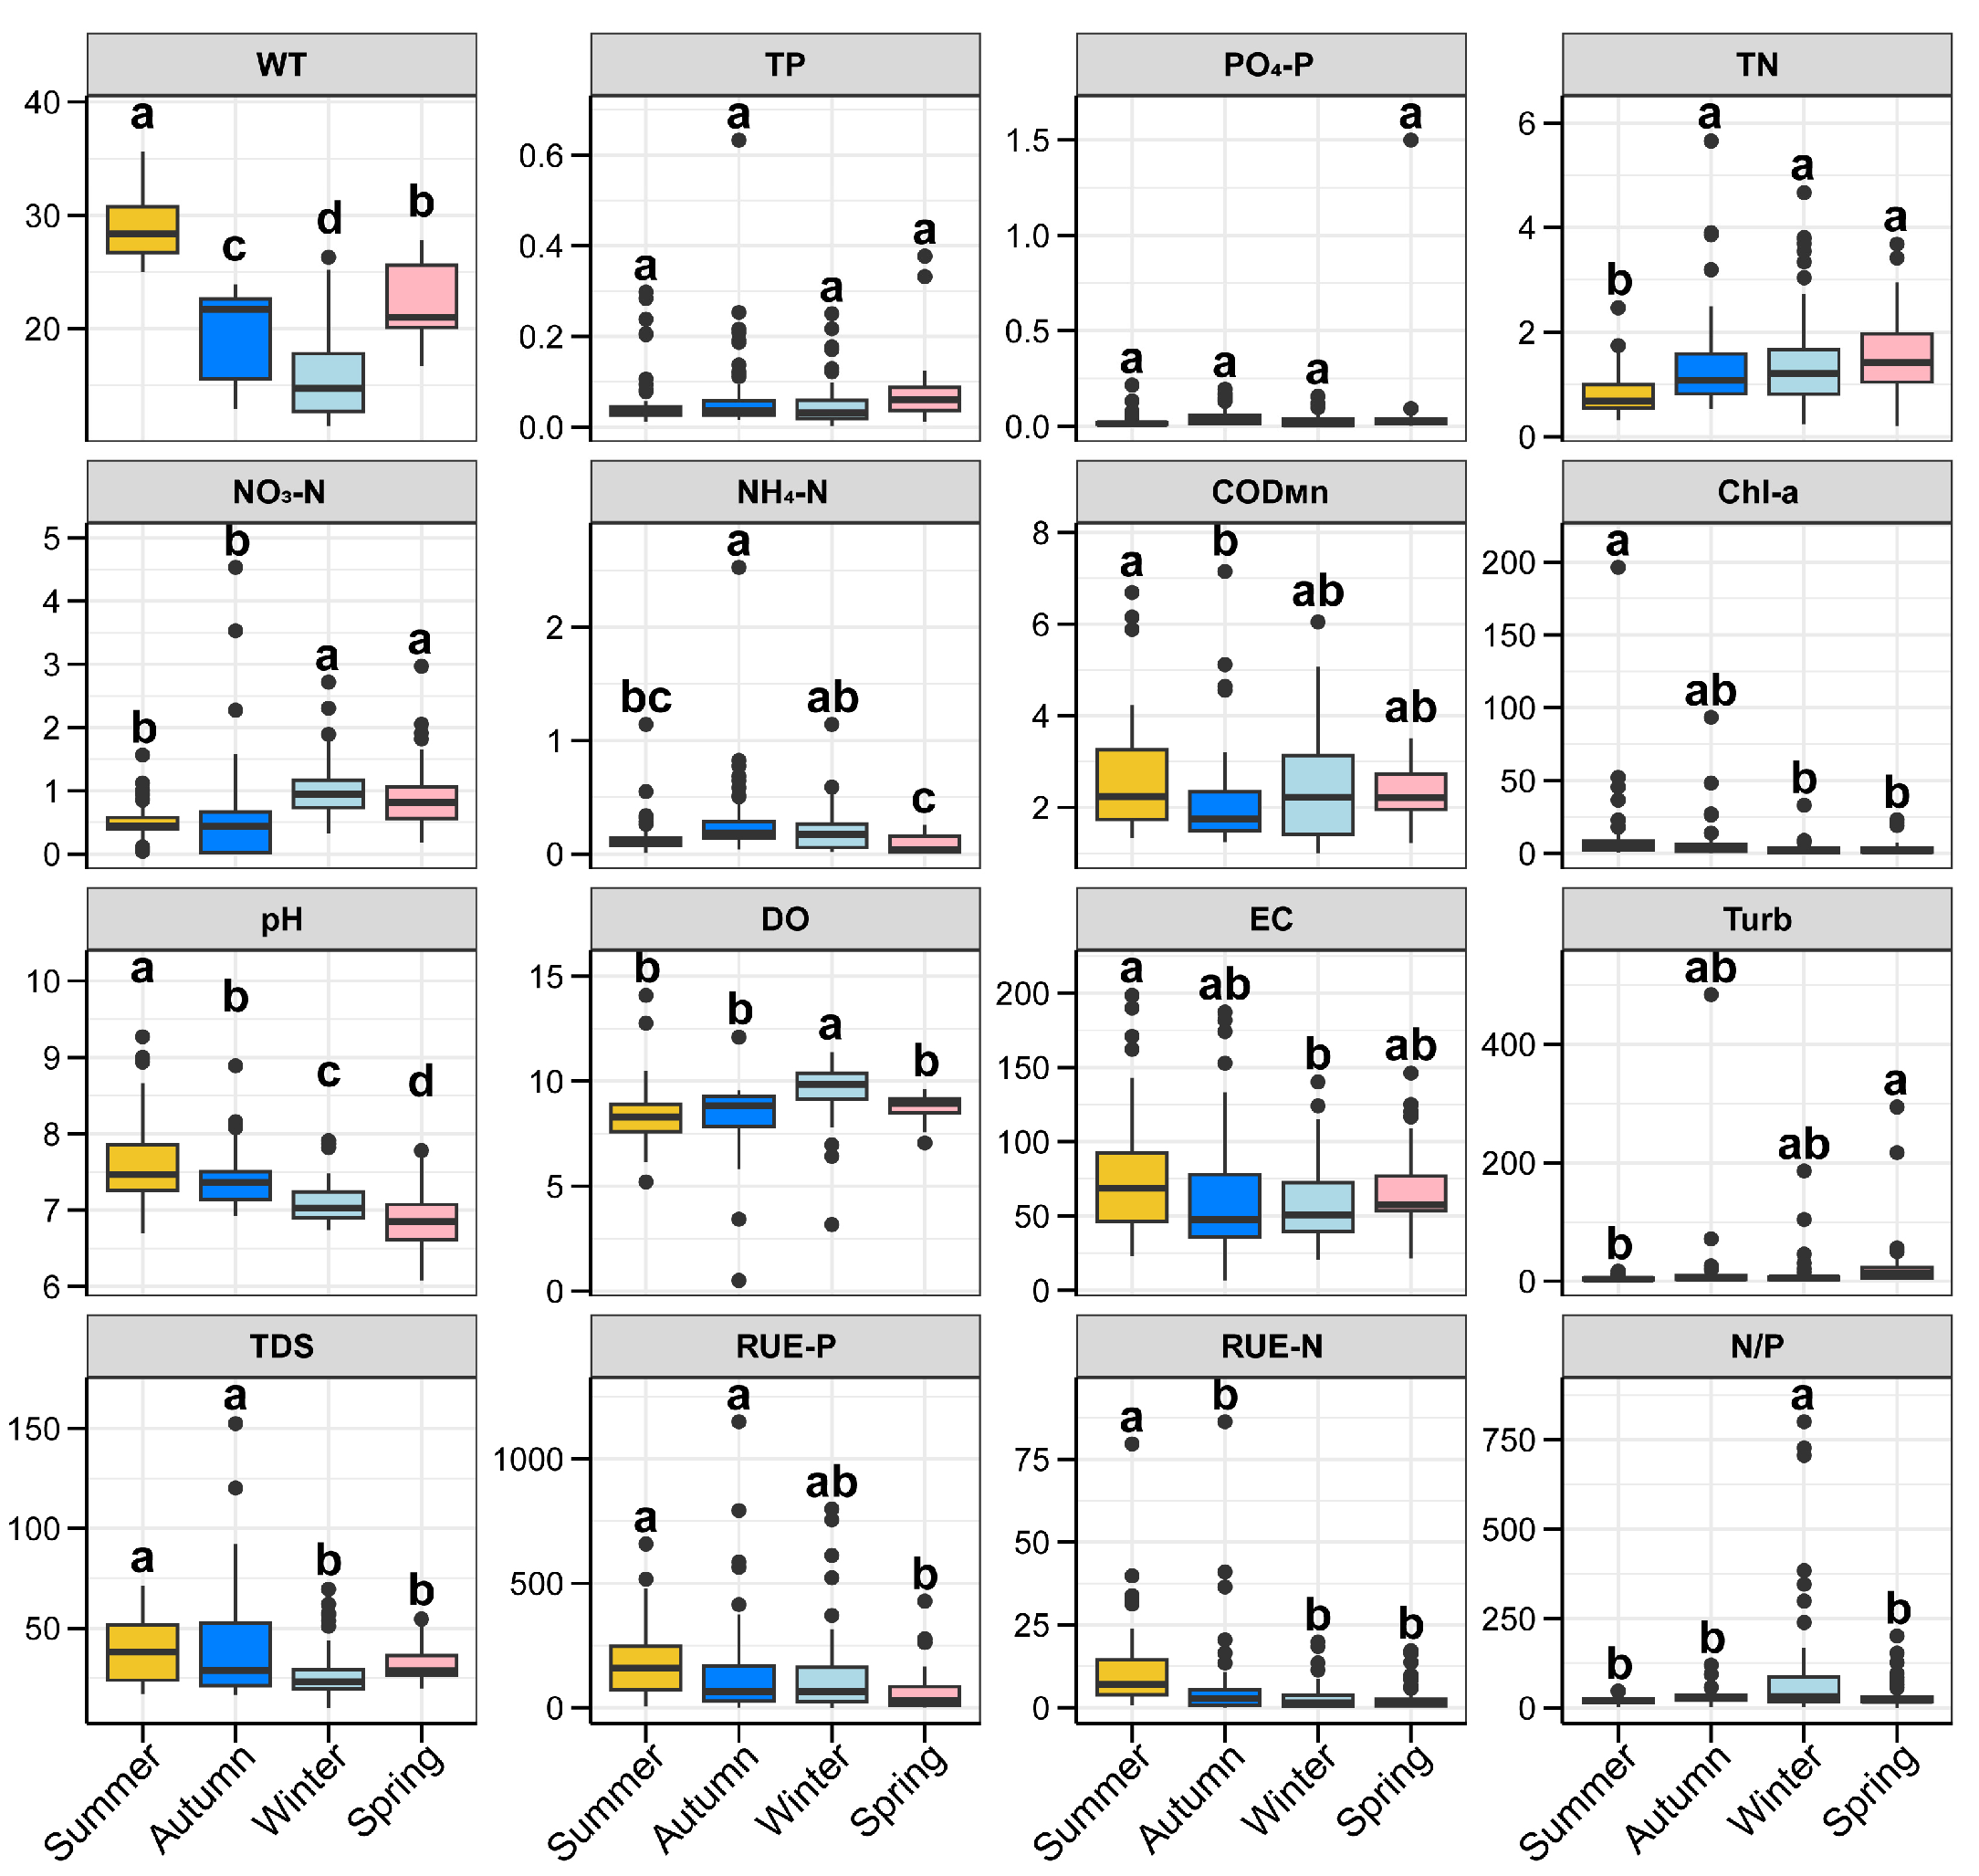
The total rainfall amount in the 7 days prior to rainfall sampling in different months during the study period is shown in Table S2. The physicochemical parameters of water samples collected in Zhaoshandu Reservoir are shown in Figure 2. Water temperature (WT) ranged from 11.4 °C to 35.6 °C, varying significantly with season (p < 0.05), peaking in summer and progressively decreasing in autumn, spring, and winter, in this order. Total phosphorus (TP) concentration varied from 0.002 to 0.633 mg/L, with higher values observed in some tributaries. No significant seasonal differences were found in this parameter. Phosphate concentration ranged from 0.001 to 0.216 mg/L, with significantly higher levels observed in autumn than in spring and summer (p < 0.05). Total nitrogen (TN) levels were significantly higher in autumn, winter, and spring than in summer (p < 0.05), with values ranging from 0.201 to 5.06 mg/L. Ammonia nitrogen (N-NH4) concentrations ranged from 0.005 to 2.52 mg/L, with significantly higher levels in autumn than in spring and summer, and significantly higher levels in winter than in spring (p < 0.05). Chlorophyll a concentrations ranged from 0.004 to 196.346 μg/L, with significantly higher values observed in summer than in winter and spring (p < 0.05). Additionally, the reservoir’s water pH fluctuated between 6.08 and 9.27, showing significant seasonal variation, with values ranked in the following descending order: summer > autumn > winter > spring (p < 0.05). Dissolved oxygen (DO) concentrations fluctuated between 0.5 and 14.09 mg/L throughout the year, with significantly higher values detected in winter than in the other seasons (p < 0.05). Turbidity ranged from 1.05 to 484 NTU, with values being significantly higher in spring than in summer (p < 0.05) (Figure 2).

3.2. Relationship Between Rainfall and Water Quality

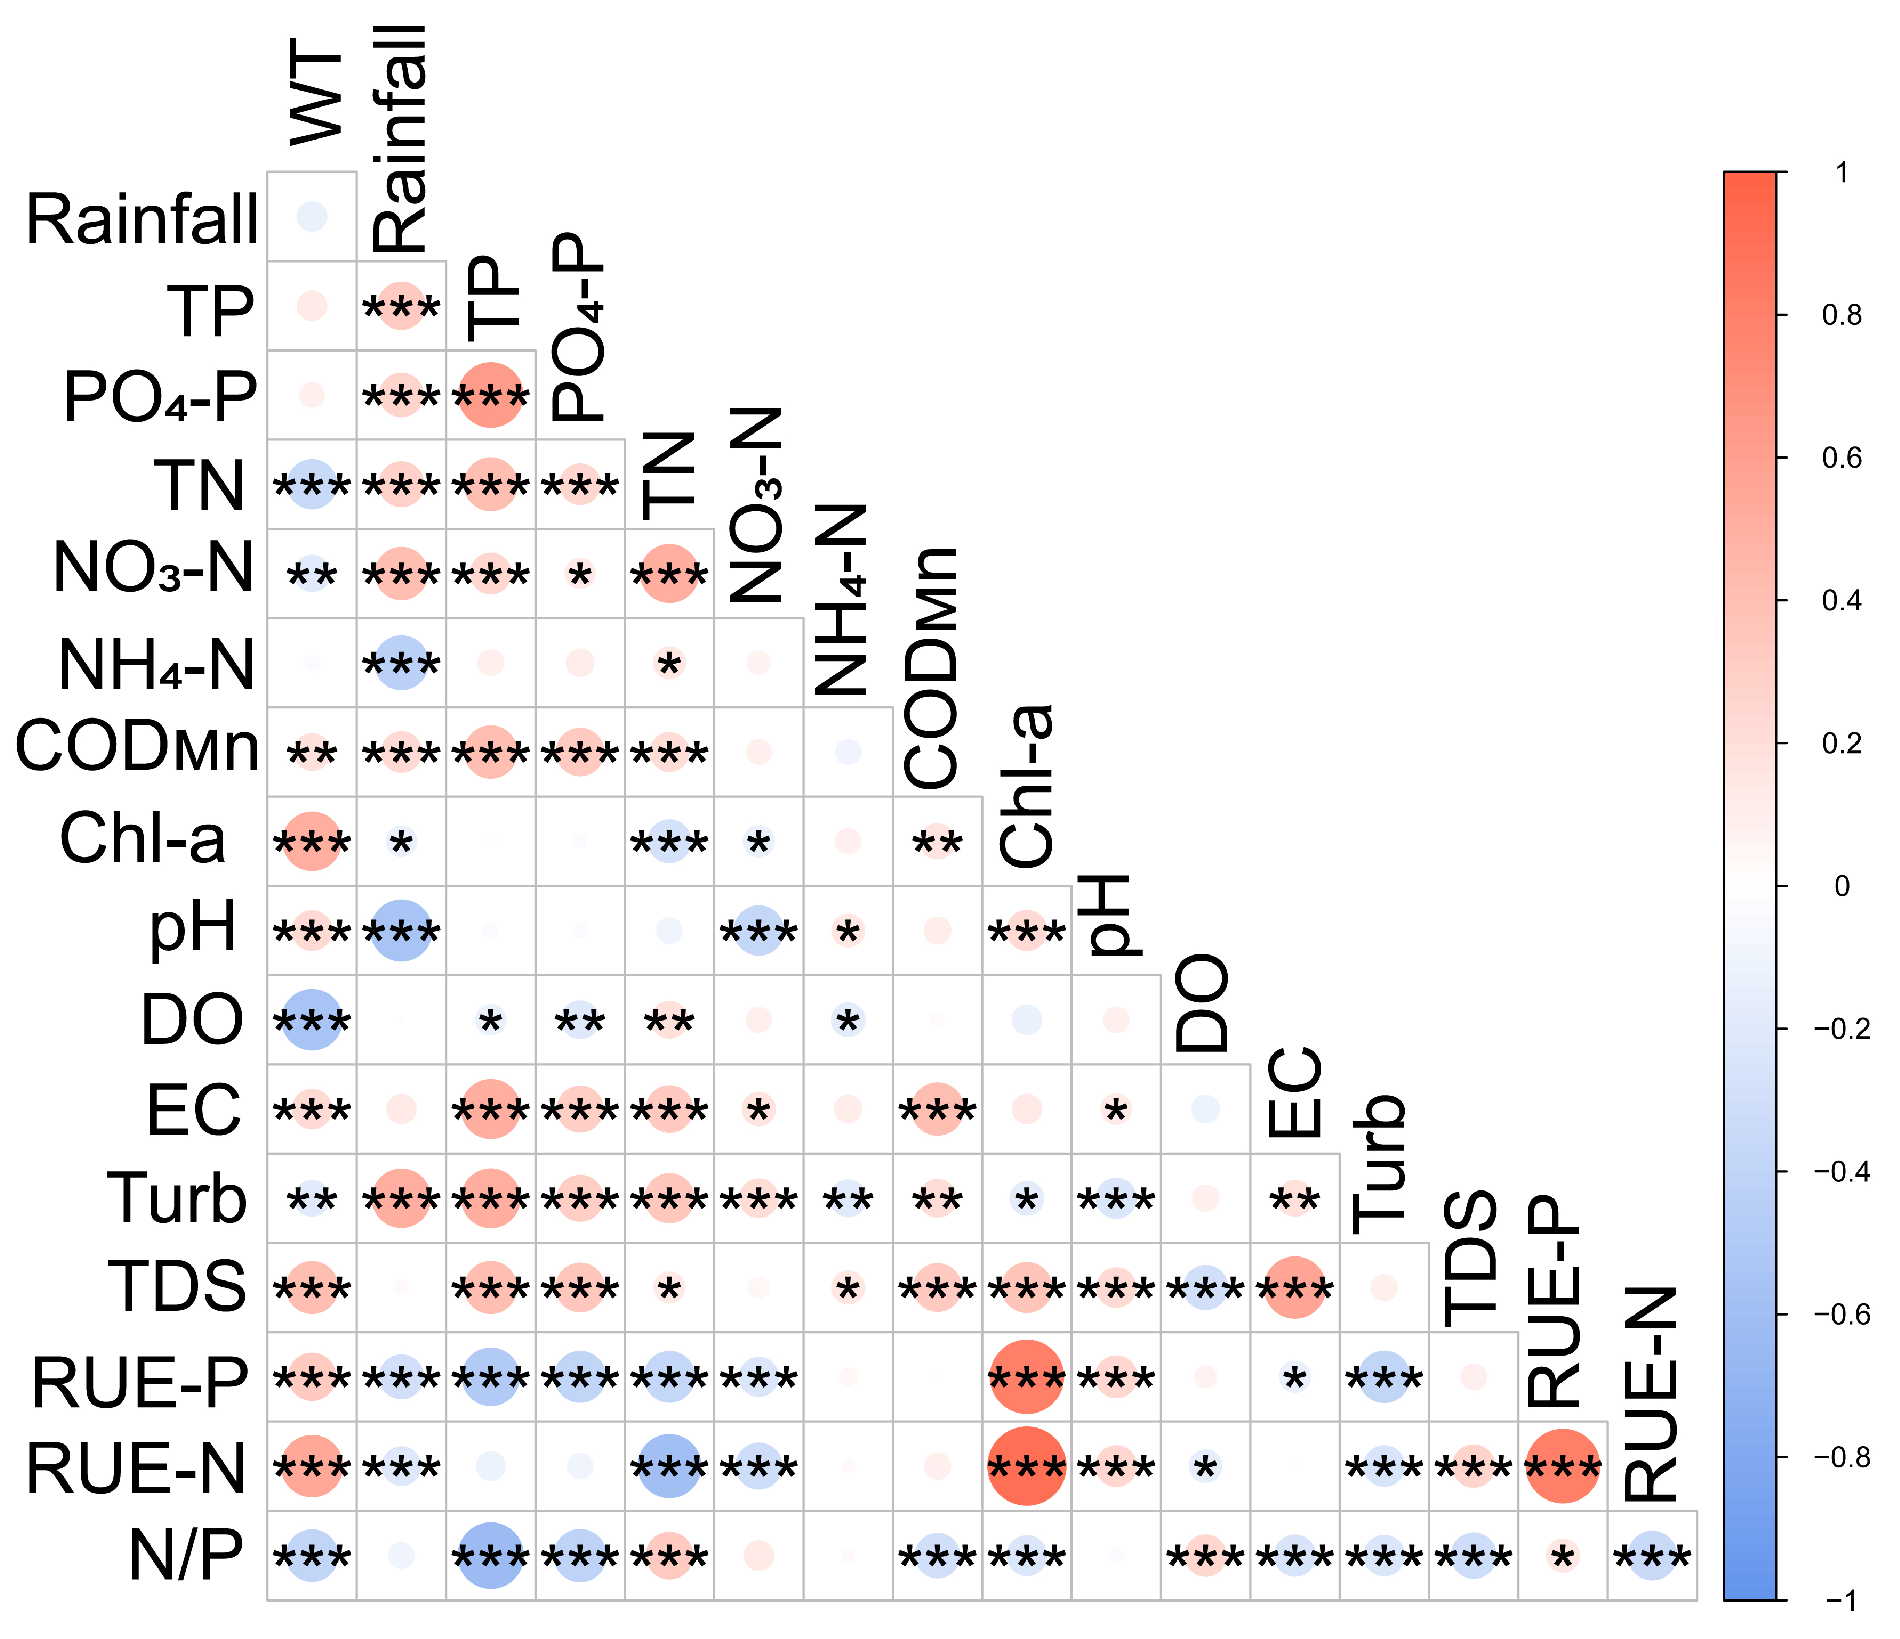
Spearman correlation analysis was conducted to explore the relationship between rainfall and both physicochemical and nutrient indicators (Figure 3). The results indicated significant correlations between rainfall and several nutrient-related parameters (p < 0.05), including TP, phosphate (PO4-P), TN, nitrate nitrogen (NO3-N), NH4-N, and permanganate chemical oxygen demand (CODMn), as well as physicochemical parameters like Chl-a, pH, and turbidity. WT was significantly correlated only with four of the nutrient indicators, i.e., TN, NO3-N, and CODMn (p < 0.05) but showed significant correlations with all the physicochemical indicators (p < 0.05).

3.3. Dynamic Changes in Phytoplankton Species Composition in Zhaoshandu Reservoir

A total of 121 phytoplankton species from seven phyla were identified from the samples collected during surveys. Chlorophyta represented the most numerous group, accounting for 55 species (45.4%), followed by Bacillariophyta with 30 species (24.8%), and Cyanophyta with 17 species (14.0%) (Figure S1). The dominant species observed in different seasons are presented in Table S3. The highest number of dominant species (defined based on cell density) was recorded in summer (seven phyla and nineteen genera), with the top three genera being Merismopedia (Y = 0.11), Pseudanabaena (Y = 0.08), and Scynedra (Y = 0.08), whereas the lowest number was observed in autumn (four phyla and four genera), the genera being Dolichospermum (Y = 0.54), Pseudanabaena (Y = 0.17), Melosira (Y = 0.13), and Cryptomonas (Y = 0.05). In winter, four phyla and twelve genera of dominant species were recorded, with the top three genera being Asterionella (Y = 0.15), Melosira (Y = 0.15), and Melosira granulata (Y = 0.15). In spring, the dominant species comprised six phyla and eleven genera, with the top three genera being Chroomonas caudata (Y = 0.15), Merismopedia (Y = 0.15), and Synura (Y = 0.08) (Table S3).
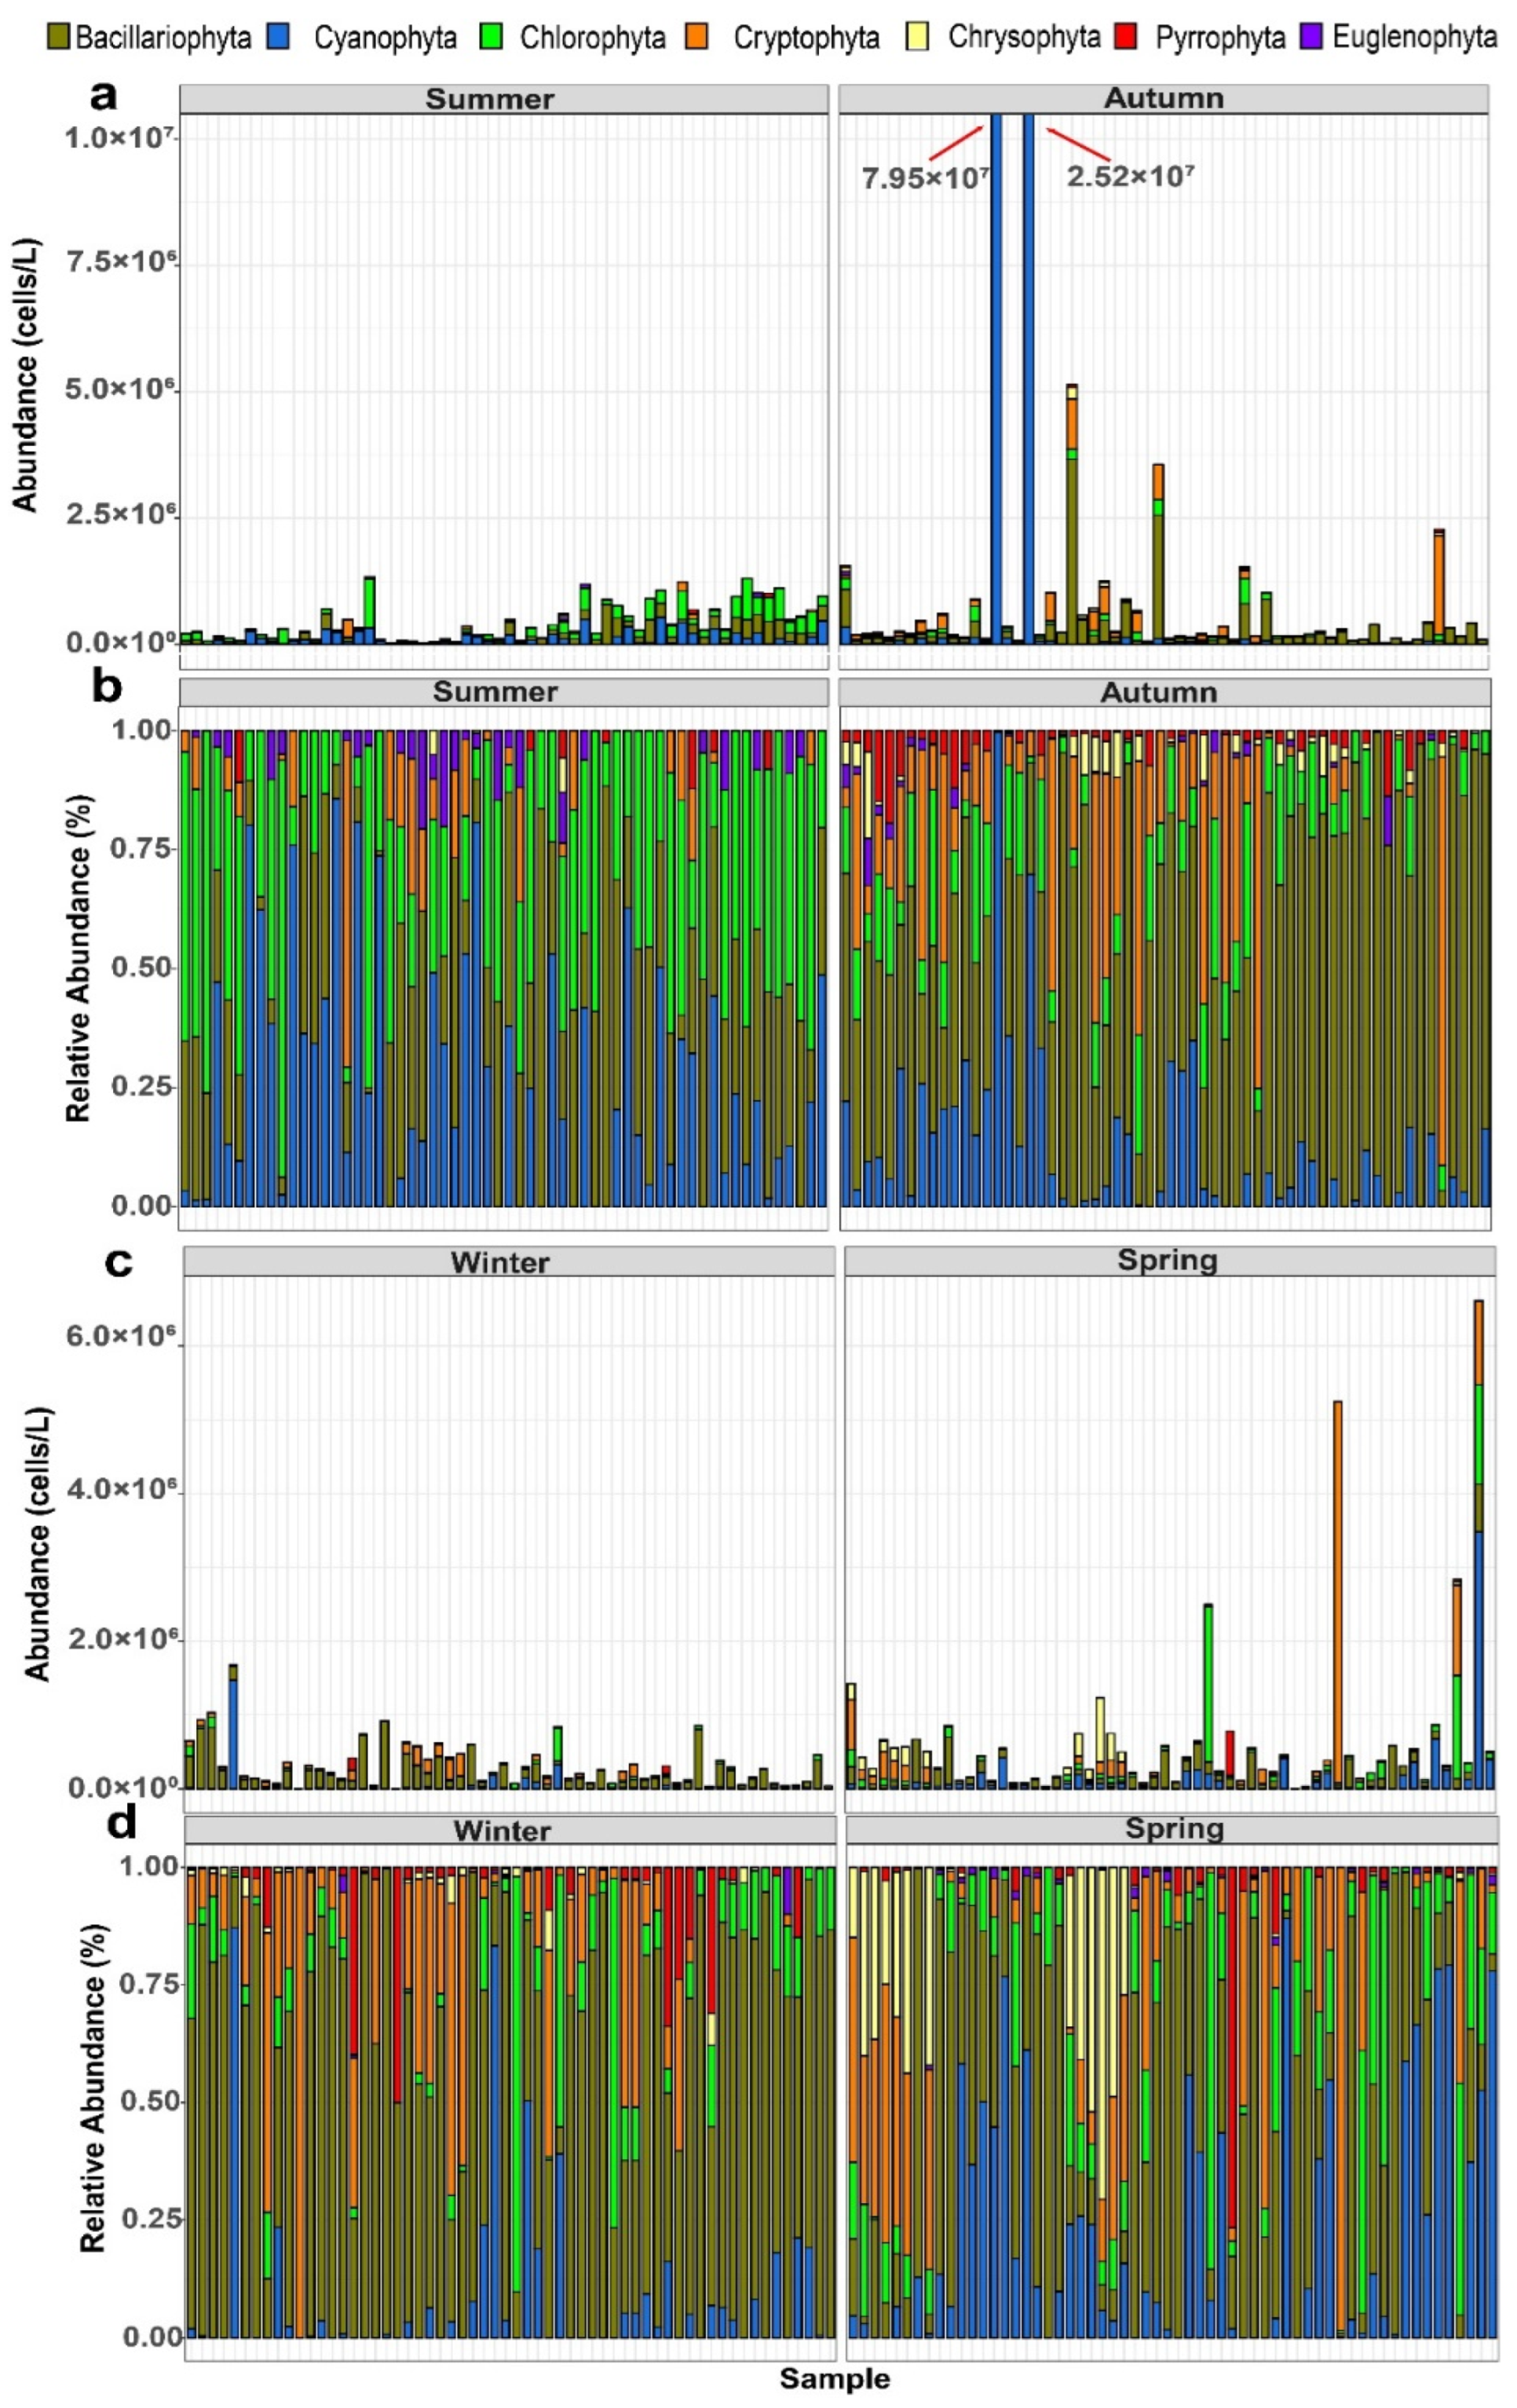
Total phytoplankton cell density in the samples collected from Zhaoshandu Reservoir ranged from 3.33 × 10³ to 7.95 × 10⁷ cells/L, with an average of 9.69 × 10⁵ cells/L. In summer, values at various sites fluctuated between 2.90 × 10⁴ cells/L and 1.34 × 10⁶ cells/L. In this season, Chlorophyta exhibited the highest abundance, with cell densities fluctuating from 0 to 9.60 × 10⁵ cells/L (1.66 × 10⁵ cells/L on average), accounting for 37.0% of the total phytoplankton abundance. Bacillariophyta was the second most abundant group (0 to 7.93 × 10⁵ cells/L (1.31 × 10⁵ cells/L on average), accounting for 29.2% of the total abundance. In autumn, phytoplankton cell densities ranged from 4.16 × 10⁴ to 7.95 × 10⁷ cells/L, and Cyanophyta replaced Chlorophyta as the most abundant group, with densities between 0 and 7.92 × 10⁷ cells/L (1.77 × 10⁶ cells/L on average), accounting for 73.0% of the total abundance. Bacillariophyta ranked second, with densities between 2.53 × 10⁴ and 8.45 × 10⁶ cells/L (4.13 × 10⁵ cells/L on average), accounting for 17.0% of the total abundance. In winter, cell densities ranged from 3.34 × 10³ to 1.68 × 10⁶ cells/L, with Bacillariophyta emerging as the dominant group (0 to 9.09 × 10⁵ cells/L, with an average of 1.77 × 10⁶ cells/L), accounting for 62.1% of the total abundance. Finally, in spring, cell densities ranged from 7.17 × 10³ to 6.62 × 10⁶ cells/L, with Cryptophyta and Cyanophyta exhibiting the highest (0 to 5.16 × 10⁶ cells/L; average 1.83 × 10⁵ cells/L) and second highest abundances (0 to 3.47 × 10⁶ cells/L), respectively, accounting for 27.7% and 22.5% of the total abundance (Figure 4a–d).
Phytoplankton biomass at various sites in Zhaoshandu Reservoir during the survey period fluctuated between 20 μg/L and 3170 μg/L. Chlorophyta (0 to 1580 μg/L, with an average of 240 μg/L) and Cryptophyta (0 and 11,920 μg/L, with an average of 440 μg/L) exhibited the highest biomass in summer and spring, respectively, accounting for 39.7% and 43.2% of the total biomass, whereas Bacillariophyta dominated in terms of biomass in both autumn and winter, accounting for 40.0% and 57.8% of the total biomass, respectively. (Figure S2a–d).

3.4. Dynamics of Phytoplankton Diversity and Niche Characteristics in Zhaoshandu Reservoir

The Shannon–Wiener diversity index at the genus level varied significantly with season (p < 0.05), with values being significantly higher in spring and summer than in winter. Specifically, the values ranged from 1.11 to 3.71. The species richness index (ranging from 5 to 20) showed significantly higher values in spring than in summer, autumn, and winter (p < 0.05), and the autumn and winter values were significantly higher than those in summer (p < 0.05). Pielou’s evenness index (ranging from 0.37 to 0.98) exhibited significantly higher values in summer than in autumn, winter, and spring (p < 0.05) (Figure S3). Analysis of niche characteristics revealed no significant seasonal differences in niche width at the genus level, whereas significantly higher values for niche overlap were observed in summer compared with the other seasons (p < 0.05) (Figure S4).
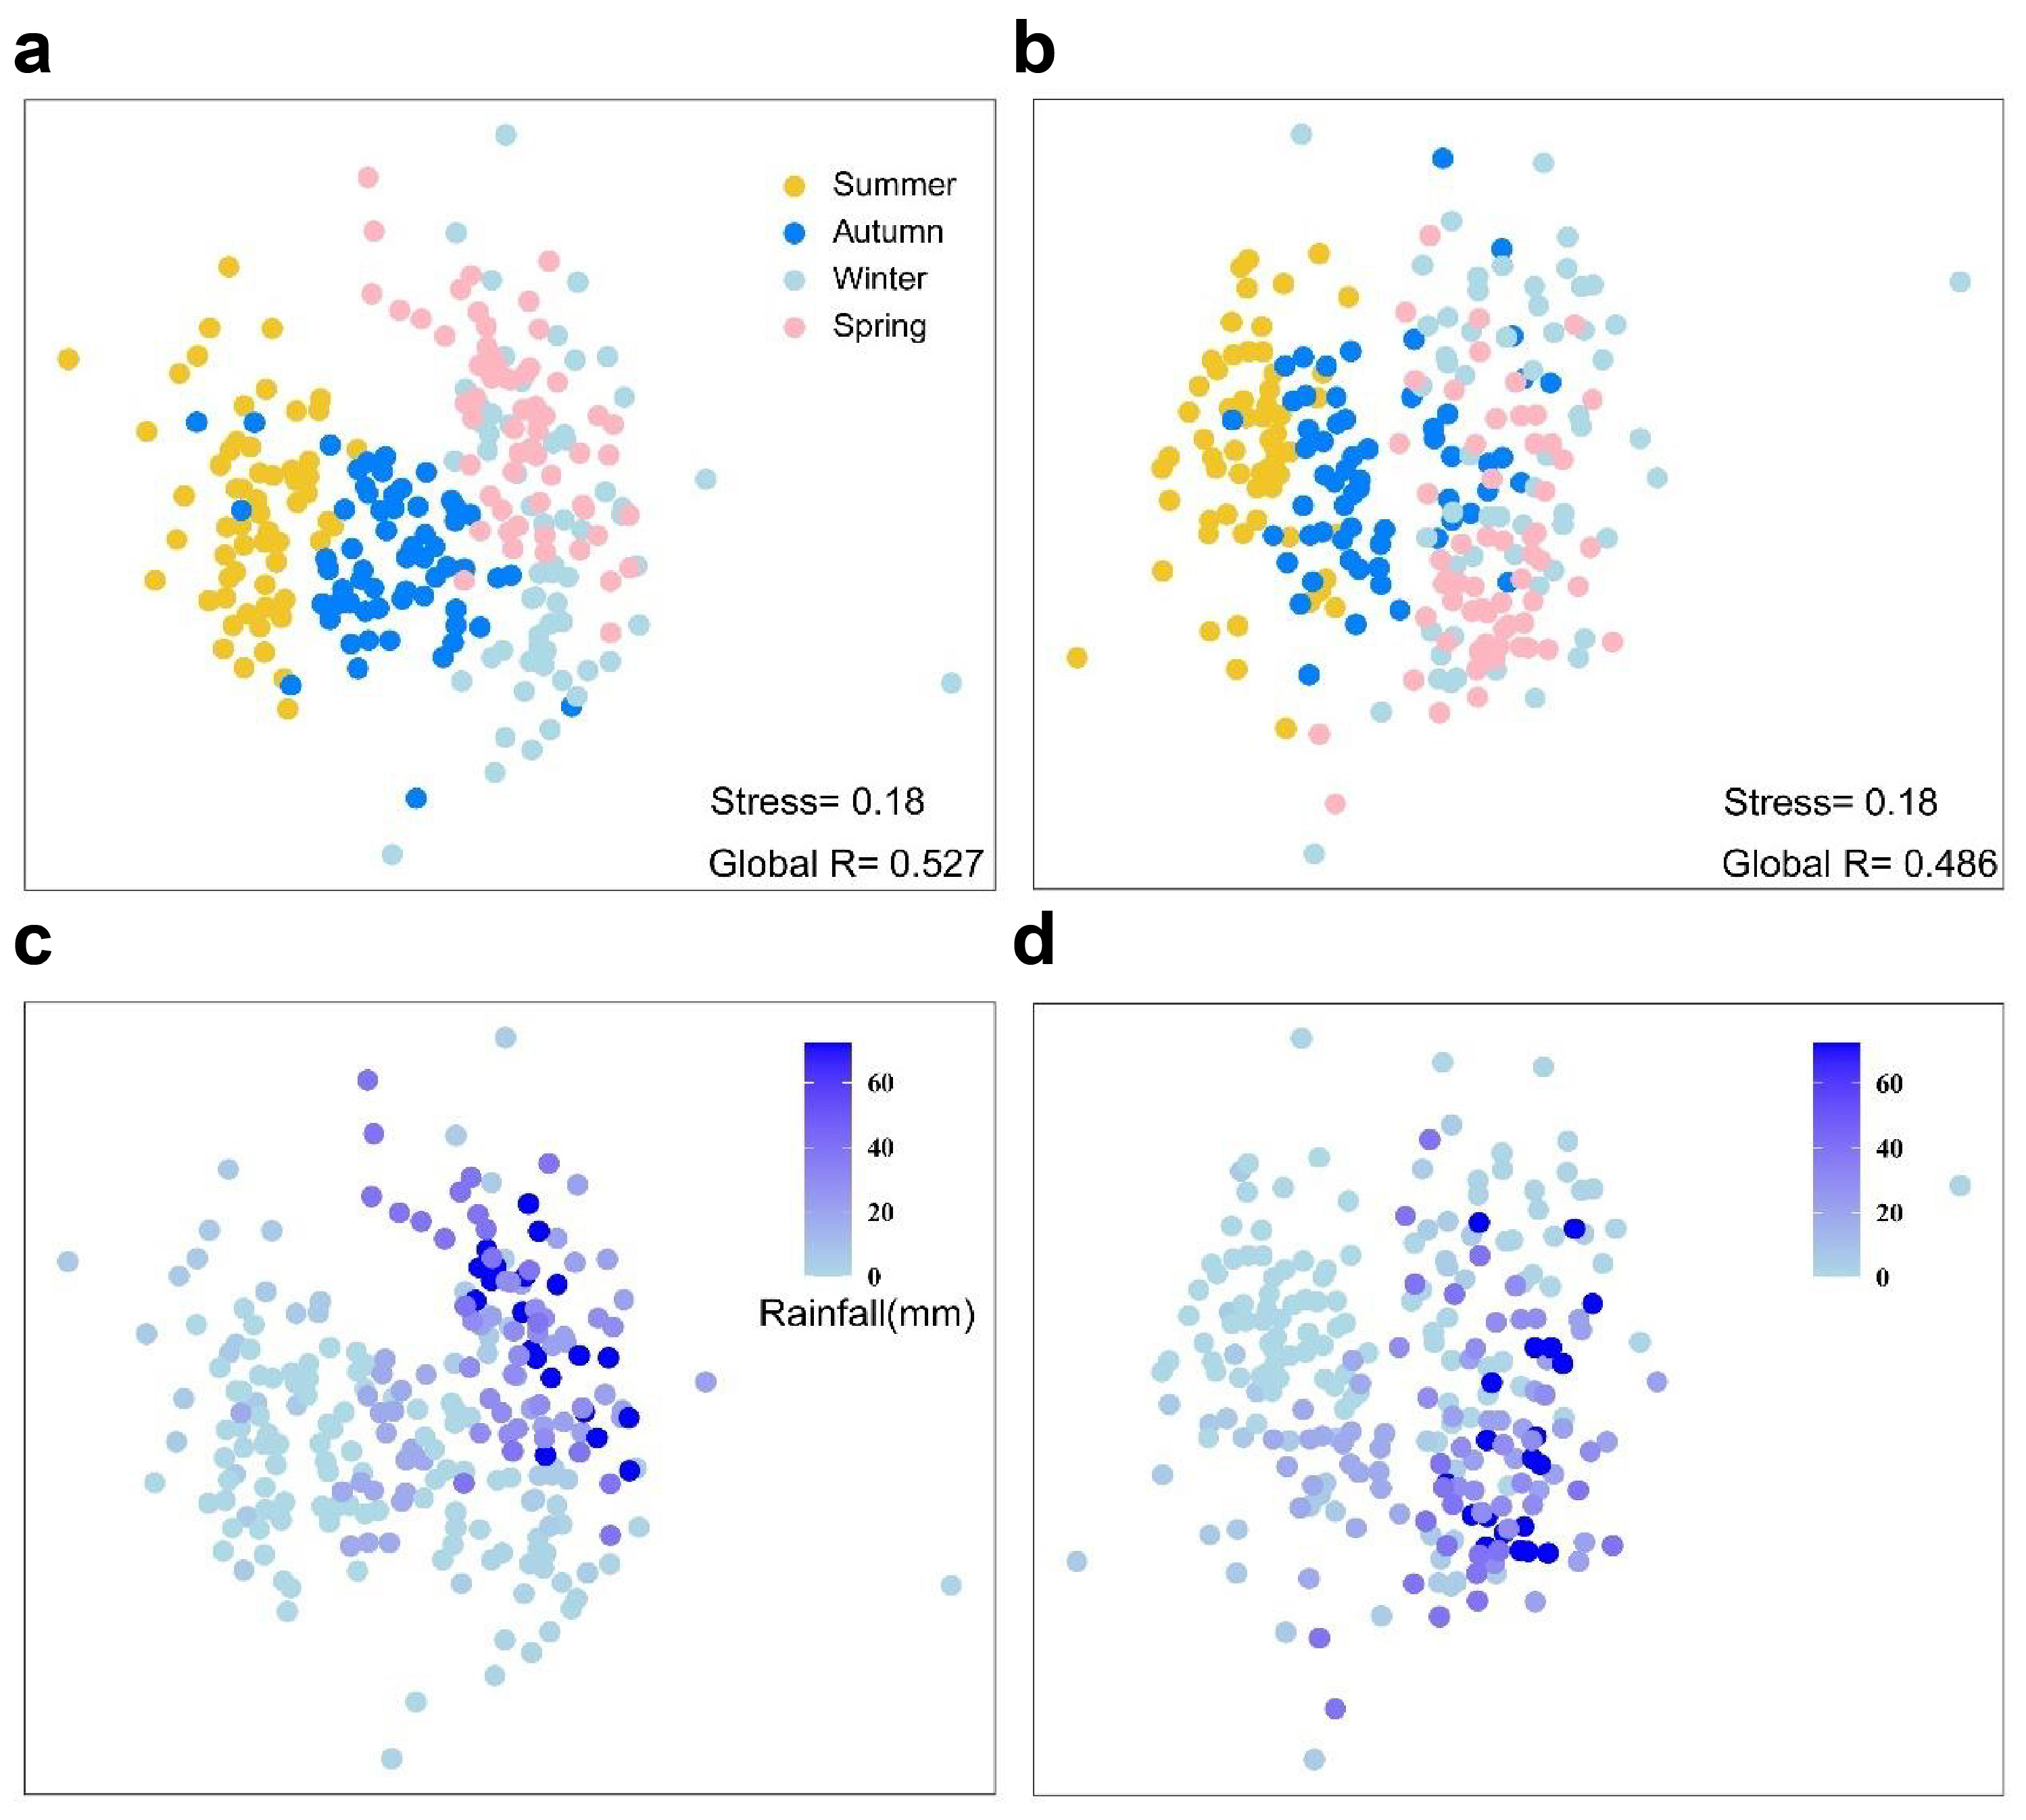
Non-metric multidimensional scaling (NMDS) based on Bray–Curtis dissimilarity and ANOSIM analysis revealed significant seasonal separation in both phytoplankton cell density (R = 0.527, p = 0.001) and biomass (R = 0.486, p = 0.001) (Figure 5, Table S4). The most pronounced differences were observed between summer and spring for both cell density (R = 0.832, p = 0.001) and biomass (R = 0.808, p = 0.001) (Figure 5a,b, Table S4). Furthermore, gradient analysis based on rainfall differences in NMDS showed distinct distribution patterns of β-diversity across various precipitation regimes (Figure 5c,d).

3.5. Key Drivers of Phytoplankton Community Dynamics

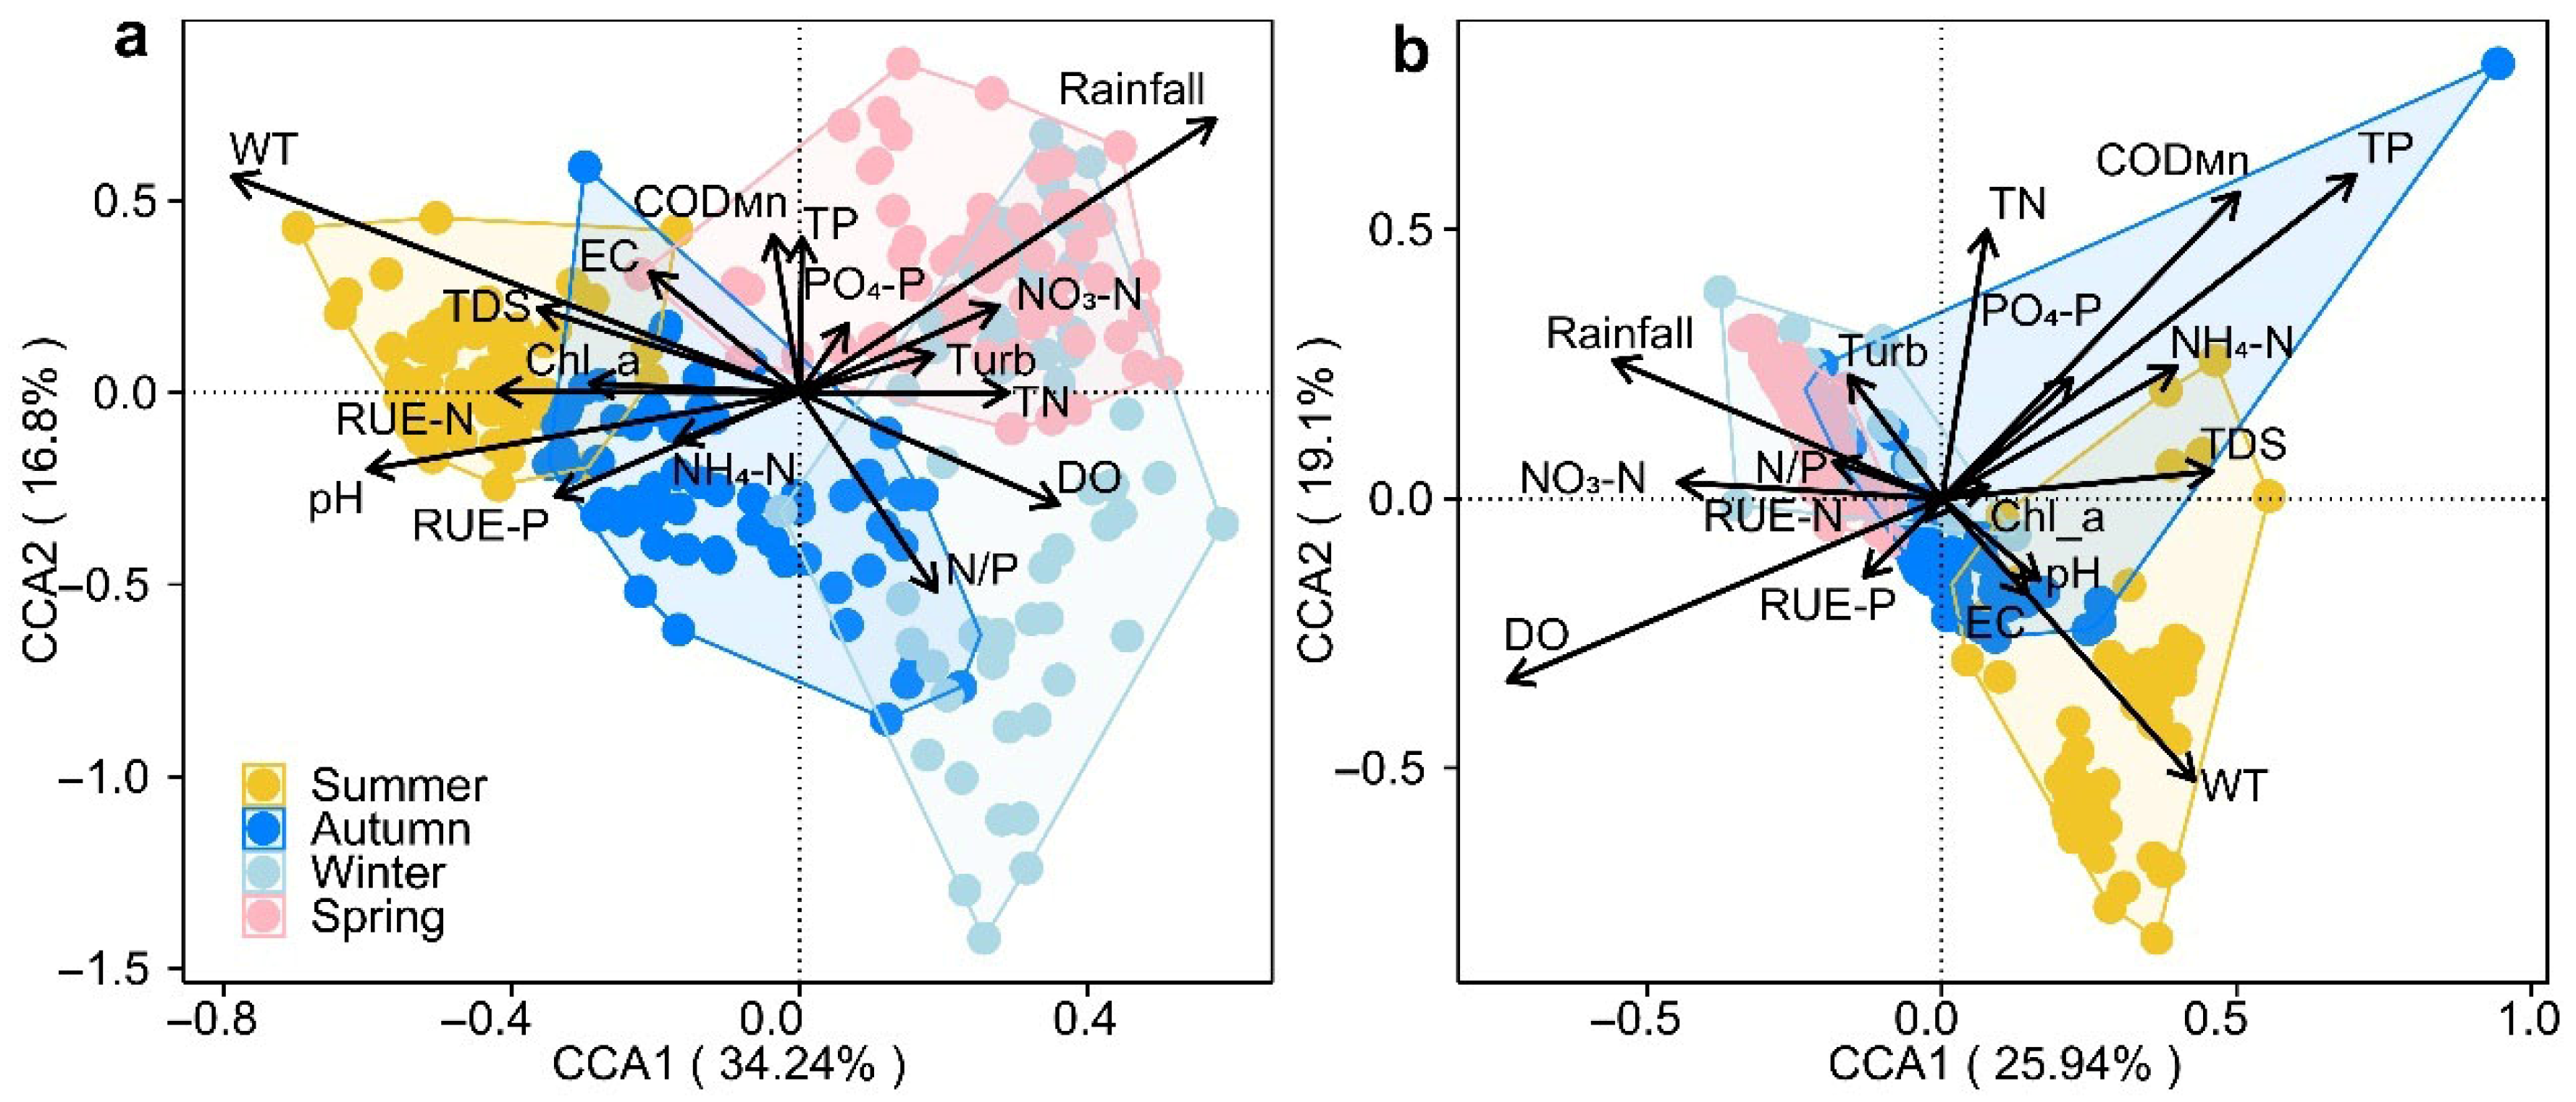
To identify the environmental determinants of phytoplankton density and biomass, we performed redundancy analysis encompassing 17 environmental factors after screening for variance inflation factors and running permutation tests (Table S5). The results revealed that WT (R2 = 0.780, p = 0.001) and rainfall (R2 = 0.57, p = 0.001) were the two factors most strongly correlated with phytoplankton density, indicating their predominant role in shaping community structure (Figure 6a). The factors with the strongest effect on phytoplankton biomass were WT (R2 = 0.40, p = 0.001), TP (R2 = 0.79, p = 0.005), DO (R2 = 0.61, p = 0.006), CODMn (R2 = 0.53, p = 0.008), and rainfall (R2 = 0.33, p = 0.025), with WT being the most critical driver (Figure 6b).

3.6. Responses of Phytoplankton Diversity and Niche Characteristics to WT and Rainfall

The α-diversity indices and ecological niche characteristics were fitted against rainfall and WT (Figure 7 and Figure S5). The results revealed significant correlations between WT and the Shannon–Wiener (R = 0.28, p < 0.001), Simpson (R = 0.36, p < 0.001), and Pielou’s evenness (R = 0.43, p < 0.001) indices, whereas no significant correlation was observed between WT and species richness (Figure 7a). Additionally, rainfall was significantly correlated with species richness (R = 0.41, p < 0.001) and Pielou’s evenness (R = −0.28, p < 0.001), but no significant correlation was observed with the Shannon–Wiener or Simpson indices (Figure 7b). Notably, Pielou’s evenness exhibited a significant positive correlation with WT (b = 0.01) and a significant negative correlation with rainfall (b = −0.001).
With regard to ecological niche parameters, no significant correlation was observed between niche width and either WT or rainfall (Figure S5); in contrast, ecological niche overlap was significantly correlated with both parameters. Specifically, niche overlap was positively correlated with WT (R = 0.55, p < 0.001, b = 0.01) and negatively correlated with rainfall (R = −0.25, p < 0.001, b = −0.001) (Figure S5). Moreover, the analysis of correlations between Bray–Curtis dissimilarity, which was used to represent β-diversity, and both rainfall and WT showed significantly positive relationships with both parameters, with β-diversity vs. WT exhibiting a stronger correlation (Figure 7c).

3.7. Structural Equation Modeling (SEM)

SEM analysis revealed both the direct and indirect effects of rainfall and WT on phytoplankton communities. After model optimization, the goodness-of-fit index reached 1. In this analysis, the Shannon–Wiener index and the dimension-reduced Bray–Curtis index were employed to represent phytoplankton α-diversity and β-diversity, respectively. Niche overlap and NH4-N were used to represent ecological niches and nutrients, respectively. According to the results, WT exhibited significant causal relationships with α-diversity (direct effect = 0.25; p < 0.001), β-diversity (direct effect = −0.67; p < 0.001), and niche overlap (direct effect = 0.54; p < 0.01) (Figure 8). Similarly, rainfall demonstrated significant causal relationships with α-diversity (direct effect = 0.16; p < 0.01), β-diversity (direct effect = 0.50; p < 0.01), and niche overlap (direct effect = −0.16; p < 0.01) (Figure 8). However, no significant direct effects were observed between either WT or rainfall and phytoplankton cell density or biomass (Figure 8). Crucially, NH4-N exhibited significant causal relationships with both cell density (direct effect = 0.21; p < 0.01) and biomass (direct effect = 0.18; p < 0.01), but no significant direct effects were found on phytoplankton α-diversity, β-diversity, or niche overlap (Figure 8). More importantly, rainfall was shown to have a significant direct effect on NH4-N (R = −0.18; p < 0.001). This suggests that by altering NH4-N levels in the water column, rainfall can indirectly influence phytoplankton cell density and biomass (Figure 8). It was thus concluded that rainfall and WT jointly shape the structure of phytoplankton communities.

4. Discussion

4.1. Temporal Dynamics of Phytoplankton Communities

Phytoplankton play an essential role in aquatic ecosystems, and their distribution and diversity can serve as indicators of water quality, pollution levels, and ecosystem health. Therefore, understanding the spatiotemporal distribution patterns of phytoplankton is crucial for effectively managing reservoirs and promoting the sustainable development of water resources. Phytoplankton in Zhaoshandu Reservoir exhibited significant temporal variations in species composition, diversity, and niche overlap (Figures S1, S3 and S4). The phytoplankton community was primarily composed of Cyanophyta, Bacillariophyta, and Chlorophyta (Figure S1), in line with observations made by Zhu et al. in the Feiyun River Basin in Zhejiang [28]. Additionally, species composition shows a clear temporal succession (Figure 4 and Figure S2), with Chlorophyta being dominant during early summer, when WT is <25 °C. As WT continues to rise, the heat-tolerant Cyanophyta become the dominant group. In late autumn and winter, this group is replaced by the cold-tolerant Bacillariophyta and Cryptophyta, and by spring, with WT rising again, Cryptophyta, Cyanophyta, and Bacillariophyta become established as dominant groups, in varying proportions [29,30,31].
With regard to phytoplankton diversity, the Shannon–Wiener index was significantly higher in spring and summer than in winter, whereas the Simpson index was notably higher in summer than in autumn and winter (Figure S3). Species richness and Pielou’s evenness were lowest and highest in summer, respectively (Figure S3). These patterns can be attributed to favorable climatic conditions for phytoplankton growth and reproduction during spring and summer, such as ample sunlight and higher WTs [32]. In contrast, the lower temperatures and shorter daylight hours in winter suppress phytoplankton growth, reducing the Shannon–Wiener and Simpson indices [33]. High summer temperatures may also stimulate the rapid growth of thermophilic phytoplankton populations, reducing species richness [34]. The increasing number of dominant species may enhance community evenness, as their higher proportions make species distribution more uniform [35].
The results of this study further indicated that while there were no significant differences in niche width across seasons, niche overlap was significantly higher in summer compared with the rest of the year (Figure S4). This may be due to increased WT and light intensity in summer, accelerating phytoplankton growth and reproduction, thus intensifying competition for limited resources such as nutrients and light [36,37]. NMDS and ANOSIM analyses further confirmed significant seasonal differences in phytoplankton community structure at Zhaoshandu Reservoir, with the largest differences observed between the spring and summer communities (Figure 5a). The variation in environmental conditions such as temperature, light, and nutrient availability between spring and summer is an important factor influencing phytoplankton community structure and diversity [38]. In this study, WTs differed significantly between these two seasons, with favorable temperature conditions in spring supporting the growth and reproduction of various phytoplankton groups. However, the higher temperatures in summer promoted the rapid growth of heat-tolerant species, inhibiting the metabolic activity and nutrient uptake of other algal groups and significantly altering community structure [39]. Additionally, NMDS analysis including rainfall gradients indicated that summer was the driest season, whereas spring was the wettest (Figure 5b). More abundant rainfall in spring likely increased river flow, washing microorganisms into the river system, which enhanced species dispersal and randomness in phytoplankton community structure, contributing to seasonal differences in β-diversity [40].

4.2. Rainfall and WT Jointly Affect Phytoplankton Diversity, Niche Characteristics, and Community Assembly

CCA analysis firstly revealed that rainfall and WT are the two main factors determining phytoplankton community structure (Figure 6). Linear regression analysis further showed that these two factors are significantly correlated with phytoplankton diversity and niche overlap (Figure 7). Finally, SEM confirmed the significant causal relationships between WT and rainfall and both phytoplankton α- and β-diversities as well as niche overlap. Rainfall was also found to exert an indirect significant effect on phytoplankton density and biomass by influencing NH4-N levels (Figure 8).
WT is a key factor influencing the intensity of enzymatic reactions such as respiration and photosynthesis in phytoplankton species, directly affecting their growth and community structure [41]. WT can also indirectly influence phytoplankton community structure by affecting predator abundance and metabolic activity [42]. Rainfall can significantly alter the physicochemical and nutrient-related parameters of water bodies. For instance, a study of Xin’anjiang reservoir by Shi et al. found that, in the short term, rainfall inhibited algal growth in river areas by increasing flow rates and reducing light availability (due to increased turbidity) but promoted it in lake areas by enhancing nutrient concentrations, particularly phosphorus [9]. In the riverine Zhaoshandu Reservoir, nutrients derived from rainfall may promote phytoplankton growth in the reservoir area, whereas increased flow rates and turbidity may inhibit phytoplankton growth in tributary areas. Moreover, variations in rainfall and WT can have synergistic effects on phytoplankton. For example, a previous study conducting simulations using artificial phytoplankton communities found that extreme weather events, such as heavy rainfall and heatwaves, could cause rapid shifts in nutrient loading and WT in temperate lakes, thereby impacting phytoplankton community composition [43]. In particular, the above-mentioned study highlighted that the interaction between WT and nutrients led to significant changes in community composition, suggesting that rainfall indirectly affects community structure by altering nutrient loads, which closely aligns with the results of the present study [43]. Other studies have also shown that heavy rainfall events influence water stratification and sediment phosphorus release, whereas WT variations regulate the phosphorus utilization efficiency of phytoplankton, with rainfall and WT jointly determining the pattern of algal bloom outbreaks. In the present study, rainfall was shown to indirectly affect phytoplankton density and biomass by altering NH4+ concentrations (Figure 8). Previous research has shown that exogenous nitrogen input reduced NH4+ concentrations in Lake Taihu in winter and spring (<0.79 mg/L), with diatoms becoming the dominant group due to their competitive advantage in nitrate (NO3) utilization. Rainfall influences phytoplankton resource use efficiency by regulating NH4+ concentrations [44]. It has also been shown that terrestrial nitrogen input, particularly NH4+, significantly increases the NH4+:NO3 ratio, thereby promoting shifts in phytoplankton community composition [45]. These findings are consistent with the results of the present study.

4.3. Limitations and Future Perspectives

While this study provides a solid analysis of water quality, phytoplankton dynamics, and environmental factors in Zhaoshandu Reservoir, several limitations should be considered. Firstly, we did not quantify other factors potentially affecting phytoplankton community dynamics, such as grazing pressure from zooplankton [46]. Secondly, we did not investigate the physicochemical properties of sediments and the composition of phytoplankton communities within them, which remains an important knowledge gap [47]. Future research should explore sediment characteristics and phytoplankton distribution patterns via both horizontal and vertical comparative analyses to obtain a more comprehensive dataset for water resource management. Thirdly, the environmental factors examined in this study, while relevant, do not cover all the possible influences on phytoplankton. Future investigations could expand their scope to include variables such as flow velocity, flow rate, and metal concentrations, which may significantly affect community structure and dynamics [48]. Lastly, increasing the frequency of sampling would allow for a more detailed understanding of temporal fluctuations in phytoplankton populations and water quality [49].

5. Conclusions

This study applied multivariate statistical methods to examine the phytoplankton community structure and its environmental drivers in a complex mountainous riverine reservoir. The results of correlation analysis indicated that rainfall significantly influences both physicochemical parameters and nutritional indicators in the reservoir. CCA identified rainfall and WT as key factors affecting phytoplankton density and biomass. Linear regression analysis indicated significant statistical correlations between both WT and rainfall and phytoplankton α- and β-diversities, as well as niche overlap. More importantly, structural equation modeling demonstrated a significant direct effect of WT and rainfall on these parameters. More specifically, rainfall was shown to exert such an effect indirectly by altering NH4-N concentrations. These findings confirm that WT and rainfall are key drivers of phytoplankton community structure in subtropical riverine reservoirs. For effective management, we recommend implementing enhanced water quality monitoring during rainy seasons with particular attention to dynamic variations in nitrogen concentrations, coupled with strict control of external nitrogen inputs to maintain phytoplankton community stability and prevent algal blooms. While designed for subtropical systems, these measures may also apply to other monsoon-affected mountainous reservoirs with similar climatic and hydrological regimes. However, they should be adapted to local conditions by considering differences in baseline nutrient levels, dominant phytoplankton taxa, and catchment land use.

Supplementary Materials

The following supporting information can be downloaded at https://www.mdpi.com/article/10.3390/d17080573/s1, Table S1: Coordinates of sampling point in Zhaoshandu Reservoir. Table S2: The total rainfall amount in the seven days prior to the rainfall sampling in different months. Table S3: Dominant genera and their corresponding dominance values in different seasons of Zhaoshandu Reservoir. Table S4: ANOSIM statistical analysis of phytoplankton communities in Zhaoshandu Reservoir. Table S5: RDA analysis of the phytoplankton community in Zhaoshandu Reservoir across different seasons, with bold characters indicating significant correlations. Figure S1: Phytoplankton species composition in Zhaoshandu Reservoir, with numbers representing the quantity of genera within different phyla. Figure S2: Seasonal variations in the relative biomass of phytoplankton phyla in Zhaoshandu Reservoir from July 2022 to June 2023. Figure S3: The α diversity of phytoplankton varied across different seasons. Figure S4: The niche width and niche overlap of phytoplankton across different seasons. Figure S5: Correlation between phytoplankton niche breadth, niche overlap, and water temperature, rainfall.

Author Contributions

Conceptualization, Q.Z., R.Z. and R.L.; methodology, Q.Z., X.R. and X.H.; software, Q.Z., P.X. and J.Z.; formal analysis, Q.Z. and T.S.; investigation, Q.Z., L.H., X.H. and T.S.; sampling, Q.Z., L.H., R.Z. and H.Z.; resources, L.H., R.Z. and R.L.; data curation, Q.Z. and J.Z.; writing—original draft preparation, Q.Z.; writing—review and editing, Q.Z., R.Z. and R.L.; visualization, Q.Z. and H.Z.; funding acquisition, L.H., R.Z. and R.L. All authors have read and agreed to the published version of the manuscript.

Funding

This study was supported by the Zhejiang Provincial Natural Science Foundation of China (No. LD21C030001), Key Research and Development Program of National Natural Science Foundation of China (Grant No. 2021YFE0112000), and National Natural Science Foundation of China (Grant No. 32371634, and No. 31970219), and Scientific Research Projects of the Shanghai Municipal Bureau of Ecology and Environment (Grant No. 202409), and Wenzhou Wencheng Science & Technology Bureau (No. 2025wk0001).

Institutional Review Board Statement

Not applicable.

Informed Consent Statement

Not applicable.

Data Availability Statement

The data presented in this study are available on request from the corresponding author. The data are not publicly available due to privacy or ethical restrictions.

Conflicts of Interest

The authors declare that they have no known competing financial interests or personal relationships that could have appeared to influence the work reported in this paper.

References

  1. Anderson, S.I.; Barton, A.D.; Clayton, S.; Dutkiewicz, S.; Rynearson, T.A. Marine phytoplankton functional types exhibit diverse responses to thermal change. Nat. Commun. 2021, 12, 6413. [Google Scholar] [CrossRef] [PubMed]
  2. Yuan, H.; Zhang, R.; Li, Q.; Lu, Q.; Chen, J. Bacterially mediated phosphorus cycling favors resource use efficiency of phytoplankton communities in a eutrophic plateau lake. Water Res. 2025, 277, 123300. [Google Scholar] [CrossRef]
  3. Kong, X.; Koelmans, A.A. Modeling decreased resilience of shallow lake ecosystems toward eutrophication due to microplastic ingestion across the food web. Environ. Sci. Technol. 2019, 53, 13822–13831. [Google Scholar] [CrossRef]
  4. Jia, J.; Gao, Y.; Wang, S.; Wu, F.; Lu, Y.; Ha, X. Feedbacks between phytoplankton and global changes in a riverine source-mainstem-estuary continuum. Water Res. 2025, 268, 122746. [Google Scholar] [CrossRef]
  5. Shao, N.F.; Yang, S.T.; Sun, Y.; Gai, Y.; Zhao, C.S.; Wang, F.; Dong, B. Assessing aquatic ecosystem health through the analysis of plankton biodiversity. Mar. Freshw. Res. 2019, 70, 647–655. [Google Scholar] [CrossRef]
  6. Meng, F.; Li, Z.; Li, L.; Lu, F.; Liu, Y.; Lu, X.; Fan, Y. Phytoplankton alpha diversity indices response the trophic state variation in hydrologically connected aquatic habitats in the Harbin Section of the Songhua River. Sci. Rep. 2020, 10, 21337. [Google Scholar] [CrossRef] [PubMed]
  7. Kleinteich, J.; Frassl, M.A.; Schulz, M.; Fischer, H. Climate change triggered planktonic cyanobacterial blooms in a regulated temperate river. Sci. Rep. 2024, 14, 16298. [Google Scholar] [CrossRef]
  8. Kim, H.G.; Cha, Y.; Cho, K.H. Projected climate change impact on cyanobacterial bloom phenology in temperate rivers based on temperature dependency. Water Res. 2024, 249, 120928. [Google Scholar] [CrossRef]
  9. Shi, P.; Zhu, M.; You, R.; Li, H.; Zou, W.; Xu, H.; Zhu, G. Rainstorm events trigger algal blooms in a large oligotrophic reservoir. J. Hydrol. 2023, 622, 129711. [Google Scholar] [CrossRef]
  10. Yang, D.; Yang, Y.; Xia, J. Hydrological cycle and water resources in a changing world: A review. Geogr. Sustain. 2021, 2, 115–122. [Google Scholar] [CrossRef]
  11. Li, L.; Knapp, J.L.; Lintern, A.; Ng, G.H.C.; Perdrial, J.; Sullivan, P.L.; Zhi, W. River water quality shaped by land–river connectivity in a changing climate. Nat. Clim. Change 2024, 14, 225–237. [Google Scholar] [CrossRef]
  12. Seliger, C.; Zeiringer, B. River connectivity, habitat fragmentation and related restoration measures. In Riverine Ecosystem Management; Springer International Publishing: Cham, Switzerland, 2018; pp. 171–186. [Google Scholar]
  13. Alexander, L.C.; Autrey, B.; DeMeester, J.; Fritz, K.M.; Golden, H.E.; Goodrich, D.C.; Wigington, P.J. Connectivity of Streams and Wetlands to Downstream Waters: A Review and Synthesis of the Scientific Evidence; US Environmental Protection Agency: Washington, DC, USA, 2015.
  14. Liu, X.; Pan, B.; Liu, X.; He, H.; Zhao, X.; Huang, Z.; Li, M. Riverine microbial community assembly with watercourse distance–decay patterns in the north–south transitional zone of China. J. Hydrol. 2024, 628, 130603. [Google Scholar] [CrossRef]
  15. Kong, X.; He, Q.; Yang, B.; He, W.; Xu, F.; Janssen, A.B.; Mooij, W.M. Hydrological regulation drives regime shifts: Evidence from paleolimnology and ecosystem modeling of a large shallow Chinese lake. Glob. Change Biol. 2017, 23, 737–754. [Google Scholar] [CrossRef]
  16. Chen, W.; Ren, K.; Isabwe, A.; Chen, H.; Liu, M.; Yang, J. Stochastic processes shape microeukaryotic community assembly in a subtropical river across wet and dry seasons. Microbiome 2019, 7, 138. [Google Scholar] [PubMed]
  17. Hao, L.; Zhang, Y.; Shen, Y.; Liu, Y.; Gao, H.; Guo, P. Driving mechanism of land use and landscape pattern to phytoplankton and zooplankton community and their trophic interactions in river ecosystems. J. Environ. Manag. 2024, 370, 122691. [Google Scholar] [CrossRef] [PubMed]
  18. Stappert, H.M.; Blanke, P.; Hering, D.; Kail, J. Mitigating the effects of extreme low-flow on stream macroinvertebrates: The role of woody riparian vegetation and groundwater. Hydrobiologia 2025, 1–18. [Google Scholar] [CrossRef]
  19. Ruan, Q.; Liu, H.; Dai, Z.; Wang, F.; Cao, W. Damming exacerbates the discontinuities of phytoplankton in a subtropical river in China. J. Environ. Manag. 2024, 351, 119832. [Google Scholar] [CrossRef]
  20. Wang, Y.; Xu, H.; Zhao, X.; Kang, L.; Qiu, Y.; Paerl, H.; Zhu, G.; Li, H.; Zhu, M.; Qin, B.; et al. Rainfall impacts on nonpoint nitrogen and phosphorus dynamics in an agricultural river in subtropical montane reservoir region of southeast China. J. Environ. Manag. 2025, 149, 551–563. [Google Scholar] [CrossRef]
  21. Liu, M.; Zhang, Y.; Shi, K.; Zhang, Y.; Zhou, Y.; Zhu, M.; Liu, M. Effects of rainfall on thermal stratification and dissolved oxygen in a deep drinking water reservoir. Hydrol. Process. 2020, 34, 3387–3399. [Google Scholar] [CrossRef]
  22. Li, A.L.; Chen, H.T.; Liu, Y.Y.; Qiu, L.; Wang, W.C. Net Anthropogenic Nitrogen Input (NANI) Evolution and Total Nitrogen (TN) Concentration Response in Zhaoshandu Water Source. Nat. Environ. Pollut. Technol. 2020, 19, 1319–1325. [Google Scholar] [CrossRef]
  23. Levins, R. Evolution in Changing Environments: Some Theoretical Explorations (No. 2); Princeton University Press: Princeton, NJ, USA, 1968. [Google Scholar]
  24. Shipley, B. A new inferential test for path models based on directed acyclic graphs. Struct. Equ. Model. 2000, 7, 206–218. [Google Scholar] [CrossRef]
  25. Mamet, S.D.; Redlick, E.; Brabant, M.; Lamb, E.G.; Helgason, B.L.; Stanley, K.; Siciliano, S.D. Structural equation modeling of a winnowed soil microbiome identifies how invasive plants re-structure microbial networks. ISME J. 2019, 13, 1988–1996. [Google Scholar] [CrossRef] [PubMed]
  26. Ptacnik, R.; Solimini, A.G.; Andersen, T.; Tamminen, T.; Brettum, P.; Lepistö, L.; Rekolainen, S. Diversity predicts stability and resource use efficiency in natural phytoplankton communities. Proc. Natl. Acad. Sci. USA 2008, 105, 5134–5138. [Google Scholar] [CrossRef]
  27. Hodapp, D.; Hillebrand, H.; Striebel, M. “Unifying” the concept of resource use efficiency in ecology. Front. Ecol. Evol. 2019, 6, 233. [Google Scholar] [CrossRef]
  28. Zhu, S.; Dong, Z.; Fu, G.; Wu, S.; Meng, J.; Liu, W.; Zhou, Y. Distribution and dynamics of niche and interspecific association of dominant phytoplankton species in the Feiyun River basin, Zhejiang, China. J. Oceanol. Limnol. 2024, 42, 1157–1172. [Google Scholar] [CrossRef]
  29. Briddon, C.L.; Miclăuş, M.; Hegedüs, A.; Nicoară, M.; Chiriac, M.C.; Drugă, B. Long-term exposure to elevated temperature leads to altered gene expression in a common bloom-forming cyanobacterium. Limnol. Oceanogr. 2023, 68, 2654–2667. [Google Scholar] [CrossRef]
  30. Liang, Y.; Koester, J.A.; Liefer, J.D.; Irwin, A.J.; Finkel, Z.V. Molecular mechanisms of temperature acclimation and adaptation in marine diatoms. ISME J. 2019, 13, 2415–2425. [Google Scholar] [CrossRef]
  31. Mendes, C.R.B.; Costa, R.R.; Ferreira, A.; Jesus, B.; Tavano, V.M.; Dotto, T.S.; Secchi, E.R. Cryptophytes: An emerging algal group in the rapidly changing Antarctic Peninsula marine environments. Glob. Change Biol. 2023, 29, 1791–1808. [Google Scholar] [CrossRef]
  32. Luo, X.; Lan, W.L.; Li, T.S.; Li, M.M. Distribution of phytoplankton and its relationship with environmental factors in the Qinzhou Bay in spring and summer. Acta Ecol. Sin. 2019, 39, 2603–2613. [Google Scholar] [CrossRef]
  33. Wu, T.; Luo, L.; Cui, G.; Qin, B. Study on the Triggering Factors of Algal Bloom in Fuchunjiang Reservoir Based on a Vertically Integrated Hydrodynamic Model. In Advances in Water Resources and Hydraulic Engineering: Proceedings of 16th IAHR-APD Congress and 3rd Symposium of IAHR-ISHS; Springer: Berlin/Heidelberg, Germany, 2009; pp. 662–666. [Google Scholar]
  34. He, S.; Zhang, Y.; Li, N.; Shi, K.; Zhang, Y.; Qin, B.; Shao, K. Summer heatwaves promote harmful algal blooms in the Fuchunjiang Reservoir, an important drinking water source. J. Environ. Manag. 2024, 359, 121056. [Google Scholar] [CrossRef]
  35. Behrenfeld, M.J.; Boss, E.S.; Halsey, K.H. Phytoplankton community structuring and succession in a competition-neutral resource landscape. ISME Commun. 2021, 1, 12. [Google Scholar] [CrossRef]
  36. Yimin, L.; Xihao, S.; Chongying, G. Niche width and niche overlap: A method based on type-2 fuzzy sets. Ecol. Res. 2006, 21, 713–722. [Google Scholar] [CrossRef]
  37. Pastore, A.I.; Barabás, G.; Bimler, M.D.; Mayfield, M.M.; Miller, T.E. The evolution of niche overlap and competitive differences. Nat. Ecol. Evol. 2021, 5, 330–337. [Google Scholar] [CrossRef] [PubMed]
  38. Dory, F.; Nava, V.; Spreafico, M.; Orlandi, V.; Soler, V.; Leoni, B. Interaction between temperature and nutrients: How does the phytoplankton community cope with climate change? Sci. Total Environ. 2024, 906, 167566. [Google Scholar] [CrossRef] [PubMed]
  39. Schabhüttl, S.; Hingsamer, P.; Weigelhofer, G.; Hein, T.; Weigert, A.; Striebel, M. Temperature and species richness effects in phytoplankton communities. Oecologia 2013, 171, 527–536. [Google Scholar] [CrossRef]
  40. Yang, Y.; Zhao, R. Precipitation input increases biodiversity of planktonic communities in the Qinghai-Tibet Plateau. Sci. Total Environ. 2024, 947, 174666. [Google Scholar] [CrossRef] [PubMed]
  41. Fernández-González, C.; Tarran, G.A.; Schuback, N.; Woodward, E.M.S.; Arístegui, J.; Marañón, E. Phytoplankton responses to changing temperature and nutrient availability are consistent across the tropical and subtropical Atlantic. Commun. Biol. 2022, 5, 1035. [Google Scholar] [CrossRef]
  42. Zhao, Q.; Liu, S.; Niu, X. Effect of water temperature on the dynamic behavior of phytoplankton–zooplankton model. Appl. Math. Comput. 2020, 378, 125211. [Google Scholar] [CrossRef]
  43. Weisse, T.; Gröschl, B.; Bergkemper, V. Phytoplankton response to short-term temperature and nutrient changes. Limnologica 2016, 59, 78–89. [Google Scholar] [CrossRef]
  44. Liu, X.; Deng, J.; Li, Y.; Jeppesen, E.; Zhang, M.; Chen, F. Nitrogen reduction causes shifts in winter and spring phytoplankton composition and resource use efficiency in a large subtropical lake in China. Ecosystems 2023, 26, 1640–1655. [Google Scholar] [CrossRef]
  45. Liu, X.; Zhang, J.; Wu, Y.; Yu, Y.; Sun, J.; Mao, D.; Zhang, G. Intensified effect of nitrogen forms on dominant phytoplankton species succession by climate change. Water Res. 2024, 264, 122214. [Google Scholar] [CrossRef]
  46. Mesquita, M.C.; Graco-Roza, C.; de Magalhães, L.; Ger, K.A.; Marinho, M.M. Environmental variables outpace biotic interactions in shaping a phytoplankton community. Diversity 2024, 16, 438. [Google Scholar] [CrossRef]
  47. Huang, Z.; Pan, B.; Zhao, X.; Liu, X.; Liu, X.; Zhao, G. Hydrological disturbances enhance stochastic assembly processes and decrease network stability of algae communities in a highland floodplain system. Sci. Total Environ. 2023, 903, 166207. [Google Scholar] [CrossRef] [PubMed]
  48. Song, T.; Tu, W.; Luo, X.; Fan, M.; Chen, S.; Wang, B.; Yang, Y.; Li, S. Performance of ecological floating beds and microbial communities under different flow velocities. J. Water Process Eng. 2022, 48, 102876. [Google Scholar] [CrossRef]
  49. Eyring, S.; Reyes, M.; Merz, E.; Baity-Jesi, M.; Ntetsika, P.; Ebi, C.; Dennis, S.; Pomati, F. Five years of high-frequency data of phytoplankton zooplankton and limnology from a temperate eutrophic lake. Sci. Data 2025, 12, 653. [Google Scholar] [CrossRef]
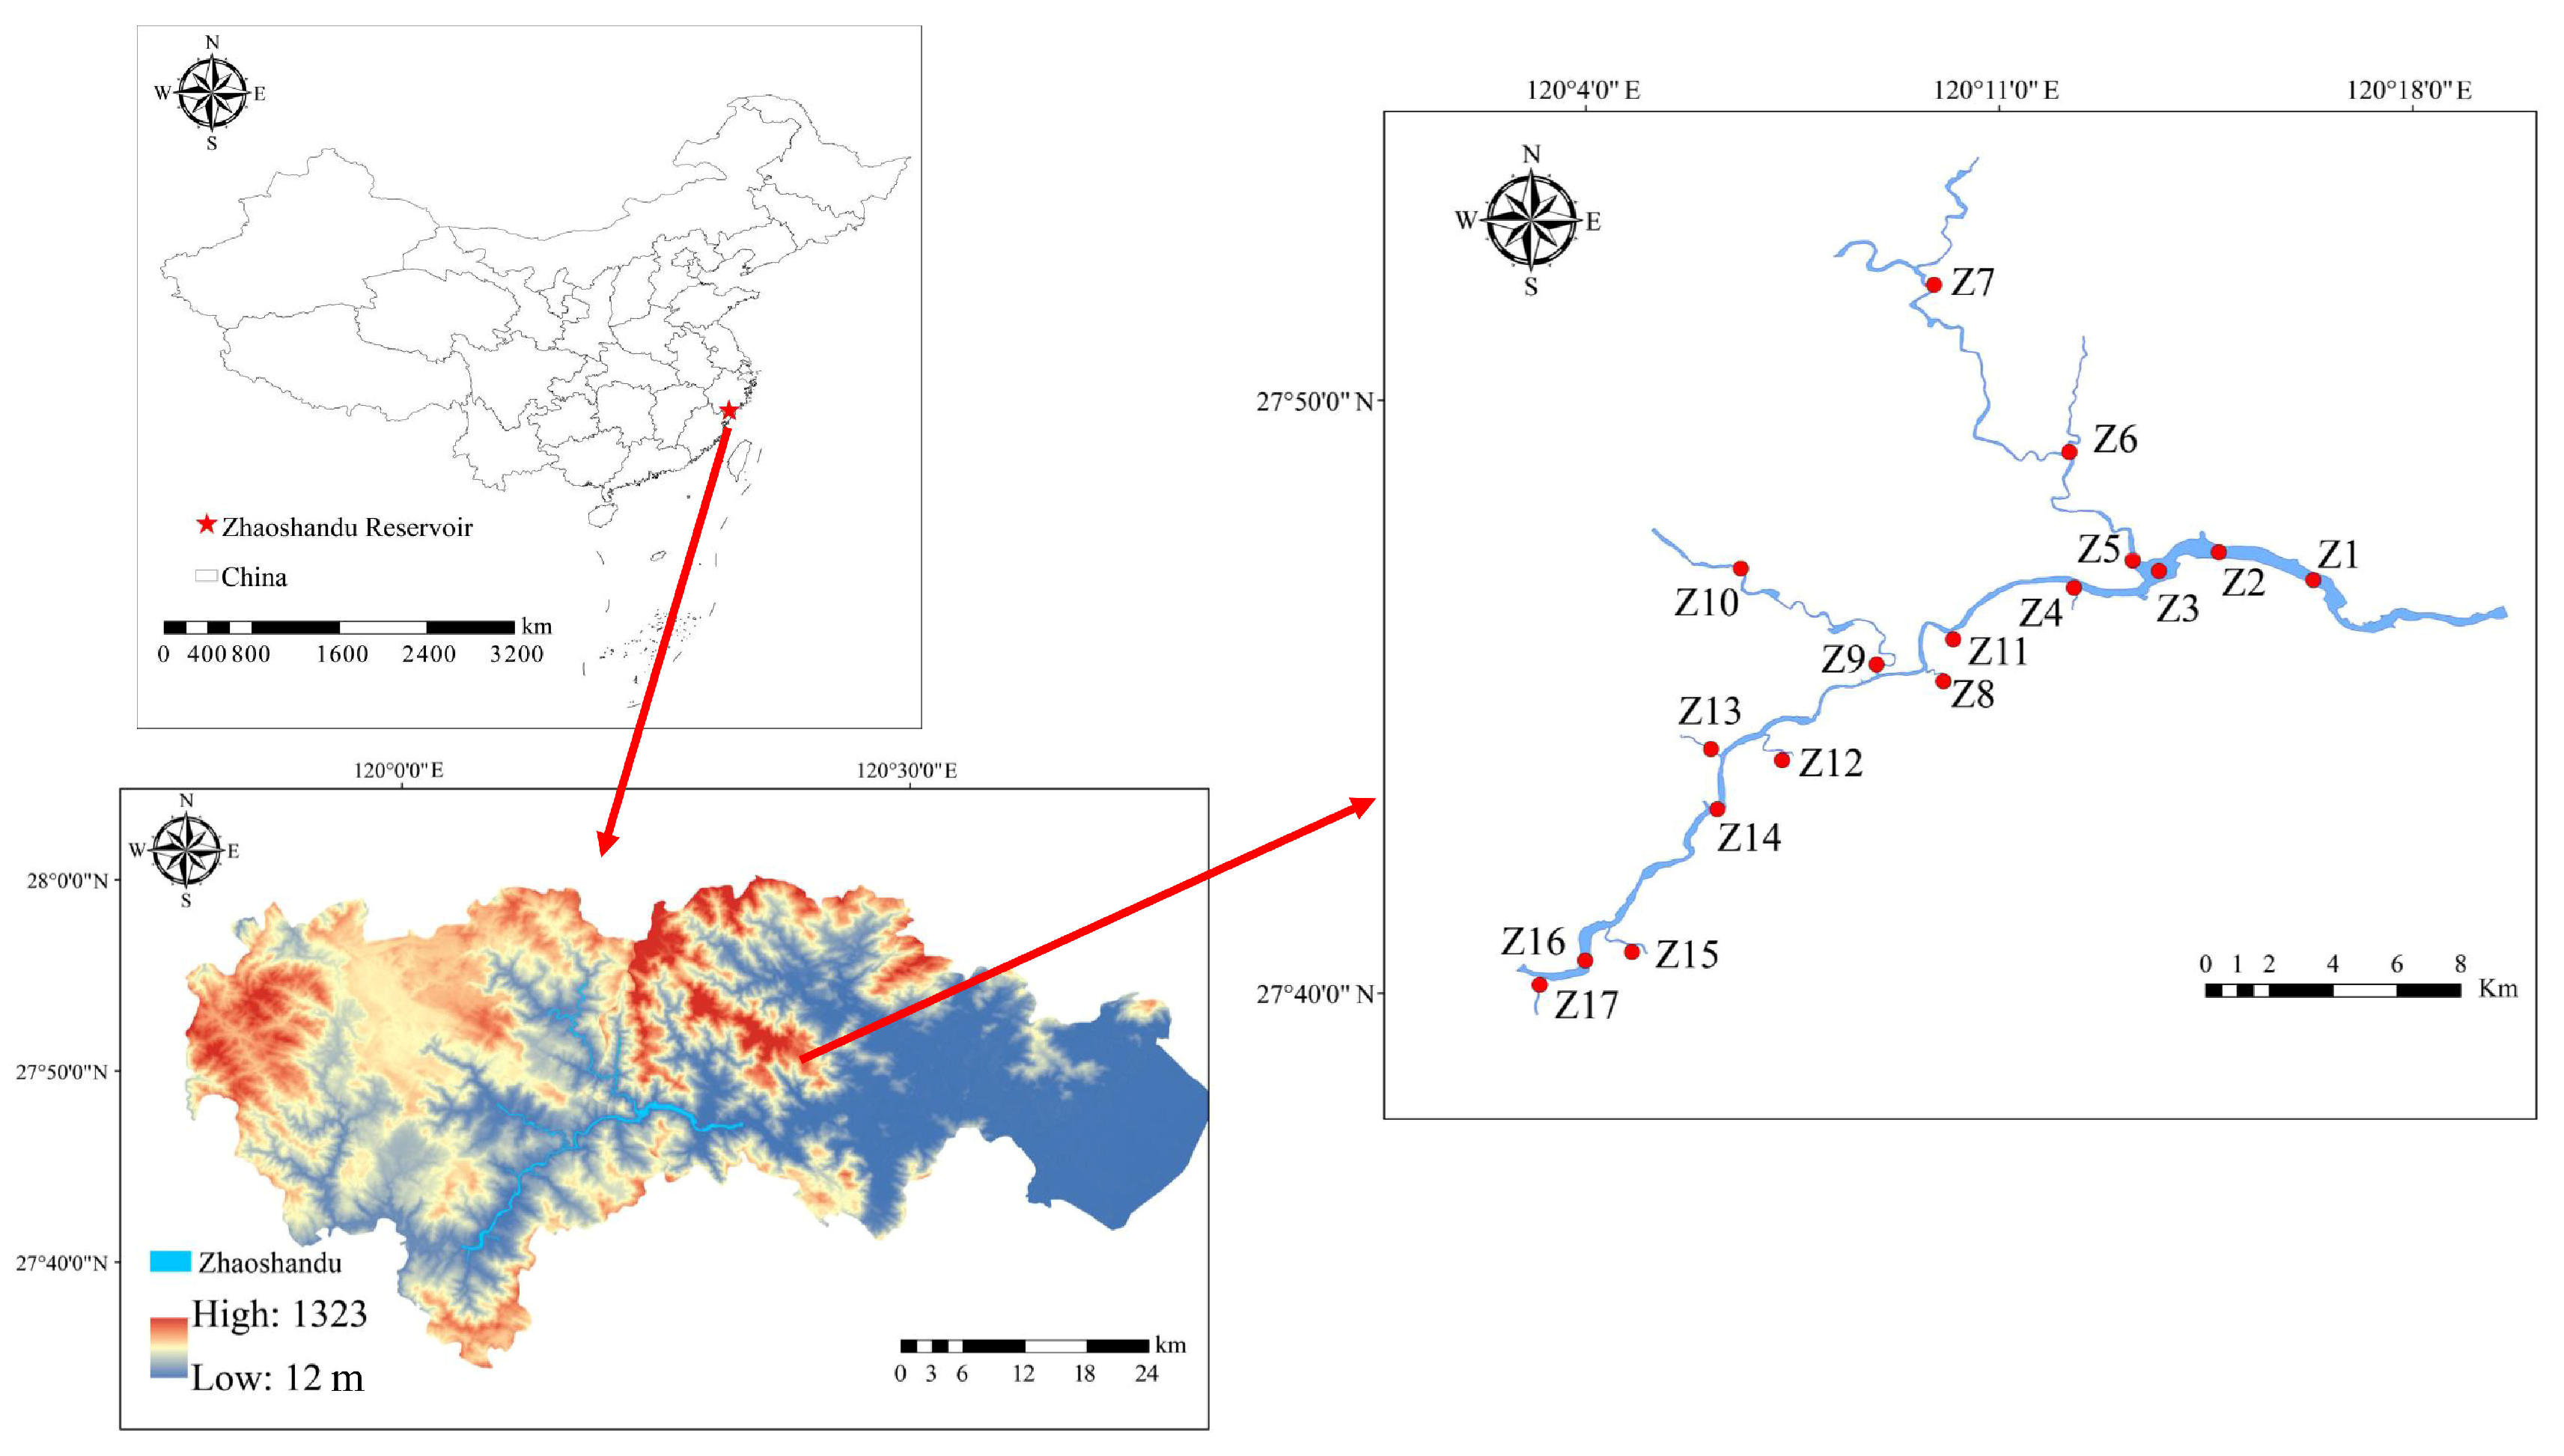
Figure 1. Location of the twenty sampling points in the Zhaoshandu Reservoir, Wenzhou, South China.
Diversity 17 00573 g001
Figure 2. Temporal dynamics of environmental factors. WT: water temperature; TP: total phosphorus; PO4-P: phosphate phosphorus; TN: total nitrogen NO3-N: nitrate nitrogen; NH4-N: ammonium nitrogen; CODMn: chemical oxygen demand; N/P: TN/TP; DO: dissolved oxygen; EC: electrical conductivity; Chl-a: Chlorophyll a; Turb: turbidity; TDS: total dissolve solid. Different letters represent significant differences between different groups.
Diversity 17 00573 g002
Figure 3. The Spearman correlation among environmental factors. *: p < 0.05; **: p < 0.01; ***: p < 0.001. WT: water temperature; TP: total phosphorus; PO4-P: phosphate phosphorus; TN: total nitrogen; NO3-N: nitrate nitrogen; NH4-N: ammonium nitrogen; CODMn: chemical oxygen demand; N/P: TN/TP; DO: dissolved oxygen; EC: electrical conductivity; Chl-a: Chlorophyll a; Turb: turbidity; TDS: total dissolve solid.
Diversity 17 00573 g003
Figure 4. Seasonal variations in the relative abundance of phytoplankton phyla in Zhaoshandu Reservoir. Each season in the figure consists of 60 bars, representing 20 data points from each of the three months. (a,c) represent the absolute density of algae at each sampling point, while (b,d) represent the relative density of algae at each sampling point.
Diversity 17 00573 g004
Figure 5. Non-metric multidimensional scaling analysis of the phytoplankton community in Zhaoshandu Reservoir on a seasonal scale; (a) cell density, (b) biomass. Non-metric multidimensional scaling analysis of the phytoplankton community in Zhaoshandu Reservoir along the rainfall gradient; (c) cell density, (d) biomass.
Diversity 17 00573 g005
Figure 6. RDA analysis of the phytoplankton community in Zhaoshandu Reservoir on a seasonal scale: (a) phytoplankton density, (b) phytoplankton biomass.
Diversity 17 00573 g006
Figure 7. (a) The correlation between phytoplankton α-diversity and water temperature. (b) The correlation between phytoplankton α-diversity and rainfall. (c) Correlation between phytoplankton β-diversity and water temperature, rainfall. R represents the degree to which the regression model explains the variance in the data, b denotes the slope, *** indicates p < 0.001.
Diversity 17 00573 g007
Figure 8. The structural equation model further reveals the causal relationships between water temperature, rainfall, and phytoplankton diversity, niche, density, and biomass in Zhaoshandu Reservoir. R represents the proportion of data variability explained by the regression model, *** denotes p < 0.001, and ** denotes p < 0.01. Red indicates a positive correlation between variables, while blue represents a negative correlation. Solid lines represent significant correlations, and dashed lines represent non-significant correlations. In this analysis, the NMDS1 axis is used to represent Bray–Curtis dissimilarity.
Diversity 17 00573 g008
Disclaimer/Publisher’s Note: The statements, opinions and data contained in all publications are solely those of the individual author(s) and contributor(s) and not of MDPI and/or the editor(s). MDPI and/or the editor(s) disclaim responsibility for any injury to people or property resulting from any ideas, methods, instructions or products referred to in the content.