Abstract
Shrimp farming has expanded over coastal areas in Mexico, particularly in the protected regions of Sonora and Sinaloa. Over the past 30 years, the economic activity associated with these farms has grown so much that the amount of shrimp produced in these ponds now exceeds that harvested from traditional shrimp fisheries. Establishing shrimp ponds has led to significant land changes. The construction of these ponds has fragmented local ecosystems, resulting in permanent alterations to areas such as floodplains, mangrove forests, and dunes, many of which are protected zones. This study aimed to investigate the long-term growth of shrimp farms from 1993 to 2022 and their impact on land-use changes in surrounding ecosystems, focusing on protected areas in the Sinaloa and Sonora coastal regions. We analyzed Landsat images using the Google Earth Engine platform. Our findings indicate that shrimp farm development over the past three decades has been extensive, with protected areas experiencing fragmentation and changes. Remote sensing and platforms like Google Earth Engine enable the effective monitoring of these spatiotemporal changes and their impacts, helping to identify the most affected areas.
1. Introduction
Shrimp farms in the Gulf of California currently occupy a significant portion of the Mexican coastal areas in Sonora and Sinaloa. During the last few decades (1993 to 2022), this economic activity has surpassed that of the shrimp fisheries in these regions [1,2,3,4,5,6,7,8,9,10,11,12,13,14,15,16,17,18,19,20,21,22,23,24,25,26,27,28]. Several authors [29,30,31,32] have already determined the impacts of shrimp ponds on coastal ecosystems to various environmental issues, including water pollution from organic matter, heavy metals, bacteria, and viruses. The contaminants enter the coastal ecosystem through the farm’s water exchange. Crop cycles and the periodicity of water exchange regulate the volume and timing of these discharges. Additionally, the farms’ latitudes influence the water exchange; those in the northern region experience greater evaporation and more significant water exchange than those in the southern region [33]. Although Mexican environmental legislation prohibits the expansion of shrimp farms due to the resulting extensive loss of natural habitats, the impact on natural vegetation, and the pollution of coastal and marine habitats, it has been observed even in protected areas along the Gulf of California.
Remote sensing is a powerful tool for analyzing changes in different types of land cover, including shrimp farms [34,35]. Furthermore, remote sensing can help evaluate the entry of contaminants, such as nitrogen and phosphorus, in farming activities [36]. It can also help monitor the effects of farm growth in coastal zones, particularly in areas without field measurements, such as the Gulf of California.
This manuscript addresses aquaculture development over areas cataloged as Biosphere Reserves or Ramsar sites. The objective of this study was to investigate the long-term growth of shrimp farms (from 1993 to 2022), their impact on land-use changes generated in the surrounding ecosystems located in the coastal and protected areas of the Gulf of California, and how researchers and decision-makers can apply tools such as Google Earth Engine [37] for quick estimation and knowledge of farm activities and their effects.
2. Materials and Methods
2.1. Study Area
Located east of the Gulf of California (northeastern Mexico), the study area (Figure 1) comprised the coastal areas of Sonora and Sinaloa. These states have a coastline of 1848 km [38]. The area’s extreme coordinates are 31.559° N, 115° W and 23.6° N, 106.61° W. Our study analyzed the expansion of shrimp farms inside and outside the Biosphere Reserves Cajón del Diablo (box 1 in Figure 1) and Marismas Nacionales (box 2 in Figure 1). Marismas Nacionales was decreed in 2010 [39] and is also a Ramsar site. Its management program divided the reserve into ten areas within two core zones. The area near Sinaloa, named the “subzone of human settlement El Roblito” allows for different human activities, including aquaculture. The Biosphere Reserve Cajón del Diablo in the Sonora State was decreed in 1937 [40] and does not have a management program. Currently, the limits and polygons of this Biosphere Reserve do not appear in the data catalog or the list of Biosphere Reserves published by the Mexican Commission for the Knowledge and Use of Biodiversity [41]. However, in 2000, it was part of Mexico’s Priority Regions Project [42].
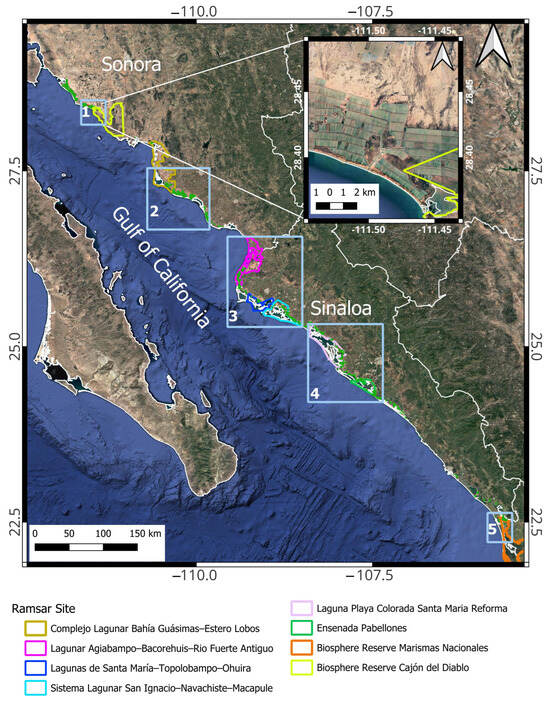
Figure 1.
Study area. The numbers in the boxes represent the order in which we present the results for the Ramsar sites or Biosphere Reserves where we analyzed pond expansion. Boxes 1 to 3 do not cover the entire protected area, as we focus solely on the sections that contain shrimp ponds. The figure provides a close-up view of the pond areas surrounding the Biosphere Reserve Cajón del Diablo.
Our study also included the following Ramsar zones experiencing aquaculture expansion inside and outside their limits: Complejo Lagunar Bahía Guásimas–Estero Lobos (box 3 in Figure 1) in the Sonora State; Sistema Lagunar Agiabampo–Bacorehuis–Rio Fuerte Antiguo, along the border of Sonora and Sinaloa; and Lagunas de Santa María–Topolobampo–Ohuira (box 4 in Figure 1), Sistema Lagunar San Ignacio–Navachiste–Macapule, Laguna Playa Colorada Santa Maria Reforma, and Ensenada Pabellones (box 5 in Figure 1) in the Sinaloa State.
2.2. Satellite Data Processing
We selected images from May to October for each classified year between 1993 and 2022, concentrating on the active periods of the farms. This approach allowed us to identify the ponds that were in use without considering when they were constructed. The image processing (definition of training points by category, selection of Landsat image by date, selection of bands for training, selection of classification algorithm, and downloading of the classified image) was performed in Google Earth Engine. For the 1993 to 2010 land cover classifications, we used the averaged reflectance of Landsat 5 Surface Reflectance Tier 1, which was atmospherically corrected using the Landsat Ecosystem Disturbance Adaptive Processing System with clouds, shadows, water, and snow masks. For the 2003, 2004, 2011, and 2012 land cover classifications, we used the averaged reflectance of Landsat 7 Surface Reflectance Tier 1. For the 2013 to 2021 classifications, we used Landsat 8 Atmospherically Corrected Surface Reflectance Tier 1 using the 1 Land Surface Reflectance Code. For the 2022 classification, we used the Landsat 9 Collection 2 Tier 1 Top of Atmosphere Reflectance. Because of extreme cloudiness in certain areas, we could not estimate most of the shrimp pond areas in 2012. For this year, we obtained the areas using the equation for shrimp pond area estimation as a function of time (in years), published in [43]. This equation is the result of a linear regression (a = −7,374,695 + 3703 t, r2 = 0.936). As shown in [43], the trend of the pond area, represented by the equation, was a continuous growth from 1993 to 2021.
We trained an algorithm based on the random forest classification [41,42] to obtain water, soil, and vegetation classes. Random forest classification implements a combination of tree predictors in such a way that each one depends on the values of a random vector sampled independently and with the same distribution for all trees in the forest, generating an effective tool for prediction. The random forest classification algorithm did not work on the pixels corresponding to areas that we masked out using the non-pond water bodies layer (coastal lagoons and permanent water bodies). We generated this mask using QGIS version 3.16 software [44]. The mask had a maximum width of 5 km from the sea to the continent, covering the shrimp farm locations. The land classification area covered an average of 1,482,936 ha. We applied another mask each year to the random forest classification to filter out temporary water bodies mixed into the farms’ ecosystems and to ensure high accuracy when assessing the total shrimp pond area. A Google Earth Engine example script is linked here: https://code.earthengine.google.com/82b0944f4e414bec0b376fb2b34526ec (accessed on 27 January 2025).
We applied the methodology proposed by Olofsson et al. [45] to assess the accuracy and validate the classification results. As we did not have other reference images for the accuracy assessment, we validated the Landsat classification by taking true color and infrared composites of the same image as references. As [44] pointed out, validating the classification of Landsat images against other products of the same Landsat images is possible when no other reference images are available. As we studied the farm’s expansion in the past 30 years (from 1993 to 2022), it was impossible to perform the ground-truthing. Following [44], we calculated the sample size and assigned it to the classified categories, called the sample allocation to strata by these authors. They propose to use the estimated lowest standard errors as criteria for selecting sample allocation, which can be equal, proportional, or an allocation that gives more sample units to the rare class stratum. According to these criteria, the allocation that took the class ponds as a rare class (with at least 120 sample units for it) was the most selected in the present study. The ponds class was taken as the rare class, as it had the smallest area among the three categories. Table A3 in the Appendix A lists the standard errors of the selected sample allocation by class. We used a standard error of the selected estimated overall accuracy S(ÔN) of 0.15. The sample consisted of 400 points divided into three classes (pond, soil, and vegetation) and distributed randomly within their polygons. As proposed in [44], we obtained the estimated area by multiplying the estimated area proportions by the total map area. Estimations of the area confidence intervals were obtained by multiplying the standard error for the estimated area (S(Ûp), the total map area, and the confidence interval error margin (1.96).
3. Results
Table 1 shows the commission and omission errors for the class ponds and the overall accuracy of the classifications. On average, we obtained 2%, 1%, and 94%, respectively, which indicates good performance. Figure 2 shows the assessed area value in the center of the 95 percent confidence intervals for each classified year (gray bars). Figure 2 also shows that the overall accuracy of the classifications by year was mostly above 90% (light brown bars). We estimated 6741 ha of active shrimp farms in 1993, whereas by 2022, the total active area of the shrimp farms was more than 102,906 ha. We observed peaks of pond area for the years 1997, 2011, 2013, and 2014, indicating an increase of more than 100% and a decrease of less than 25% for 1998 and 2010, respectively. During the studied period, the pond area increased at an annual average of 19.5% compared to the prior year. Thus, the entire area of shrimp farms grew by more than 1400% during the studied period compared to the 1993 value (see Figure 2). These results highlight the significant development of shrimp ponds over the thirty years considered in the study.

Table 1.
Commission and omission errors of the pond class and overall accuracy of the land cover classification from 1993 to 2020.
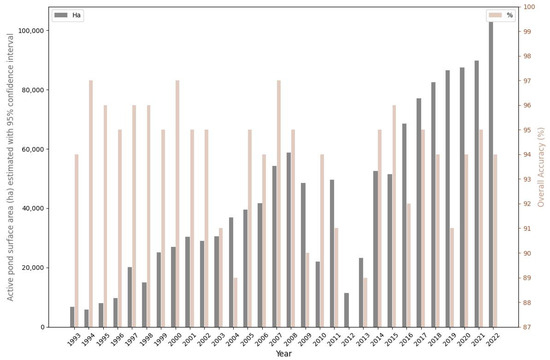
Figure 2.
Expansion of the shrimp pond area from 1993 to 2022 along the Gulf of California. The plot shows bars with the total area in Ha per year of the ponds in the region and overall accuracy bars in %.
Shrimp Pond Expansion from 1993 to 2022 in the Coastal and Protected Areas
Figure 3 shows the long-term invasion of shrimp farms in the Biosphere Reserve Marismas Nacionales. We did not detect ponds inside this Biosphere Reserve in 1993. In this case, the expansion of ponds began in 2000. For this year, we detected approximately 15 ha (see Table A2 in the Appendix A, which shows the annual growth of farms in ha for reserves and Ramsar sites inside and on the outer limits of their polygons). According to our results, twenty-two years later, the construction of ponds inside the reserve reached more than 473 ha, representing a growth of 3128% compared to 2000.
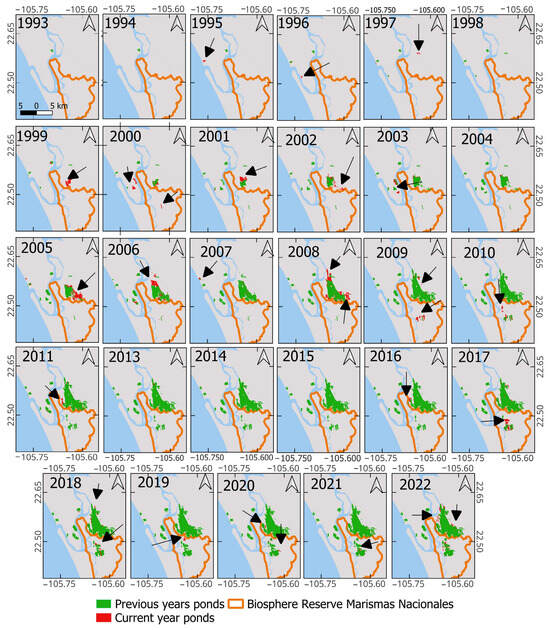
Figure 3.
The long-term expansion of the shrimp ponds in the Biosphere Reserve Marismas Nacionales. The arrows indicate the locations of the new ponds constructed in the indicated year.
Figure 4 shows the same process for the Biosphere Reserve Cajón del Diablo. Farms first appeared inside the reserve in 2004 with the development of approximately 4 ha. By 2005, we detected the construction of 816 ha, indicating a massive increase of 21658% regarding the previously constructed ponds (see Table A2). By 2022, we detected the construction of 1236 ha inside the reserve (see Table A2).
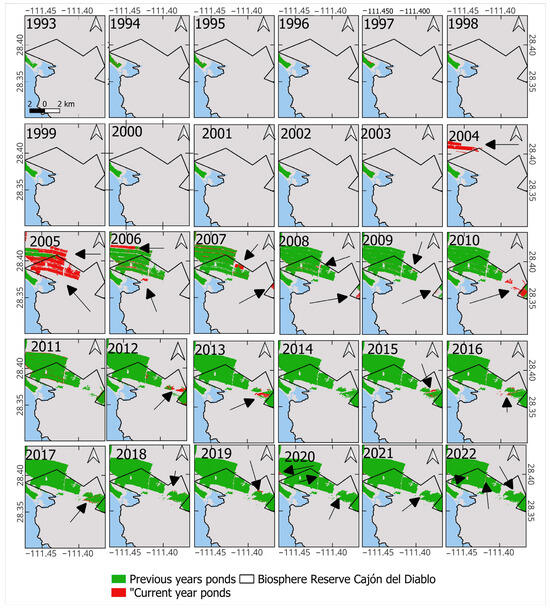
Figure 4.
The long-term expansion of shrimp ponds in the Biosphere Reserve Cajón del Diablo. The arrows indicate the locations of the new ponds constructed in the indicated year.
Figure 5 shows the process for the Complejo Lagunar Bahía Guásimas–Estero Lobos. In the case of this Ramsar zone and its periphery, we observed different moments of non-intensive growth inside the Ramsar zone during the years 1996, 2000, 2004, 2009, and 2016. In terms of newly constructed ponds inside the site, the corresponding areas for these years were 390, 799, 1022, 2142, and 2727 ha (see Table A2).
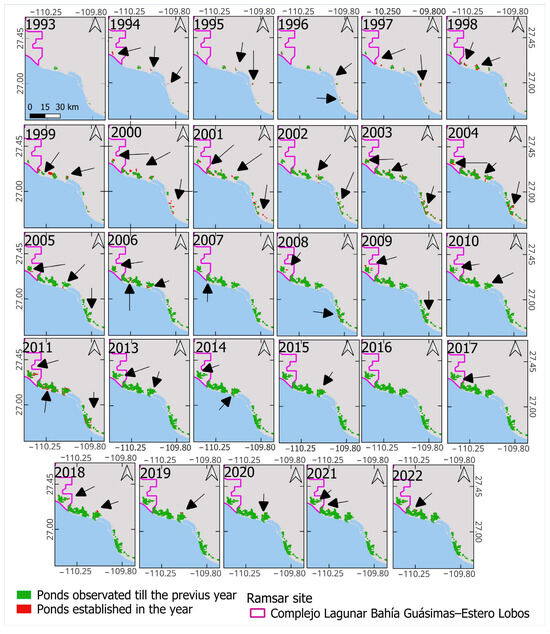
Figure 5.
The long-term expansion of shrimp ponds in the Complejo Lagunar Bahía Guásimas–Estero Lobos. The arrows indicate the locations of the new ponds constructed in the indicated year.
Figure 6 shows the results of the pond expansion for the Ramsar sites Lagunas de Santa María–Topolobampo–Ohuira, Sistema Lagunar San Ignacio–Navachiste–Macapule, and Sistema Lagunar Agiabampo–Bacorehuis–Rio Fuerte Antiguo. We observed two main periods of explosive growth for these sites from 1995 to 1999. In the Sistema Lagunar Agiabampo–Bacorehuis–Rio Fuerte Antiguo, we estimated 471 ha of ponds in 1994. In 1997, we detected the highest growth, with 2106 ha (a 113% increase in the maximum development compared to previous years). Sistema Lagunar San Ignacio–Navachiste–Macapule behaved similarly. In 1995, we estimated the pond area inside the Ramsar site to be 363 ha; by 1997, this value was 1265 ha (a 248% increase in the maximum development compared to previous years). Meanwhile, for the Lagunas de Santa María–Topolobampo–Ohuira Ramsar site, we observed an increase of 34 ha of newly constructed ponds in 2014. By 2017, this value was 107 ha, representing a 200% growth. The shrimp ponds within the Ramsar site continued growing until 2022, when the area reached more than 940 ha (see Table 2, Table A2 and Table A3).
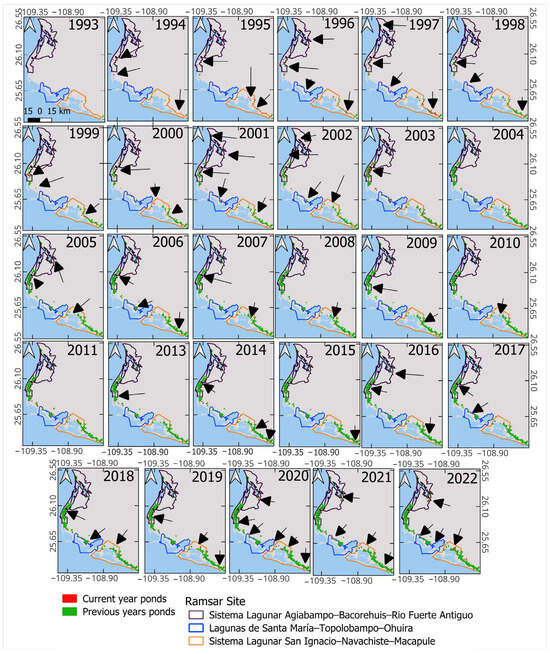
Figure 6.
The long-term expansion of shrimp ponds within the sites of Sistema Lagunar Agiabampo–Bacorehuis–Rio Fuerte Antiguo, Lagunas de Santa María–Topolobampo–Ohuira, and Sistema Lagunar San Ignacio–Navachiste–Macapule. The arrows indicate the locations of the new ponds constructed in the indicated year.
Table 2.
Years of intensive growth in the maximum development of previous years for the Biosphere Reserves and Ramsar sites. Bold numbers indicate growth higher than the previous maximum growth.
Shrimp farm development has steadily increased across all studied areas (see Figure 3, Figure 4, Figure 5, Figure 6 and Figure 7 and Table A1 and Table A2). Notably, in specific years, the construction of new farms surged, with new pond areas exceeding the previous maximums by over 100%. For instance, in the Ramsar area Laguna Playa Colorada Santa Maria Reforma (shown in Figure 7), the shrimp pond area was 363 ha in 1996; by the following year, it grew to 1422 ha, representing a 291% increase (see Table 2).
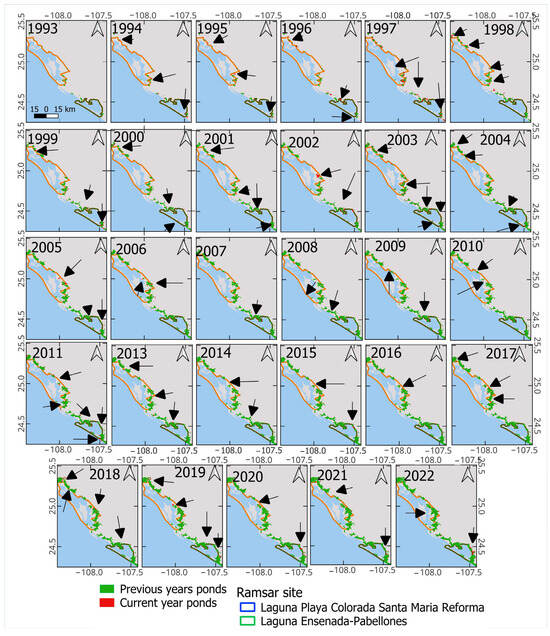
Figure 7.
The long-term expansion of shrimp ponds within the sites Laguna Playa Colorada Santa Maria Reforma and Ensenada Pabellones. The arrows indicate the locations of the new ponds constructed in the indicated year.
The growth rate observed in the study area, which includes all protected regions, was nearly 20 percent higher than the previous year (see Table A1 and Table A2 in the Appendix A). Furthermore, we identified peak growth periods across the protected areas studied, taking the highest values from prior years as a reference. For instance, Biosphere Reserve Marismas Nacionales grew by 840% in 2009, Cajón del Diablo by 21,658% in 2009, Complejo Lagunar Bahía Guásimas–Estero Lobos by 105% in 2000, Lagunas de Santa María–Topolobampo–Ohuira by 696% in 2006, Sistema Lagunar Agiabampo–Bacorehuis–Rio Fuerte Antiguo by 100% in 1994, Sistema Lagunar San Ignacio–Navachiste–Macapule by 248% in 1997, Ensenada Pabellones by 49% in 2005, and Laguna Playa Colorada Santa Maria Reforma by 291% in 1997 (see Table 2).
4. Discussion
We studied the long-term growth of shrimp farms from 1993 to 2022 and their impact on land change generated in the protected areas located in the coastal areas of the Gulf of California. In the next paragraphs, we discuss aspects related to the following topics: image classification and accuracy assessment, shrimp farm expansion and its effects on protected areas, and the use of Google Earth Engine in similar studies.
The confidence intervals of the shrimp pond areas estimated using the methodology of Olofsson et al. [45] applied to the classified Landsat images could be affected by temporary water bodies that vary each year. Data were missing (NA in Table A2 in the Appendix A) due to cloud cover for specific periods, such as 2013, 2015, and 2022. Because we could not find suitable images for 2012, we estimated the area using an equation of area as a function of time, proposed in [43]; we additionally confirmed the values of area by comparing it against the official records of shrimp production [9]. We confirmed that 2012 had low production values, which indicates that the area obtained using the equation is correct. The results of our assessment, specifically an overall agreement of 0.9 or higher (s. Figure 2) and obtained applying the Oloffson et al. [44] method, confirmed the accuracy of our estimated long-term expansion from 1993 to 2022.
The rapid growth of aquaculture farms over protected areas has attracted our attention. The total area of shrimp farms has continuously increased. In particular, the total area of shrimp ponds increased significantly in 1997, 2001, 2008, 2016, and 2022. The area obtained for 2022 in our work exceeded the value estimated in [43]. This difference can be explained by various factors, such as the effect of white spot disease and other diseases that cause the inactivation of ponds [46] or the masking of ponds by clouds in the satellite classification, which could generate noise in our estimates.
One of the main concerns of shrimp pond development is the debris entering the water column of the lagoons and marine areas through the water exchange and pond cleaning, which generates and increases nutrients, organic matter, and sediments in these ecosystems [31,33,47,48,49]. Concurrently, with these nutrient increases in water bodies, other sources of nutrients must be considered, such as agriculture, livestock, urban zones, and other types of industries in the region [50]. Researchers [31,33,51,52] have observed different compounds and biomass discharged into the surrounding ecosystems from the ponds during the study period, as well as increases in organic matter, nutrients, heavy metals, and water with different salinities. In addition, it is worth noting that some of the soil excavated to create the ponds could increase sediments, which enter the water column instead of being swept away by rain or wind. Another key concern is the introduction of new pathogens into the surrounding ecosystems.
The 2022 shrimp pond area we detected in the coastal lagoons of Sinaloa comprises 81% of the total estimated shrimp pond area in Sinaloa and Sonora. In Sinaloa, almost 55% of the shrimp ponds are located near a Ramsar site, and in Sonora, this value is 26%, indicating that most shrimp farm development has taken place along the coastal lagoons of Sinaloa. Our image classification results indicated a significant decrease in active ponds detected from 2009 to 2013 compared to previous years. Some authors [43,53,54] attribute this decrease to the presence of diseases such as early mortality syndrome.
The development of aquaculture in protected areas such as the Biosphere Reserve Marismas Nacionales affects mangroves, coastal vegetation, and coastal water bodies. In the case of this Biosphere Reserve, shrimp farm development began in 2009 and continued to grow until 2022. The decree and the management program do not specify whether the construction of new ponds is allowed after the year of the decree [39]; however, the management program stipulates that it is not permitted to “Interrupt, fill, drain or divert hydraulic flows, and modify the natural conditions of aquifers, hydrological basins, natural stream channels, springs, riverbanks, and basins” [55]. This regulation needs to be implemented, given the observed development of aquaculture farms, which could modify the conditions of the aquifer and fragment the environment.
Shrimp pond development in the Biosphere Reserve Cajón del Diablo began in 2005 and continued until 2014. The situation of this reserve is critical because, as previously mentioned, it does not have a management program, and its limits and polygons need to be precisely defined and well managed. According to [56], “the reserve does not receive attention or management for prolonged periods, the limits have been lost, and it is difficult to locate it precisely”.
Another example of land change due to shrimp ponds in Sinaloa is the coastal lagoon Ensenada Pabellones. The shrimp ponds have altered the peripheral ecosystems near this complex lagoon, leading to the development of overflood areas and vegetation such as mangles, bushes, and marshes, which partially contribute to the fragmentation of these ecosystems. References [47,57] have reported related land changes due to aquaculture farms.
It is worth noting that farms grew explosively within the protected areas studied and in their peripheries. For example, in 2009, new ponds were created within the Biosphere Reserve Marismas Nacionales polygon; these ponds represent a peak of more than 800% of what was previously built, i.e., during 2008. That year, there were about 16 ha of shrimp ponds, and by 2009, there was an increase of more than 157 ha.
Regarding Ramsar zones, farms occupied areas around Lagunas de Santa María–Topolobampo–Ohuira from 1997 to 2001. In 2006, the construction of ponds within the Ramsar site reached its first peak, and the construction of new shrimp ponds continued from 2017 to 2022. In the case of Sistema Lagunar Agiabampo–Bacorehuis–Rio Fuerte Antiguo and Sistema Lagunar San Ignacio–Navachiste–Macapule, the development of ponds began in 1994 and continued until the early 2000s.
As discussed, shrimp farms have expanded along the east coast of the Gulf of California over subtropical and desertic zones and into several coastal lagoons, cataloged as Ramsar sites. We observed the construction of new farms inside Ramsar areas and in their margins. This expansion implies that these areas must be managed appropriately as naturally protected areas, and management plans should be established for each site, as pointed out in [58]. These wetlands function as carbon sinks, fish nurseries, passages for migratory birds [59], and refuges for endangered species, such as the jaguar [60].
The legacy of Landsat 5, 8, and 9 on the Google Earth Engine platform allowed us to quickly assess the expansion of this economic activity in the coastal zone of the Gulf of California [61]. Although we could not estimate the areas for some in 2012 because of a lack of images or cloudiness, land change near and inside the coastal protected areas was detected. Regarding our results, it is possible to monitor the growth and effects of this industry on coastal ecosystems (including protected areas) using remote sensing platforms such as Google Earth Engine. However, combining the information obtained with remote sensing analyses with field data about water quality measurements, pollutants, and bioindicators is necessary to understand environmental and ecological problems better. Local and scientific communities, institutions, and government offices in charge of verifying compliance with environmental regulations should be involved in implementing projects concerning the change in location of old shrimp farms and the construction of new ponds. Determining the environmental effects of these activities and regulating waste from shrimp farms are indispensable for the sustainable management of this economic activity, which is already widely distributed throughout the Gulf of California, invading protected areas.
5. Conclusions
Despite the Mexican environmental legislation forbidding the extensive loss of natural habitats due to the impact on natural vegetation in protected areas, vast shrimp farm development has occurred over the last 30 years. Aquaculture farms were continuously developed and expanded by almost 1400% along the Gulf of California between 1993 and 2022. Consequently, different ecosystems have been reduced, fragmented, or altered, even in protected areas. In addition, this type of aquaculture generates the entry of various compounds and pathogens into the ecosystems supporting these ponds. Remote sensing and new platforms, such as Google Earth Engine, allow us to monitor these changes and identify where ecosystems are threatened and require more supervision. These tools can help improve, at a low cost, the understanding of these economic activities and other factors affecting ecosystems.
The establishment of shrimp ponds within Ramsar areas and Biosphere Reserves is clear. There is a need for greater control over the areas where these activities can occur and their impact on the surrounding ecosystems. Using remote sensing, we have proved the long-term growth of shrimp ponds within Ramsar sites and Biosphere Reserves. This expansion highlights the urgent need for stronger regulations concerning the locations where these activities can take place and their impact on surrounding ecosystems. Remote sensing provides an effective means to monitor this growth. However, it is also crucial to develop ecological approaches integrating remote sensing with field data to understand the effects on coastal ecosystems comprehensively.
Author Contributions
D.A.G.-R.: conceptualization, methodology, software, validation, formal analysis, investigation, data curation, and environmental analysis. A.O.-R.: supervision, conceptualization, legislative research, and environmental analysis; F.-O.T.-S.: writing, supervision, conceptualization, methodology, software, validation, formal analysis, and investigation. All authors have read and agreed to the published version of the manuscript.
Funding
This research was funded by CONAHCYT with the postdoctoral scholarship number 419362 and the Biological and Health Sciences Division of the Autonomous Metropolitan University Iztapalapa.
Data Availability Statement
The original data presented in the study are openly available in ‘Shirmp_Farms’ at https://github.com/Dagriva/Shirmp_Farms (accessed on 27 January 2025).
Acknowledgments
We acknowledge CONAHCYT for providing the postdoctoral scholarship number 419362, the UAM-I postgraduate program of “Energía y Medio Ambiente”, the CIBNOR doctoral program in science “Uso, Manejo y Preservación de los Recursos Naturales”, and the Divisional Project “Estudio desde la Geomática de sistemas acuáticos y cuencas de México, como base para su gestión ambiental’ funded by the Biological and Health Sciences Division of the Autonomous Metropolitan University Iztapalapa.
Conflicts of Interest
Authors declare no conflicts of interest.
Appendix A
Table A1.
Area by year and percentage growth compared to the previous year.
Table A1.
Area by year and percentage growth compared to the previous year.
| Year | Area (ha) | Percentage Concerning 1993 | Percentage Concerning Last Year |
|---|---|---|---|
| 1993 | 6741.9 | NA | NA |
| 1994 | 5852.3 | −13.2 | −13.2 |
| 1995 | 7950.5 | 17.9 | 35.9 |
| 1996 | 9665.2 | 43.4 | 21.6 |
| 1997 | 20,117.6 | 198.4 | 108.1 |
| 1998 | 15,026.6 | 122.9 | −25.3 |
| 1999 | 25,094.6 | 272.2 | 67.0 |
| 2000 | 26,993.5 | 300.4 | 7.6 |
| 2001 | 30,436.5 | 351.5 | 12.8 |
| 2002 | 29,002.4 | 330.2 | −4.7 |
| 2003 | 30,535.4 | 352.9 | 5.3 |
| 2004 | 36,849.4 | 446.6 | 20.7 |
| 2005 | 39,531.7 | 486.4 | 7.3 |
| 2006 | 41,655.5 | 517.9 | 5.4 |
| 2007 | 54,283.9 | 705.2 | 30.3 |
| 2008 | 58,794.6 | 772.1 | 8.3 |
| 2009 | 48,570.4 | 620.4 | −17.4 |
| 2010 | 22,067.3 | 227.3 | −54.6 |
| 2011 | 49,642.5 | 636.3 | 125.0 |
| 2012 | 11,438.4 | 69.7 | −77.0 |
| 2013 | 23,187.2 | 243.9 | 102.7 |
| 2014 | 52,628.7 | 680.6 | 127.0 |
| 2015 | 51,433.7 | 662.9 | −2.3 |
| 2016 | 68,478.0 | 915.7 | 33.1 |
| 2017 | 77,129.7 | 1044.0 | 12.6 |
| 2018 | 82,563.5 | 1124.6 | 7.0 |
| 2019 | 86,573.7 | 1184.1 | 4.9 |
| 2020 | 87,550.3 | 1198.6 | 1.1 |
| 2021 | 89,747.3 | 1231.2 | 2.5 |
| 2022 | 102,906.0 | 1426.4 | 14.7 |
| Average | 44,334.7 | NA | 19.5 |
Table A2.
Estimated area of shrimp ponds per year inside and outside Biosphere Reserves and Ramsar sites.
Table A2.
Estimated area of shrimp ponds per year inside and outside Biosphere Reserves and Ramsar sites.
| Year | Biosphere Reserve Marismas Nacionales | Biosphere Reserve Cajón del Diablo | Complejo Lagunar Bahía Guásimas–Estero Lobos L | Sistema Lagunar Agiabampo–Bacorehuis–Rio Fuerte Antiguo | Lagunas de Santa María–Topolobampo–Ohuira | Sistema Lagunar San Ignacio–Navachiste–Macapule | Laguna Playa Colorada Santa Maria Reforma | Ensenada Pabellones | ||||||||
|---|---|---|---|---|---|---|---|---|---|---|---|---|---|---|---|---|
| FLIL* | FLOL** | FLIL | FLOL | FLIL | FLOL | FLIL | FLOL | FLIL | FLOL | FLIL | FLOL | FLIL | FLOL | FLIL | FLOL | |
| 1993 | 0 | 433.66 | 0 | 197.17 | NA | 575 | 235 | NA | NA | 41 | 227 | 351 | 354 | 1558 | NA | 959 |
| 1994 | 0 | 213.16 | 0 | 219.62 | 287 | 580 | 471 | 142 | NA | 45 | 56 | 478 | 210 | 1155 | 43 | 474 |
| 1995 | 0 | 178.15 | 0 | 235.16 | NA | 657 | 824 | 190 | NA | NA | 293 | 989 | 245 | 1237 | 49 | 995 |
| 1996 | 0 | 146.29 | 0 | 260.7 | 390 | 672 | 990 | 463 | 0 | 53 | 363 | 624 | 363 | 1779 | 177 | 581 |
| 1997 | 0 | 718.79 | 0 | 249.89 | NA | 973 | 2106 | 484 | NA | 135 | 1265 | 1998 | 1422 | 3863 | 304 | 2967 |
| 1998 | 0 | NA | 0 | 267.02 | NA | 2263 | 2656 | 790 | 1 | 274 | 468 | 1705 | 1045 | 3801 | NA | NA |
| 1999 | 0 | 932.84 | 0 | 291.16 | 362 | 4080 | 3543 | 826 | 1 | 387 | 592 | 2037 | 1043 | 2954 | 285 | 3040 |
| 2000 | 14.67 | 700.71 | 0 | 151.8 | 799 | 3860 | 3908 | 691 | 1 | 428 | 1155 | 2360 | 1223 | 4535 | 354 | 2864 |
| 2001 | NA | 769.69 | 0 | 281.14 | 576 | 5343 | 5410 | 988 | 1 | 626 | 999 | 2006 | 1056 | 4054 | 213 | 2322 |
| 2002 | 8.31 | 1166.32 | 0 | 225.22 | 633 | 3446 | 3455 | 1049 | 4 | 577 | 850 | 1405 | 1791 | 3398 | 361 | 2582 |
| 2003 | NA | 829.82 | NA | 341.57 | 493 | 2293 | 7910 | 1128 | 1 | 651 | 1074 | 2093 | 1169 | 5177 | 152 | 1211 |
| 2004 | NA | 580.99 | 3.75 | 508.59 | 1022 | 4739 | 7833 | 719 | 1 | 712 | 689 | 2271 | 1033 | 4758 | 393 | 1937 |
| 2005 | 2.28 | 1753.1 | 816.35 | 1423.94 | 1223 | 4312 | 3297 | 778 | 1 | 637 | 1183 | 2252 | 1813 | 3652 | 586 | 3191 |
| 2006 | 14.13 | 2156.15 | 740.83 | 1585.99 | 1374 | 5529 | 4980 | 959 | 29 | 971 | 1191 | 2331 | 1927 | 4266 | 418 | 3134 |
| 2007 | NA | 1064.73 | 471.6 | 2072.36 | 1254 | 6083 | 8785 | 1196 | 2 | 1159 | 1524 | 3456 | 1152 | 6021 | 500 | 5085 |
| 2008 | 16.79 | 3180.68 | 851.09 | 1956.38 | 1298 | 6501 | 7201 | 1282 | 2 | 1344 | 1690 | 3609 | 1301 | 5951 | 608 | 4396 |
| 2009 | 157.92 | 1930.4 | 648.62 | 1007.14 | 2142 | 6439 | 6744 | 1213 | 8 | 1261 | 1360 | 3426 | 1831 | 4838 | 654 | 4883 |
| 2010 | 233.15 | 2235.13 | 743.87 | 1525.94 | 1326 | 2586 | 2082 | 259 | 5 | 804 | 1133 | 1084 | 512 | 980 | 70 | 904 |
| 2011 | 3.95 | 1261.89 | 777.26 | 1746.83 | 2124 | 6022 | 6160 | 1122 | 12 | 1410 | 1240 | 2227 | 1391 | 4830 | 387 | 3594 |
| 2012 | NA | NA | 913.24 | 1536.66 | NA | NA | NA | NA | NA | NA | NA | NA | NA | NA | NA | NA |
| 2013 | 5.69 | 541.38 | 448.51 | 162.74 | 1160 | 1333 | 1690 | 652 | 22 | 648 | 981 | 1604 | 1368 | 3087 | 394 | 3467 |
| 2014 | NA | 781.57 | 383.44 | 1272.26 | 1925 | 5203 | 8291 | 1540 | 34 | 1126 | 1907 | 3934 | 1665 | 6062 | 618 | 5289 |
| 2015 | NA | NA | 735.8 | 2006.16 | 1986 | 4493 | 7056 | 1477 | 8 | 1128 | 1806 | 3761 | 3044 | 5881 | 905 | 5740 |
| 2016 | NA | 712.75 | 1099.12 | 2792.82 | 2727 | 6115 | 9089 | 1864 | 14 | 1653 | 2222 | 4618 | 3263 | 7386 | 722 | 6051 |
| 2017 | 449.59 | 1414.77 | 1213.26 | 2911.3 | 2427 | 6578 | 11,489 | 2145 | 102 | 1820 | 2558 | 4764 | 4871 | 8889 | 944 | 5877 |
| 2018 | 234.03 | 1591.85 | 1075.79 | 3020.02 | 2723 | 6319 | 11,317 | 1955 | 204 | 2098 | 2723 | 5201 | 5410 | 10,179 | 1353 | 7477 |
| 2019 | 91.62 | 988.25 | 1190.68 | 3435.02 | 2883 | 6828 | 12,069 | 2144 | 368 | 2142 | 3449 | 5665 | 5866 | 10,752 | 1433 | 8149 |
| 2020 | 417.93 | 953.4 | 1147.85 | 3532.06 | 2771 | 6459 | 13,811 | 2358 | 611 | 2271 | 4052 | 5679 | 5197 | 10,367 | 1554 | 8368 |
| 2021 | 418.37 | 1311.88 | 1083.53 | 3337.83 | 2538 | 6169 | 13,408 | 2139 | 787 | 2383 | 4660 | 6015 | 6280 | 11,362 | 1750 | 8721 |
| 2022 | 473.35 | 2513.87 | 1236.77 | 3696.79 | 2748 | 6699 | 15,241 | 2266 | 944 | 2439 | 5702 | 6876 | 6648 | 12,683 | 1954 | 10,484 |
Table A3.
Estimated standard errors S(ÔSa) of the selected allocations for each classified year and the estimated commission errors for each class, with S(Ûp) for shrimp pond, S(Ûs) for soil, and S(Ûv) for vegetation.
Table A3.
Estimated standard errors S(ÔSa) of the selected allocations for each classified year and the estimated commission errors for each class, with S(Ûp) for shrimp pond, S(Ûs) for soil, and S(Ûv) for vegetation.
| Year | S(Ộa) | S(Ûp) | S(Ûs) | S(Ûv) |
|---|---|---|---|---|
| 1993 | 0.0185327 | 0.027501 | 0.0254457 | 0.0254457 |
| 1994 | 0.0186531 | 0.0254457 | 0.024577 | 0.0287348 |
| 1995 | 0.0193838 | 0.024577 | 0.0224231 | 0.0361158 |
| 1996 | 0.0178544 | 0.027501 | 0.0212664 | 0.0337526 |
| 1997 | 0.0190717 | 0.024577 | 0.0224231 | 0.0361158 |
| 1998 | 0.0183226 | 0.027501 | 0.0254457 | 0.0254457 |
| 1999 | 0.0188459 | 0.024577 | 0.0224231 | 0.0361158 |
| 2000 | 0.0183717 | 0.0254457 | 0.0254457 | 0.027501 |
| 2001 | 0.019122 | 0.024577 | 0.0224231 | 0.0361158 |
| 2002 | 0.0182602 | 0.0254457 | 0.024577 | 0.0287348 |
| 2005 | 0.0181647 | 0.0254457 | 0.024577 | 0.0287348 |
| 2006 | 0.0192668 | 0.024577 | 0.0224231 | 0.0361158 |
| 2007 | 0.0173769 | 0.027501 | 0.0212664 | 0.0337526 |
| 2008 | 0.0185983 | 0.024577 | 0.0224231 | 0.0361158 |
| 2009 | 0.0179573 | 0.0254457 | 0.0254457 | 0.027501 |
| 2010 | 0.0187727 | 0.0254457 | 0.024577 | 0.0287348 |
| 2013 | 0.0185095 | 0.0254457 | 0.024577 | 0.0287348 |
| 2014 | 0.0188619 | 0.024577 | 0.0224231 | 0.0361158 |
| 2015 | 0.0181858 | 0.0254457 | 0.024577 | 0.0287348 |
| 2016 | 0.0173426 | 0.027501 | 0.0212664 | 0.0337526 |
| 2017 | 0.0172606 | 0.027501 | 0.0212664 | 0.0337526 |
| 2018 | 0.017472 | 0.0254457 | 0.024577 | 0.0287348 |
| 2019 | 0.0169542 | 0.027501 | 0.0212664 | 0.0337526 |
| 2020 | 0.0174175 | 0.0254457 | 0.024577 | 0.0287348 |
| 2021 | 0.0174555 | 0.0254457 | 0.024577 | 0.0287348 |
| 2022 | 0.0174022 | 0.0254457 | 0.024577 | 0.0287348 |
References
- CONAPESCA. Base de Datos de Producción Anuarios; Comisión Nacional de Acuacultura y Pesca: Mazatlan, Mexico, 2020. [Google Scholar]
- CONAPESCA. Base de Datos de Producción Anuarios; Comisión Nacional de Acuacultura y Pesca: Mazatlan, Mexico, 2019. [Google Scholar]
- CONAPESCA. Base de Datos de Producción Anuarios; Comisión Nacional de Acuacultura y Pesca: Mazatlan, Mexico, 2018. [Google Scholar]
- CONAPESCA. Base de Datos de Producción Anuarios; Comisión Nacional de Acuacultura y Pesca: Mazatlan, Mexico, 2017. [Google Scholar]
- CONAPESCA. Base de Datos de Producción Anuarios; Comisión Nacional de Acuacultura y Pesca: Mazatlan, Mexico, 2016. [Google Scholar]
- CONAPESCA. Base de Datos de Producción Anuarios; Comisión Nacional de Acuacultura y Pesca: Mazatlan, Mexico, 2015. [Google Scholar]
- CONAPESCA. Base de Datos de Producción Anuarios; Comisión Nacional de Acuacultura y Pesca: Mazatlan, Mexico, 2014. [Google Scholar]
- CONAPESCA. Base de Datos de Producción Anuarios; Comisión Nacional de Acuacultura y Pesca: Mazatlan, Mexico, 2013. [Google Scholar]
- CONAPESCA. Base de Datos de Producción Anuarios; Comisión Nacional de Acuacultura y Pesca: Mazatlan, Mexico, 2012. [Google Scholar]
- CONAPESCA. Base de Datos de Producción Anuarios; Comisión Nacional de Acuacultura y Pesca: Mazatlan, Mexico, 2011. [Google Scholar]
- CONAPESCA. Base de Datos de Producción Anuarios; Comisión Nacional de Acuacultura y Pesca: Mazatlan, Mexico, 2010. [Google Scholar]
- CONAPESCA. Base de Datos de Producción Anuarios; Comisión Nacional de Acuacultura y Pesca: Mazatlan, Mexico, 2009. [Google Scholar]
- CONAPESCA. Base de Datos de Producción Anuarios; Comisión Nacional de Acuacultura y Pesca: Mazatlan, Mexico, 2008. [Google Scholar]
- CONAPESCA. Base de Datos de Producción Anuarios; Comisión Nacional de Acuacultura y Pesca: Mazatlan, Mexico, 2007. [Google Scholar]
- CONAPESCA. Base de Datos de Producción Anuarios; Comisión Nacional de Acuacultura y Pesca: Mazatlan, Mexico, 2006. [Google Scholar]
- CONAPESCA. Base de Datos de Producción Anuarios; Comisión Nacional de Acuacultura y Pesca: Mazatlan, Mexico, 2005. [Google Scholar]
- CONAPESCA. Anuario Estadístico de Acuacultura y Pesca; Comisión Nacional de Acuacultura y Pesca: Mazatlan, Mexico, 2004. [Google Scholar]
- CONAPESCA. Anuario Estadístico de Acuacultura y Pesca; Comisión Nacional de Acuacultura y Pesca: Mazatlan, Mexico, 2003. [Google Scholar]
- CONAPESCA. Anuario Estadístico de Acuacultura y Pesca; Comisión Nacional de Acuacultura y Pesca: Mazatlan, Mexico, 2002. [Google Scholar]
- CONAPESCA. Anuario Estadístico de Acuacultura y Pesca; Comisión Nacional de Acuacultura y Pesca: Mazatlan, Mexico, 2001. [Google Scholar]
- CONAPESCA. Anuario Estadístico de Acuacultura y Pesca; Comisión Nacional de Acuacultura y Pesca: Mazatlan, Mexico, 2000. [Google Scholar]
- CONAPESCA. Anuario Estadístico de Acuacultura y Pesca; Comisión Nacional de Acuacultura y Pesca: Mazatlan, Mexico, 1999. [Google Scholar]
- CONAPESCA. Anuario Estadístico de Acuacultura y Pesca; Comisión Nacional de Acuacultura y Pesca: Mazatlan, Mexico, 1998. [Google Scholar]
- CONAPESCA. Anuario Estadístico de Acuacultura y Pesca; Comisión Nacional de Acuacultura y Pesca: Mazatlan, Mexico, 1997. [Google Scholar]
- CONAPESCA. Anuario Estadístico de Acuacultura y Pesca; Comisión Nacional de Acuacultura y Pesca: Mazatlan, Mexico, 1996. [Google Scholar]
- CONAPESCA. Anuario Estadístico de Acuacultura y Pesca; Comisión Nacional de Acuacultura y Pesca: Mazatlan, Mexico, 1995. [Google Scholar]
- CONAPESCA. Anuario Estadístico de Acuacultura y Pesca; Comisión Nacional de Acuacultura y Pesca: Mazatlan, Mexico, 1994. [Google Scholar]
- CONAPESCA. Anuario Estadístico de Acuacultura y Pesca; Comisión Nacional de Acuacultura y Pesca: Mazatlan, Mexico, 1993. [Google Scholar]
- Barraza-Guardado, R.H.; Arreola-Lizárraga, J.A.; López-Torres, M.A.; Casillas-Hernández, R.; Miranda-Baeza, A.; Magallón-Barrajas, F.; Ibarra-Gámez, C. Effluents of Shrimp Farms and Its Influence on the Coastal Ecosystems of Bahía de Kino, Mexico. Sci. World J. 2013, 2013, 306370. [Google Scholar] [CrossRef] [PubMed]
- Gámez-Bayardo, S.; Castañeda-Ruelas, G.M.; Espinosa-Plascencia, A.; Bermúdez-Almada, M.D.C.; Jiménez-Edeza, M. Characterization of Vibrio Parahaemolyticus Strains and Evaluation of Shrimp Cultivation Conditions in a Farm at the Northwestern of Mexico, as Risk Predictors for Its Adaptation and Dissemination. Lat. Am. J. Aquat. Res. 2021, 49, 75–85. [Google Scholar] [CrossRef]
- Martínez-Durazo, A.; García-Hernández, J.; Páez-Osuna, F.; Soto-Jiménez, M.F.; Jara-Marini, M.E. The Influence of Anthropogenic Organic Matter and Nutrient Inputs on the Food Web Structure in a Coastal Lagoon Receiving Agriculture and Shrimp Farming Effluents. Sci. Total Environ. 2019, 664, 635–646. [Google Scholar] [CrossRef] [PubMed]
- Valenzuela-Sanchez, C.G.; Pasten-Miranda, N.M.A.; Enriquez-Ocaña, L.F.; Barraza-Guardado, R.H.; Valdez Holguin, J.E.; Martinez-Cordova, L.R. Phytoplankton Composition and Abundance as Indicators of Aquaculture Effluents Impact in Coastal Environments of Mid Gulf of California. Heliyon 2021, 7, e06203. [Google Scholar] [CrossRef] [PubMed]
- Páez-Osuna, F.; Ruiz-Fernández, A.C. Environmental Load of Nitrogen and Phosphorus from Extensive, Semiintensive, and Intensive Shrimp Farms in the Gulf of California Ecoregion. Bull. Environ. Contam. Toxicol. 2005, 74, 681–688. [Google Scholar] [CrossRef]
- Jayanthi, M.; Thirumurthy, S.; Muralidhar, M.; Ravichandran, P. Impact of Shrimp Aquaculture Development on Important Ecosystems in India. Glob. Environ. Change 2018, 52, 10–21. [Google Scholar] [CrossRef]
- Dorber, M.; Verones, F.; Nakaoka, M.; Sudo, K. Can We Locate Shrimp Aquaculture Areas from Space?—A Case Study for Thailand. Remote Sens. Appl. Soc. Environ. 2020, 20, 100416. [Google Scholar] [CrossRef]
- González-Rivas, D.A.; Tapia-Silva, F.O.; Bustillos-Guzmán, J.J.; Revollo-Fernández, D.A.; Beltrán-Morales, L.F.; Lluch-Cota, D.B.; Ortega-Rubio, A. Estimating Nitrogen Runoff from Agriculture to Coastal Zones by a Rapid GIS and Remote Sensing-Based Method for a Case Study From the Irrigation District Río Mayo, Gulf of California, México. Front. Mar. Sci. 2020, 7, 316. [Google Scholar] [CrossRef]
- Gorelick, N.; Hancher, M.; Dixon, M.; Ilyushchenko, S.; Thau, D.; Moore, R. Google Earth Engine: Planetary-Scale Geospatial Analysis for Everyone. Big Remote Sensed Data Tools Appl. Exp. 2017, 202, 18–27. [Google Scholar] [CrossRef]
- Instituto Nacional de Estadística y Geografía e Informática (INEGI). Datos Básicos de la Geografía de México; segunda; Instituto Nacional de Estadística y Geografía e Informática: Aguascalientes, Mexico, 1991; ISBN 968-892-004-5. [Google Scholar]
- Diario Oficial de la Federación (DOF) DECRETO por el que se Declara como Área Natural Protegida, con el Carácter de Reserva de la Biosfera, la Región Conocida como Marismas Nacionales Nayarit, Localizada en los Municipios de Acaponeta, Rosamorada, Santiago Ixcuintla, Tecuala y Tuxpan en el Estado de Nayarit. 2010. Available online: https://www.dof.gob.mx/nota_detalle.php?codigo=5142459&fecha=12/05/2010#gsc.tab=0DiarioOficialdelaFederación (accessed on 27 January 2025).
- Diario Oficial de la Federación DOF, D.O. de la F. ACUERDO que Declara Reserva de Caza, los Terrenos Denominados “Cajón Del Diablo” En El Estado de Sonora 1987. Available online: https://dof.gob.mx/nota_to_pdf.php?fecha=14/09/1937&edicion=MAT (accessed on 27 September 2024).
- Comisión Nacional para el Conocimiento y Uso de la Biodiversidad (CONABIO). Portal de Geoinformación 2022. Sistema Nacional De Información Sobre Biodiversidad (SNIB). Available online: http://www.conabio.gob.mx/informacion/gis/ (accessed on 1 September 2024).
- Comisión Nacional para el Conocimiento y Uso de la Biodiversidad (CONABIO). Regiones Terrestres Prioritarias de México. Available online: http://www.conabio.gob.mx/conocimiento/regionalizacion/doctos/Tmapa.html (accessed on 10 September 2024).
- González-Rivas, D.A.; Tapia-Silva, F.O. Estimating the Shrimp Farm’s Production and Their Future Growth Prediction by Remote Sensing: Case Study Gulf of California. Front. Mar. Sci. 2023, 10, 1130125. [Google Scholar] [CrossRef]
- QGIS Development Team. QGIS Geographic Information System. 2022. Available online: https://qgis.org/ (accessed on 23 August 2024).
- Olofsson, P.; Foody, G.M.; Herold, M.; Stehman, S.V.; Woodcock, C.E.; Wulder, M.A. Good Practices for Estimating Area and Assessing Accuracy of Land Change. Remote Sens. Environ. 2014, 148, 42–57. [Google Scholar] [CrossRef]
- Muniesa, A.; Perez-Enriquez, R.; Cabanillas-Ramos, J.; Magallón-Barajas, F.J.; Chávez-Sánchez, C.; Esparza-Leal, H.; de Blas, I. Identifying Risk Factors Associated with White Spot Disease Outbreaks of Shrimps in the Gulf of California (Mexico) through Expert Opinion and Surveys. Rev. Aquac. 2017, 9, 257–265. [Google Scholar] [CrossRef]
- Alonso-Rodríguez, R.; Páez-Osuna, F. Nutrients, Phytoplankton and Harmful Algal Blooms in Shrimp Ponds: A Review with Special Reference to the Situation in the Gulf of California. Aquaculture 2003, 219, 317–336. [Google Scholar] [CrossRef]
- Jara-Marini, M.E.; Molina-García, A.; Martínez-Durazo, Á.; Páez-Osuna, F. Trace Metal Trophic Transference and Biomagnification in a Semiarid Coastal Lagoon Impacted by Agriculture and Shrimp Aquaculture. Environ. Sci. Pollut. Res. 2020, 27, 5323–5336. [Google Scholar] [CrossRef]
- Molina-García, A.; García-Hernández, J.; Soto-Jiménez, M.F.; Páez-Osuna, F.; Jara-Marini, M.E. Mercury and Selenium Biomagnification in a Coastal Food Web from the Gulf of California Influenced by Agriculture and Shrimp Aquaculture. Environ. Sci. Pollut. Res. 2021, 28, 56175–56187. [Google Scholar] [CrossRef]
- Ahrens, T.D.; Beman, J.M.; Harrison, J.A.; Jewett, P.K.; Matson, P.A. A Synthesis of Nitrogen Transformations and Transfers from Land to the Sea in the Yaqui Valley Agricultural Region of Northwest Mexico. Water Resour. Res. 2008, 44, 1–13. [Google Scholar] [CrossRef]
- Arreola-Lizárraga, J.A.; Padilla-Arredondo, G.; Medina-Galván, J.; Méndez-Rodríguez, L.; Mendoza-Salgado, R.; Cordoba-Matson, M.V. Analysis of Hydrobiological Responses to Anthropogenic and Natural Influences in a Lagoon System in the Gulf of California. Oceanol. Hydrobiol. Stud. 2016, 45, 112–120. [Google Scholar] [CrossRef]
- Miranda, A.; Voltolina, D.; Frías-Espericueta, M.G.; Izaguirre-Fierro, G.; Rivas-Vega, M.E. Budget and Discharges of Nutrients to the Gulf of California of a Semi-Intensive Shrimp Farm (NW Mexico). Hidrobiológica 2017, 19, 43–48. [Google Scholar]
- Hernandez-Llamas, A.; Cabanillas-Ramos, J.; Magallon-Barajas, F.J. Estimating Impact of White Spot Disease on Economic Risk in Semi-Intensive Shrimp Farms in Mexico: The Case of the State of Sinaloa. Rev. Aquac. 2016, 8, 111–120. [Google Scholar] [CrossRef]
- López-Téllez, N.A.; Corbalá-Bermejo, J.A.; Bustamante-Unzueta, M.L.; Silva-Ledesma, L.P.; Vidal-Martínez, V.M.; Rodriguez-Canul, R. History, Impact, and Status of Infectious Diseases of the Pacific White Shrimp Penaeus Vannamei (Bonne, 1831) Cultivated in Mexico. J. World Aquac. Soc. 2020, 51, 334–345. [Google Scholar] [CrossRef]
- Comisión Nacional de Áreas Naturales Protegidas (CONANP). Programa de Manejo Reserva de La Biosfera Marismas Nacionales Nayarit; Comisión Nacional de Áreas Naturales Protegidas (CONANP): Mexico City, Mexico, 2013. [Google Scholar]
- Gómez-Pompa, A.; Dirzo, R. Reservas de Las Biosfera y Otras Áreas Naturales Protegidas de México, Primera edición; Comisión Nacional para el Conocimiento y Uso de la Biodiversidad: Mexico City, Mexico, 1995; ISBN 968-817-333-9. [Google Scholar]
- Valderrama-Landeros, L.; Flores-de-Santiago, F.; Kovacs, J.M.; Flores-Verdugo, F. An Assessment of Commonly Employed Satellite-Based Remote Sensors for Mapping Mangrove Species in Mexico Using an NDVI-Based Classification Scheme. Environ. Monit. Assess. 2017, 190, 23. [Google Scholar] [CrossRef] [PubMed]
- Morzaria-Luna, H.N.; Castillo-López, A.; Danemann, G.D.; Turk-Boyer, P. Conservation Strategies for Coastal Wetlands in the Gulf of California, Mexico. Wetl. Ecol. Manag. 2014, 22, 267–288. [Google Scholar] [CrossRef]
- Ramsar. Servicio de Información sobre Sitios Ramsar. Available online: https://rsis.ramsar.org/es (accessed on 21 August 2024).
- Luja, V.H.; Guzmán-Báez, D.J.; Nájera, O.; Vega-Frutis, R. Jaguars in the Matrix: Population, Prey Abundance and Land-Cover Change in a Fragmented Landscape in Western Mexico. Oryx 2022, 56, 546–554. [Google Scholar] [CrossRef]
- Duan, Y.; Li, X.; Zhang, L.; Chen, D.; Liu, S.; Ji, H. Mapping National-Scale Aquaculture Ponds Based on the Google Earth Engine in the Chinese Coastal Zone. Aquaculture 2020, 520, 734666. [Google Scholar] [CrossRef]
Disclaimer/Publisher’s Note: The statements, opinions and data contained in all publications are solely those of the individual author(s) and contributor(s) and not of MDPI and/or the editor(s). MDPI and/or the editor(s) disclaim responsibility for any injury to people or property resulting from any ideas, methods, instructions or products referred to in the content. |
© 2025 by the authors. Licensee MDPI, Basel, Switzerland. This article is an open access article distributed under the terms and conditions of the Creative Commons Attribution (CC BY) license (https://creativecommons.org/licenses/by/4.0/).