Abstract
Macroevolutionary studies which focus on the development of traits in a phylogenetic context are increasingly used to explore the evolutionary mechanisms and processes that have led to the diversity in species we see today. This includes the study of the evolution of climatic niches within taxonomic groups. Here, we used the leaf-warbler family (Aves: Phylloscopidae) and two dated phylogenetic trees on this group to assess how phylogenetic trees can affect results on the evolution of climatic niches. Trees applied differ in numbers of extant species and in species’ divergence times. We established ecological niche models from climate and occurrence data for all species represented in these trees and calculated predicted niche occupancies (PNOs) and ancestral niches for each of the two trees. Additionally, we examined the niche overlap and deviations from a Brownian motion model for each tree by assessing the accumulation of disparity through time, the strength of the phylogenetic signal and the best-fitting evolutionary model for different niche dimensions. We found differences in the evolutionary history of PNOs for the two phylogenetic trees. The accumulation of disparity through time, phylogenetic signal and mode of evolution of different climatic variables also differed when using the two trees and even suggested contrary interpretations. Our results indicate that the phylogenetic tree applied could strongly influence the outcome of similar macroevolutionary studies and recommend caution for their interpretation.
1. Introduction
Investigating the processes and mechanisms that have led to today’s biodiversity is one of the central goals in the field of evolutionary biology. Especially in the light of the ongoing anthropogenic climate change, studying evolution in relation to climate is important [1]. With the advent of tools for ecological niche modelling, the examination of different aspects of a species’ distribution range and its drivers, including climate, has become a widespread practice [2]. Exploring the evolution of the climatic niche of a species or of a group of species can help advance the understanding of a multitude of evolutionary processes. Insights, not only into the drivers of speciation and diversity [3] but also into the evolution of species’ climatic tolerances in the context of the evolution of their close relatives and ancestors, can be gained and its responses to future climate change can be predicted by inferring ancestral tolerances and examining the adaptability of species in the past.
Studies establishing climatic niches of species commonly utilize associations between climatic or other environmental variables and known species’ occurrence records to identify environmental conditions within which populations can be maintained [2,4,5]. This approach has several shortcomings and implies that established niche models rather reflect the realized niche than the fundamental niche of a species. (1) Its actual spatial distribution might be incompletely sampled, i.e., records do not cover its entire distribution area. For example, records can reflect a narrower tolerance to climate as records in the core of the distribution area are more frequent than at the border. (2) The actual spatial distribution is limited by a species’ dispersal ability, as some suitable but too distant areas are not populated by the species. (3) The species went extinct in an area due to reasons other than climate, e.g., due to interactions with other organisms [4]. Resulting inaccuracies in ecological niches calculated for a species not only reduce the accuracy of ecological niche models for any application in ecology and conservation biology but also when reconstructing the ancestral niche and its diversification over time for a taxon [6,7].
Likewise, phylogenetic trees should not be assumed as accurate representations of the species’ evolutionary histories which in turn introduces uncertainties to inferring the evolution of climatic niches for a clade. Different markers or methods used to calculate a tree can yield different topologies and thus relationships of species among each other. The number of possible topologies increases rapidly with the number of species represented in a tree ([8,9], this study). The exact dating of nodes [10] and the number of species missing in a tree [9] are further sources of error to its represented evolutionary history of species.
The passerine family of leaf-warblers (Aves: Phylloscopidae) consists of small, insectivorous birds that are distributed throughout most of the Old World. They are notoriously hard to distinguish based on their morphology alone, as species often show only small visible differences in characters [11]. The number of recognized leaf-warbler species has dramatically increased from genetic and bioacoustic analyses in the past. While some authors treat leaf-warblers as monogeneric (see [12]), others argue for the distinction of up to nine genera [13]. To date there are 81 recognized leaf-warbler species (IOC World Bird List v12.1, [14]). Some species’ ranges are exceptionally large. For example, the breeding range of the migratory Willow warbler Phylloscopus trochilus spans the northern Palearctic from Western Europe to north-eastern Siberia, while its winter range extends from sub-Saharan Africa to southern South Africa. Other leaf-warblers are endemic to oceanic islands, e.g., P. amoenus (Kolombangara leaf-warbler) is found on Kolombangara Island in the West Solomons [15]. The frequent changes in their taxonomic classification (reviewed by [16]), discovery of new species and their wide ranges covering many different climates make leaf-warblers well suited for a study on the diversification of their climatic niches in the course of their evolution and to assess a potential impact of differences in phylogenetic trees applied for modelling niche evolution.
To this end, we established climatic niches of leaf-warbler species based on 19 bioclimatic variables [17] and species’ occurrence records (www.GBIF.org). We used two different phylogenetic trees on this bird family, the relatively recent phylogenetic tree by Tietze et al. [18] and a tree that we calculated from the most recently published dataset of Alström et al. [19]. Both place the most recent common ancestor of Phylloscopidae at around 12 million years ago (Ma) and suggest a split of this family into two primary clades, alpha (α) and beta (β). Trees differ in terms of species numbers (e.g., due to cryptic, extinct or undiscovered taxa), uncertain relationships between species and divergence times between species.
By repeating our analysis with each of the two different phylogenetic trees, we aimed to assess their potential influence on the results obtained from modelling the evolution of climatic niches within the leaf-warbler family. Specifically, we addressed (1) whether the evolution of the niches followed a Brownian motion model, which is mostly used when modelling the evolution of an ecological niche in a taxon. (2) We further visualized the inferred evolutionary history of predicted niche occupancy to identify periods of a more rapid niche diversification or niche conservatism, allowing us to compare these patterns between and within leaf-warbler clades as well as between the two different phylogenetic trees.
2. Materials and Methods
2.1. Phylogenies
In this study, we used two dated phylogenetic trees for the passerine family of leaf-warblers. Both trees only cover extant species. The first is based on a multilocus genetic dataset published by Alström et al. [19]. It was calculated by us in BEAST (v.1.8.4; [20]) using the XML file provided in the electronic supplement of Alström et al. [19]. This tree comprises 76 leaf-warbler species and hereafter, we will refer to it as TreeA. As the second tree, we used the phylogenetic tree from Tietze et al. [18], which is also based on the analysis of multiple genetic loci and was constructed with BEAST. It includes 64 of the extant leaf-warbler species, all of which are also represented in TreeA. Hereafter, we refer to this phylogenetic tree as TreeT. See Table S1 in Supplementary Materials for a list of leaf-warbler species names. We chose the two primary clades α and β and eleven of the main clades (C, D, K, M, N, O, R, T, W, X) proposed by Alström et al. [19] to split up all extant leaf-warbler species into groups, in order to compare climatic niches and trends in the evolution of closely versus more distantly related leaf-warblers, both within and among the clades as well as between trees (Figure 1). These eleven clades are between 2.5 and 8.5 million years old and their origin is in-between the oldest and the youngest nodes in the leaf-warbler phylogeny [19]. The most recent common ancestor of the leaf-warbler family dates back circa 12 Ma, whereas the youngest species are less than one million years old (e.g., P. grammiceps and P. montis–split ca. 0.5 Ma; [19]).
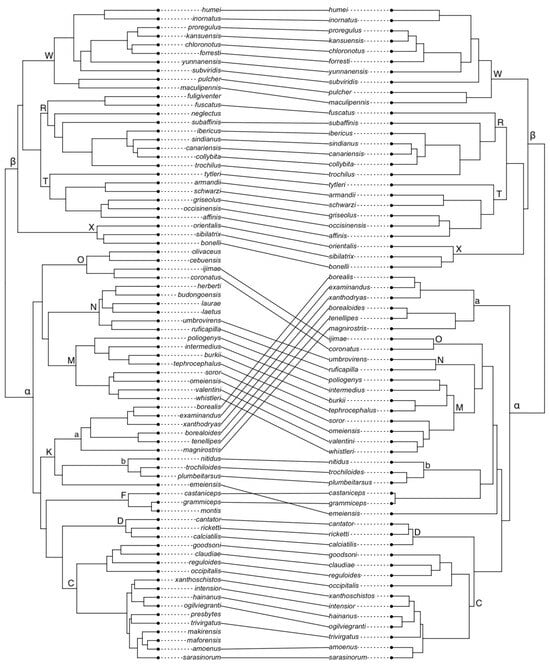
Figure 1.
Comparison of the phylogeny based on a dataset of Alström et al. [19], TreeA, (left) and Tietze et al. [18], TreeT, (right). Letters refer to clades, α and β mark the primary clades alpha and beta.
2.2. Ecological Niche Modelling
We carried out Ecological Niche Modelling (ENM) using the MaxEnt algorithm (v.3.4.1, [5]). Occurrence records (breeding distribution) were retrieved from the Global Biodiversity Information Facility (www.GBIF.org) for each species and climate records in the form of 19 bioclimatic variables (Table 1) were downloaded from the WorldClim 2.1 database [17]. See Supplementary Materials for details.

Table 1.
The 19 bioclimatic variables used in this study and their respective units.
2.3. Predicted Niche Occupancy Profiles and Niche Overlap
To calculate the predicted niche occupancy profiles (PNO) for each species and each of the 19 bioclimatic variables sensu Evans et al. [1], each species’ distribution of occurrence probability, inferred from the MaxEnt model (the predicted suitability per landscape unit summed across the study area), was assigned to 50 equally spaced bins spanning the parameter range of the respective bioclimatic variable. The distribution of occurrence probability was then integrated over each of the variables to generate a profile on each species’ predicted occupancy of the parameter space.
To assess niche overlaps among species, we calculated Schoener’s D [21] (reviewed in [4]) from the PNO profiles using the R package phyloclim (v0.9.5.) [22]. Schoener’s D is a commonly used metric to measure ecological niche overlap (e.g., [2,23,24]). It quantifies the similarity in habitat use between two species by comparing the predicted suitability values per grid cell. Values of D range from 0 (no overlap) to 1 (complete overlap).
2.4. Evolution of Predicted Niche Occupancy and Disparity
As performed in most studies before, we reconstructed the evolution of PNO profiles for each of the 19 bioclimatic variables and both phylogenetic trees under the assumption of a Brownian motion (BM) evolutionary model using the R package phyloclim (v0.9.5.) [22]. We then conducted several analyses on best evolutionary models on species’ climatic niche dimensions using the R package geiger (v2.0) [25].
To check whether the BM model was indeed appropriate to model the diversification of climatic niches in the past, we calculated Pagel’s lambda (λ) [26] and Blomberg’s K [27] as two measures on the strength of a phylogenetic signal from the mean of the PNO profiles for each bioclimatic variable, as well as for two Principal Components (PC1, PC2) derived from all bioclimatic variables. K and λ values close to zero indicate the phylogenetic independence of a trait and thus a departure from the BM model, whereas values close to 1 indicate that it works well. K and λ values can exceed 1, when the trait similarity between species is larger than it would be expected under a BM model [28]. There is no clear consensus which values exactly constitute a “high” or “low” phylogenetic signal [29], and therefore values must be interpreted relatively.
Since evolutionary models might differ between bioclimatic variables, we additionally tested the mean PNO profile for each variable and species to find the best-fitting model out of BM [30], Ornstein-Uhlenbeck [31], early-burst [32], λ, kappa (κ), delta (δ) [26] and white noise (a non-phylogenetic model, trait values of species are not influenced by the shared ancestry of species [33]. The best-fitting model was that of the lowest AICc value.
To quantify the distribution of disparity within and among subclades [1], we calculated the relative Disparity Through Time (DTT, [34]) from weighted means of the PNO profiles. We determined DTT by using the R package geiger [25], which uses the average squared Euclidean distances between the species to calculate disparity in their PNO profiles. We further calculated the expected DTT under a BM model for each phylogenetic tree from the mean of 100 simulations of this model. This enabled us to compare the DTT of the data to that generated under the BM model. DTT values close to 0 indicate that most of the variance is between the clades and that within-clade variation contributes little to the variation seen across the entire family. Values close to one indicate that within-clade variation contributes a large amount to the total variance and that clades likely overlap.
Finally, we determined the Morphological Disparity Index (MDI) which compares the relative disparity expected under the BM model to the mean of the relative disparity observed. It quantifies the area between the curve for the data and that for the disparity expected under the BM model. Positive values imply that disparity is distributed within subclades and indicate niche diversification within and niche conservatism among them. Conversely, negative values suggest niche conservatism within subclades and niche diversification among them.
3. Results
3.1. Phylogenetic Trees
The topology of TreeA inferred by us only differed at more recent nodes that are not fully supported in the phylogenetic tree from the publication of Alström et al. [19], whereas resolved clades did not differ between their tree and TreeA. In both TreeA and TreeT, clade α was fully supported, whereas the support for clade β differed between both trees (TreeA: Posterior Probability (PP) = 0.95, TreeT: PP = 0.83). See Supplementary Materials for more details.
3.2. Predicted Niche Occupancy and Niche Overlap
Climatic niches of extant leaf-warblers ranged from arid to tropical conditions, with annual mean temperatures ranging from approximately −3 to 25 °C across all species (Table S2). We observed no clear patterns in niche differences between and within clades. However, some species were consistently predicted to occupy niches at the higher or lower end of the environmental spectrum. Within the primary clade α, the predicted niche occupancy of species ranged from an annual precipitation (bio12) of about 425 mm up to about 3500 mm. Precipitation niches within clade β were predicted between ca. 50 to ca. 1200 mm.
Except for P. ijimae, all species favouring an annual precipitation higher than 2000 mm (bio12) also preferred an annual mean temperature of around 23–25 °C (bio1) and often a low precipitation seasonality (bio15). Only P. canariensis, which is endemic to the Canary Islands, preferred a low total precipitation (45 mm, bio12) and a high annual mean temperature (around 20 °C, bio1). For most species, PNO profiles showed higher amounts of precipitation in summer (bio18) than in winter (bio19) or a roughly equal amount of summer and winter precipitation (Table S2).
In clade α, annual mean temperatures ranged from around −3 to 25 °C. This range is only slightly narrower in clade β (from ca. −3 to 20 °C). The overall annual temperature range (bio7) across all species started at around 8 °C (P. amoenus) and ended at almost 50 °C (P. inornatus, P. proregulus). All species whose PNO for annual temperature range exceeded 25 °C are migratory. The largest temperature range of non-migratory species was that of P. laurae (about 22 °C). In clade α, no clear patterns in PNO were evident within or between the clades, since members of the same clade were predicted to occur along a broad temperature gradient.
We found no clear patterns in niche overlaps (i.e., assessed from Schoener’s D values) between species (Table S3). Across all clades, the largest difference in D values was observed for clade M, with P. tephrocephalus and P. valentini showing the largest (0.68) value and P. soror and P. poliogenys the smallest (0.18) value. The mean D within clade M was 0.46. The largest D values between species from different clades were those of P. sibilatrix and P. collybita (D = 0.82) and of P. sibilatrix and P. trochilus (D = 0.82). Within clades, D values inferred between species mostly ranged from very low to high (as defined by Rödder and Engler [35]). The highest D value (0.71) across all species pairs was calculated for P. collybita and P. trochilus from clade R. Most species pairs had D values smaller than 0.2 (very limited niche overlap, [35]), irrespective of whether species were compared from the same or different clades. Except for clade N, in which all species showed small D values among each other and with species from other clades (within-clade mean D = 0.17). The variability in D values within and between clades was overall large.
3.3. Evolutionary History of PNO
Mapping of PNOs of bioclimatic variables onto the two different phylogenetic trees revealed similar results. For older clades, we found evidence for a convergent evolution of PNOs in more recent species, irrespective of the phylogenetic tree applied. This is indicated by crossing branches during diversification and the proximity of the branches in the present (Figure 2a–f). In general, for both trees, a similar evolutionary pattern towards a higher or lower temperature niche was often documented in the traitgrams but with differing times of divergence and therefore different branches converging. Members of younger clades (e.g., clades D and F) converged into the same parameter space less frequently than members of older clades. A strong divergent evolution for internal nodes was often indicated, leading to crossing of branches later during evolution.
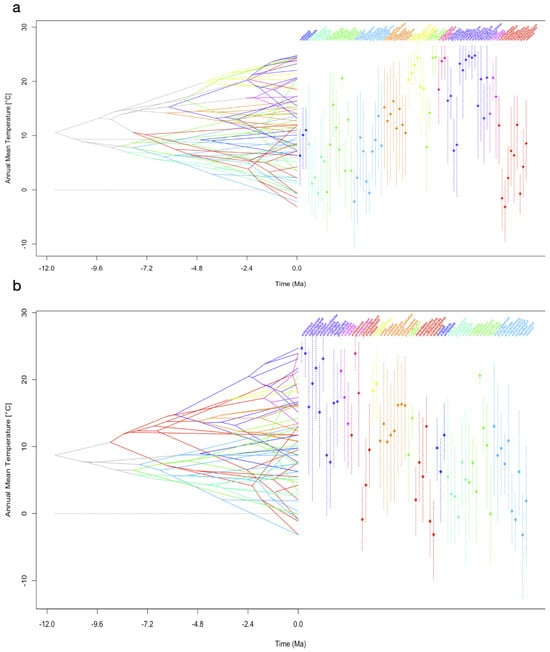
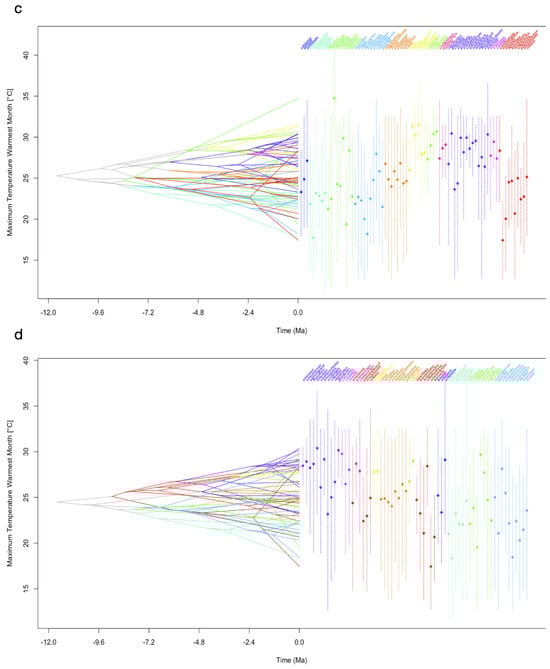
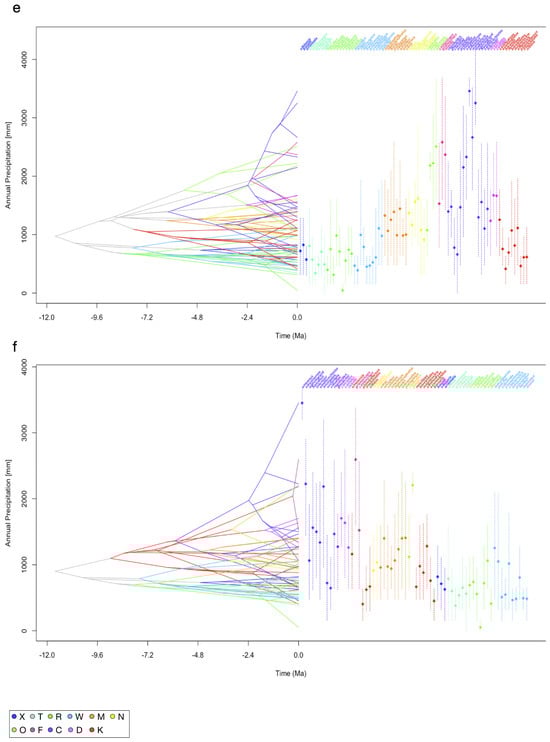
Figure 2.
Reconstruction of the ancestral climatic tolerances for each of the extant leaf-warbler species. To visualize the inferred evolutionary history of niche occupancy, PNO profiles on bioclimatic variables are mapped onto the dated phylogenetic tree calculated from a dataset of Alström et al. [19], TreeA and onto the tree from Tietze et al. [18], TreeT. The x-axis covers a time interval of 12 million years ago (−12.0) until now (0.0), the y-axis shows the parameter space of a climatic niche dimension (temperature in °C, precipitation in mm). Colours represent clades, vertical dashed lines show the 80% central density of climate tolerance, the mean is indicated by a diamond. Crossing branches indicate convergent niche evolution between the taxa. (a) Mean annual temperature (bio1) TreeA, (b) mean annual temperature (bio1) TreeT, (c) maximum temperature of the warmest month (bio5) TreeA, (d) maximum temperature of the warmest month (bio5) TreeT, (e) annual precipitation (bio12) TreeA, (f) annual precipitation (bio12) TreeT. Legend shows clade colour code, clade order from TreeA. Traitgrams on all variables are in the Supplementary Materials.
In comparison to annual mean temperature (bio1, Figure 2a,b), PNOs on the maximum temperature of the warmest month (bio5, Figure 2c,d) diverged less strongly at each node for both trees. Many of the extant taxa clustered together and shared the same parameter space, with only a few species showing values below 20 °C or above 30 °C for bio5. Among temperature-related variables, the evolution of PNOs showed the largest diversity for variables related to the tolerance of low temperatures (bio6, bio11; Figure S1f,k). The spectrum of temperature niche occupancy in relation to the warmest temperatures (bio5, 10; Figure 2c,d and Figure S1) was smaller than that of the coldest temperatures. Precipitation niches were characterized by a high tolerance of low to no precipitation for many leaf-warbler species. Especially within clade β, the PNOs showed only little change across the evolutionary history (Figure 2e,f).
3.4. Disparity Through Time
DTT, based on all 19 bioclimatic variables together, differed between TreeA and TreeT (Figure 3a,b). For TreeA, during most of the niche diversification, DTT was within the 95% confidence interval (Figure 3a; shaded area, calculated from 100 simulations). The DTT plot indicates low levels of average subclade disparity early in the diversification process suggesting niche conservatism within the subclades (Figure 3a). For an intermediary period (relative time, between approximately 0.55 and 0.65 on the x-axis), the average disparity coincides with the median of the expected disparity under the BM model (derived from 100 simulations of the process under BM, indicated by the dashed line). At late periods, average disparity exceeds the values that would be expected under the BM model. An MDI of −0.063 indicates a tendency for overall niche conservatism within the subclades and diversification among them for TreeA.
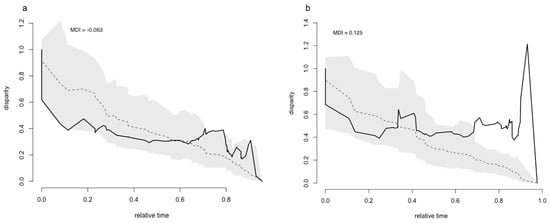
Figure 3.
Accumulation of relative disparity through time for leaf-warblers based on the phylogenetic tree calculated from a dataset of Alström et al. [19], TreeA, the tree from Tietze et al. [18], TreeT and all 19 bioclimatic variables together (solid line). Dashed line marks the mean disparity calculated from 100 simulations under a Brownian motion model, the shaded area denotes the 95% confidence interval inferred from the simulations. MDI (morphological disparity index) is the difference between the relative observed disparity and that of the simulations. (a) TreeA, (b) TreeT.
Similarly, the DTT plot based on TreeT (Figure 3b) suggests low levels of average subclade disparity at an early period of diversification, but it also substantially differs from the plot obtained for TreeA. The average disparity exceeds the expected disparity under the BM model earlier than for TreeA. At no point in time during diversification, disparity conforms to the median expected under the BM model. Disparity is also outside the 95% confidence interval (at approximately 0.7 on the x-axis), with the highest peak reaching a disparity just above 1.2. An MDI value of 0.125 suggests overall niche diversification within the subclades and niche conservatism among clades for TreeA.
For both phylogenetic trees, an increasing DTT and an increasing deviation from the BM model towards later relative times is indicated, with a higher deviation in TreeT than TreeA. The stronger divergence of disparity from that expected under the BM model seen for TreeT than for TreeA was also observed in the DTT plots calculated for each of the 19 bioclimatic variables (Figure S2). Many of these variables show the same pattern in change in DTT over time for both trees. For example, their diversification either starts with relatively low levels of average subclade disparity or with higher ones, and they accumulate high levels of disparity in more recent times or stay at relatively low levels. However, in all plots based on TreeT the observed effects are always stronger than when using TreeA, with a stronger divergence from the expected average under BM and an earlier accumulation of disparity. The MDI values calculated for each of the bioclimatic variables were mostly higher for TreeT than for TreeA (Table S4).
3.5. Phylogenetic Signal and Evolutionary Models
Although both phylogenetic trees differed in species numbers, principal components 1 and 2 on bioclimatic variables of species were very similar (Figure S3). PC1 is always strongly associated with temperature-related variables (bio1, bio6, bio7, bio11) and with one precipitation-related variable (bio12), whereas PC2 is always associated with precipitation-related variables (bio14, bio15, bio17, bio19), except for bio2, which is temperature-related. PC1 and PC2 together accounted for 81.4% (PC1 = 68.58%, PC2 = 12.89%) and 80.19% (PC1 = 65.58%, PC2 = 14.61%) of the variation seen in the species of TreeA and TreeT, respectively.
Our different measures of phylogenetic signals (deviations from BM) in climatic variables for species represented in TreeA and TreeT (Table S5) indicated differences. For TreeA, values of Blomberg’s K ranged from 0.47 to 1.25 and Pagel’s λ from 0.43 to 1. For TreeT, K never exceeded 1 and ranged from 0.25 to 0.89; λ ranged from 0.14 to 0.99. Only for the two variables bio16 and bio18, K was higher for TreeT than for TreeA, whereas all other K values inferred for TreeA exceeded those of TreeT. For TreeA and TreeT, K and λ resembled each other (either both high or both low), except for bio16 for TreeA and for bio3, bio7 and bio12 for TreeT. The phylogenetic signals observed for the two PCs were consistent with those observed for the individual variables. Blomberg’s K and λ were both higher for TreeA than TreeT and both were higher for PC1 than for PC2.
Best-fitting evolutionary models for bioclimatic variables also differed between trees (Table S5). For TreeA, κ was identified as the best model for most variables, followed by λ. Conversely, for TreeT, κ was the best model for the five bioclimatic variables bio3, bio12, bio14, bio17 and bio19 only and for all other variables it was λ. The best model for bioclimatic variables that are related to warm temperatures (i.e., warmest month or quarter, bio5, 10, 18) was λ for both trees. Other variables related to extreme climatic conditions (i.e., coldest, wettest, driest) or to temperature and precipitation showed no consistent pattern. For both trees and all bioclimatic variables, the worst-fitting model was either the early-burst model or the non-phylogenetic white-noise model. The best model for PC1 was κ for both trees. This is consistent with κ also being the best model for all variables correlating to PC1 when using TreeA. Conversely for TreeT, the best model for all these variables was λ, except for bio12. The best model for PC2 was the Ornstein–Uhlenbeck model for TreeA and κ for TreeT.
4. Discussion
Our results indicate that the phylogenetic tree used to model the diversification of climatic niches within the leaf-warbler family substantially impacts the evolutionary results inferred for this group. Different tests on the applicability of the BM model, mostly used to model the evolution of climatic niches, questioned the adequacy of this evolutionary model for this bird family and best models found differed between TreeA and TreeT.
4.1. Shortcomings to Modelling Climatic Tolerances and Their Evolution in Extant Leaf-Warbler Species
The climatic niches that we established for leaf-warblers have two important shortcomings, limiting their interpretation in an ecological and evolutionary context. First, we had to calculate predicted niche occupancies (PNO) from species’ breeding distributions as not enough information on the wintering distribution of all leaf-warblers is available. While the breeding distribution might reflect the climatic niche of non-migratory species, it does not reflect that of long- and short-distance migrants as well as of species seasonally showing altitudinal migration. Phylloscopus inornatus, for example, breeds in an area limited in the north by northern Russia and Siberia and in the south by Mongolia and northern China. This resulted in a mean of the predicted niche for maximum temperature (bio5) of ca. 22 °C and of the minimum temperature in the coldest month of ca. −27 °C (bio6, Table S2). Both values yield a very broad annual temperature range (bio7) of almost 50 °C, even though the species is not present in the breeding area during the coldest months. We thus corroborate that the non-breeding ranges of migratory species must be considered to calculate more accurate climatic niches of species [36].
Second, niche models are based on species’ records, which often represent neither their full actual distribution nor their climatic tolerances (see Section 1). Modelling the evolutionary change in the climatic niche of a taxon, however, assumes that fundamental niches of extant species are reconstructed by niche modelling. Realized niches of species of identical fundamental niches can differ to avoid competitive exclusion, which in turn would falsely indicate niche divergence. Likewise, partially overlapping fundamental niches enable species to occupy identical realized niches, the latter falsely indicating niche convergence [37]. Schoener’s D values, however, interpreted for species’ niche convergence, divergence and conservatism, only assess the similarity of their ecological niche models but not the overlap in their fundamental niches ([4], see Section 1). In our study, lacking significance tests on potential niche overlaps of species based on D values is a further potential source of error.
Due to all these shortcomings, we restrict the interpretation of our results on the evolution of climatic niches in leaf-warblers to differences observed when using TreeA or TreeT. We leave it to the readers to rate our other results (e.g., those on the species’ breeding niches) in the context of their own studies.
4.2. Differing Phylogenetic Trees Impact the Evolutionary History of PNOs
The differences in divergence times and clade structure (mainly within the primary clade α) found for the two phylogenetic trees impacted the apparent evolution of climatic niche occupancy in leaf-warblers. While the direction of the evolutionary change after each split of a node was the same, the history of niche occupancy in relation to other species was different. Different times of divergence impacted the apparent evolutionary rate, as exemplified by P. grammiceps and P. castaniceps (Figure 2a–f, clade F). For TreeT, these species diverged from their common ancestor later (<500,000 years ago) than for TreeA (just under 2.4 Ma). This suggests a much more rapid evolution of their climatic niche for TreeT than for TreeA, which in turn changes the phylogenetic relationship of clade F to other clades and thus their evolutionary change in PNOs. For example, for TreeA the lines on the change in PNOs in mean annual temperature cross for the extant taxa P. castaniceps and P. calciatilis (clade D) (Figure 2a), which would indicate a convergent evolution before this crossing point and a divergent evolution after this point is passed. Due to the late emergence of clade F in TreeT, lines of P. castaniceps and P. calciatilis do not cross (Figure 2b), whereas lines of P. grammiceps and P. calciatilis do. While the overall patterns of evolution for the individual climatic variables were the same, the histories of single species varied to different degrees between the two phylogenetic trees.
4.3. DTT, MDI, Deviations from BM Evolution and Completeness of the Phylogenetic Tree
The negative MDI value inferred when using TreeA indicates niche conservatism within subclades and niche diversification between clades for the leaf-warbler family. In contrast, the positive MDI value calculated for TreeT suggests niche conservatism among subclades and substantial niche divergence within clades. Differences in MDI values obtained for the two trees, thus lead to contrary interpretations on niche diversification in leaf-warblers. A comparison of the DTT plots calculated for each of the two trees revealed a low disparity at early periods of diversification and a later accumulation exceeding the disparity expected under the BM model. The accumulation of niche differences in later periods was larger for TreeT than for TreeA (Figure 3a,b). The estimated times of divergence vary slightly between the two phylogenetic trees, resulting in a temporary slowdown in the rate of niche diversification for TreeT, while this rate showed a steady but slow increase for TreeA (Figure 1). Consequently, the rate of diversification increased more rapidly towards present day for TreeT than for TreeA implying higher disparities for TreeT than for TreeA. This strong departure from the BM model’s expectation, which is supported by Blomberg’s K and Pagel’s λ values clearly differing from unity for TreeT (Table S5), might account for the overwhelmingly positive MDI values inferred for each and all 19 bioclimatic variables together for TreeT, and the large number of negative values calculated for TreeA (Table S4).
Our results on DTT inferred for bioclimatic variables were consistent with our findings on the strength of the phylogenetic signal for these variables, which were generally stronger for TreeA than TreeT. Münkemüller et al. [28] found that Blomberg’s K decreases with an increasing number of species represented in a phylogeny. Conversely, in this study, K values calculated for bioclimatic variables were generally higher for the phylogenetic tree which includes more species (TreeA, 76), while they were mostly lower for that with fewer species (TreeT, 64; note TreeA includes all species of TreeT). Although the overall trends were similar for the two phylogenetic trees applied, with phylogenetic signals often being higher or lower for the same variables, the values of K and λ indicated differences in the evolution of the extant leaf-warbler species and an effect of the phylogenetic tree used again. Overall, the large values of K and λ calculated for TreeA suggest a trait evolution that is often close to a BM model, which points to a gradual change over time rather than to a rapid evolution of climatic niches as seen in adaptive radiation. Conversely, for TreeT, there was a tendency towards lower phylogenetic signals for precipitation-related variables only. Closer relatives do not have more similar PNO profiles than distant relatives and they resemble each other less than expected under a BM model. This points to distantly related species sharing the same traits, in this case to a convergent evolution of species of different clades, resulting in the occupancy of the same parameter space.
The worst-fitting models for both phylogenetic trees were either the early-burst or white-noise models. The early-burst model describes a rapid trait evolution at the beginning of diversification and a subsequent slowdown once the available ecological space is filled. The white-noise model indicates that trait evolution is independent of phylogenetic relationships. Both models can be interpreted as evidence for adaptive radiation, which would be indicated by high initial disparities followed by decelerating values which is not documented in the DTT plot for TreeA or for TreeT (Figure 3a,b).
Although the BM evolutionary model often was supported for several bioclimatic variables for TreeA, in the other analyses (i.e., phylogenetic signal and DTT), it was not the best-fitting evolutionary model for any of the variables, except for bio8. The variables bio9 and bio15, as well as PC2 (strongly associated with bio15), all evolved under an Ornstein–Uhlenbeck model, which indicates a stabilizing selection towards a trait optimum for TreeA. Contrary for TreeT, neither the λ nor the κ model suggested a phylogenetic signal in PNOs for all bioclimatic variables, including PC1.
Pagel’s λ examines the degree to which the relationship and shared evolutionary history of species have driven the trait distribution at the tip branches. It implies that the climatic niches of the taxa are not independent of their phylogenetic relationships. κ indicates a punctuated mode of trait evolution rather than a gradual one. It is often interpreted to denote that changes in traits are concentrated at speciation events, in turn suggesting niche stasis along tree branches. This interpretation implicitly assumes that all speciation events are covered in the phylogenetic tree [38], whereas TreeT (64 species) and TreeA (76 species) do not meet this assumption (to date 81 leaf-warbler species are recognized, IOC World Bird List v12.1, [14]). This emphasizes the issue of the number of species lacking in a phylogenetic tree (see, e.g., [11]) and indicates that any results on trait evolution based on phylogenetic trees should be treated with caution. Besides potential cryptic species, the phylogeny of a given taxon could not be complete, as recent species could have gone extinct before having been discovered in the field. Clade F illustrates the differences between the (incomplete) phylogenies represented by TreeA and TreeT, which influence the fit of the evolutionary models. In TreeT the only members of clade F are P. grammiceps and P. castaniceps, which have diverged very recently (Figure 1). In TreeA, P. montis is the sister species of P. grammiceps, whereas the divergence of P. grammiceps and P. castaniceps happened much earlier in the past. Shorter tip branches tend to increase λ values more than longer branches, in turn indicating a strong influence of a close phylogenetic relationship between two species on the trait distribution. Therefore, even slight differences in the relationships between species can greatly influence the estimated mode of trait evolution and phylogenetic signal seen in traits.
Our analyses corroborate what some authors (e.g., [33,39]) pointed out before; the BM model is not necessarily the most appropriate evolutionary model for all traits. Based on that, Silvestro et al. [40] showed that measurement errors in trait values can bias model selection against the BM model, our study provides strong evidence against a BM model.
5. Conclusions
In this study, we demonstrate that phylogenetic trees used to model the evolution of climatic niches within leaf-warblers impact the evolutionary results inferred. The two trees applied differed in the number of extant species and, in consequence, in the number of internal nodes as well as in the divergence times of species. The number of species (nodes) increased steadily over the evolutionary history of this bird family for TreeA, whereas for TreeT it slowed down after an initial increase and then later increased again. Our results suggest that the number of species that are represented in a phylogeny at a given time strongly influence the phylogenetic signal estimated for bioclimatic variables, the estimation of the model of evolution of the climatic niche and the calculated DTT and MDI.
The taxonomy of leaf-warblers underwent several changes over the years and is still changing due to the discovery of previously unknown species and frequent reclassification of the extant taxa to full species or subspecies. The differences in the results between TreeA and TreeT, which sometimes result in opposite findings on the evolution of the climatic niches in the extant leaf-warblers, recommend caution when interpreting analyses involving phylogenetic trees, in particular in the absence of a scientific consensus on the exact relationship and ages of the species and their ancestors.
A future analysis utilizing an even more recent phylogeny might further strengthen this result, given that TreeA more accurately represents the relationships between leaf-warbler species and the timescale of their diversification than TreeT. A phylogeny based on whole genomes instead of few genetic loci can further reduce the effects of stochastic errors in phylogenetic analyses [41] and would allow for the identification of genes associated with changes in climatic tolerances. The continuous advancements in phylogenetics and phylogenomics and the frequent discovery of new leaf-warbler species will improve further studies on climatic niche evolution in this family in the future.
Besides potential errors introduced by phylogenetic trees, the results of our study do not accurately represent the climatic niche of each of the analyzed leaf-warbler species and their evolutions, as most leaf-warblers show long- or short-distance migration or altitudinal movements. Furthermore, our ecological niche models most probably did not cover the fundamental niches of species as only the breeding range documented in the Global Biodiversity Information Facility database was used for their establishment. We anticipate that an application of modelling approaches on fundamental niches [6,7] and an inclusion of the climate and occurrences in the wintering range for migratory species when calculating niche models will yield more accurate results on the current climatic tolerances of leaf-warblers and the evolution of their climatic niches. However, at present, the distribution of many leaf-warbler species outside the breeding season is insufficiently known.
Supplementary Materials
The following supporting information can be downloaded at: https://www.mdpi.com/article/10.3390/d17120844/s1, Figure S1: Reconstruction of estimated ancestral climatic tolerances for each of the extant leaf-warbler species. Predicted niche occupancy profiles are mapped onto the dated phylogeny calculated from a dataset by Alström et al. [19], TreeA and the phylogeny by Tietze et al. [18], TreeT to visualize the inferred history of niche occupancy. The x-axis shows a time interval of 12 million years ago (−12.0) until now (0.0), the y-axis shows parameter space (temperature in °C, precipitation in mm). Colours represent clades of closely related species, vertical lines to the right of the traitgram show 80% central density of the climate tolerance, with the mean indicated by a diamond. Crossing branches indicate convergent niche evolution between the taxa. (a) Mean annual temperature (bio1), (b) mean diurnal range (bio2), (c) isothermality (bio3), (d) temperature seasonality (bio4), (e) maximum temperature of the warmest month (bio5), (f) minimum temperature of the coldest month (bio6), (g) annual temperature range (bio7), (h) mean temperature of the wettest quarter (bio8), (i) mean temperature of the driest quarter (bio9), (j) mean temperature of the warmest quarter (bio10), (k) mean temperature of the coldest quarter (bio11), (l) annual precipitation (bio12), (m) precipitation of the wettest month (bio13), (n) precipitation of the driest month (bio14), (o) precipitation seasonality (bio15), (p) precipitation of the wettest quarter (bio16), (q) precipitation of the driest quarter (bio17), (r) precipitation of the warmest quarter (bio18), (s) precipitation of the coldest quarter (bio19). TreeA on the left, TreeT on the right. Legend shows clade colour code in order of TreeA (X first, K last); Figure S2: accumulation of relative disparity through time (DTT) for leaf-warblers based on the phylogeny calculated from a dataset by Alström et al. [19], TreeA and the phylogeny by Tietze et al. [18], TreeT for each of the 19 individual bioclimatic variables (solid line). Dashed line marks the median disparity for 100 simulations under Brownian motion, shaded area denotes the 95% confidence interval from the simulations, (a) mean annual temperature (bio1), (b) mean diurnal range (bio2), (c) isothermality (bio3), (d) temperature seasonality (bio4), (e) maximum temperature of the warmest month (bio5), (f) minimum temperature of the coldest month (bio6), (g) annual temperature range (bio7), (h) mean temperature of the wettest quarter (bio8), (i) mean temperature of the driest quarter (bio9), (j) mean temperature of the warmest quarter (bio10), (k) mean temperature of the coldest quarter (bio11), (l) annual precipitation (bio12), (m) precipitation of the wettest month (bio13), (n) precipitation of the driest month (bio14), (o) precipitation seasonality (bio15), (p) precipitation of the wettest quarter (bio16), (q) precipitation of the driest quarter (bio17), (r) precipitation of the warmest quarter (bio18), (s) precipitation of the coldest quarter (bio19). TreeA on the left, TreeT on the right; Figure S3: principal-component analysis biplots of 19 bioclimatic variables and extant leaf-warblers; x-axis shows principal component (PC) 1, y-axis shows PC2 and the respective percentage of variation covered by each. Length of arrows give the contribution of each variable to the PC, angle indicates their correlation (>90° = negatively correlated, 90° = no correlation, <90° = positively correlated). (a) PCs for all species included in the phylogeny calculated from a dataset by Alström et al. [19], TreeA (see Table 1). (b) PCs for all species included in the phylogeny by Tietze et al. [18], TreeT; Table S1: Overview of the extant leaf-warbler species and their names according to the IOC World Bird List [14], in the publication by Alström et al. [19], Tietze et al. [18] and this study. P. = Phylloscopus, S. = Seicercus. Table S2: weighted means of predicted niche occupancy profiles for each leaf-warbler species and bioclimatic variable. For definition of the variables and their units see Table 1. Table S3: pairwise niche overlap of the extant leaf-warbler species for 19 bioclimatic variables altogether, expressed by values of Schoener’s D. Species are grouped by clades (see Figure 1) and the average (avg) overlap within each clade is noted beneath it. Table S4: comparison of morphological disparity index (MDI) values for 19 bioclimatic variables altogether, individually and principal components (PC1, PC2), between the phylogeny calculated from a dataset by Alström et al. [19], TreeA and the phylogeny by Tietze et al. [18], TreeT. MDI denotes the difference between the relative disparity of 100 simulations under Brownian motion evolution and the observed relative disparity. Positive values indicate that disparity is distributed within subclades, negative values indicate that disparity is distributed among subclades. Table S5: best fit evolutionary model, as determined by the AICc score, and phylogenetic signal (Blomberg’s K and Pagel’s lambda) for the phylogeny calculated from a dataset by Alström et al. [19], TreeA, and the phylogeny by Tietze et al. [18], TreeT and each of the 19 bioclimatic variables and the first two principal components (PC1, PC2). Bold letters show instances in which identical models were indicated as the best fit for both phylogenies. The p-value indicates whether K is significantly different from zero. AICc values show the fit of the evolutionary models (lowest value indicates best fit). BM = Brownian motion, OU = Ornstein-Uhlenbeck, EB = Early burst.
Author Contributions
Conceptualization, D.T.T.; methodology, D.T.T., J.O. and L.G.; software, D.T.T., J.O. and L.G.; validation, D.T.T. and E.M.G.; formal analysis, D.T.T., J.O. and L.G.; investigation, D.T.T., J.O. and L.G.; resources, D.T.T. and J.O.; data curation, D.T.T. and J.O.; writing—original draft preparation, L.G.; writing—review and editing, D.T.T., E.M.G. and J.O.; visualization, L.G.; supervision, D.T.T. and E.M.G.; project administration, D.T.T.; funding acquisition, D.T.T. All authors have read and agreed to the published version of the manuscript.
Funding
This research was funded by the former Center of Natural History, Universität Hamburg.
Institutional Review Board Statement
Not applicable.
Data Availability Statement
GBIF occurrence downloads on 15 July 2020 (DOIs: 10.15468/dl.nphawr, 10.15468/dl.cuvymc, 10.15468/dl.zpt43q, 10.15468/dl.63s2zs, 10.15468/dl.3v2ex2).
Acknowledgments
Andrea Radtke helped with reconstructing TreeA on HUMMEL, the computer cluster of Universität Hamburg.
Conflicts of Interest
The authors declare no conflicts of interest.
References
- Evans, M.E.K.; Smith, S.A.; Flynn, R.S.; Donoghue, M.J. Climate, niche evolution, and diversification of the “Bird-Cage” Evening Primroses (Oenothera, sections Anogra and Kleinia). Am. Nat. 2009, 173, 225–240. [Google Scholar] [CrossRef]
- Nyári, Á.S.; Reddy, S. Comparative phyloclimatic analysis and evolution of ecological niches in the Scimitar Babblers (Aves: Timaliidae: Pomatorhinus). PLoS ONE 2013, 8, e55629. [Google Scholar] [CrossRef]
- Buckley, L.B.; Davies, T.J.; Ackerly, D.D.; Kraft, N.J.B.; Harrison, S.P.; Anacker, B.L.; Cornell, H.V.; Damschen, E.I.; Grytnes, J.-A.; Hawkins, B.A.; et al. Phylogeny, niche conservatism and the latitudinal diversity gradient in mammals. Proc. R. Soc. B Biol. Sci. 2010, 277, 2131–2138. [Google Scholar] [CrossRef]
- Warren, D.L.; Glor, R.E.; Turelli, M. Environmental niche equivalency versus conservatism: Quantitative approaches to niche evolution. Evolution 2008, 62, 2868–2883. [Google Scholar] [CrossRef]
- Phillips, S.J.; Dudík, M.; Schapire, R.E. Maxent Software for Modeling Species Niches and Distributions (3.4.1). 2020. Available online: http://biodiversityinformatics.amnh.org/open_source/maxent/ (accessed on 13 October 2020).
- Saupe, E.E.; Barve, N.; Owens, H.L.; Cooper, J.C.; Hosner, P.A.; Peterson, T. Reconstructing ecological niche evolution when niches are incompletely characterized. Syst. Biol. 2018, 67, 428–438. [Google Scholar] [CrossRef]
- Owens, H.L.; Ribeiro, V.; Saupe, E.E.; Cobos, M.E.; Hosner, P.A.; Cooper, J.C.; Samy, A.M.; Barve, V.; Barve, N.; Muñoz, R.C.J.; et al. Acknowledging uncertainty in evolutionary reconstructions of ecological niches. Ecol. Evol. 2020, 10, 6967–6977. [Google Scholar] [CrossRef] [PubMed]
- Kapli, P.; Flouri, T.; Telford, M.J. Systematic errors in phylogenetic trees. Curr. Biol. 2020, 31, R51–R66. [Google Scholar] [CrossRef] [PubMed]
- Steenwyk, J.L.; Li, Y.; Zhou, X.; Shen, X.-X.; Rokas, A. Incongruence in the phylogenomic era. Nat. Rev. Genet. 2023, 14, 834–850. [Google Scholar] [CrossRef] [PubMed]
- Gastauer, M.; Meira-Neto, J.A.A. Avoiding inaccuracies in tree calibration and phylogenetic community analysis using Phylocom 4.2. Ecol. Inform. 2013, 15, 85–90. [Google Scholar] [CrossRef]
- Irwin, D.E.; Alström, P.; Olsson, U.; Benowitz-Fredericks, Z.M. Cryptic species in the genus Phylloscopus (Old World leaf-warblers). Ibis 2001, 143, 233–247. [Google Scholar] [CrossRef]
- del Hoyo, J.; Collar, N.J. HBW and BirdLife International Illustrated Checklist of the Birds of the World. Volume 2: Passerines; Lynx Editions: Barcelona, Spain, 2016. [Google Scholar]
- Boyd, J.H. Taxonomy in Flux Checklist 3.08. 2017. Available online: http://jboyd.net/Taxo/List.html (accessed on 14 February 2022).
- Gill, F.; Donsker, D.; Rasmussen, P. IOC World Bird List (v12.1). 2022. Available online: https://www.worldbirdnames.org/ioc-lists/crossref/ (accessed on 12 March 2022).
- del Hoyo, J.; Elliott, A.; Christie, D.A. (Eds.) Handbook of the Birds of the World. Volume 11. Old World Flycatchers to Old World Warblers; Lynx Editions: Barcelona, Spain, 2006. [Google Scholar]
- Alström, P.; Olsson, U.; Lei, F. A review of the recent advances in the systematics of the avian superfamily Sylvioidea. Chin. Birds 2013, 4, 99–131. [Google Scholar] [CrossRef]
- Fick, S.E.; Hijmans, R.J. WorldClim 2: New 1-km spatial resolution climate surfaces for global land areas. Int. J. Climatol. 2017, 37, 4302–4315. [Google Scholar] [CrossRef]
- Tietze, D.T.; Martens, J.; Fischer, B.S.; Sun, Y.; Klussmann-Kolb, A.; Päckert, M. Evolution of leaf-warbler songs (Aves: Phylloscopidae). Ecol. Evol. 2015, 5, 781–798. [Google Scholar] [CrossRef] [PubMed]
- Alström, P.; Rheindt, F.E.; Zhang, R.; Zhao, M.; Wang, J.; Zhu, X.; Gwee, C.Y.; Hao, Y.; Ohlson, J.; Jia, C.; et al. Complete species-level phylogeny of the leaf-warbler (Aves: Phylloscopidae) radiation. Mol. Phylogenet. Evol. 2018, 126, 141–152. [Google Scholar] [CrossRef] [PubMed]
- Heled, J.; Drummond, A.J. Bayesian inference of species trees from multilocus data. Mol. Biol. Evol. 2010, 27, 570–580. [Google Scholar] [CrossRef]
- Schoener, T.W. The Anolis lizards of Bimini: Resource partitioning in a complex fauna. Ecology 1968, 49, 704–726. [Google Scholar] [CrossRef]
- Heibl, C.; Calenge, C. Phyloclim: Integrating Phylogenetics and Climatic Niche Modeling. R Package Version 0.9.5. 2018. Available online: https://github.com/heibl/phyloclim/ (accessed on 10 November 2021).
- Rödder, D.; Lötters, S. Niche shift versus niche conservatism? Climatic characteristics of the native and invasive ranges of the Mediterranean house gecko (Hemidactylus turcicus). Glob. Ecol. Biogeogr. 2009, 18, 674–687. [Google Scholar] [CrossRef]
- Jakob, S.S.; Heibl, C.; Rödder, D.; Blattner, F.R. Population demography influences climatic niche evolution: Evidence from diploid American Hordeum species (Poaceae). Mol. Ecol. 2010, 19, 1423–1438. [Google Scholar] [CrossRef] [PubMed]
- Pennell, M.W.; Eastman, J.M.; Slater, G.J.; Brown, J.W.; Uyeda, J.C.; FitzJohn, R.G.; Alfaro, M.E.; Harmon, L.J. Geiger v2.0: An expanded suite of methods for fitting macroevolutionary models to phylogenetic trees. Bioinformatics 2014, 30, 2216–2218. [Google Scholar] [CrossRef]
- Pagel, M. Inferring the historical patterns of biological evolution. Nature 1999, 401, 877–884. [Google Scholar] [CrossRef]
- Blomberg, S.P.; Garland, T.; Ives, A.R. Testing for phylogenetic signal in comparative data: Behavioral traits are more labile. Evolution 2003, 57, 717–745. [Google Scholar] [CrossRef]
- Münkemüller, T.; Lavergne, S.; Bzeznik, B.; Dray, S.; Jombart, T.; Schiffers, K.; Thuiller, W. How to measure and test phylogenetic signal. Methods Ecol. Evol. 2012, 3, 743–756. [Google Scholar] [CrossRef]
- Kamilar, J.M.; Cooper, N. Phylogenetic signal in primate behaviour, ecology and life history. Philos. Trans. R. Soc. B Biol. Sci. 2013, 368, 20120341. [Google Scholar] [CrossRef]
- Felsenstein, J. Maximum-likelihood estimation of evolutionary trees from continuous characters. Am. J. Hum. Genet. 1973, 25, 471–492. [Google Scholar] [PubMed]
- Butler, M.A.; King, A.A. Phylogenetic comparative analysis: A modeling approach for adaptive evolution. Am. Nat. 2004, 164, 683–695. [Google Scholar] [CrossRef] [PubMed]
- Harmon, L.J.; Losos, J.B.; Davies, T.J.; Gillespie, R.G.; Gittleman, J.L.; Jennings, W.B.; Kozak, K.H.; A McPeek, M.; Moreno-Roark, F.; Near, T.J.; et al. Early bursts of body size and shape evolution are rare in comparative data. Evolution 2010, 64, 2385–2396. [Google Scholar] [CrossRef]
- Boucher, F.C.; Thuiller, W.; Davies, T.J.; Lavergne, S. Neutral biogeography and the evolution of climatic niches. Am. Nat. 2014, 183, 573–584. [Google Scholar] [CrossRef]
- Harmon, L.J.; Schulte, J.A.; Larson, A.; Losos, J.B. Tempo and mode of evolutionary radiation in Iguanian lizards. Science 2003, 301, 961–964. [Google Scholar] [CrossRef]
- Rödder, D.; Engler, J.O. Quantitative metrics of overlaps in Grinnellian niches: Advances and possible drawbacks. Glob. Ecol. Biogeogr. 2011, 20, 915–927. [Google Scholar] [CrossRef]
- Eyres, A.; Böhning-Gaese, K.; Orme, C.D.L.; Rahbek, C.; Fritz, S.A. A tale of two seasons: The link between seasonal migration and climatic niches in passerine birds. Ecol. Evol. 2020, 10, 11983–11997. [Google Scholar] [CrossRef]
- Cooper, J.C. Ecological niche divergence or ecological niche partitioning in a widespread Neotropical bird lineage. PeerJ 2024, 12, e17345. [Google Scholar] [CrossRef] [PubMed]
- Harmon, L.J. Phylogenetic Comparative Methods: Learning from Trees; Open Textbook Library: Minneapolis, MN, USA, 2019. [Google Scholar]
- Freckleton, R.P.; Harvey, P.H. Detecting non-Brownian trait evolution in adaptive radiations. PLoS Biol. 2006, 4, e373. [Google Scholar] [CrossRef]
- Silvestro, D.; Kostikova, A.; Litsios, G.; Pearman, P.B.; Salamin, N. Measurement errors should always be incorporated in phylogenetic comparative analysis. Methods Ecol. Evol. 2015, 6, 340–346. [Google Scholar] [CrossRef]
- Young, A.D.; Gillung, J.P. Phylogenomics—Principles, opportunities and pitfalls of big-data phylogenetics. Syst. Entomol. 2019, 45, 225–247. [Google Scholar] [CrossRef]
Disclaimer/Publisher’s Note: The statements, opinions and data contained in all publications are solely those of the individual author(s) and contributor(s) and not of MDPI and/or the editor(s). MDPI and/or the editor(s) disclaim responsibility for any injury to people or property resulting from any ideas, methods, instructions or products referred to in the content. |
© 2025 by the authors. Licensee MDPI, Basel, Switzerland. This article is an open access article distributed under the terms and conditions of the Creative Commons Attribution (CC BY) license (https://creativecommons.org/licenses/by/4.0/).