Abstract
In Sicily, many natural water bodies were reclaimed over the last two centuries for malaria control and agricultural expansion, causing widespread habitat loss. Some of these former ponds (still locally called “lakes”) reappear occasionally after extreme rainfall, temporarily restoring aquatic habitats but remaining poorly documented. We confirm the occurrence of such episodic ponds in central Sicily (Sommatino–Riesi) and present one of these ponds (Lago Montagna) as a case study. Combining satellite observations with field surveys conducted during a spring 2025 inundation, we document repeated episodes of flooding and a remarkable aquatic flora, including charophytes and other taxa of conservation interest. Episodic inundation events, therefore, act as transient refugia and stepping stones for regional biodiversity within an otherwise dry landscape. Because these systems commonly escape routine monitoring and legal protection, we argue they should be explicitly recognized in regional conservation planning and long-term monitoring programs. Moreover, the integrated remote-sensing approach used here allows the detection of overlooked temporary wetland ecosystems and provides fine-scale hydrological insights often missed by sparse weather station networks or satellite-derived rainfall data.
Keywords:
aquatic flora; Characeae; CHIRPS; Copernicus; lakes; Landsat; Mediterranean Temporary Ponds; pluviometry; sentinel 2; wetlands 1. Introduction
Wetland ecosystems are among the world’s most valuable environments on the planet [1], providing a broad suite of ecosystem services, including water storage, flood attenuation, sediment trapping, water purification, and carbon sequestration [2]. Despite their ecological and socio-economic importance, wetlands have experienced substantial declines over the last century, with global estimates suggesting a reduction of around 50% in their total area [3]. These ecosystems are severely threatened by multiple human pressures such as agricultural intensification, land conversion, and climate change, and continue to disappear at alarming rates [4].
Within European legislation, the Water Framework Directive [5] promoted standardized physico-chemical and biological indicators to assess the ecological status of surface waters. Nevertheless, many temporary and small waterbodies are still marginalized by routine monitoring and management frameworks—often due to size thresholds or practical constraints—and, therefore, in many cases remain under-represented and overlooked in conservation planning [6,7]. This gap is particularly critical in Mediterranean and other arid or semi-arid regions, where temporary wetlands are abundant and often outnumber permanent lakes and rivers [7,8]. Consequently, recent data-driven work has emphasized the need for clearer functional distinctions, proposing specific geometric thresholds that help to differentiate ponds from lakes/wetlands (e.g., ponds < 5 ha, <5 m depth, <30% emergent vegetation), highlighting how size/depth cut-offs can dictate whether a waterbody falls inside or outside routine assessment frameworks [9].
From a hydrological perspective, temporary lentic systems can be classified into two main categories based on their predictability [10]: intermittent waters and episodic waters. Intermittent waters fill and dry following regular and predictable cycles. This category often includes seasonally inundated basins such as many Mediterranean temporary ponds, which are characterized by a predictable wet winter/spring period followed by a dry summer. These systems host highly specialized aquatic and semi-aquatic communities, but their small size makes them highly susceptible to hydrological change [4]. Instead, episodic waters flood only sporadically and irregularly, typically after exceptional meteorological events (such as intense or prolonged rainfall or rapid snowmelt). Their hydroperiods are unpredictable, and they may remain dry for several years. This irregularity profoundly influences the adaptive strategies of aquatic species, driving the evolution of extreme life history traits such as diapause, desiccation-resistant spores or eggs, and rapid development [11,12,13]. Therefore, compared with the more studied temporary systems, episodic ponds—by nature unpredictable and short-lived—are among the least understood aquatic habitats [14,15]. As a result, the abiotic and biological responses they trigger are often neglected in environmental monitoring programs, which traditionally focus on more stable or cyclic systems [16]. However, these responses are attracting growing interest in the context of climate change, which is expected to increase both the frequency and intensity of extreme weather events. Despite their ecological fragility, when flooded during exceptionally wet years, these wetland ecosystems can sustain rich assemblages of aquatic vegetation and specialized fauna, revealing both fragility and remarkable resilience [17,18]. Overall, episodic ponds represent ideal natural laboratories for understanding the response of Mediterranean aquatic ecosystems to extreme hydrological disturbances and offer crucial insights for biodiversity conservation in environments characterized by high climatic variability.
In many Mediterranean regions—and specifically in many sectors of Sicily—historic drainage, twentieth-century reclamation works, agricultural intensification, urbanization and long-term reductions in river flows have led to a strong contraction of wetland area, altered hydrological regimes and induced local losses of wetland habitats [19]. These pressures have fragmented the wetland network and increased the probability that small, ephemeral basins will be lost or can no longer play their ecological role. Here we present a case study of an episodic pond in the municipality of Sommatino (Sicily), aiming to characterize its hydrological dynamics and ecological relevance. The presence of former (reclaimed) “lakes” in the area between Sommatino and Riesi (known as “Lago Montagna”, “Lago Burgio”, Lago di Manganello”, “Lago Grottille”, “Lago Papardone”) was already assessed, and for some of them it was known that in correspondence with particularly rainy seasons they were able to appear again [19], but no data is available regarding hydrology, biology and ecology of these sites. As reported by Williams et al. [14] “episodic lakes ipso facto have been little studied by limnologists. They are often inaccessible, only infrequently and unpredictably contain water as noted”. Hence, we took advantage of the presence of water in Lago Montagna during spring 2025 to conduct floristic surveys, document aquatic vegetation, and identify resilient or conservation-relevant species associated with the basin. At the same time, we reconstructed the recent hydrological dynamics of the pond through satellite imagery and precipitation data, focusing on hydroperiod, frequency, duration, and seasonality. In parallel, we analyzed local precipitation trends using satellite-derived (CHIRPS, Climate Hazards Center InfraRed Precipitation with Station data; [20]) and ground-based (SIAS, Servizio Informativo Agrometeorologico Siciliano; [21]) datasets, and modeled the probability of pond formation as a function of cumulative rainfall. Through an integrated approach combining remote sensing, statistical analysis, and field observations, this case study contributes to a broader understanding of Mediterranean episodic ponds, underscoring their ecological importance and the urgent need to incorporate them into regional monitoring and conservation frameworks.
2. Materials and Methods
2.1. Study Area
Lago Montagna is located in central Sicily (Italy), approximately 1.5 km southeast of the municipality of Sommatino (Province of Caltanissetta). The pond lies within an endorheic basin situated at approximately 37.318° N and 14.006° E, at an elevation of about 345 m above sea level (Figure 1).
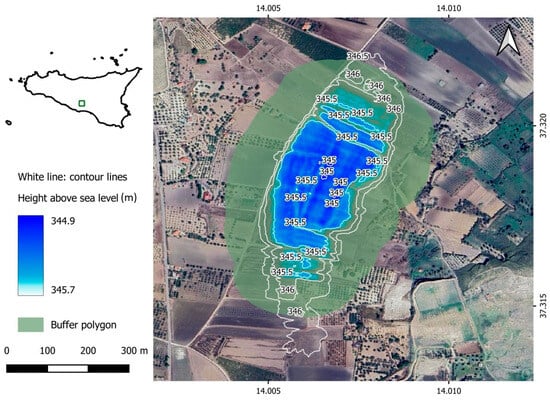
Figure 1.
Localization of Lago Montagna. The green box indicates the study area. (satellite image 2023 © Google).
The maximum flooded area of the pond is approximately 12 ha, and its maximum depth is 70 cm. This episodic pond develops periodically following intense rainfall events and persists for variable durations depending on annual precipitation patterns and evapotranspiration rates. In years when the pond does not form, this area is primarily used for wheat (or other annual crops) cultivation and is therefore regularly plowed, a practice that effectively prevents the establishment of a complex and stable plant community. The surrounding landscape is characterized by gently undulating terrain dominated by agricultural land (mostly cereal crops, olive groves, vineyards) and sparse Mediterranean scrub, typical of the hilly environments of central Sicily. The regional climate is typically Mediterranean semi-arid, with dry, hot summers and mild, wet winters. The pond polygon was delineated in QGIS version 3.40 LTR [22] primarily from high-resolution satellite imagery and subsequently validated using a 2 m resolution LiDAR-derived Digital Terrain Model (DTM) [23]. A 100 m buffer was applied to the pond polygon to define the surrounding area used for subsequent analyses in Google Earth Engine (GEE) [24].
2.2. Satellite Remote Sensing and Hydroperiod Dynamics
To investigate the pond hydroperiod, a time series of preprocessed multispectral satellite images was analyzed in GEE (Table 1).

Table 1.
Satellite datasets included in our analysis.
Several indices have been developed for the identification of water-covered surfaces, such as Normalized Difference Water Index (NDWI) [25], Modified Normalized Difference Water Index (MNDWI) [26], Normalized Difference Pond Index (NDPI) [27], Water Ratio Index (WRI) [28], Automated Water Extraction Index (AWEI) [29], Land Surface Temperature Based Water Extraction Index (LBWEI) [30] and Normalized Water Index (NWI) [31]. These indices respond differently to water features and are often used in combination to achieve more accurate results [32,33,34]. Moreover, the thresholds used to delineate flooded areas for each index can be optimized according to soil type and vegetation cover [35].
In our case, the MNDWI was computed over the vectorized pond polygon to quantify temporal changes in surface water extent. For Copernicus Sentinel-2 Level-2A imagery [36], a water detection threshold of 0.1 was applied to identify water-covered pixels, while for Landsat Collection 2, Tier 1, Level-2 imagery [37], a slightly lower threshold of 0.05 was used. These thresholds were visually calibrated against high-resolution optical imagery to ensure accurate water surface identification. The use of a single index and fixed thresholds may introduce some inaccuracies in the delineation of flooded areas over the years; however, in our case, this approach was considered adequate since only the binary presence/absence of water was used in the analyses.
To minimize false-positive detections caused by clouds or shadows, images showing water-like values above the threshold along the edges of the reference polygon were excluded from the analysis. Detected pond surface variations were manually corrected to account for potential false negatives during submersion periods. A minimum water-covered area of 2000 m2 was adopted to assign a binary presence/absence value for the pond at each time step. When this threshold is preceded by a dry period, the pond is considered absent for the corresponding date; conversely, when it follows a flooding period, the pond is still considered present. This criterion was introduced to exclude occasional flooding of small depressions within the pond surface from being classified as a “pond presence” event.
2.3. Precipitation Data
Daily precipitation data were obtained from both satellite-derived and ground-based sources. Local satellite rainfall data were extracted from the CHIRPS Daily Precipitation dataset via GEE. The CHIRPS dataset spans 1 January 1984–30 August 2025. Ground-based daily precipitation data (23 January 2002–30 August 2025) were provided by the SIAS meteorological network. The meteorological stations used in this study are listed in Table 2.
Table 2.
Stations of the SIAS meteorological network are included in our analysis.
For Lago Montagna, daily rainfall was estimated using inverse distance weighting (IDW) with a power value of two, emphasizing the contribution of the closest stations.
Data processing and statistical analysis were carried out within a Python environment v.3.13.7 [38], using several libraries: pandas v.2.3.3 [39] for data manipulation and table management, NumPy v.2.0.2 [40] for numerical operations, datetime (built-in Python module) for time-series handling, matplotlib v.3.9.4 [41] for data visualization, SciPy.stats v.1.13.1 [42] for statistical computations, pymannkendall v.1.4.3 [43] for non-parametric trend detection analyses, scikit-learn v.1.6.1 [44] for statistical performance evaluation, including logistic regression and precision–recall curve computation, and statsmodels.api v.0.14.5 [45] for logistic probability curve fitting.
Subsequently, precipitation data were temporally aligned with the available satellite imagery. For each acquisition date corresponding to a satellite image, cumulative rainfall values over 30, 60, 90, 120, 150, and 180 days were calculated for both the satellite-derived and ground-based datasets.
To assess which cumulative rainfall window was the best predictor of pond occurrence, precision–recall analyses were performed for each class. Finally, the two most predictive rainfall classifiers were used to fit a logistic regression model, where the binary response variable represented pond presence/absence. The resulting model allowed the estimation of the probability of pond formation as a continuous function of cumulative rainfall.
2.4. Floristic Survey
The floristic data presented in this study derive from opportunistic observations carried out during hydrological monitoring campaigns and should therefore be regarded as preliminary qualitative information. Vascular plants and charophytes (Characeae) were collected during field surveys made during 2025 (18 March, 22 April, 3 May, 14 July), then identified and named after Pignatti et al. [46] and with the help of specific literature [47] for vascular plants, and Schubert et al. [48] for Characeae. The specimens were usually collected by hand. Some were preserved in water for morphological observations, some dried as herbarium specimens and stored in PAL (herbaria codes according to Thiers [49]). Morphological features of the specimens were studied using Leica stereomicroscopes (MZ9.5) (Leica Microsystems GmbH, Wetzlar, Germany).
On one occasion (22 April 2025), some water parameters [electrical conductivity, total dissolved solids (TDS), salinity content (PSU), temperature] were measured with the waterproof portable microprocessor-based multimeter Hanna HI98192 (Hanna Instruments; Woonsocket, RI, USA), while pH was measured separately with the Hanna Checker Plus HI98100 (Hanna Instruments; Woonsocket, RI, USA). Measurements were made along the shoreline, sub-superficially.
3. Results
3.1. Frequency, Duration, and Seasonal Distribution of Pond Formation Events (1984–2025)
During the observation period 1984–2025, thirteen ephemeral pond formation events were identified, corresponding to an average frequency of one event every 3.2 years (Figure 2A). Although the analysis of the annual frequency of pond occurrence shows a positive slope (slope = 0.020/year), indicating a slight increase in the probability of pond presence over time (Figure 2B), this increase is not statistically significant (p-value = 0.456). The six-year moving average (blue dashed line) nonetheless highlights a higher density of years with pond presence in the last two decades, suggesting a potential increase in formation frequency.
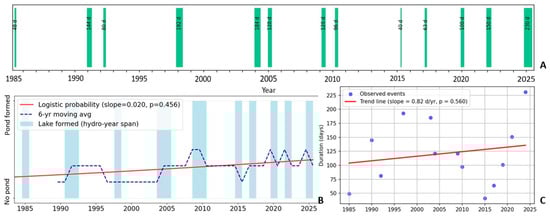
Figure 2.
(A) Periods of pond formation (presence = green) (numbers are the days of permanence of the pond). (B) Trend in pond formation over time (Hydrological year August–July). The p-value was obtained from a Wald test applied to the logistic regression model. (C) Trend in pond duration over time. The p-value was obtained from a t-test applied to the slope of the Ordinary Least Squares (OLS) linear regression.
The mean duration of pond persistence is 121.5 days (median = 121), with a maximum of 230 days observed during the 2024/2025 event.
Linear regression analysis of the 13 observed events reveals a positive slope (slope = 0.82 days/year), suggesting a slight lengthening of the average pond duration over time (Figure 2C). However, strong interannual variability renders this trend statistically non-significant (p-value = 0.560).
The analysis of the monthly frequency distribution (Figure 3) reveals a clear seasonal pattern of pond occurrence. When present, the pond typically forms between late autumn and early winter, reaching its maximum extent between January (28.4%) and February (33.3%), followed by a gradual drying phase from March (25.3%) to June (8.3%).
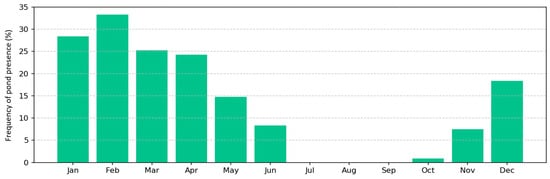
Figure 3.
Frequency of pond presence by month (all years).
Summer months are consistently devoid of pond presence, while during autumn, formation may occasionally begin following particularly intense rainfall events.
3.2. Analysis of Precipitation Trends (2002–2025)
Annual precipitation series (aggregated from August to July) for the period 2002–2025 show divergent trends between the CHIRPS satellite-derived dataset and the SIAS meteorological station data (Figure 4). The Mann–Kendall trend analysis of CHIRPS data indicates a significant negative trend (Tau = −0.494, p = 0.0011) with a Theil–Sen slope of −10.9 mm/year, suggesting a progressive decrease in mean annual rainfall.
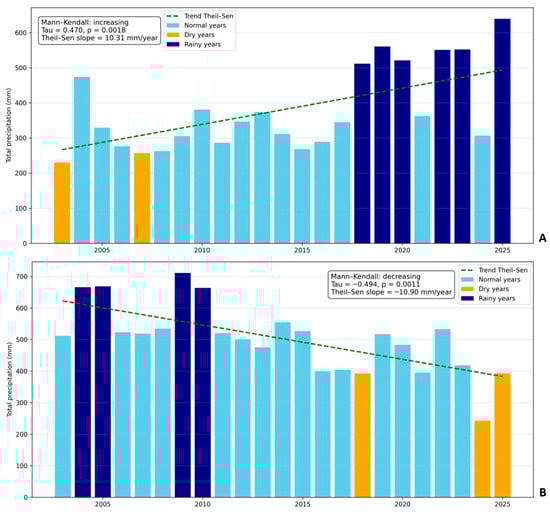
Figure 4.
Annual precipitation (Hydrological year August–July). (A) Data from SIAS. (B) Data from CHIRPS. Rainy (dry) years correspond to precipitation values above (below) the mean ± one standard deviation. The Mann–Kendall test was used to evaluate the statistical significance of trends in annual precipitation.
Conversely, SIAS data show a positive trend (Tau = +0.470, p = 0.0018) with a Theil–Sen slope of +10.31 mm/year, indicating an increase in total precipitation over the 2002–2025 period.
A qualitative comparison of the wettest and driest years reveals clear inconsistencies between the SIAS and CHIRPS datasets. While SIAS data indicate that the most intense wet periods occurred mostly in the late 2010s and early 2020s, CHIRPS points to earlier years, in the mid-to-late 2000s, as the wettest. Similarly, the driest years differ between the two datasets: SIAS highlights some years in the 2000s as particularly dry, whereas CHIRPS records more recent years, including the late 2010s and mid-2020s, as the driest.
These differences, when compared with periods of pond presence, indicate that neither dataset provides a fully representative estimate of local-scale rainfall conditions.
Figure 5 shows the 30-day cumulative precipitation averages and percentile ranges for the period 2002–2025. The dark blue line represents the mean cumulative precipitation, while the shaded areas indicate the interquartile (25th–75th percentile, medium blue) and the wider variability range (10th–90th percentile, light blue).
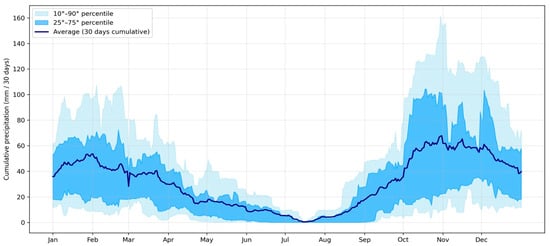
Figure 5.
30-day cumulative precipitation—averages and percentile ranges (2002–2025), based on SIAS data.
The analysis of the 30-day cumulative precipitation highlights a clear seasonal cycle, with a distinct wet period in autumn and winter and a dry one beginning in late spring and summer. During the wet months, the 30-day cumulative precipitation typically exceeds 40–60 mm, reaching peaks above 100 mm within the 90th percentile range. Conversely, the driest conditions occur between June and August, when cumulative precipitation often falls below 20 mm.
The width of the shaded areas reflects the interannual variability of precipitation. This variability is particularly high during the autumn–winter months, indicating that the intensity and duration of wet periods vary substantially from year to year. In contrast, summer months show lower variability, suggesting more stable and predictably dry conditions.
3.3. Relationship Between Cumulative Precipitation and Pond Formation
Precision–Recall curve analysis (Figure 6) indicates that, in this case, rainfall data derived from ground-based meteorological stations (SIAS) perform better in predicting pond formation than satellite-derived data (CHIRPS). In particular, the best-performing classifiers correspond to cumulative precipitation over 120 days (AUPRC = 0.542) and 150 days (AUPRC = 0.537).
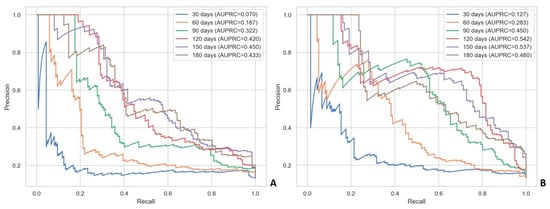
Figure 6.
Precision-Recall Curve over different cumulative precipitation windows. (A) Rainfall data from CHIRPS. (B) Rainfall data from SIAS.
The logistic analysis of pond presence probability as a function of cumulative precipitation over 120- and 150-day windows (SIAS data) (Figure 7) shows a pattern consistent with the expected hydrological response of the basin, revealing a non-linear increase in flooding probability with greater rainfall accumulation. The gradual transition of the curves suggests the influence of additional, unaccounted-for variables such as temperature, evaporation, intra-period rainfall distribution, and precipitation data accuracy.
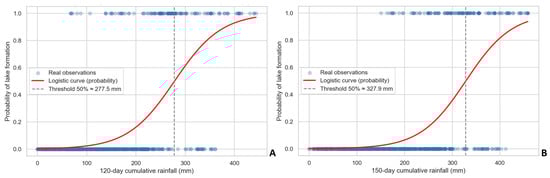
Figure 7.
Estimated probability of pond formation vs. cumulative rainfall over 120 days (A) and 150 days (B).
The 50% probability thresholds—that is, the precipitation values for which the probabilities of pond presence and absence are equal—correspond to 283.4 mm for the 120-day window and 335.6 mm for the 150-day window. These values can be interpreted as rainfall activation thresholds for the ephemeral pond system, beyond which the probability of pond occurrence becomes dominant.
The difference between the two temporal windows reflects the greater hydrological inertia of the system over longer timescales, in which moderate but repeated rainfall events contribute to pond system activation.
3.4. Aquatic Flora and Vegetation
A preliminary field survey carried out in spring-summer 2025, based on opportunistic observations conducted during the hydrological monitoring campaigns, documented an interesting hydrophilic flora closely associated with the different aquatic phases of the basin, confirming the conservation value of the site: lentic aquatic habitats are in fact very rare within a radius of ca 20 km around.
On 22 April 2025 (at noon), we detected the following water parameters: conductivity 208.1 mS cm−1, resistivity 481 K-omega, TDS (Total Dissolved Solids) 103.8 ppm, salinity 0.10 PSU, temperature = 22.4 °C, pH around 8.
Among the detected species, belonging both to Characeae and vascular plants (Table 3), we emphasize here the occurrence of the following taxa of biogeographic and conservation interest (Figure 8):
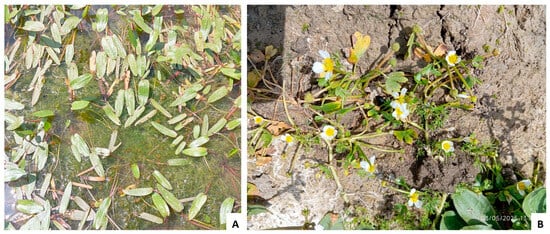
Figure 8.
(A) Damasonium bourgaei and Chara spp. meadow. (B) Ranunculus saniculifolius.
Chara oedophylla Feldm.-Maz. (Characeae): This is the second record for Sicily and Italy (after the one reported in Romanov et al. [50]) and one of the few records in Europe of this strictly Mediterranean taxon, featuring as NT in the European red-list [51].
Chara connivens Salzm. ex A. Braun (Characeae): Also in this case, this represents the second record of the species for Sicily (after the one reported by Troia & Ilardi [52]). It is not reported for peninsular Italy, but is present in Sardinia. It is an important record since its presence in Sicily is not reported in the recent European monograph [53].
Damasonium bourgaei Coss. (Alismataceae) (Figure 8A): Annual species typical of Mediterranean temporary ponds, it characterizes the annual amphibious communities of the Isoeto-Nanojuncetea class (see below). It was reported for many coastal sites of Sicily, but at present, it can be considered quite rare [54].
Ranunculus saniculifolius Viv. (Ranunculaceae) (Figure 8B): Rare in Sicily and Italy, its occurrence is poorly known due to a morphological overlap with other similar species.
Also, the aquatic vegetation covering the water body proves to be interesting: during springtime (Figure 9A) it is characterized by Characeae and Damasonium bourgaei, whereas after the pond dries out (Figure 9B) D. bourgaei remains, but another species dominates: Lythrum tribracteatum Salzm. ex Spreng. This second community can easily be referred to the phytosociological alliance Lythrion tribracteati Rivas Goday & Rivas-Martínez ex Rivas Goday 1970 (class Isoeto-Nanojuncetea Br.-Bl. and R. Tx. ex Westhoff, Dijk & Passchier 1946), but does not match with any of the associations already reported for Sicily [55]. The first (strictly aquatic) community should probably be referred to the class Charetea intermediae F. Fukarek 1961. As a whole, local plant communities may be referred to the priority habitat “3170 Mediterranean Temporary Ponds” identified by the European 92/43 ‘Habitats’ Directive [56].
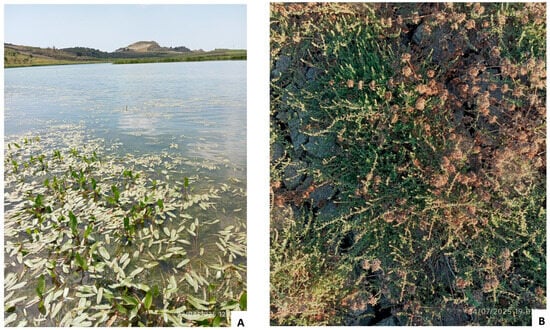
Figure 9.
(A) Panoramic view of Lago Montagna on 22 April 2025. (B) Lythrion tribracteati community on 14 July 2025.
Along the borders of the episodic pond, other species form a hygrophilous vegetation belt: Mentha pulegium L., Bolboschoenus glaucus (Lam.) S.G. Sm., Juncus bufonius L. s.l., Ranunculus sardous Crantz, etc.
Table 3.
Phytosociological relevés made in Lago Montagna (vegetation cover values according to the scale proposed by Braun-Blanquet [57]) (area 2 m2, total plant cover 90%).
Table 3.
Phytosociological relevés made in Lago Montagna (vegetation cover values according to the scale proposed by Braun-Blanquet [57]) (area 2 m2, total plant cover 90%).
| Taxa | 3 May 2025 | 14 July 2025 |
|---|---|---|
| Damasonium bourgaei | 3 | 4 |
| Chara connivens | 2 | - |
| Chara oedophylla | 2 | - |
| Ranunculus saniculifolius | + | - |
| Lythrum tribracteatum | - | 4 |
4. Discussion
To our knowledge, the presence of “episodic” ponds has never been reported in Europe, having been described only for other continents (e.g., Australia [15], America [58]) or for previous geological periods [59]. Therefore, the identification of Lago Montagna as an episodic pond represents a novel finding for the European context. This discovery broadens the typological spectrum of Mediterranean inland aquatic systems, introducing a category so far overlooked in European limnological literature.
The long-term temporal record (1984–2025) confirms the episodic nature of Lago Montagna, which is governed by irregular rather than stable seasonal cycles. This hydroperiod differs markedly from that of “temporary” ponds, which usually follow predictable seasonal flooding and drying phases. Such a distinction has important implications for habitat classification. The European Habitat 3170 (“Mediterranean Temporary Ponds”), which should include the system described here, could reasonably be subdivided into two sub-types (after Williams et al. [14]): (1) regular or seasonal ponds, which flood annually or almost annually, and (2) irregular or episodic ponds, which flood unpredictably.
The occurrence of numerous rare or elusive aquatic plant species emphasizes the unexplored potential for long-term persistence and germinability of propagules (seeds, spores, cysts) in the sediment bank. This, in turn, underlines the crucial ecological role of any wetland—however ephemeral—as a refuge and stepping stone for aquatic and semi-aquatic organisms. Such environments deserve formal recognition through protected-area designation or other conservation measures. Although we only recorded preliminary observations of birds (e.g., Himantopus himantopus [L. 1758]), insects (e.g., several species of Odonata), and amphibians (e.g., Discoglossus pictus Otth 1837), these and other animal groups warrant more detailed and systematic study.
Understanding the historical context of these episodic systems is also essential. Archival evidence (e.g., a 1907 note on the reclamation of “the lake near Sommatino” [60]) suggests that these basins may once have been seasonal or even permanent water bodies. Future transformations, whether toward re-naturalization, due to the gradual inefficiency of drainage systems, or toward further desiccation under climate change, should be carefully monitored to assess long-term hydrological and ecological trajectories.
Moreover, studying the hydrological regimes of such aquatic systems can also provide valuable insights into local hydrology and rainfall patterns. Episodic flooding events, detected through satellite imagery, may serve as fine-scale indicators of localized precipitation, offering a more realistic representation of spatial rainfall distribution than estimates derived solely from sparse ground meteorological networks or coarse satellite rainfall products.
Previous studies have shown that satellite-based precipitation estimates often fail to capture the spatial variability and local topographic effects that characterize many regions, and thus cannot be used as a direct substitute for gauge data—particularly in relatively small catchments or in areas with sparse rainfall networks [61,62]. At the same time, even rainfall measurements derived from ground-based meteorological stations may not fully resolve point-scale precipitation patterns, as orographic processes and local atmospheric dynamics can reduce the accuracy of these observations. This further highlights the potential value of satellite imagery, whose detection of transient flooding can provide an indirect yet spatially explicit feedback on actual rainfall distribution.
Therefore, combining multiple and complementary data sources—such as ground observations, satellite-based precipitation products, and remotely sensed indicators of temporary inundation—is essential for improving the accuracy and robustness of precipitation assessments. Moreover, as climate change increases the frequency of extreme and spatially heterogeneous rainfall events [63], where heavy precipitation may occur in narrow patches while nearby areas remain dry, integrating these diverse datasets becomes even more critical for capturing localized hydrological responses that might otherwise remain undetected.
Taken together, the threshold hydrological dynamics and the presence of high-value aquatic flora in Lago Montagna support two key conclusions:
- (1)
- intermittent and episodic systems can have high conservation value despite their temporal unpredictability, and
- (2)
- such systems should be explicitly integrated into monitoring and conservation planning. Conventional frameworks, often based on size thresholds or fixed sampling regimes, risk overlooking ecologically significant yet irregularly flooded areas [7,9].
At present, the area hosting Lago Montagna is not protected by any formal measures except for restrictions relating to the landscape [64]. We therefore propose the inclusion of Lago Montagna and its surroundings within a new Natura 2000 site. Such designation could encompass not only the pond itself but also adjacent environments of high ecological value, like cliffs, springs, river and badlands.
The multidisciplinary framework adopted in this study, combining satellite remote sensing, local meteorological data, statistical hydrology, and floristic fieldwork, proved effective for identifying and characterizing small, unmonitored aquatic systems. This integrative approach provides an effective tool for detecting, understanding, and conserving such overlooked and ecologically valuable ecosystems across the Mediterranean region.
Author Contributions
Conceptualization, A.T. and D.S.; methodology, A.T. and D.S.; software, D.S.; field investigations, A.T. and T.N.; species identification, D.S., R.D.L., V.I. and A.T.; formal analysis, data curation, D.S.; writing—original draft preparation, review and editing, A.T., D.S. and R.D.L. All authors have read and agreed to the published version of the manuscript.
Funding
This study is part of the WP2-Spoke 1 of the project “National Biodiversity Future Center—NBFC”, funded under the National Recovery and Resilience Plan (NRRP), Mission 4 Component 2 Investment 1.4—Call for tender No. 3138 of 16 December 2021, rectified by Decree No. 3175 of 18 December 2021 of Italian Ministry of University and Research funded by the European Union—NextGenerationEU; Project code CN_00000033, Concession Decree No. 1034 of 17 June 2022 adopted by the Italian Ministry of University and Research, CUP B73C22000790001.
Institutional Review Board Statement
Not applicable.
Informed Consent Statement
Not applicable.
Data Availability Statement
One dataset regarding rainfalls was obtained from CHIRPS and is available at https://developers.google.com/earth-engine/datasets/catalog/UCSB-CHG_CHIRPS_DAILY?hl=it (accessed on 18 September 2025); other climatic data were obtained from SIAS and are not readily available because subject to authorizations, requests to access the datasets should be directed to SIAS.
Acknowledgments
A.T. acknowledges Fabio Burgio and Simone Messina (Sommatino) for information on Lago Montagna and for their support during field investigations, and Amedeo Alberto Falci (Caltanissetta) for his remarks on the fauna and the useful discussions on the site. All the authors acknowledge Salvatore Pasta (CNR-IBBR) for valuable comments and suggestions on a draft of the article.
Conflicts of Interest
The authors declare no conflicts of interest.
Abbreviations
The following abbreviations are used in this manuscript:
| AWEI | Automated Water Extraction Index |
| CHIRPS | Climate Hazards Group InfraRed Precipitation with Station data |
| DTM | Digital Terrain Model |
| GEE | Google Earth Engine |
| LBWEI | Land Surface Temperature Based Water Extraction Index |
| NDPI | Normalized Difference Pond Index |
| NDWI | Normalized Difference Water Index |
| NWI | Normalized Water Index |
| MNDWI | Modified Normalized Difference Water Index |
| SIAS | Servizio Informativo Agrometeorologico Siciliano (Sicilian Agrometeorological Information Service) |
| WRI | Water Ratio Index |
References
- Mitsch, W.J.; Gosselink, J.G. Wetlands, 5th ed.; John Wiley & Sons: Hoboken, NJ, USA, 2015. [Google Scholar]
- Mitsch, W.J.; Bernal, B.; Hernandez, M.E. Ecosystem services of wetlands. Int. J. Biodivers. Sci. Ecosyst. Serv. Manag. 2015, 11, 1–4. [Google Scholar] [CrossRef]
- Finlayson, C.; D’Cruz, R. Inland water systems. In Ecosystems and Human Well-Being: Current State and Trends; Island Press: Washington, DC, USA, 2005; pp. 551–583. [Google Scholar]
- Zacharias, I.; Zamparas, M. Mediterranean temporary ponds. A disappearing ecosystem. Biodivers. Conserv. 2010, 19, 3827–3834. [Google Scholar] [CrossRef]
- European Parliament and the Council. Directive 2000/60/EC of the European Parliament and of the Council of 23 October 2000 establishing a framework for Community action in the field of water policy. Off. J. Eur. Communities 2000, L327, 1–73. [Google Scholar]
- Solimini, A.G.; Ptacnik, R.; Cardoso, A.C. Towards holistic assessment of the functioning of ecosystems under the Water Framework Directive. TrAC—Trends Anal. Chem. 2009, 28, 143–149. [Google Scholar] [CrossRef]
- Van den Broeck, M.; Waterkeyn, A.; Rhazi, L.; Grillas, P.; Brendonck, L. Assessing the ecological integrity of endorheic wetlands, with focus on Mediterranean temporary ponds. Ecol. Indic. 2015, 54, 1–11. [Google Scholar] [CrossRef]
- Álvarez Cobelas, M.; Rojo, C.; Angeler, D.G. Mediterranean limnology: Current status, gaps and the future. J. Limnol. 2005, 64, 13–29. [Google Scholar] [CrossRef]
- Richardson, D.C.; Holgerson, M.A.; Farragher, M.J.; Hoffman, K.K.; King, K.B.; Alfonso, M.B.; Andersen, M.R.; Cheruveil, K.S.; Coleman, K.A.; Farruggia, M.J.; et al. A functional definition to distinguish ponds from lakes and wetlands. Sci. Rep. 2022, 12, 10472. [Google Scholar] [CrossRef]
- Comin, F.A.; Williams, W.D. Parched continents: Our common future? In Limnology Now: A Paradigm of Planetary Problems; Margalef, R., Ed.; Elsevier: Amsterdam, The Netherlands, 1994; pp. 473–527. [Google Scholar]
- Wiggins, G.B.; Mackay, R.J.; Smith, I.M. Evolutionary and ecological strategies of animals in annual temporary pools. Arch. Hydrobiol.—Suppl. 1980, 58, 97–206. [Google Scholar]
- Boulton, A.J.; Peterson, C.G.; Grimm, N.B.; Fisher, S.G. Stability of an aquatic macroinvertebrate community in a multiyear hydrologic disturbance regime. Ecology 1992, 73, 2192–2207. [Google Scholar] [CrossRef]
- Collinson, N.H.; Biggs, J.; Corfield, A.; Hodson, M.J.; Walker, D.; Whitfield, M.; Williams, P.J. Temporary and permanent ponds: An assessment of the effects of drying out on the conservation value of aquatic macroinvertebrate communities. Biol. Conserv. 1995, 74, 125–133. [Google Scholar] [CrossRef]
- Williams, W.D.; De Deckker, P.; Shiel, R.J. The limnology of Lake Torrens, an episodic salt lake of central Australia, with particular reference to unique events in 1989. Hydrobiologia 1998, 384, 101–110. [Google Scholar] [CrossRef]
- Timms, B.V. The ecology of episodic saline lakes of inland eastern Australia, as exemplified by a ten year study of the Rockwell-Wombah Lakes of the Paroo. Proc. Linn. Soc. N. S. W. 2008, 129, 1–16. [Google Scholar] [CrossRef]
- Jennings, E.; Jones, S.; Arvola, L.; Staehr, P.A.; Gaiser, E.; Jones, I.D.; Weathers, K.C.; Weyhenmeyer, G.A.; Chiu, C.-Y.; De Eyto, E. Effects of weather-related episodic events in lakes: An analysis based on high-frequency data. Freshw. Biol. 2012, 57, 589–601. [Google Scholar] [CrossRef]
- Florencio, M.; Serrano, L.; Gómez-Rodríguez, C.; Millán, A.; Díaz-Paniagua, C. Inter- and intra-annual variations of macroinvertebrate assemblages are related to the hydroperiod in Mediterranean temporary ponds. Hydrobiologia 2009, 634, 167–183. [Google Scholar] [CrossRef]
- Céréghino, R.; Boix, D.; Cauchie, H.M.; Martens, K.; Oertli, B. The ecological role of ponds in a changing world. Hydrobiologia 2014, 723, 1–6. [Google Scholar] [CrossRef]
- La Mantia, T.; Pasta, S.; Troia, A. Declino degli ambienti umidi in Sicilia: Primo elenco delle zone scomparse. Naturalista Sicil. 2023, 46, 159–202. [Google Scholar]
- Funk, C.; Peterson, P.; Landsfeld, M.; Pedreros, D.; Verdin, J.; Shukla, S.; Rowland, J.; Harrison, L.; Hoell, G.; Jones, T.; et al. The climate hazards infrared precipitation with stations—A new environmental record for monitoring extremes. Sci. Data 2015, 2, 150066. [Google Scholar] [CrossRef]
- Regione Siciliana, Assessorato dell’Agricoltura, dello Sviluppo Rurale e della Pesca Mediterranea, Servizio Informativo Agrometeorologico Siciliano (SIAS). SIAS—Servizio Informativo Agrometeorologico Siciliano. Available online: https://www.sias.regione.sicilia.it/ (accessed on 18 September 2025).
- QGIS Development Team. QGIS Geographic Information System (Version 3.40 LTR); QGIS Association: Beaverton, OR, USA, 2025; Available online: https://qgis.org (accessed on 25 October 2024).
- Ministero dell’Ambiente e della Sicurezza Energetica. DTM LiDAR Con Risoluzione a Terra 2 Metri—Regione Sicilia; Repertorio Nazionale dei Dati Territoriali: Roma, Italy, 2013. Available online: https://geodati.gov.it/resource/id/m_amte:299FN3:b86e27e3-479d-4c3d-17f-9883bd0495c2 (accessed on 30 September 2025).
- Gorelick, N.; Hancher, M.; Dixon, M.; Ilyushchenko, S.; Thau, D.; Moore, R. Google Earth Engine: Planetary-scale geospatial analysis for everyone. Remote Sens. Environ. 2017, 202, 18–27. [Google Scholar] [CrossRef]
- McFeeters, S.K. The use of the Normalized Difference Water Index (NDWI) in the delineation of open water features. Int. J. Remote Sens. 1996, 17, 1425–1432. [Google Scholar] [CrossRef]
- Xu, H. Modification of normalised difference water index (NDWI) to enhance open water features in remotely sensed imagery. Int. J. Remote Sens. 2006, 27, 3025–3033. [Google Scholar] [CrossRef]
- Lacaux, J.P.; Tourre, Y.M.; Vignolles, C.; Ndione, J.A.; Lafaye, M. Classification of ponds from high-spatial resolution remote sensing: Application to Rift Valley Fever epidemics in Senegal. Remote Sens. Environ. 2007, 106, 66–74. [Google Scholar] [CrossRef]
- Shen, L.; Li, C. Water body extraction from Landsat ETM+ imagery using adaboost algorithm. In Proceedings of the 2010 18th International Conference on Geoinformatics, Beijing, China, 18–20 June 2010; pp. 1–4. [Google Scholar] [CrossRef]
- Feyisa, G.L.; Meilby, H.; Fensholt, R.; Proud, S.R. Automated Water Extraction Index: A new technique for surface water mapping using Landsat imagery. Remote Sens. Environ. 2014, 140, 23–35. [Google Scholar] [CrossRef]
- Kaplan, G.; Avdan, U. Object-based water body extraction model using Sentinel-2 satellite imagery. Eur. J. Remote Sens. 2017, 50, 137–143. [Google Scholar] [CrossRef]
- Tian, H.; Li, W.; Wu, M.; Huang, N.; Li, G.; Li, X.; Niu, Z. Dynamic monitoring of the largest freshwater lake in China using a new water index derived from high spatiotemporal resolution Sentinel-1A data. Remote Sens. 2017, 9, 521. [Google Scholar] [CrossRef]
- Acharya, T.; Subedi, A.; Lee, D. Evaluation of water indices for surface water extraction in a Landsat 8 scene of Nepal. Sensors 2018, 18, 2580. [Google Scholar] [CrossRef]
- Khalid, H.W.; Khalil, R.M.Z.; Qureshi, M.A. Evaluating spectral indices for water bodies extraction in western Tibetan Plateau. Egypt. J. Remote Sens. Space Sci. 2021, 24, 619–634. [Google Scholar] [CrossRef]
- Nagtzaam, S. Classification of Temporary Micro-Ponds Using Indices Derived from Sentinel-2 Imagery. Master’s Thesis, Wageningen University & Research, Wageningen, The Netherlands, 2024. [Google Scholar]
- Che, L.; Li, S.; Liu, X. Improved surface water mapping using satellite remote sensing imagery based on optimization of the Otsu threshold and effective selection of remote-sensing water index. J. Hydrol. 2025, 654, 132771. [Google Scholar] [CrossRef]
- European Space Agency (ESA); European Commission (EC). Copernicus Sentinel-2, MSI Level-2A Surface Reflectance Product (Collection 1); European Space Agency: Paris, France, 2021; Available online: https://browser.dataspace.copernicus.eu/ (accessed on 13 September 2025).
- Earth Resources Observation and Science (EROS) Center. Landsat 8–9 Operational Land Imager/Thermal Infrared Sensor Level-2, Collection 2; U.S. Geological Survey: Sioux Falls, SD, USA, 2020. [Google Scholar] [CrossRef]
- Van Rossum, G.; Drake, F.L., Jr. Python 3 Reference Manual; CreateSpace: Scotts Valley, CA, USA, 2009. [Google Scholar]
- The Pandas Development Team. Pandas-Dev/Pandas: Pandas (Version 2.2.2); Zenodo: Geneva, Switzerland, 2024. [Google Scholar] [CrossRef]
- Harris, C.R.; Millman, K.J.; van der Walt, S.J.; Gommers, R.; Virtanen, P.; Cournapeau, D.; Wieser, E.; Taylor, J.; Berg, S.; Smith, N.J.; et al. Array programming with NumPy. Nature 2020, 585, 357–362. [Google Scholar] [CrossRef]
- Hunter, J.D. Matplotlib: A 2D graphics environment. Comput. Sci. Eng. 2007, 9, 90–95. [Google Scholar] [CrossRef]
- Virtanen, P.; Gommers, R.; Oliphant, T.E.; Haberland, M.; Redford, D.; Cournapeau, F.; Burovski, E.; Peterson, L.; Weckesser, W.; Bright, J.; et al. SciPy 1.0: Fundamental algorithms for scientific computing in Python. Nat. Methods 2020, 17, 261–272. [Google Scholar] [CrossRef]
- Hamed, K.H. pymannkendall: A Python Package for Mann-Kendall Trend Analysis; GitHub Repository: San Francisco, CA, USA, 2023; Available online: https://github.com/mmhs013/pyMannKendall (accessed on 21 September 2025).
- Pedregosa, F.; Varoquaux, G.; Gramfort, A.; Michel, V.; Thirion, B.; Grisel, O.; Blondel, M.; Prettenhofer, P.; Weiss, R.; Dubourg, V.; et al. Scikit-learn: Machine learning in Python. J. Mach. Learn. Res. 2011, 12, 2825–2830. [Google Scholar]
- Seabold, S.; Perktold, J. Statsmodels: Econometric and statistical modeling with Python. SciPy 2010, 7, 92–96. [Google Scholar] [CrossRef]
- Pignatti, S.; Guarino, R.; La Rosa, M. Flora d’Italia, 2nd ed.; Edagricole: Bologna, Italy, 2017; Volume 1–4. [Google Scholar]
- Rich, T.C.G.; Nicholls-Vuille, F.L. Taxonomy and distribution of European Damasonium (Alismataceae). Edinb. J. Bot. 2001, 58, 45–55. [Google Scholar] [CrossRef]
- Schubert, H.; Blindow, I.; Nat, E.; Korsch, H.; Gregor, T.; Denys, L.; Stewart, N.; van de Weyer, K.; Romanov, R.; Casanova, M.T. (Eds.) Charophytes of Europe; Springer: Cham, Switzerland, 2024. [Google Scholar]
- Thiers, B.M. Index Herbariorum. New York Botanical Garden. 2024. Available online: https://sweetgum.nybg.org/science/ih/ (accessed on 30 September 2025).
- Romanov, R.; Napolitano, T.; van de Weyer, K.; Troia, A. New records and observations to the Characean flora of Sicily (Italy). Webbia 2019, 74, 111–119. [Google Scholar] [CrossRef]
- Stewart, N. Provisional Red List of European Charophytes. In Charophytes of Europe; Schubert, H., Blindow, I., Nat, E., Korsch, H., Gregor, T., Denys, L., Stewart, N., van de Weyer, K., Romanov, R., Casanova, M.T., Eds.; Springer: Cham, Switzerland, 2024; pp. 177–199. [Google Scholar]
- Troia, A.; Ilardi, V. New findings for the charophyte flora of Sicily (Italy). Environ. Exp. Biol. 2022, 20, 151. [Google Scholar]
- Torn, K.; Nat, E. Chara connivens. In Charophytes of Europe; Schubert, H., Blindow, I., Nat, E., Korsch, H., Gregor, T., Denys, L., Stewart, N., van de Weyer, K., Romanov, R., Casanova, M.T., Eds.; Springer: Cham, Switzerland, 2024; pp. 365–374. [Google Scholar]
- Sciandrello, S.; Ranno, V.; Tomaselli, V. The role of vegetation monitoring in the conservation of coastal habitats N2000: A case study of a wetland area in southeast Sicily (Italy). Land 2024, 13, 62. [Google Scholar] [CrossRef]
- Brullo, S.; Brullo, C.; Sciandrello, S.; Tavilla, G.; Cambria, S.; Tomaselli, V.; Ilardi, V.; Giusso del Galdo, G.; Minissale, P. The Plant Communities of the Class Isoëto-Nanojuncetea in Sicily. Plants 2022, 11, 1214. [Google Scholar] [CrossRef]
- Council of the European Communities. Council Directive 92/43/EEC of 21 May 1992 on the conservation of natural habitats and of wild fauna and flora. Off. J. Eur. Communities 1992, L206, 7–50. [Google Scholar]
- Braun-Blanquet, J. Die grundlegenden Vegetationseinheiten, ihr Gefüge und ihre Erfassung. In Pflanzensoziologie: Grundzüge der Vegetationskunde; Springer: Vienna, Austria, 1964; pp. 17–205. [Google Scholar]
- Alcocer, J.; Lugo, A.; Escobar, E.; Sánchez, M. The macrobenthic fauna of a former perennial and now episodically filled Mexican saline lake. Int. J. Salt Lake Res. 1996, 5, 261–274. [Google Scholar] [CrossRef]
- Liu, W.; Liu, Z.; An, Z.; Sun, J.; Chang, H.; Wang, N.; Dong, J.; Wang, H. Late Miocene episodic lakes in the arid Tarim Basin, western China. Proc. Natl. Acad. Sci. USA 2014, 111, 16292–16296. [Google Scholar] [CrossRef]
- Boccini, F.; Ciccozzi, E.; Di Simone, M.; Eramo, N. Fonti per la Storia Della Malaria in Italia; Ministero per i Beni e le Attività Culturali; Direzione Generale per gli Archivi: Roma, Italy, 2003; ISBN 88-7125-225-X. [Google Scholar]
- Hughes, D.A. Comparison of satellite rainfall data with observations from gauging station networks. J. Hydrol. 2006, 327, 399–410. [Google Scholar] [CrossRef]
- Aksu, H.; Akgül, M.A. Performance evaluation of CHIRPS satellite precipitation estimates over Turkey. Theor. Appl. Clim. 2020, 142, 71–84. [Google Scholar] [CrossRef]
- Granata, F.; Zhu, S.; Di Nunno, F. Hydrological extremes in the Mediterranean basin: Interactions, impacts, and adaptation in the face of climate change. Reg. Environ. Change 2025, 25, 100. [Google Scholar] [CrossRef]
- Gazzetta Ufficiale della Repubblica Italiana, Serie Generale n. 187. 12 August 1997. Available online: https://www.gazzettaufficiale.it/atto/serie_generale/caricaDettaglioAtto/originario?atto.dataPubblicazioneGazzetta=1997-08-12&atto.codiceRedazionale=097A6322&elenco30giorni=false (accessed on 5 October 2025).
Disclaimer/Publisher’s Note: The statements, opinions and data contained in all publications are solely those of the individual author(s) and contributor(s) and not of MDPI and/or the editor(s). MDPI and/or the editor(s) disclaim responsibility for any injury to people or property resulting from any ideas, methods, instructions or products referred to in the content. |
© 2025 by the authors. Licensee MDPI, Basel, Switzerland. This article is an open access article distributed under the terms and conditions of the Creative Commons Attribution (CC BY) license (https://creativecommons.org/licenses/by/4.0/).