Abstract
Urban green spaces can be important habitats for soil, plant, and pollinator diversity and the complementary ecosystem functions they confer. Most studies tend to investigate the relationships between plant diversity with either soil or pollinator diversity, but establishing their relationship across habitat types could be important for optimising ecosystem service provision via alternative management (for instance, urban meadows in place of short amenity grass). Here, we investigate soil–plant–pollinator relationships across urban grass and meadow habitats through a range of measured biodiversity (soil mesofauna and macrofauna, plants, aboveground invertebrates, and pollinators) and edaphic variables. We found significant effects of habitat type on available nutrients (plant and soil C:N ratios) but less clear relationships were observed between habitat type and diversity metrics. Soil–plant–pollinator interactions across habitat types and sites showed an interconnection, whereby flowering plant abundance increased alongside soil macrofauna abundance. Site characteristics that showed strong effects on plant and invertebrate diversity metrics were C:N ratios (plant and soil) and soil pH, suggesting a potential role of nutrient availability on soil–plant–pollinator associations. Our results suggest that a combination of short-mown grass, tall grass, and sown flowers can provide greater benefits for soil and pollination services as each habitat type benefits different taxa due to differing sensitivities to management practices. For example, pollinators benefit from sown flowers but soil fauna are sensitive to annual sowing. Our results also indicate that sown flowers may not optimise overall biodiversity as expected due to disturbance and the depleting role of tall, flowering plants on soil nutrient availability. Future research across a greater range of sites in urban landscapes would resolve the potential role of nutrient availability in modulating soil–plant–pollinator interactions in urban green spaces.
Keywords:
soil fauna; pollinators; invertebrates; plant diversity; abundance; urban green spaces; mowing; meadows 1. Introduction
Biodiversity loss has been brought to the forefront of the global policy agenda, due to the cascading effects of plant, microbial, and animal species losses on ecosystem stability [1,2,3,4]. Urbanisation has been identified as a key driver of terrestrial biodiversity declines [5], with landscape scale consequences for ecosystem service provision [6]. Pollination is a critical ecosystem service that depends on insect pollinators, their dispersal capabilities, and the availability of floral resources across fragmented landscapes [7]. In addition to ecosystem services, biodiverse urban environments contribute towards greenspace function, such as improving urban air and water quality, and supporting human mental health through amenity value [8]. However, the effects of urbanisation on pollinators and their community composition, diversity, and abundance have been shown to vary greatly across environmental and urban contexts [9,10,11,12,13].
Urban green spaces (UGSs) are expected to support greater pollinator diversity in urban areas at the micro-scale [14,15,16,17], especially when they incorporate greater flowering plant diversity and availability [18]. For instance, the authors of [19] observed a clear increase in pollinator diversity (solitary bees, bumblebees, and solitary wasps) when sown wildflowers were introduced into urban gardens. The authors of [20] further highlight the importance of these plant–pollinator dependencies on ecosystem services in urban environments, showing that pollinator diversity enhances plant productivity in an urban setting. Despite the importance of flowering plants on urban pollinators, the most common UGS habitat type is short-mown grass [21]. The land use management regime of mowing can significantly reduce both flowering plant diversity and pollinator abundances in UGSs [22].
Growing interest in alternatives to short-mown amenity grass in UGSs reflects incentives to promote pollination across urban to rural landscapes [21,23]. Alternative habitats are primarily achieved by reducing mowing intensity and thereby allowing the resident plant community to increase in structural complexity and flower cover [21]; here, we refer to this habitat type as ‘tall grass’. Meadows can also be established by planting specific mixes of flowering plants with known aesthetic and pollinator benefits [19]; here, we refer to this habitat type as ‘sown flowers’. Existing research thus tends to focus on the impacts of either grass mowing frequency or sowing flowering plants (e.g., [24,25]). A recent meta-analysis of mowing intensity across North American and European UGS studies, for instance, showed overall declines in invertebrate and plant diversity with greater mowing intensity and the opposite effect for pest species [26].
Few studies have assessed biodiversity patterns along a gradient of mown grass, tall grass, and sown flowers, and where comparisons have been made, complex and non-linear interactions between community metrics across progressively more intensive management practices have been identified (e.g., [24]). For instance, the authors of [18] demonstrate that, while sown flowering plants in urban green spaces can attract greater numbers of pollinators, the ornamental nature of flowers as part of this land management strategy can result in transient pollen availability over successive years with negative impacts on pollinator numbers. Similar complexities have demonstrated a strong influence on mowing timing in grasslands. The authors of [27], for example, showed that a mowing regime of twice a year for wildflower strips produced greatest flowering richness compared with less regular mowing. These complexities represent a current knowledge gap in how land use management can modulate plant–pollinator interactions and richness.
Soil biodiversity can have a strong influence on plant–pollinator interactions by directly feeding or forming associations with plant roots, and indirectly through the effects of the detritus food web on soil properties (e.g., nutrient availability) [28,29]. The combined activities of pollinators and soil communities also support a broad range of ecosystem functions and services (e.g., litter decomposition, carbon sequestration, and plant growth, alongside pollination) [30]. Research on the effects of soil–plant–pollinator interactions, however, has been largely limited to nitrogen-fixing bacteria, mycorrhizal fungi, and root herbivores [28]. A recent exception measured the effect of grass and meadow seed mixtures in arable set-asides on pollinator and earthworm communities, finding little effect of the treatments on plant richness and greater pollinator and earthworm abundance in meadows and grass, respectively [31]. Improving our understanding of the interactive effects of plants and belowground biodiversity on pollinators requires further exploration of various soil community groups. UGS grass and meadow habitats also vary considerably compared to agricultural systems due to differences in management practices (e.g., ploughing), soil characteristics (e.g., compaction), and landscape composition (e.g., fragmentation with impervious surfaces) [21].
This study investigates the influence of varying plant diversity across three habitat types (short-mown grass, tall grass, and sown flowers) on belowground (microbial, mesofauna, and macrofauna) and aboveground (invertebrate) abundance and diversity, with a particular focus on pollinator communities and ecosystem properties. We expected higher plant diversity and lower disturbance from mowing across habitat types to support greater abundances and diversity of belowground and aboveground invertebrates, and therefore higher ecosystem multifunctionality.
2. Materials and Methods
2.1. Study Area and Field Design
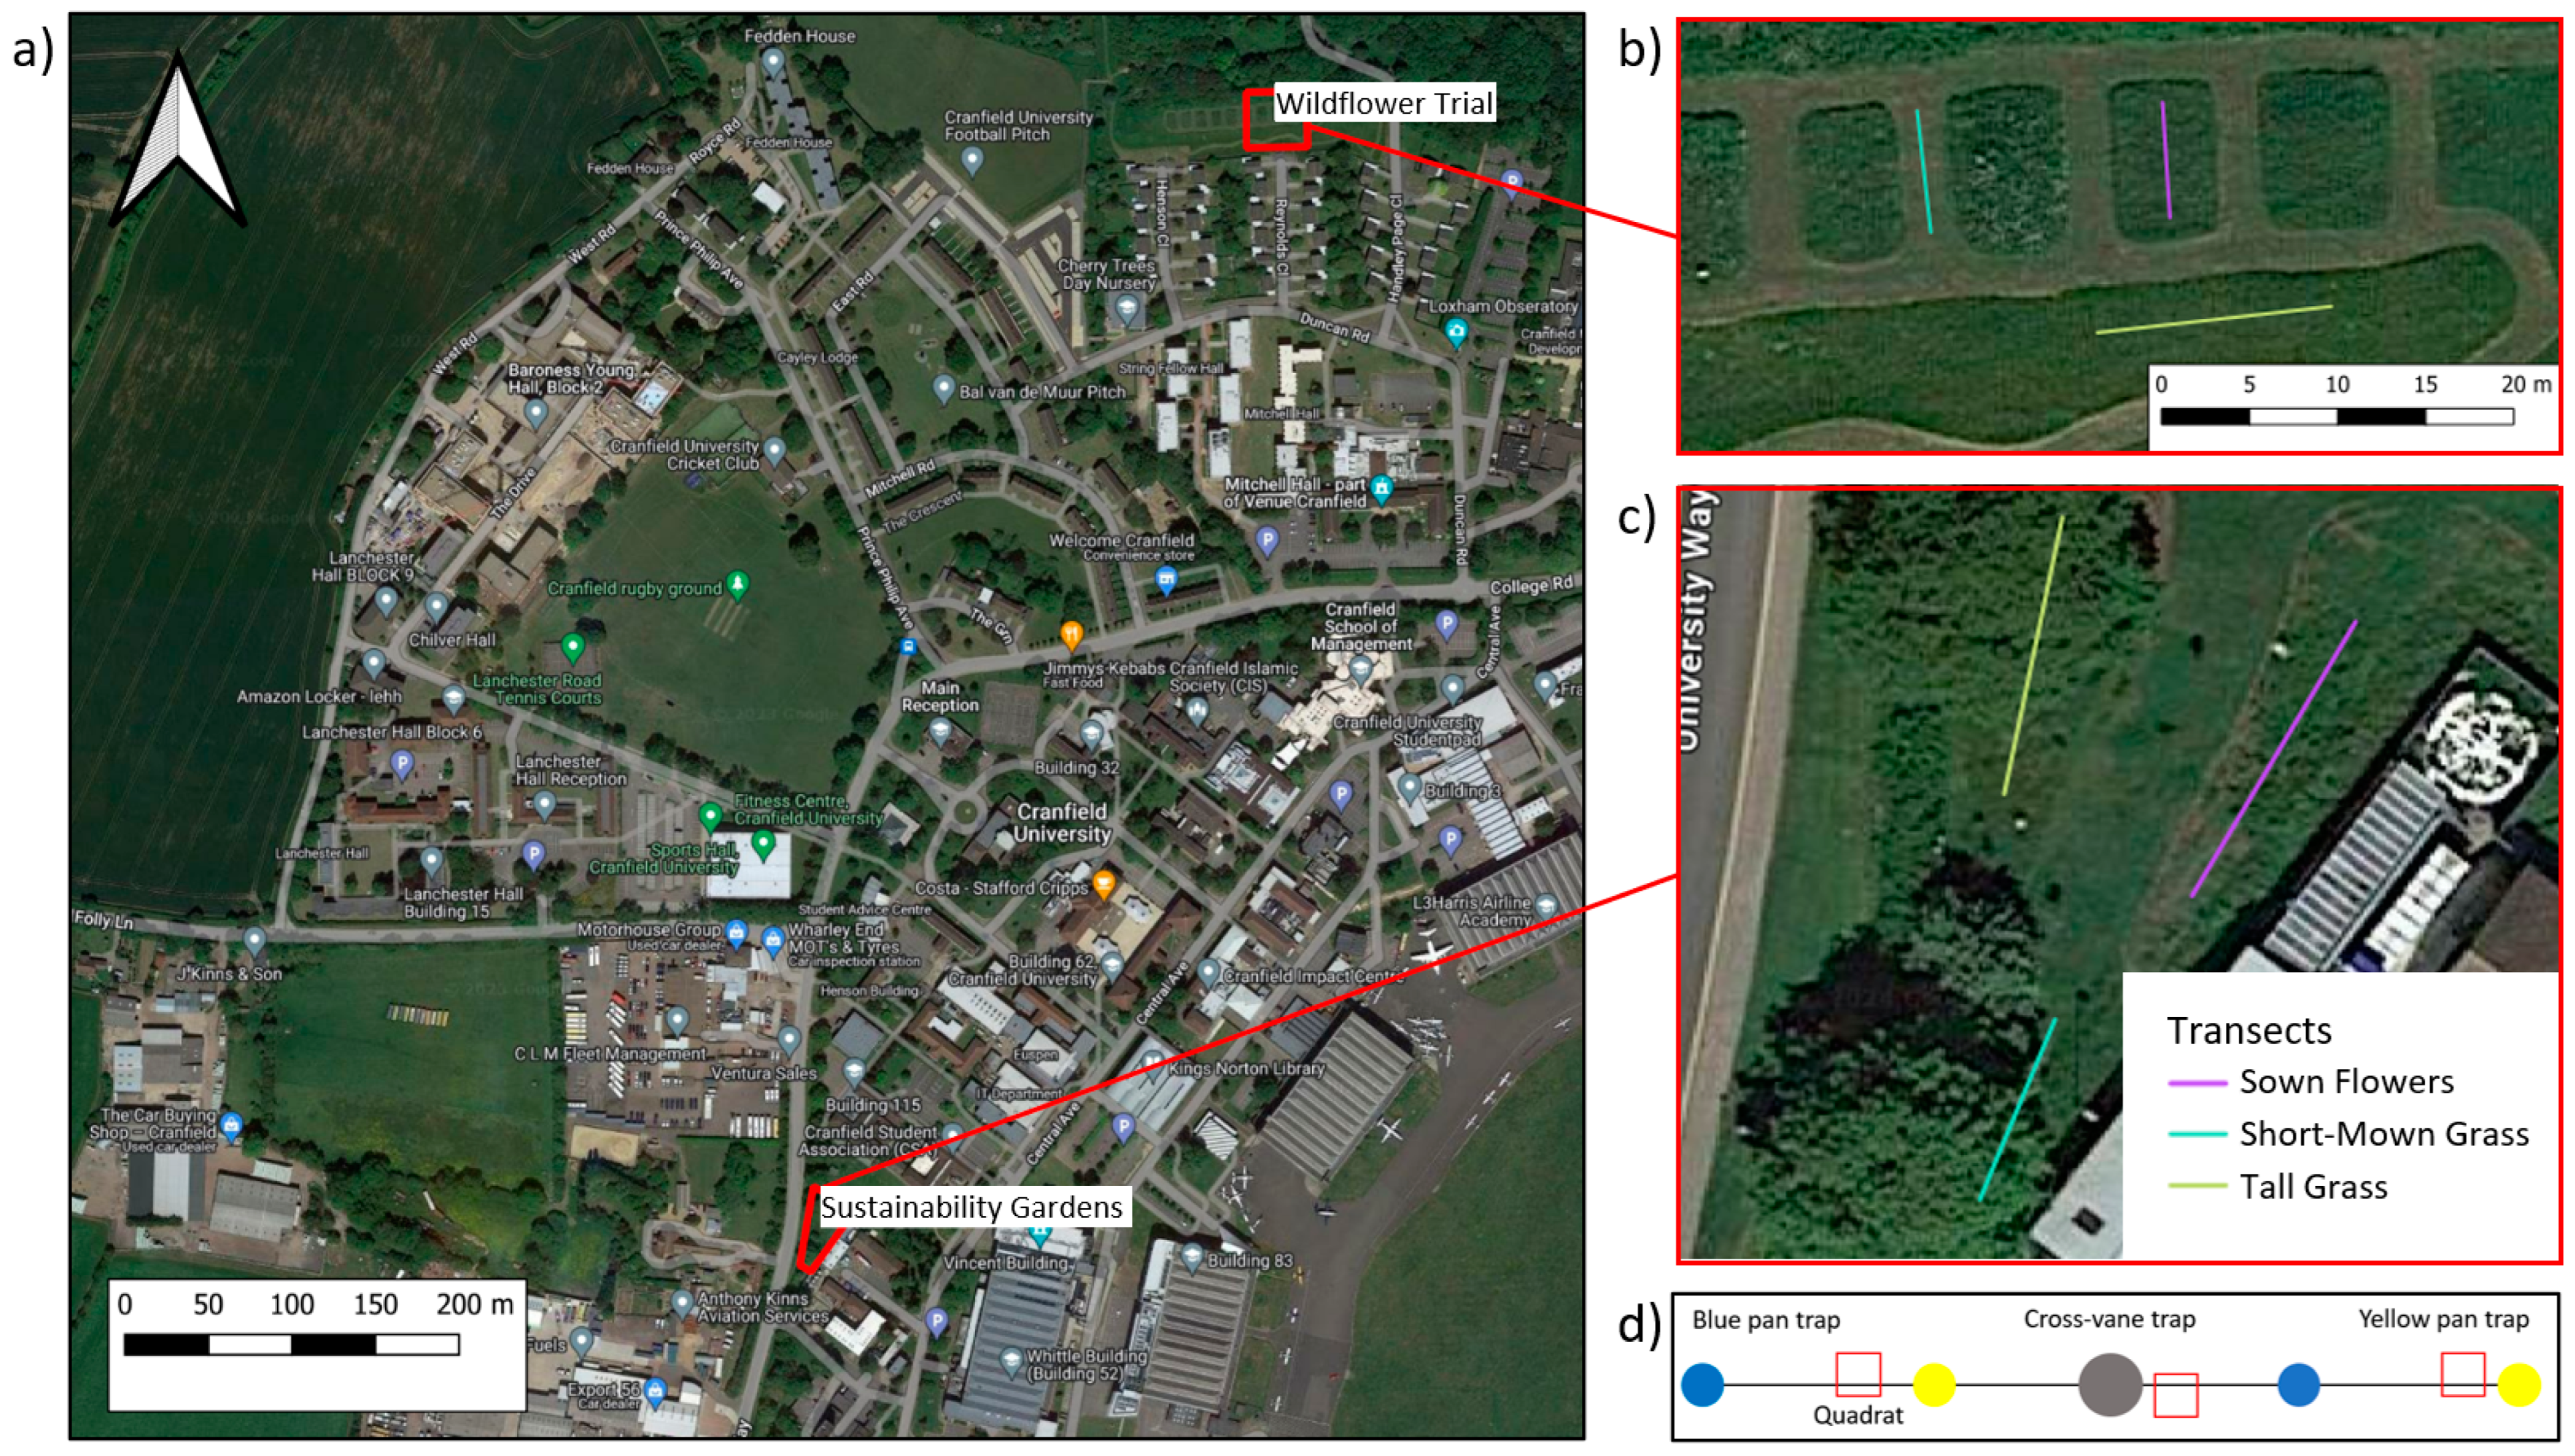
The study was carried out at Cranfield University campus, Bedfordshire, UK (52.07° N–0.62° W), in late June 2023. Two plots across the campus were selected to examine the effect of different vegetation types, reflecting different biodiversity management strategies (short-mown grass (SMG), tall grass (TG), and sown flowers (SF)). These strategies aimed to enhance plant and pollinator diversity (SF and TG) or to provide amenity services (short-mown grass). At both sites (Sustainability Gardens (SG) and Wildflower Trial (WT)) all three habitat types were present and sampled using complementary invertebrate, plant, and soil surveys (detailed in the following sections) along 8m transects (Figure 1). Plant surveys, harvesting, and soil sampling were carried out at randomly selected locations along the transects using quadrats (Figure 1c). To minimize disturbance during the invertebrate sampling, plants were harvested and soils collected after the completion of the invertebrate sampling. During the invertebrate sampling, several site attributes were recorded, such as tree cover, vegetation height, air temperature, and weather conditions.
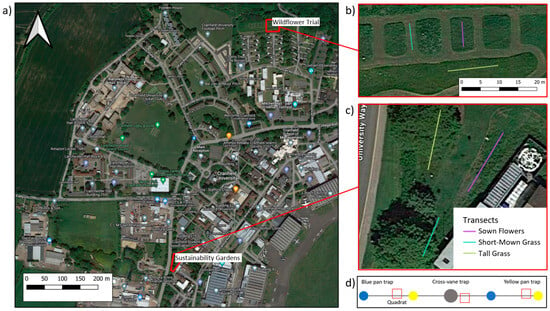
Figure 1.
Study area (a), sites (b,c), and field design (d) for the soil–plant–pollinator survey conducted here. Plots show (a) the larger study area at Cranfield University with the two sites (Sustainability Gardens and Wildflower Trial) highlighted in red and shown in higher resolution in (b) for the Wildflower Trial and (c) for the Sustainability Gardens. Coloured lines in b and c indicate 8 m transects for three habitat types (short-mown grass, tall grass, and sown flowers). The schematic diagram of the transects in (d) show the distribution of one cross-vane trap (grey circle) and pan traps (blue and yellow circles) and three random quadrats (open red squares) used for plant surveys, harvesting, and soil sampling.
2.2. Aboveground Invertebrates
Aboveground invertebrates were sampled using four methods that targeted different invertebrate and pollinator taxa [32]: (1) visual surveys of flying insects (e.g., butterflies), (2) sweep net sampling, (3) pan traps, and (4) cross-vane traps (Figure 1d). At each site, 8 m transects were established for each habitat type, with each transect at least 1m away from any neighbouring habitats. A UV fluorescent blue cross-vane trap was erected on a 2 m pole or attached to a tree in the centre of the transect, and two UV fluorescent blue and yellow pan traps, alternating in colour, were placed at 2 m intervals across the transect. The pan traps were deep-dish trays (12 cm diameter, 4 cm deep), coloured in UV fluorescent yellow or blue to best attract a broad range of pollinators, and filled with a mixture of non-odorous detergent and water [33]. The cross-vane trap was a UV fluorescent blue to attract larger sized flying pollinators [34,35]. All traps were left in situ for 5 days and checked twice daily for disruption, during which time all specimens from the pan traps were collected and preserved in glass jars filled with 70% ethanol. Sweep net sampling and visual surveys were conducted simultaneously during a 20-min interval for each transect between 13.00 and 15.00, when most pollinators are active [33], walking back and forth along the transect. All specimens from the pan traps, cross-vane traps, and sweep nets for each habitat type and site were identified to the family level, while specimens during the visual surveys were identified to the order level. All specimens were identified using the National Biodiversity Network taxonomic identification guides (https://nbn.org.uk/tools-and-resources/nbn-toolbox/id-resources/ accessed on 4 December 2023). This method resulted in one sample replicate in each habitat, at each site (n = 6). We use the term pollinators in a general sense and do not assess if they are pollinators for the specific plant species identified.
2.3. Soil and Plant Analyses
On completion of the aboveground invertebrate sampling, plants were harvested from three 0.25 × 0.25 m quadrats placed randomly along the habitat type transects (Figure 1b,c). Following plant harvesting to measure plant biomass, soil respiration was measured using a field-portable infrared gas analyser (IRGA) unit with an EGM-5 portable CO2 gas analyser. Soils were then collected to a depth of 20 cm from each quadrat, including the litter layer, for hand sorting in the laboratory [36,37]. One L of mustard water (10 g/L) was then poured in the soil pits to extract and collect endogeic earthworms [38,39]. Soil temperature and soil pH levels were measured using a Mcbazel soil meter, and soil moisture was measured by oven-drying fresh soil samples at 105 °C for 24 h and measuring the weight differential. Soil organic matter (SOM) was measured via loss on ignition by drying 10 g of fresh soil from each quadrat at 105 °C for 24 h and then at 450 °C [40]. This resulted in three sample replicates for all plant and soil fauna measures for each site and habitat (n = 18). Soil microbial biomass carbon (MBC) and nitrogen (MBN) were determined by the chloroform fumigation–extraction method after 65 h of incubation [41]. Total soil and plant C and N were determined by an elemental analyser (Seal Analytical AA3 Segmented Flow Multi-Chemistry Analyzer) for aggregated soil and plant samples across the three quadrats per habitat type (n = 6), with 2 replicates per habitat.
Soil macrofauna were hand-sorted from 25 × 25 × 20 cm soil cubes collected from each quadrat and identified to order or family level depending on life stage [42]. Soil mesofauna were collected and extracted using a metal cylinder (8.5 cm diameter, 12 cm height) and the sugar flotation technique according to [43]. Extracted soil animals were identified to the family level under compound and dissecting microscopes [44] using online databases created by [45,46], and their abundances recorded.
2.4. Statistical Analyses
We employed the Shannon diversity index (H’) to quantify plant, pollinator, and soil biodiversity across each site and habitat type:
where pi is the proportion between the abundance of the ith species to the total abundance across all species (or other taxonomic units, see below), and S is the number of species (or other taxonomic units, see below) in the community. Since it was not possible to identify all organisms to the species level, H was calculated at the order or family level where appropriate (all plants were identified to species level, soil fauna to family level, and aboveground invertebrates to order level due to limited taxonomic identification during visual surveys). Although these different measures of H give different measures of biodiversity, they are here used relative to one another as a proxy of biodiversity for our different groups of interest (plants, pollinators, and soil fauna).
H’ = ∑ pi ln(pi)
We tested the influence of habitat characteristics on soil, plant, and pollinator diversity, alongside interactions between soil, plant, pollinator, and abiotic measurements. First, the effect of habitat type and site on the suite of measured variables was tested using one-way ANOVAs or Student’s T-tests for pairwise comparisons and taking p < 0.05 to indicate significance. To account for family-wise comparisons (i.e., between habitat types, n = 3), Bonferroni corrections were made on all t-test p values. Secondly, Pearson’s correlation matrices were produced to identify the measured variables with the strongest potential linear relationships across sites and habitat types. Linear and quadratic terms were tested for all variables and the final term selected based on the goodness of fit and parsimony (the condition that additional degrees of freedom resulted in a difference in Akaike Information Criterion (AIC) value > 5). The variable pairs with the strongest relationship were tested using general linear regression models. The model fits (R2adj) and significance (p-values) were discussed in terms of the suitability of the measured variables as predictors for plant, pollinator, and soil biodiversity. All correlation and regression analyses were undertaken on all samples at the field scale. In the case that multiple replicates were sampled (such as for soil and plant measures), these were averaged to a field-scale mean, with standard errors displayed in regression plots. All statistical analyses were conducted using the R statistical software version 4.3.2 [47] and packages “dplyr” [48], y “reshape2” [49], “ggplot2” [50], and “ggsignif” [51].
3. Results
Across both sites and all habitat types, we measured a total abundance of 445 soil macrofauna, 425 soil mesofauna, 560 aboveground invertebrates, and 366 plants. The SMG habitat was characterized by fungivorous nematodes and collembola, with plant communities characterized by Helminthotheca echioides and Potentilla reptans, and an invertebrate community dominated by Diptera and Hymenoptera species. TG was characterised by bacterivorous nematodes and collembola, with plant communities characterised by grasses such as Lolium perenne and others such as Rubus caesius and an invertebrate community characterised by Diptera (Sarcophagidae), Hymenoptera (Vespidae), and Lepidoptera. Finally, the SF habitat was characterised by bacterivorous nematodes and soil mites, with plant communities characterised by Leucanthemum vulgare and Poa pratensis and an invertebrate community characterised by Diptera (Sarcophagidae) and Hymenoptera (Ichneumonidae).
Table 1 provides a summary of key plant and soil characteristics across the habitat types surveyed in this study. Greater variation in the measurements shown in Table 1 were observed across habitat types compared to the two sites, with significant differences for vegetation height (F = 12.80, p < 0.0001), plant C:N ratio (F = 19.38, p < 0.0001), and soil C:N ratio (F = 6.61, p < 0.0001). No significant interaction was found for soil microbial C:N ratios or soil pH across habitat types. Most characteristics in Table 1 did not significantly vary between the two sites, although exceptions were observed for soil C:N ratio (F = 9.99, p < 0.0001), soil temperature (F = 8.00, p = 0.01), and soil pH (F = 5.27, p = 0.04).

Table 1.
Summary of key measurements of abiotic characteristics from three habitat types sampled across Cranfield University, providing mean values ± standard deviation across all samples taken. The family-wise significance of site and habitat type (HT) on each variable is provided in the left column, where ns = not significant, *: p < 0.05; **: p < 0.01, ***: p < 0.001, ****: p < 0.0001.
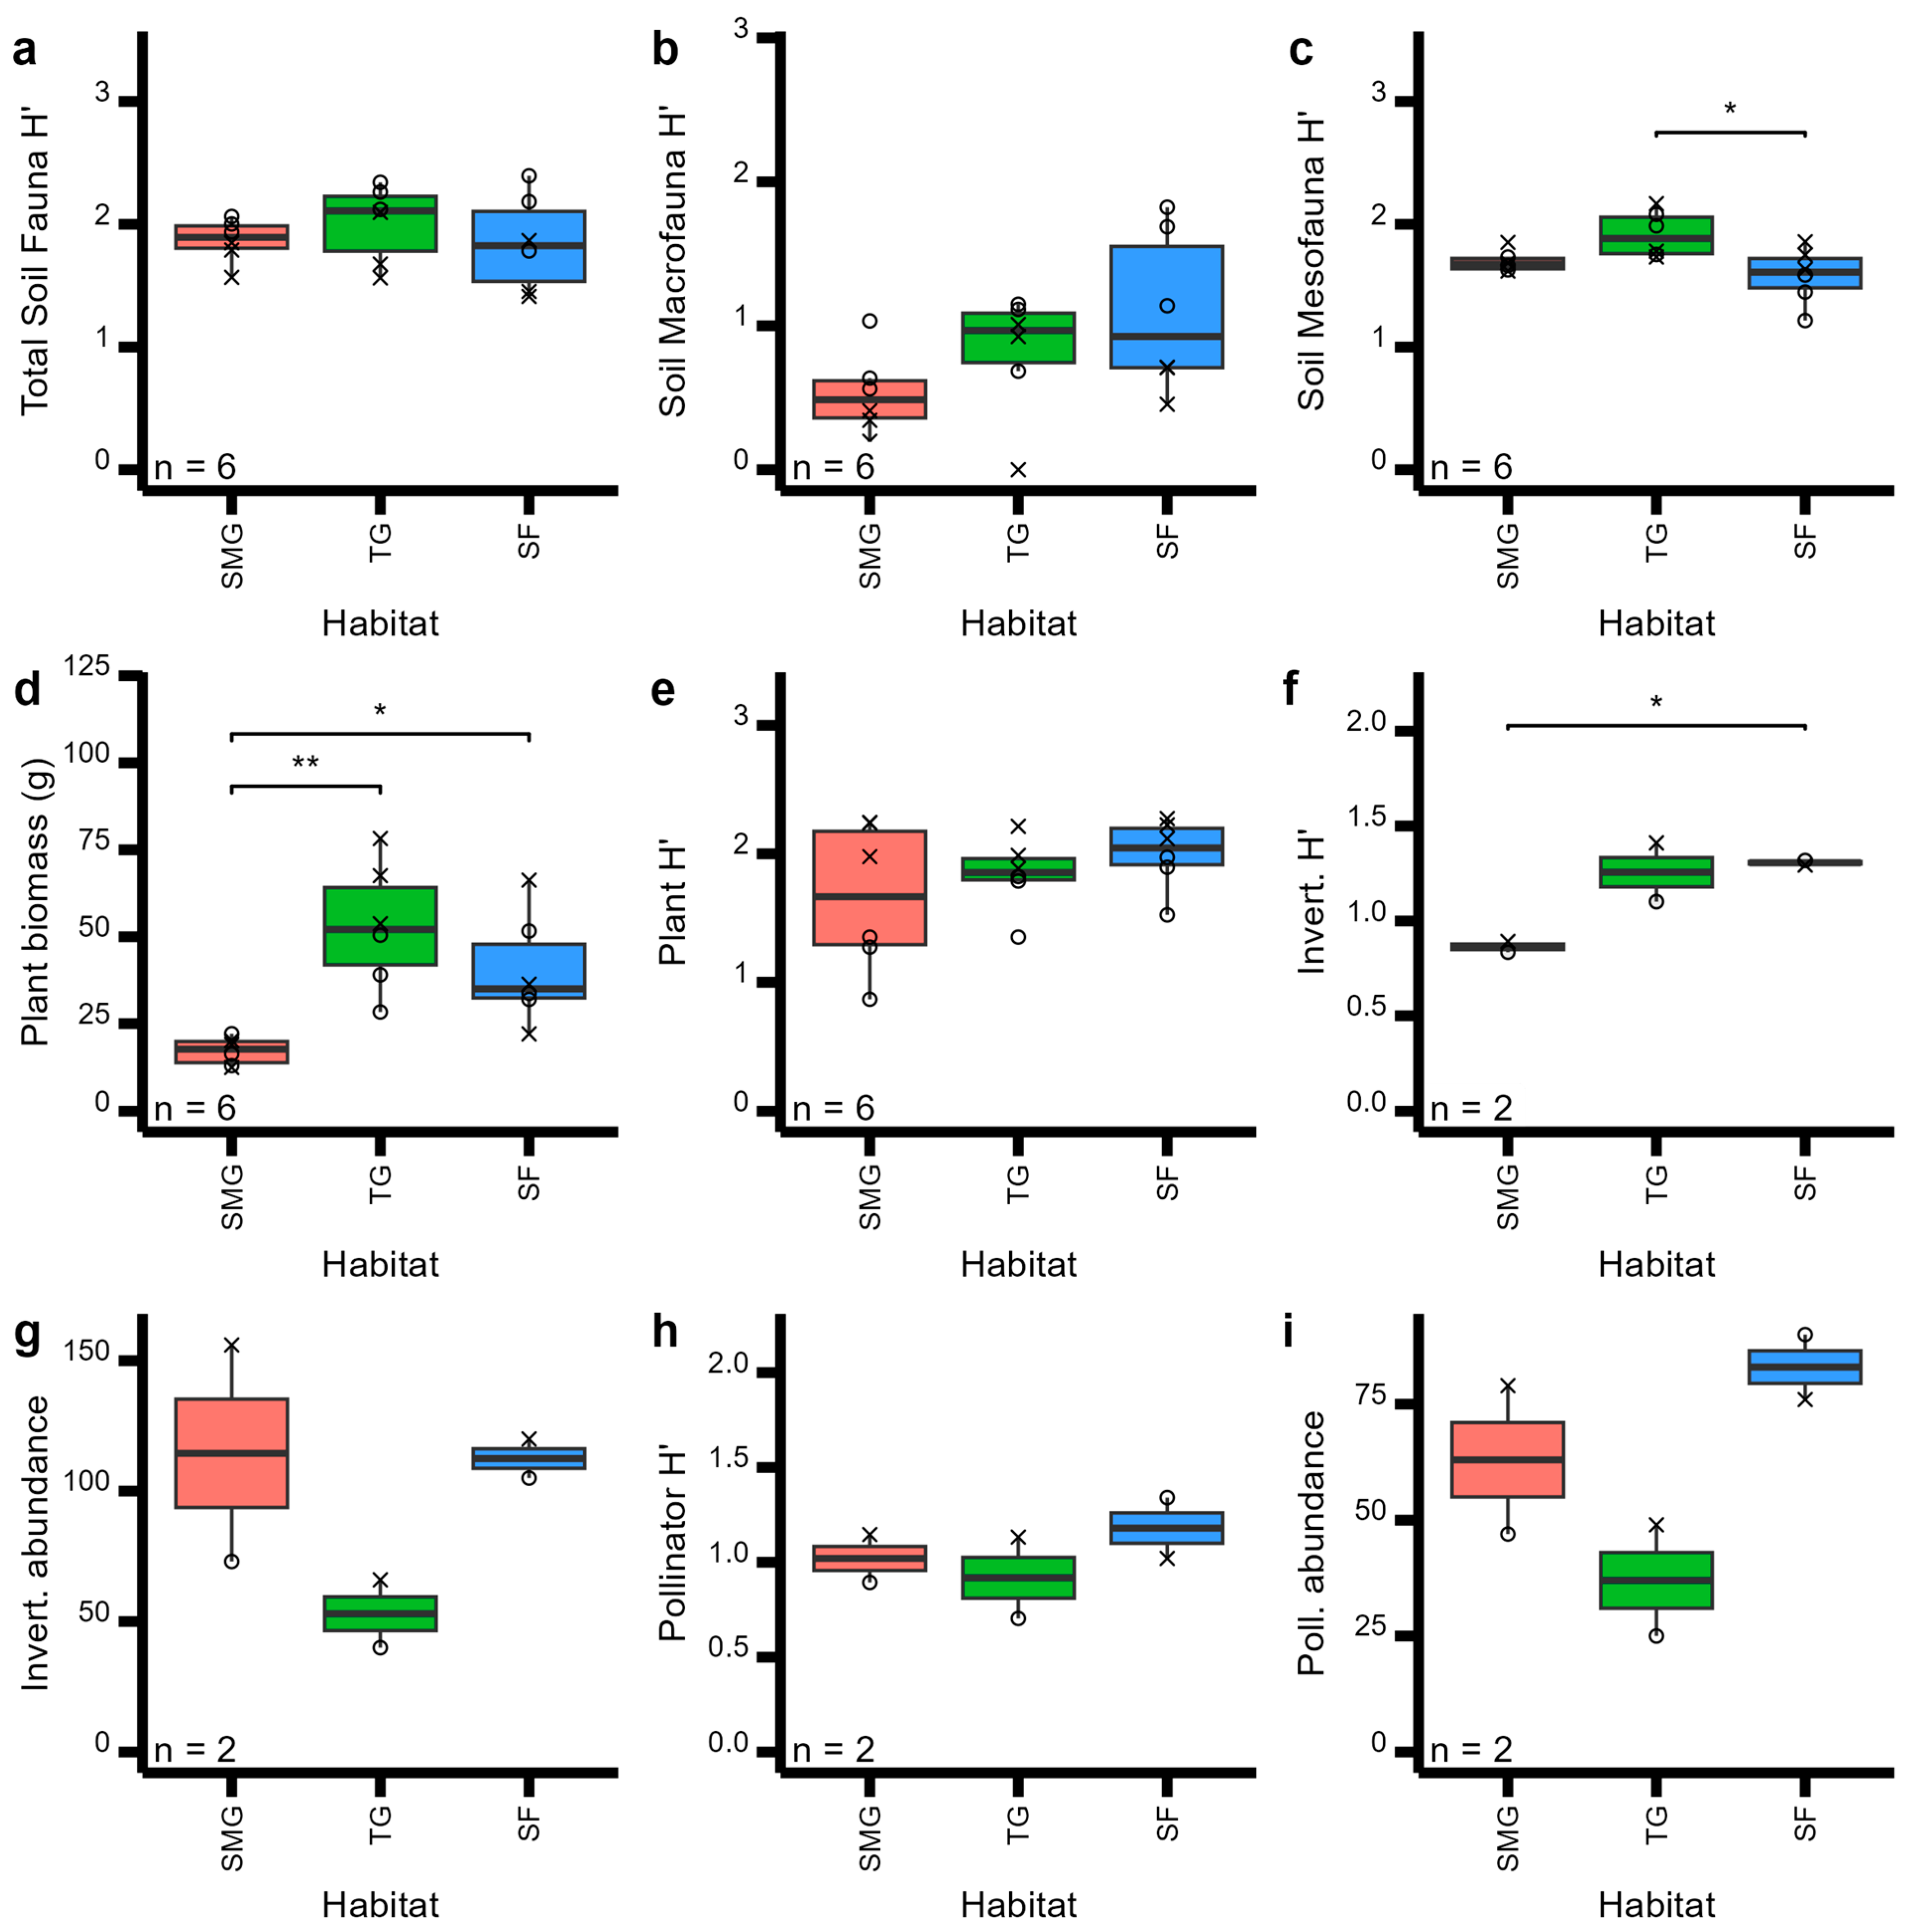
No significant difference were found between habitat types. Habitat type had little effect on soil, plant, and pollinator community metrics (Figure 2), except for soil mesofauna (Figure 2c, F = 5.56, p = 0.02) and plant biomass (Figure 2d, F = 9.86, p < 0.0001). Nevertheless, most measurements did increase from short-mown grass to sown flower habitat types (Figure 2). Surprisingly, however, all soil fauna diversity metrics declined from tall grass to sown flower habitat types (Figure 2a–c), while overall aboveground invertebrate pollinator abundances were very similar across habitats (Figure 2g–i). Total invertebrate diversity, however, was significantly reduced in the short-mown grass habitat compared to both tall grass and sown flowers (Figure 2f).
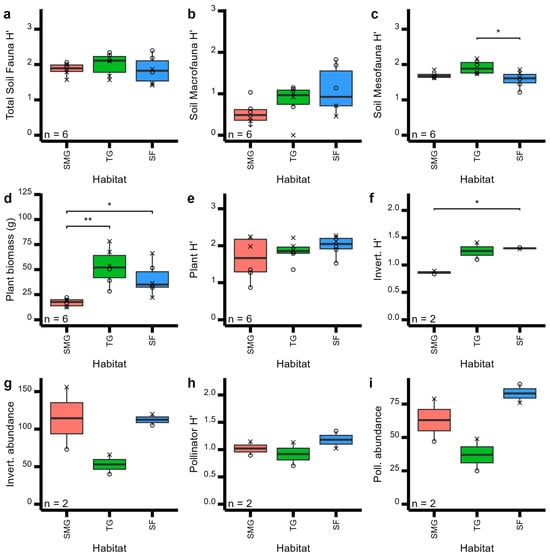
Figure 2.
Boxplots of plant, soil, invertebrate, and pollinator community metrics across three habitat types (short-mown grass (SMG), tall grass (TG), and sown flowers (SF)), showing pairwise T-test comparisons: *: p < 0.05; **: p < 0.01,. Community metrics shown are (a) total soil Shannon diversity, (b) soil macrofauna Shannon diversity, (c) soil mesofauna Shannon diversity, (d) total plant biomass, (e) total plant Shannon diversity, (f) total invertebrate Shannon diversity, (g) invertebrate abundance, (h) pollinator Shannon diversity, and (i) pollinator abundance. Symbol shapes represent the different sites: circles for the Wildflower Trial and crosses for the Sustainability Gardens. N provides the number of replicates per habitat type.
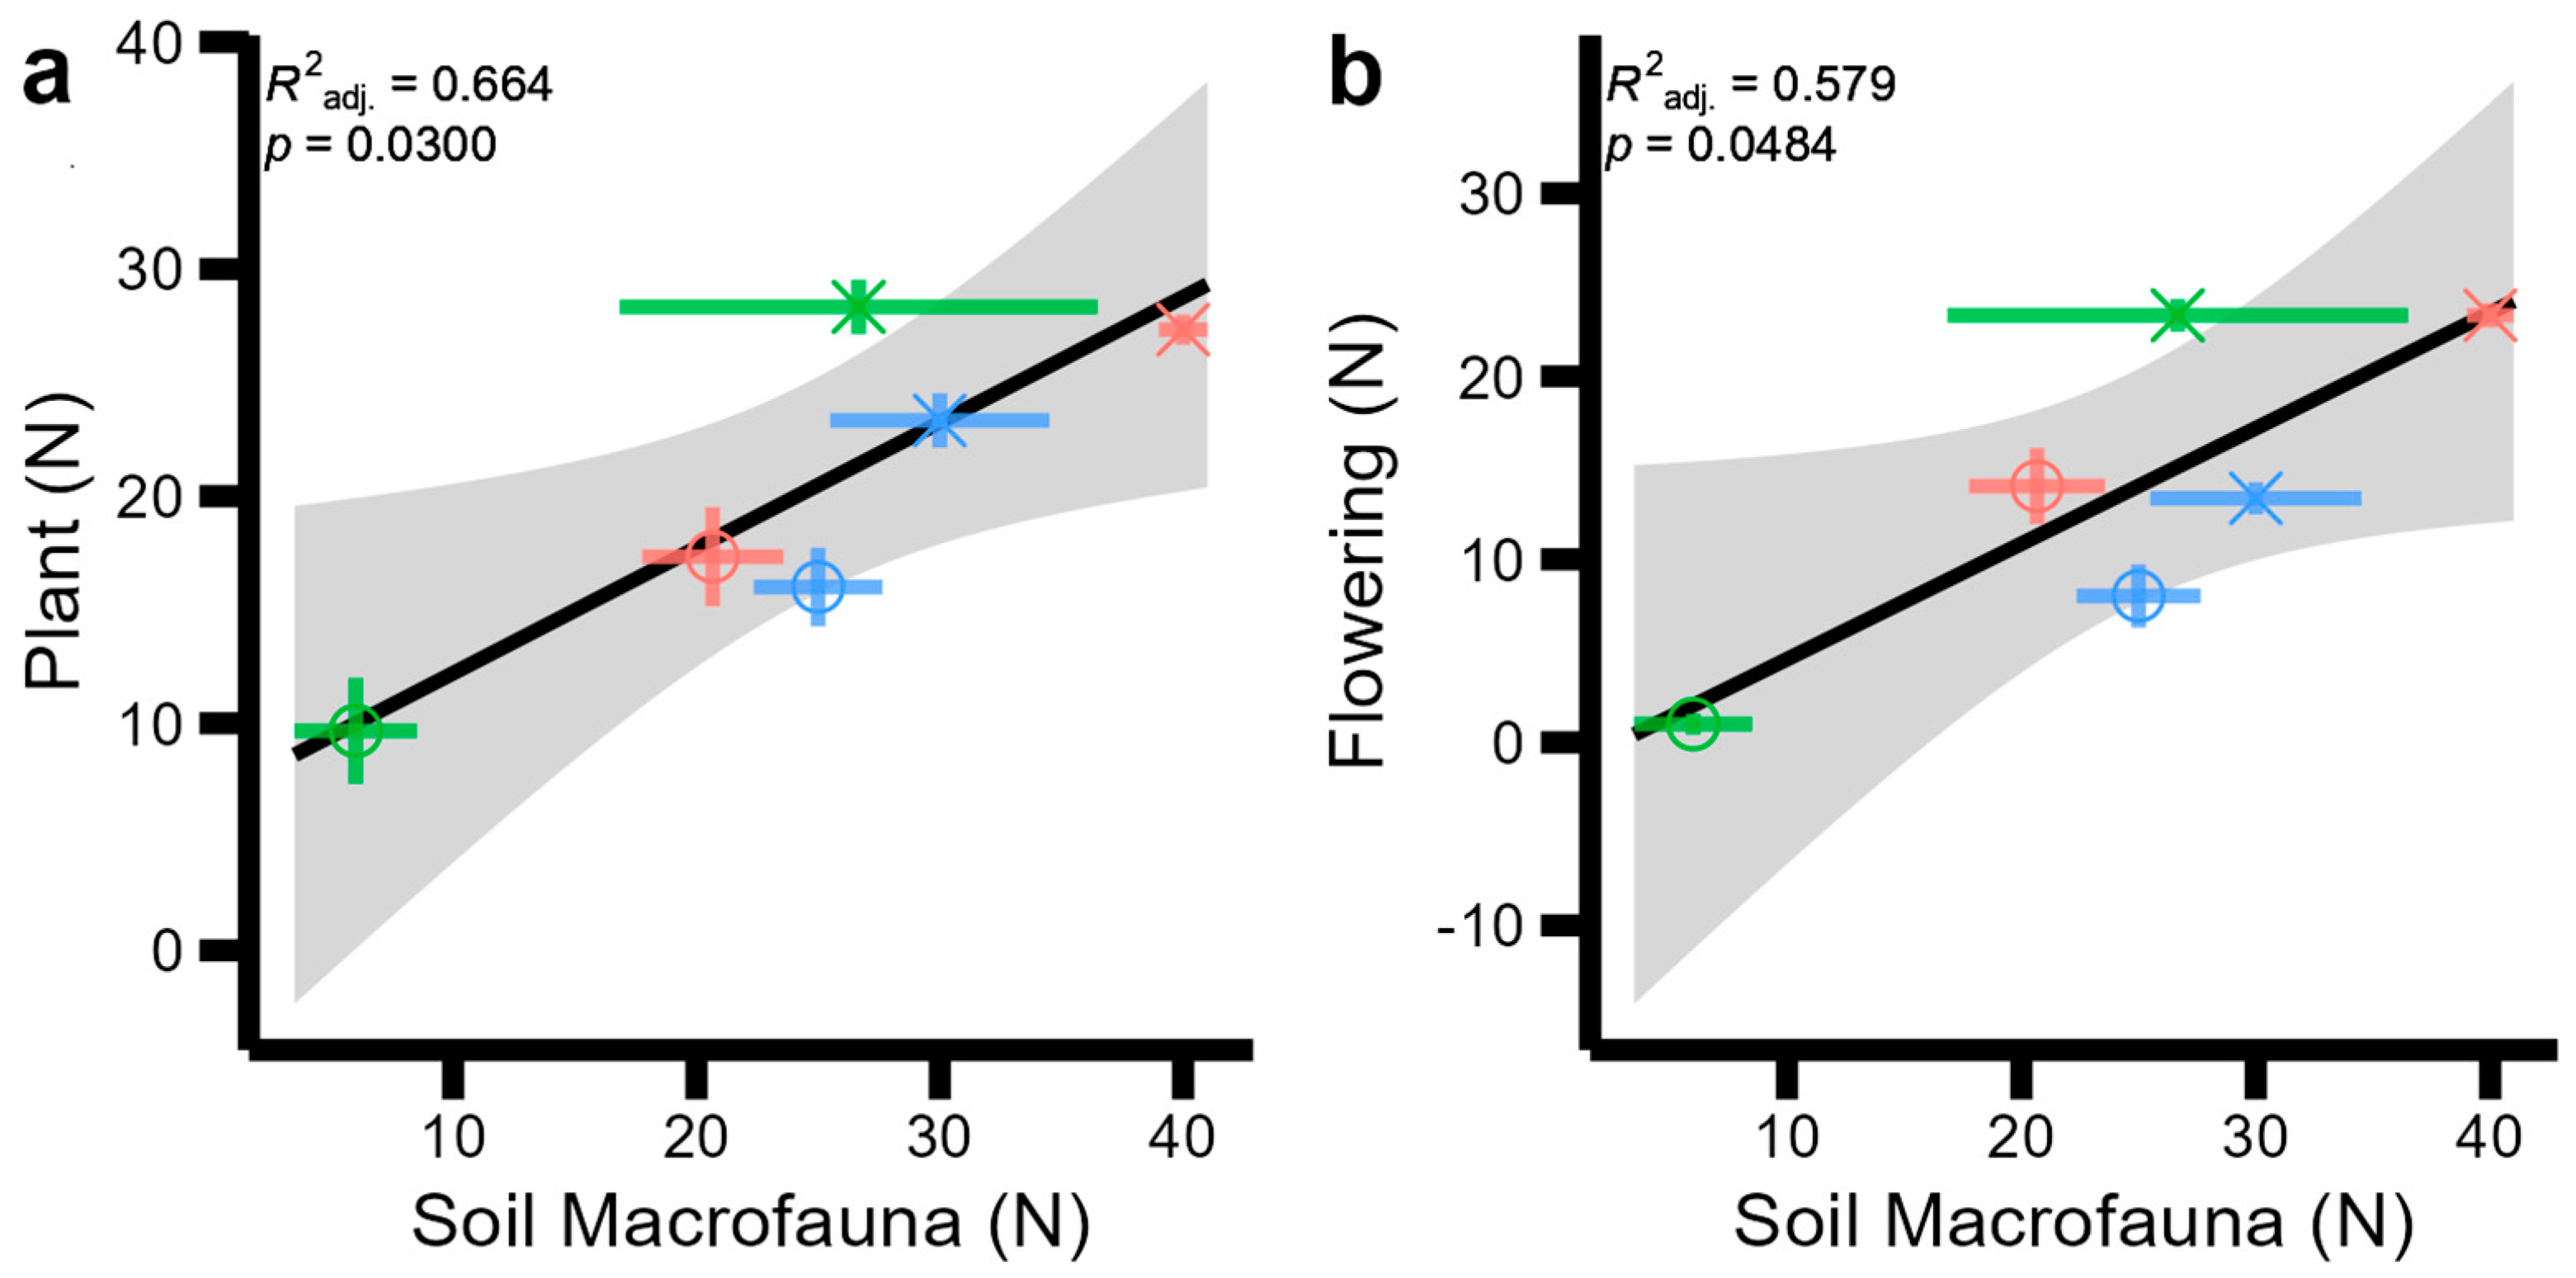
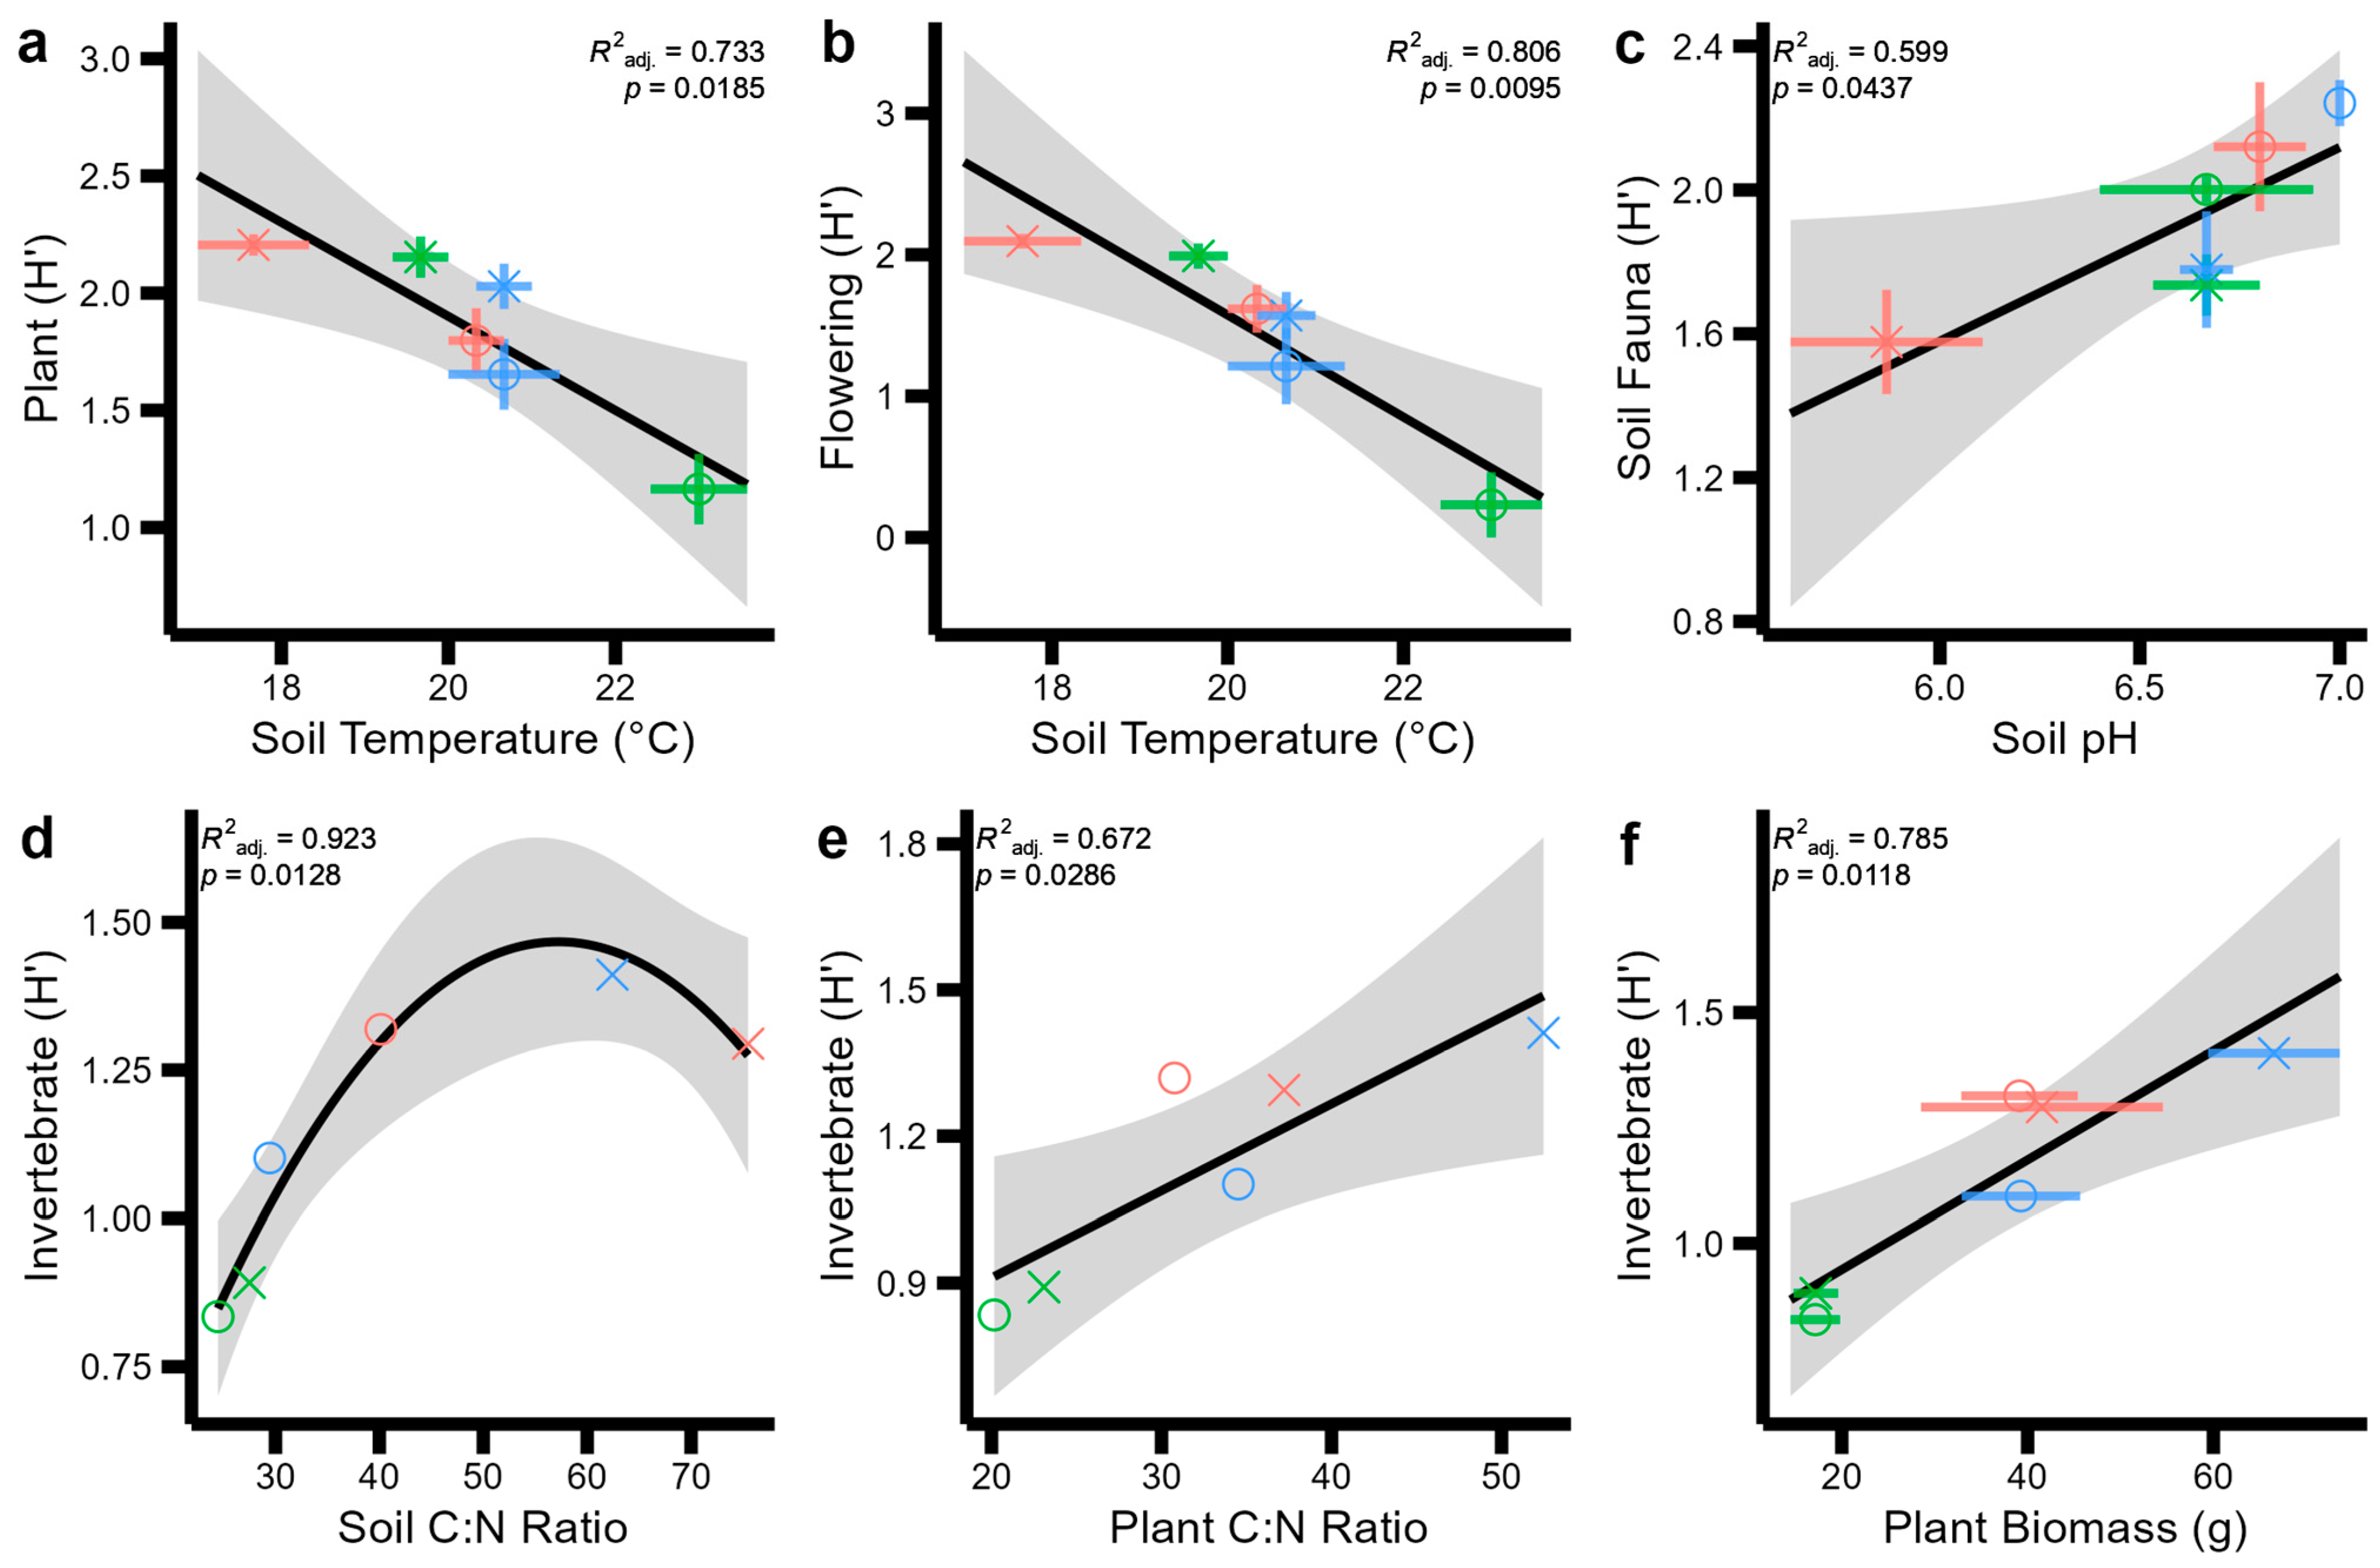
Relationships between biodiversity metrics (Figure 2) and site characteristics (Table 1) were first tested using correlation matrices across sites and habitat types (Figures S1 and S2 in the Supplementary Material). We found an indication of strong correlations between soil mesofauna and pollinator H (r = −0.69); soil total fauna and plant H (r = −0.67); soil total fauna and flowering plants H (r = −0.55); plant and invertebrate H (r = −0.51); and flowering plant and invertebrate H (r = 0.51) (Figure S1), which are also found in abundance equivalents (Figure S2). Both diversity and abundance matrices also indicated strong correlations between abiotic factors (primarily soil temperature, and soil, plant C:N ratios, and vegetation height) which were investigated according to general regression models. The best fitting regression models to our biotic observations are displayed in Figure 3, and those between abiotic and biotic variables are shown in Figure 4. No significant regressions were found between diversity metrics and, as such, Figure 3 displays the best regression between abundance measures: plant and soil macrofauna abundance increased linearly together (Figure 3a, F = 10.88, p = 0.03), and soil macrofauna and flowering plant abundance increased linearly (Figure 3b, F = 7.88, p = 0.0484).
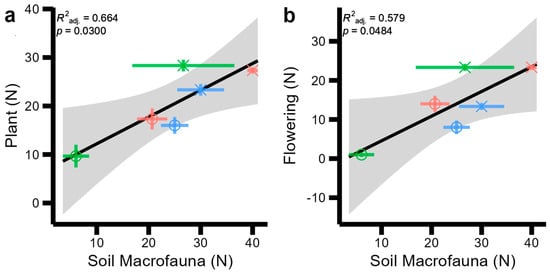
Figure 3.
Significant regression models between soil, plant, and aboveground invertebrate and pollinator abundance (N) with one another and soil and plant abiotic measurements across two sites (indicated by symbol shapes: circles: Wildflower Trail; triangles: Sustainability Gardens) and three habitat types (indicated by symbol colours: red: SMG; green: TG; blue: SF). Standard error across field-scale replicates is displayed with coloured error bars for each point. Standard error for the regression model is displayed by the grey shaded area. (a) plant abundance by soil macrofauna abundance (b) flowering plant abundance by soil macrofauna abundance.
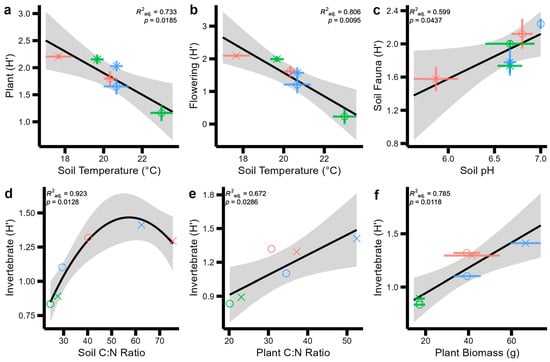
Figure 4.
Significant regression models between pairs of soil, plant, and aboveground invertebrate and pollinator Shannon Indices (H) across two sites (indicated by symbol shapes: circles: Wildflower Trail; triangles: Sustainability Gardens) and three habitat types (indicated by symbol colours: red: SMG; green: TG; blue: SF). Standard error across field-scale replicates is displayed with coloured error bars for each point. Standard error for the regression model is displayed by the grey shaded area. No error bars are displayed in panels d and e, as only one replicate of these variables was measured at the field scale. (a) plant Shannon diversity by soil temperature (b) flowering plant shannon diversity by soil temperature (c) soil fauna shannon diversity by soil pH. (d) invertebrate shannon diversity by soil C:N ratio, (e) invertebrate shannon diversity by plant C:N ratio and, (f) invertebrate shannon diversity by plant biomass.
The best explanatory abiotic variables for some biodiversity measurements are presented in Figure 4, indicating strong relationships between soil pH, temperature, and C:N ratios and plant C:N ratios and biomass across soil–plant–pollinator diversity. That is, total soil fauna diversity increased with soil pH (Figure 4a, F = 8.46, p = 0.0437); invertebrate diversity increased in a quadratic relationship with increasing soil C:N ratios (Figure 4b, F = 6.561, p = 0.0128); plant diversity declined with increasing soil temperature (Figure 4c; F = 14.74, p = 0.019); flowering plant diversity declined with increasing soil temperature (Figure 4d, F = 21.78, p = 0.0095); and invertebrate diversity increased linearly with plant C:N ratios (Figure 4e, F = 11.22, p = 0.0286) and linearly with plant biomass (Figure 4f, F = 19.28, p = 0.0118).
4. Discussion
The aim of this study was to investigate soil–plant–pollinator diversity relationships across three urban grass and meadow UGS habitat types (short-mown grass (SMG), tall grass (TG), and sown flowers (SF)). We expected higher plant diversity and lower disturbance from mowing in TG and SF to support greater soil, plant, and pollinator diversity. Across habitat types, we found significant differences in soil mesofauna diversity (Figure 2c), plant biomass (Figure 2d), and invertebrate diversity (Figure 2f), but a surprising lack of significant difference in plant (Figure 2e) and pollinator (Figure 2h) diversity between habitat types. Using regression analysis, we found much clearer relationships between soil–plant–pollinator measurements across sites and habitat types. In particular, we found a strong influence of soil macrofauna abundance on plant abundance (Figure 3a) and flowering plant abundance (Figure 3b), decreasing total plant and flowering plant diversity with increasing soil temperatures (Figure 4a,b), increasing soil fauna diversity in more alkaline soils (increasing soil pH, Figure 4c), and increasing aboveground invertebrate (largely pollinator) diversity with increasing soil and plant C:N ratios (Figure 4d,e) and plant biomass (Figure 4f). Our results do not support the hypothesis of greater plant diversity across habitats enhancing both soil and pollinator diversity. Rather, our results suggest an interactive effect of edaphic conditions on soil–plant–pollinator diversity relationships. We also find, contrary to expectations, largely indistinguishable differences in plant and pollinator diversity between TG and SF habitat types (Figure 2). This observation suggests that sowing flowers to establish new urban meadows has limited added benefits for soil, plant, and pollinator diversity compared to reduced mowing that allows resident wildflower species to establish.
The positive relationship between soil macrofauna and plant abundance observed in our study (Figure 3) is in general agreement with other studies. For instance, Tresch et al. [52] identified positive associations between plant abundance with soil fauna abundance across urban gardens in Switzerland. Furthermore, the findings presented here align with a detailed meta-analysis undertaken by Zhang et al. [53] on how plant abundance and richness can drive greater soil fauna abundance by providing microhabitats and resources. For instance, more complex plant structures provide various niches and food sources, enhancing soil fauna richness and activity. However, contrary to our expectations, our results found no significant relationship between soil and plant diversity, alongside a negative correlation between soil fauna diversity and plant diversity (Figure S1). In their meta-analysis, Zhang et al. [53] identified an average 10% increase in soil fauna diversity in more diverse plant mixtures, compared to corresponding monocultures. Soil fauna diversity has, however, been previously observed to decline in field habitats with annual flower planting (similar to the ‘sown flower’ habitat type surveyed here) but increase with perennial plant species mixes [54]. As annual plants need to be replanted, while perennial plants do not, our observed decline in soil fauna diversity from TG to SF habitats may reflect greater disturbance due to re-sowing annual seeds and removing woody debris which acts as a habitat and food resource [24]. The SMG and TG habitats may also reflect more seasonally consistent litter and root resources for associated soil fauna [55]. For instance, the TG habitat surveyed here yielded greater overall plant biomass than SF (Figure 2d). As such, the results here also agree with Llodrà-Llabrés and Cariñanos [18], who showed that the transience of annual ornamental wildflowers resulted in a decline in certain pollinator diversity when compared with perennial flowers.
In contrast to soil fauna diversity metrics, no significant regression was identified between aboveground invertebrate and pollinator diversity or flowering plant diversity, but positive associations were found between invertebrate diversity and plant C:N ratio (Figure 4e) and plant biomass (Figure 4f). These significant relationships did not hold for pollinator diversity, a distinction also represented across the different habitat types surveyed. For instance, pairwise comparisons in Figure 2 indicate significant increases in invertebrate diversity from SMG to TG and from SMG to SF (Figure 2f), while pollinator diversity was the only metric to increase from TG to SF (Figure 2h, but it should be noted that this was non-significant). Our results therefore indicate that aboveground invertebrates benefit from greater structural complexity of vegetation and reduced disturbance, while pollinators are much more responsive to the availability of floral resources. The lack of difference in plant diversity between SMG and TG is not particularly surprising, as tall grasses are resident plant communities that have been allowed to grow and establish flowers, but we expected sown flowers to have much higher diversity. Graves et al. [56] and Southon et al. [57], however, demonstrated that wildflower seed mixes may not be principally selected due to their biodiversity benefit and that other factors such as aesthetics also explain wildflower preference.
Similar insignificant observed effects of sowing flowers have been reported, compared to unmanaged grasslands, on plant and invertebrate abundance and diversity in butterflies and syrphids in Austria, attributed to the benefits of mowing cessation for the provision of shelter and appropriate microclimate throughout the season for juvenile pollinators [24]. Some pollinators are also particularly sensitive to frequent habitat disturbances [24,58]. Detecting habitat-specific pollinator and invertebrate diversity patterns in our study, however, is caveated by the close proximity of habitat types within the two sites. Therefore, taken together, our study observations on different taxa suggests that while taller vegetation with greater flowering plant diversity tends to support greater invertebrate and pollinator diversity, a combination of meadow types will support greater overall biodiversity by also enhancing soil fauna diversity [21].
An unexpected finding of our study is the potential role of N availability on soil–plant–pollinator relationships. That is, greater plant and soil C:N ratios were strongly associated with increasing invertebrate diversity (Figure 4d,e). C:N ratios represent the availability of N relative to C, so an increase in C:N represents a lower availability of N to meet plant and animal requirements to maintain nutrient homeostasis (optimal C:N ratios of their tissues, ratios being higher for soil and plants than animals) [59]. In our study, increasing C:N ratios are associated with greater plant biomass and less alkaline soils (lower soil pH), suggesting an inverse effect of tall flowering plants on aboveground invertebrate and soil fauna diversity due to soil N depletion to meet plant demands. Mowing regimes and the removal or retention of grass cuttings can further impact nutrient dynamics and C:N budgets [60]. We anticipate a strong influence of time since meadow establishment or mowing cessation on plant C:N ratios, with much lower soil and plant C:N ratios measured at the more recently established meadow habitats at the Sustainability Gardens compared to the Wildflower Trials (established ~10 years prior). This is a legacy effect of the previous short-mown grass habitat on which the meadows were established, suggesting that tall flowering plant communities gradually deplete soil N availability over time, leading to lower plant and soil C:N ratios. The authors of [61] similarly observed an effect of greater plant diversity on declining available soil N, attributed to the greater nutrient demands of diverse plant mixtures. Our study was limited to only two sites with all three habitat types due to the availability of suitable UGSs not being used for public events during the sampling period in early summer. Future studies could focus on the composition of UGS rather than specific habitat types, including replication for habitat composition alongside time since meadow establishment or mowing cessation. Where possible, controlled interventions could be implemented to disentangle the effects of sowing flowers or mowing intensity in a paired-control design. Higher resolution sampling at the species level for soil fauna, plants, and pollinators, for multiple time points across the entire growing season and multiple years, would also provide valuable insights into the synchrony of the observed edaphic effects on soil–plant–pollinator diversity relationships. Future studies could also consider a greater range of nutrients (especially P, which is critical for nutrient flows between ecosystem components), ecosystem functions (e.g., litter decomposition, N mineralization, and water regulation), and the confounding effect of tree cover on plant–pollinator interactions.
Numerous factors not considered in our study will strongly influence pollinators with high dispersal capabilities, more so than soil fauna, in real urban landscapes. UGSs, for instance, occur as a fragmented patchwork of habitat separated by impervious surfaces, and so the landscape composition (how UGSs of various sizes are connected) is important for understanding the consequences of local UGS interventions such as mowing cessation and meadow establishment for pollinators [62,63]. For instance, the authors of [64] demonstrate that smaller patches of UGSs typically host greater plant diversity (when compared to larger patches) but that connectivity between small patches is equally important for maintaining plant diversity. In a meta-analysis of UGSs on insect diversity, the authors of [65] found complex species- and scale-specific dependencies which led to unexpected positive effects of UGS on insects in ‘urban sprawl’ areas. These complex multi-faceted and multi-scaled interactions need greater understanding, through experiments and tools that aim to quantitatively disentangle the influence of various UGS properties, so that ecosystem services such as pollination and soil health can be maximised across urban landscapes.
5. Conclusions
Our study investigated soil, plant, and pollinator interactions across UGS habitat types (short-mown grass, tall grass, and sown flowers). No single habitat type benefited all taxa, suggesting that a combination of habitat types will likely yield the greatest biodiversity benefits. We also found limited evidence of additional diversity benefits from meadow establishment (sowing flowers) compared to the cessation of mowing (tall grass). However, it is important to highlight that, while the findings of this study provide valuable insights, they should be generalized with caution due to the small sample size. Nevertheless, our results support growing incentives for alternative management, for example, the cessation of mowing for amenity grass. Conversely, tall grass and sown flowers deplete available nutrients, which we found to play a key role in soil–plant–pollinator interactions across habitat types and sites. The role of nutrient availability and edaphic variables in soil fauna, flowering plant, and aboveground invertebrate diversity measurements in this study again suggests that a combination of management regimes may best promote diversity. Future research in UGS interventions to promote biodiversity and ecosystem functioning should consider the potentially limiting role of nutrient availability, as these effects are much more pronounced with greater time since tall grass and meadow establishment.
Supplementary Materials
Supporting information can be downloaded at: https://www.mdpi.com/article/10.3390/d16060354/s1, Figure S1. Correlation matrix between site characteristics and diversity measures; Figure S2. Correlation matrix between site characteristics and abundance (N) and biomass measures; Figure S3. Non-significant relationships between site characteristics and diversity metrics across two sites (indicated by symbol shape: circles: Wildflower Trail, triangles: Sustainability Gardens) and three habitat types (indicated by symbol colours: purple: SMG, blue: TG, yellow: SF).
Author Contributions
Conceived, designed, and supervised the research: A.S.J. Funding acquisition: A.S.J. Coordinated data collection: M.S. and Z.L. Prepared the data for analysis: M.S., Z.L., and W.R. Prepared the original draft of the manuscript: M.S. and A.S.J. Conducted the data analysis: W.R. and A.S.J. Prepared a revised draft of the manuscript: W.R. and A.S.J. Reviewed and edited the revised manuscript: T.M. and A.S.J. All authors have read and agreed to the published version of the manuscript.
Funding
This research was funded by the Natural Environment Research Council, grant numbers NE/S007350/1 and NE/W003031/1. The APC was funded by Cranfield University.
Institutional Review Board Statement
The animal study protocol was approved by the Cranfield University Research Ethics System (CURES) (ID code 22225, approved: 12 June 2023).
Data Availability Statement
Data and R script used in this study are available at the figshare repository, https://www.doi.org/10.6084/m9.figshare.26062909, accessed on 19 June 2024.
Acknowledgments
The authors would like to thank Gareth Ellis, Ginny Ford, and Kate Biggs for their assistance in site selection and gaining sampling permissions; Alan Nelson, Nuannat Simmons, and Richard Andrews for their help with equipment and laboratory analyses; and the three anonymous reviewers for helpful suggestions that improved this manuscript.
Conflicts of Interest
The authors declare no conflicts of interest.
References
- IPBES. Global Assessment Report on Biodiversity and Ecosystem Services of the Intergovernmental Science-Policy Platform on Biodiversity and Ecosystem Services; Brondizio, E.S., Settele, J., Díaz, S., Ngo, H.T., Eds.; IPBES Secretariat: Bonn, Germany, 2019; 1148p. [Google Scholar] [CrossRef]
- Mace, G.M.; Norris, K.; Fitter, A.H. Biodiversity and Ecosystem Services: A Multilayered Relationship. Trends Ecol. Evol. 2012, 27, 19–26. [Google Scholar] [CrossRef]
- Mori, A. Advancing Nature—Based Approaches to address the Biodiversity and Climate Emergency. Ecol. Lett. Viewp. 2020, 23, 1729–1732. [Google Scholar] [CrossRef]
- United Nations Environment Programme (UNEP) UN Decade on Restoration. Available online: http://www.decadeonrestoration.org/node (accessed on 18 March 2024).
- Newbold, T.; Hudson, L.N.; Hill, S.L.L.; Contu, S.; Lysenko, I.; Senior, R.A.; Börger, L.; Bennett, D.J.; Choimes, A.; Collen, B.; et al. Global Effects of Land Use on Local Terrestrial Biodiversity. Nature 2015, 520, 45–50. [Google Scholar] [CrossRef]
- Foley, J.A.; DeFries, R.; Asner, G.P.; Barford, C.; Bonan, G.; Carpenter, S.R.; Chapin, F.S.; Coe, M.T.; Daily, G.C.; Gibbs, H.K.; et al. Global Consequences of Land Use. Science 2005, 309, 570–574. [Google Scholar] [CrossRef] [PubMed]
- Herrmann, J.; Buchholz, S.; Theodorou, P. The Degree of Urbanisation Reduces Wild Bee and Butterfly Diversity and Alters the Patterns of Flower-Visitation in Urban Dry Grasslands. Sci. Rep. 2023, 13, 2702. [Google Scholar] [CrossRef] [PubMed]
- Garibaldi, L.A.; Gomez Carella, D.S.; Nabaes Jodar, D.N.; Smith, M.R.; Timberlake, T.P.; Myers, S.S. Exploring Connections between Pollinator Health and Human Health. Philos. Trans. R. Soc. B Biol. Sci. 2022, 377, 20210158. [Google Scholar] [CrossRef]
- Bates, A.J.; Sadler, J.P.; Fairbrass, A.J.; Falk, S.J.; Hale, J.D.; Matthews, T.J. Changing Bee and Hoverfly Pollinator Assemblages along an Urban-Rural Gradient. PLoS ONE 2011, 6, e23459. [Google Scholar] [CrossRef]
- Fortel, L.; Henry, M.; Guilbaud, L.; Guirao, A.L.; Kuhlmann, M.; Mouret, H.; Rollin, O.; Vaissière, B.E. Decreasing Abundance, Increasing Diversity and Changing Structure of the Wild Bee Community (Hymenoptera: Anthophila) along an Urbanization Gradient. PLoS ONE 2014, 9, e104679. [Google Scholar] [CrossRef] [PubMed]
- Graffigna, S.; González-Vaquero, R.A.; Torretta, J.P.; Marrero, H.J. Importance of Urban Green Areas’ Connectivity for the Conservation of Pollinators. Urban Ecosyst. 2023, 27, 417–426. [Google Scholar] [CrossRef]
- Theodorou, P.; Albig, K.; Radzevičiūtė, R.; Settele, J.; Schweiger, O.; Murray, T.E.; Paxton, R.J. The Structure of Flower Visitor Networks in Relation to Pollination across an Agricultural to Urban Gradient. Funct. Ecol. 2017, 31, 838–847. [Google Scholar] [CrossRef]
- Theodorou, P.; Radzevičiūtė, R.; Lentendu, G.; Kahnt, B.; Husemann, M.; Bleidorn, C.; Settele, J.; Schweiger, O.; Grosse, I.; Wubet, T.; et al. Urban Areas as Hotspots for Bees and Pollination but not a Panacea for all Insects. Nat. Commun. 2020, 11, 576. [Google Scholar] [CrossRef] [PubMed]
- Dobbs, C.; Nitschke, C.R.; Kendal, D. Global Drivers and Tradeoffs of Three Urban Vegetation Ecosystem Services. PLoS ONE 2014, 9, e113000. [Google Scholar] [CrossRef] [PubMed]
- Drillet, Z.; Fung, T.K.; Leong, R.A.T.; Sachidhanandam, U.; Edwards, P.; Richards, D. Urban Vegetation Types Are not Perceived Equally in Providing Ecosystem Services and Disservices. Sustainability 2020, 12, 2076. [Google Scholar] [CrossRef]
- Faucon, M.-P.; Houben, D.; Lambers, H. Plant Functional Traits: Soil and Ecosystem Services. Trends Plant Sci. 2017, 22, 385–394. [Google Scholar] [CrossRef] [PubMed]
- Lavorel, S. Plant Functional Effects on Ecosystem Services. J. Ecol. 2013, 101, 4–8. [Google Scholar] [CrossRef]
- Llodrà-Llabrés, J.; Cariñanos, P. Enhancing Pollination Ecosystem Service in Urban Green Areas: An Opportunity for the Conservation of Pollinators. Urban For. Urban Green. 2022, 74, 127621. [Google Scholar] [CrossRef]
- Griffiths-Lee, J.; Nicholls, E.; Goulson, D. Sown Mini-Meadows Increase Pollinator Diversity in Gardens. J. Insect Conserv. 2022, 26, 299–314. [Google Scholar] [CrossRef]
- Cohen, H.; Philpott, S.M.; Liere, H.; Lin, B.B.; Jha, S. The Relationship between Pollinator Community and Pollination Services is Mediated by Floral Abundance in Urban Landscapes. Urban Ecosyst. 2021, 24, 275–290. [Google Scholar] [CrossRef]
- Norton, B.A.; Bending, G.D.; Clark, R.; Corstanje, R.; Dunnett, N.; Evans, K.L.; Grafius, D.R.; Gravestock, E.; Grice, S.M.; Harris, J.A.; et al. Urban Meadows as an Alternative to Short Mown Grassland: Effects of Composition and Height on Biodiversity. Ecol. Appl. 2019, 29, e01946. [Google Scholar] [CrossRef]
- Lerman, S.B.; Contosta, A.R.; Milam, J.; Bang, C. To Mow or to Mow Less: Lawn Mowing Frequency Affects Bee Abundance and Diversity in Suburban Yards. Biol. Conserv. 2018, 221, 160–174. [Google Scholar] [CrossRef]
- Roguz, K.; Chiliński, M.; Roguz, A.; Zych, M. Pollination of Urban Meadows—Plant Reproductive Success and Urban-Related Factors Influencing Frequency of Pollinators Visits. Urban For. Urban Green. 2023, 84, 127944. [Google Scholar] [CrossRef]
- Hussain, R.I.; Walcher, R.; Vogel, N.; Krautzer, B.; Rasran, L.; Frank, T. Effectiveness of Flowers Strips on Insect’s Restoration in Intensive Grassland. Agric. Ecosyst. Environ. 2023, 348, 108436. [Google Scholar] [CrossRef]
- Sehrt, M.; Bossdorf, O.; Freitag, M.; Bucharova, A. Less is More! Rapid Increase in Plant Species Richness after Reduced Mowing in Urban Grasslands. Basic Appl. Ecol. 2020, 42, 47–53. [Google Scholar] [CrossRef]
- Watson, C.J.; Carignan-Guillemette, L.; Turcotte, C.; Maire, V.; Proulx, R. Ecological and Economic Benefits of Low-Intensity Urban Lawn Management. J. Appl. Ecol. 2020, 57, 436–446. [Google Scholar] [CrossRef]
- Piqueray, J.; Gilliaux, V.; Decruyenaere, V.; Cornelis, J.-T.; Uyttenbroeck, R.; Mahy, G. Management of Grassland-like Wildflower Strips Sown on Nutrient-Rich Arable Soils: The Role of Grass Density and Mowing Regime. Environ. Manag. 2019, 63, 647–657. [Google Scholar] [CrossRef]
- Barber, N.A.; Soper Gorden, N.L. How Do Belowground Organisms Influence Plant–Pollinator Interactions? J. Plant Ecol. 2015, 8, 1–11. [Google Scholar] [CrossRef]
- Wardle, D.A.; Bardgett, R.D.; Klironomos, J.N.; Setälä, H.; van der Putten, W.H.; Wall, D.H. Ecological Linkages Between Aboveground and Belowground Biota. Science 2004, 304, 1629–1633. [Google Scholar] [CrossRef] [PubMed]
- Blaydes, H.; Potts, S.G.; Whyatt, J.D.; Armstrong, A. Opportunities to Enhance Pollinator Biodiversity in Solar Parks. Renew. Sustain. Energy Rev. 2021, 145, 111065. [Google Scholar] [CrossRef]
- Hyvönen, T.; Huusela, E.; Kuussaari, M.; Niemi, M.; Uusitalo, R.; Nuutinen, V. Aboveground and Belowground Biodiversity Responses to Seed Mixtures and Mowing in a Long-Term Set-Aside Experiment. Agric. Ecosyst. Environ. 2021, 322, 107656. [Google Scholar] [CrossRef]
- McCravy, K.W. A Review of Sampling and Monitoring Methods for Beneficial Arthropods in Agroecosystems. Insects 2018, 9, 170. [Google Scholar] [CrossRef]
- Popic, T.J.; Davila, Y.C.; Wardle, G.M. Evaluation of Common Methods for Sampling Invertebrate Pollinator Assemblages: Net Sampling Out-Perform Pan Traps. PLoS ONE 2013, 8, e66665. [Google Scholar] [CrossRef] [PubMed]
- Broussard, M.; Rao, S.; Stephen, W.P.; White, L. Native Bees, Honeybees, and Pollination in Oregon Cranberries. HortScience 2011, 46, 885–888. [Google Scholar] [CrossRef]
- Hall, M.A.; Reboud, E.L. High sampling effectiveness for Non-Bee Pollinators Using Vane Traps in Both Open and Wooded Habitats. bioRxiv 2019, 6, 556498. [Google Scholar] [CrossRef]
- Prayogo, C.; Sholehuddin, N.; Putra, E.; Rachmawati, R. Soil Macrofauna Diversity and Structure under Different Management of Pine-Coffee Agroforestry System. J. Degrad. Min. Lands Manag. 2019, 6, 1727–1736. [Google Scholar] [CrossRef]
- Smith, J.; Potts, S.; Eggleton, P. Evaluating the Efficiency of Sampling Methods in Assessing Soil Macrofauna Communities in Arable Systems. Eur. J. Soil Biol. 2008, 44, 271–276. [Google Scholar] [CrossRef]
- Eisenhauer, N.; Straube, D.; Scheu, S. Efficiency of Two Widespread Non-Destructive Extraction Methods under Dry Soil Conditions for Different Ecological Earthworm Groups. Eur. J. Soil Biol. 2008, 44, 141–145. [Google Scholar] [CrossRef]
- Iannone, B.V.; Umek, L.G.; Wise, D.H.; Heneghan, L. A Simple, Safe, and Effective Sampling Technique for Investigating Earthworm Communities in Woodland Soils: Implications for Citizen Science. Naar 2012, 32, 283–292. [Google Scholar] [CrossRef]
- Roper, W.R.; Robarge, W.P.; Osmond, D.L.; Heitman, J.L. Comparing Four Methods of Measuring Soil Organic Matter in North Carolina Soils. Soil Sci. Soc. Am. J. 2019, 83, 466–474. [Google Scholar] [CrossRef]
- Heuck, C.; Weig, A.; Spohn, M. Soil Microbial Biomass C:N:P Stoichiometry and Microbial Use of Organic Phosphorus. Soil Biol. Biochem. 2015, 85, 119–129. [Google Scholar] [CrossRef]
- Chandra, K.; Rizvi, A.; Acharya, S.; Raghunathan, C. Soil Fauna of India Manual; ResearchGate: Berlin, Germany, 2019; ISBN 978-81-8171-523-4. [Google Scholar]
- Edwards, C.A. The Assessment of Populations of Soil-Inhabiting Invertebrates. Agric. Ecosyst. Environ. 1991, 34, 145–176. [Google Scholar] [CrossRef]
- Paul, B.K.; Vanlauwe, B.; Hoogmoed, M.; Hurisso, T.T.; Ndabamenye, T.; Terano, Y.; Six, J.; Ayuke, F.O.; Pulleman, M.M. Exclusion of Soil Macrofauna Did not Affect Soil Quality but Increased Crop Yields in a Sub-Humid Tropical Maize-Based System. Agric. Ecosyst. Environ. 2015, 208, 75–85. [Google Scholar] [CrossRef]
- Crotty, F.; Shepherd, M. A Key to the Soil Mites of Britain and Ireland. Available online: https://www.fscbiodiversity.uk/idsignpost/key-soil-mites-britain-and-ireland (accessed on 18 March 2024).
- Tan, H.; Barret, M.; Mooij, M.J.; Rice, O.; Morrissey, J.P.; Dobson, A.; Griffiths, B.; O’Gara, F. Long-Term Phosphorus Fertilisation Increased the Diversity of the Total Bacterial Community and the phoD Phosphorus Mineraliser Group in Pasture Soils. Biol Fertil Soils 2013, 49, 661–672. [Google Scholar] [CrossRef]
- R Core Team R: The R Project for Statistical Computing. Available online: https://www.r-project.org/ (accessed on 3 June 2024).
- Wickham, H.; François, R.; Henry, L.; Müller, K.; Vaughan, D. A Grammar of Data Manipulation. Available online: https://dplyr.tidyverse.org/ (accessed on 3 June 2024).
- An Introduction to Reshape2—Reshaping Data Easily with the Reshape2 R Package.—Seananderson.ca. Available online: https://seananderson.ca/2013/10/19/reshape/ (accessed on 3 June 2024).
- Create Elegant Data Visualisations Using the Grammar of Graphics. Available online: https://ggplot2.tidyverse.org/ (accessed on 3 June 2024).
- Ahlmann-Eltze, P.C. Indrajeet Ggsignif Package. Available online: https://cran.r-project.org/web/packages/ggsignif/vignettes/intro.html (accessed on 3 June 2024).
- Tresch, S.; Frey, D.; Bayon, R.-C.L.; Mäder, P.; Stehle, B.; Fliessbach, A.; Moretti, M. Direct and Indirect Effects of Urban Gardening on Aboveground and Belowground Diversity Influencing Soil Multifunctionality. Sci. Rep. 2019, 9, 9769. [Google Scholar] [CrossRef] [PubMed]
- Zhang, Y.; Peng, S.; Chen, X.; Chen, H.Y.H. Plant Diversity Increases the Abundance and Diversity of Soil Fauna: A Meta-Analysis. Geoderma 2022, 411, 115694. [Google Scholar] [CrossRef]
- Bednar, Z.; Vaupel, A.; Blümel, S.; Herwig, N.; Hommel, B.; Haberlah-Korr, V.; Beule, L. Earthworm and Soil Microbial Communities in Flower Strip Mixtures. Plant Soil 2023, 492, 209–227. [Google Scholar] [CrossRef]
- Kozlov, M.V.; Zverev, V. Insecticide Application Did Not Reveal Any Impact of Herbivory on Plant Roots in Boreal Forests. Appl. Soil Ecol. 2022, 178, 104554. [Google Scholar] [CrossRef]
- Graves, R.A.; Pearson, S.M.; Turner, M.G. Species Richness Alone Does not Predict Cultural Ecosystem Service Value. Proc. Natl. Acad. Sci. USA 2017, 114, 3774–3779. [Google Scholar] [CrossRef]
- Southon, G.E.; Jorgensen, A.; Dunnett, N.; Hoyle, H.; Evans, K.L. Biodiverse Perennial Meadows Have Aesthetic Value and Increase Residents’ Perceptions of Site Quality in Urban Green-Space. Landsc. Urban Plan. 2017, 158, 105–118. [Google Scholar] [CrossRef]
- Humbert, J.-Y.; Pellet, J.; Buri, P.; Arlettaz, R. Does Delaying the First Mowing Date Benefit Biodiversity in Meadowland? Environ. Evid. 2012, 1, 9. [Google Scholar] [CrossRef]
- Raubenheimer, D.; Simpson, S.J.; Mayntz, D. Nutrition, Ecology and Nutritional Ecology: Toward an Integrated Framework. Funct. Ecol. 2009, 23, 4–16. [Google Scholar] [CrossRef]
- Gaston, K.J.; Ávila-Jiménez, M.L.; Edmondson, J.L. Review: Managing Urban Ecosystems for Goods and Services. J. Appl. Ecol. 2013, 50, 830–840. [Google Scholar] [CrossRef]
- Oelmann, Y.; Wilcke, W.; Temperton, V.M.; Buchmann, N.; Roscher, C.; Schumacher, J.; Schulze, E.-D.; Weisser, W.W. Soil and Plant Nitrogen Pools as Related to Plant Diversity in an Experimental Grassland. Soil Sci. Soc. Am. J. 2007, 71, 720–729. [Google Scholar] [CrossRef]
- Rojas-Botero, S.; Dietzel, S.; Kollmann, J.; Teixeira, L.H. Towards a Functional Understanding of Rehabilitated Urban Road Verge Grasslands: Effects of Planting Year, Site Conditions, and Landscape Factors. Flora 2023, 309, 152417. [Google Scholar] [CrossRef]
- Zaninotto, V.; Fauviau, A.; Dajoz, I. Diversity of Greenspace Design and Management Impacts Pollinator Communities in a Densely Urbanized Landscape: The City of PARIS, France. Urban Ecosyst. 2023, 26, 503–515. [Google Scholar] [CrossRef]
- Vega, K.A.; Küffer, C. Promoting Wildflower Biodiversity in Dense and Green Cities: The Important Role of Small Vegetation Patches. Urban For. Urban Green. 2021, 62, 127165. [Google Scholar] [CrossRef]
- Wenzel, A.; Grass, I.; Belavadi, V.V.; Tscharntke, T. How Urbanization is Driving Pollinator Diversity and Pollination—A Systematic Review. Biol. Conserv. 2020, 241, 108321. [Google Scholar] [CrossRef]
Disclaimer/Publisher’s Note: The statements, opinions and data contained in all publications are solely those of the individual author(s) and contributor(s) and not of MDPI and/or the editor(s). MDPI and/or the editor(s) disclaim responsibility for any injury to people or property resulting from any ideas, methods, instructions or products referred to in the content. |
© 2024 by the authors. Licensee MDPI, Basel, Switzerland. This article is an open access article distributed under the terms and conditions of the Creative Commons Attribution (CC BY) license (https://creativecommons.org/licenses/by/4.0/).

