Abstract
The Belize Barrier Reef system (BBR) in the western Caribbean’s Gulf of Honduras contains a large region of lagoon coral reef, seagrass and mangrove habitat. As the largest lagoon habitat within the Caribbean, this region experiences differing oceanographic and temperature conditions as compared to deeper offshore areas. The occurrence of several endemic species within the Gulf of Honduras area and inside the Belize lagoon supports the hypothesis that this area is a unique biogeographic region. Consequently, the ecological effects of temperature increase due to global climate change may have a long-term adverse impact on this region’s unique marine species. This study reports an in situ temperature record over a ten-year period (2004–2014) collected from a coral reef offshore of Wee Wee Cay within the South Water Cay Marine Reserve of Belize. There was a steady increase in temperature during the decade.
1. Introduction
Coral mortality due to disease and bleaching is expected to increase in severity and intensity as global temperatures continue to rise [1,2,3]. The South Water Cay Marine Preserve of the Belizean Barrier Reef System is a World Heritage Site and contains some of the least impacted ecologically and commercially important reef habitat in the western Caribbean [4]. In addition, this region has been identified as having key physicochemical properties which differ from the rest of the Western Caribbean [5]. This region within the large Belizean Reef lagoon system (which extends to Honduras) is also home to at least 20 identified endemic species, which are likely particularly sensitive to ecological disturbances in this restricted habitat [6]. Current knowledge of life history characteristics and the specific environmental conditions resulting in these organisms’ unique adaptations to the Belizean lagoon region are lacking. Satellite-derived sea surface temperatures (SSTs) are increasingly being used to study near shore marine habitats [7]. In Belize, satellite SST has been used to examine coral bleaching events and trends in water conditions [3,8]. However, so far, there have been few studies into how accurately SSTs reflect actual temperatures experienced by sub-tidal organisms [7]. Current in situ oceanographic assessment in the western Caribbean is in place and the Belize Barrier Reef has multiple virtual stations measuring temperature [9] (NOAA CHAMP, http://www.coral.noaa.gov/champportal/ accessed on 1 November 2023). However, there are still critical habitats which are not yet included in the currently established sensor network. Furthermore, the interpretation of satellite SST measurements has not been adequately calibrated with actual underwater measurements in areas where local oceanography has an effect. Increased levels of in situ monitoring of Belizean Barrier Reef and Lagoon oceanographic properties are critical to understanding differences and changes in water quality in these water masses due to continued anthropogenic impacts from land use and climate change.
2. Materials and Methods
2.1. Study Site
The study location was at Wee Wee Cay, Belize, inside the Belize barrier reef. Onset Corporation’s model HOBO Tidbit temperature loggers (±0.2 °C accuracy with resolution: 0.02 °C at 25 °C) were deployed at an approximate depth of 1.2 to about 2 m during typical tidal variation at Wee Wee Cay (Figure 1) located at 16°45.39 N, 88°8.03 W. Wee Wee Cay is approximately 12.4 km from the Belizean mainland and approximately 7 km from the reef crest (Figure 2). The shallow underwater habitat at Wee Wee Cay contains extensive seagrass beds and numerous patch reefs (Figure 3).
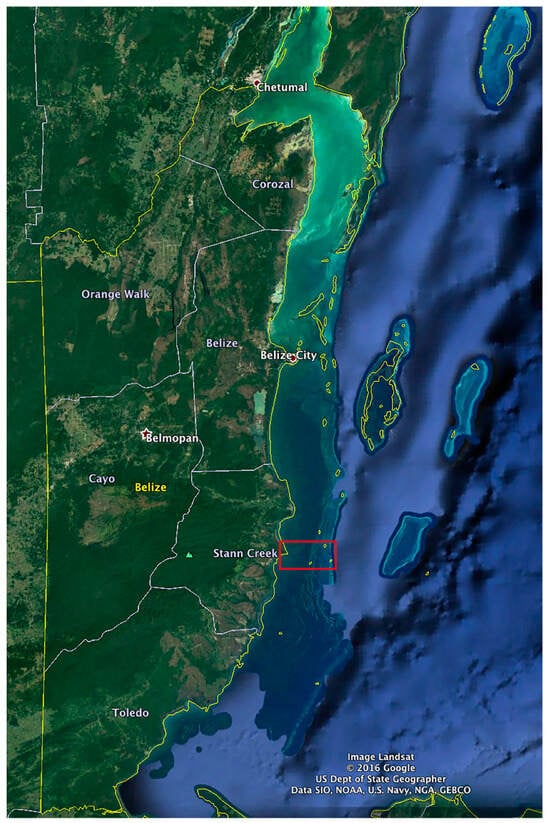
Figure 1.
The Barrier Reef region offshore of Belize, Central America. The red box shows the general study site area, shown in detail in Figure 2. (Google Earth map).
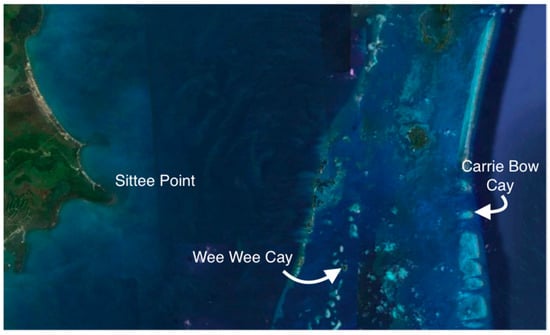
Figure 2.
Location of Wee Wee Cay (16°45.39 N, 88°8.03 W) and nearby Carrie Bow Cay. (Google Earth map).
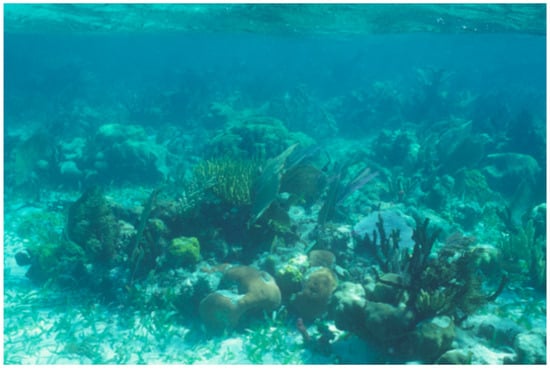
Figure 3.
Underwater habitat at Wee Wee Cay, about 1.5 m depth (P.S. Lobel photo).
2.2. Long-Term Recording at One Station
Loggers were attached to a piling at the base of the dock on the western or leeward side of the island. The loggers’ data were downloaded and redeployed during annual trips (November or December). Logger calibrations were tested with laboratory deployments at known temperatures. Temperature data were collected every 4 h in 2004 (and December 2003), hourly during 2005 and 2006, and every 30 min during 2007–2014. The 2008 temperature logger was lost. The entire dataset is in Supplementary Material Table S1.
2.3. Short-Term Synchronous Recording of Tide and Temperature at Four Depths
Temperature and tide level data were recorded over a ten-day period (1 December to 10 December 2010) at Wee Wee Cay, Belize. Temperature data are from four Tidbit loggers placed at increasing depth increments (0.6, 1.2, 3, 6 m), and tide data were recorded from one tide logger at mean 1.2 m depth. This tide logger was Madgetech model 1000; resolution 0.05 in; the normal range for calibrated accuracy is +0.3% max at 25 °C.
2.4. Comparative Data
Comparative temperature data were downloaded from Carrie Bow Cay Environmental Monitoring System Archives (https://invertebrates.si.edu/CCRE/belize/ accessed on 1 November 2016). The only year available online that overlapped with this study’s data set was 2004.
The Monthly Mean Maximum (MMM) and the MMM + 1 °C, or the Bleaching Threshold, are calculated as described by the NOAA Coral Reef Watch website using our time series data (https://coralreefwatch.noaa.gov/product/5km/tutorial/crw08a_bleaching_threshold.php) (accessed on 1 December 2023).
2.5. Satellite Data
We used the location of Wee Wee Cay and our start and end dates. Our data were filtered to match the daily corresponding temp measurements at 0600 Hrs of the satellite. The satellite data from the 0.5 deg gridded SST measurements were from the Coral Reef Watch 5 km product suite and were downloaded from this site. https://coralreefwatch.noaa.gov/product/5km/index.php. (accessed on 1 December 2023).
3. Results
3.1. Ten Year Temperature Record
Seawater in situ temperatures measured in the shallow water lagoon habitat of Wee Wee Cay between December 2003 and March 2014 ranged from 22.3 °C to 32.4 °C (Figure 4). An increase in temperatures over time was detected (r2 = 0.015, p < 001).
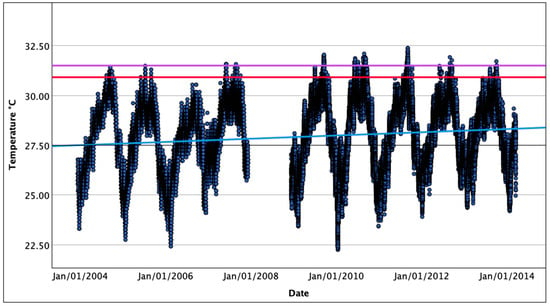
Figure 4.
Daily temperature record from Wee Wee Cay dock recorded every hour. Data began in December 2003 and continued until March 2014. Temperature logger was at mean 1.2 m depth, located on the lagoon side of the island. The linear regression for all data was r2 = 0.015; p < 0.001, shown as the blue line. The red line is the MMM (30.5 °C) or monthly mean maximum. We calculated MMM for WWD using the in situ data for December 2003 to March 2014, which yielded a MMM temperature of 30.93 °C during this baseline period. The purple line is MMM + 1 °C (31.5 °C) or the Bleaching threshold.
While both the maximum and minimum temperatures exhibited increasing trends during the sampled period, maximum temperatures increased at a rate of 0.0066 °C month−1 compared to 0.0038 °C month−1 for minimum temperatures (Figure 5).
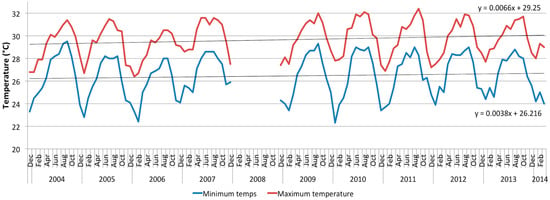
Figure 5.
Record of monthly maximum and minimum temperatures from Wee Wee Cay dock. Data began in December 2003 and continued until March 2014. Temperature logger depth was about 1.2 m depth (depending on tide), located on the western side of the island.
3.2. Temperature Record and Coral Bleaching
In the years when the temperature measurements spanned the summer months, in the years between 2007 and 2013, the bleaching threshold of 31.5 °C [10] was exceeded (Table 1). The number of days with temperatures exceeding the threshold ranged from 0 to 14 in 2010. September had the highest consecutive number of days exceeding the bleaching threshold. The bleaching thresholds were exceeded on over 10 days in 2010 and 9 days sequentially in 2011 (see Section 3.6).

Table 1.
Summary of months where seawater temperature at Wee Wee Cay exceeded the bleaching threshold of 31. 5 °C. Note: the 2008 logger was lost.
3.3. Mean Annual Temperatures
Mean annual temperatures at Wee Wee Cay ranged from a low of 27.2 °C in 2006 to 28.5 °C in 2007, with mean annual temperature increasing at a rate of 0.0805 °C year−1 within the sampled period (Figure 6).
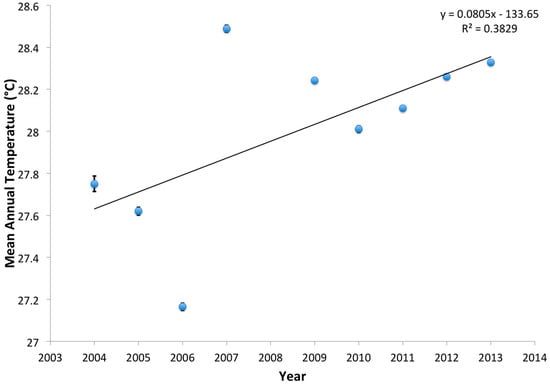
Figure 6.
Annual mean temperatures for Wee Wee Cay. Data values were only calculated for years with complete sampling. The slope is measured as change per month.
3.4. Mean Monthly Temperatures
Mean monthly temperatures at Wee Wee Cay were similar to temperatures at Carrie Bow Cay during 2004. However, Carrie Bow Cay temperatures had a greater range and were more variable. Monthly minimums at Carrie Bow Cay were lower and monthly maximums at Carrie Bow Cay were higher than temperatures at Wee Wee Cay. Wee Wee Cay daily temperatures ranged from 23.9 °C to 30.8 °C, while Carrie Bow Cay daily temperatures ranged from 22.9 °C to 32.6 °C (Table 2).

Table 2.
Comparison of mean monthly temperatures at Wee Wee Cay (WWC) and Carrie Bow Cay (CBC) during 2004. CBC data summarized from Carrie Bow Cay Environmental Monitoring System Archives (https://invertebrates.si.edu/CCRE/belize/) accessed on 1 November 2016). Minimum, maximum and range values have been round to the first decimal place to reduce table size.
The trend in mean monthly temperatures during the sampled period reflected a rate of increase of 0.0063 °C month−1 (Figure 7). This result can be compared to other studies in Belize during 1984–2003 which showed rates of increase from 0.0024–0.0028 °C month−1 (Table 3).
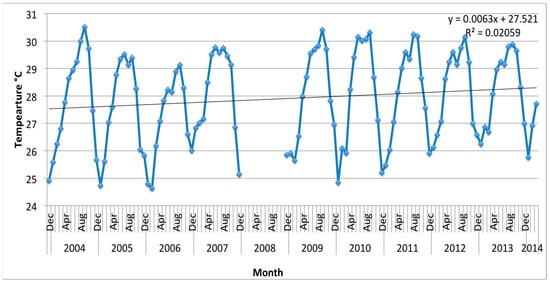
Figure 7.
The trend in mean monthly temperatures during the sampled period.

Table 3.
Trends in mean monthly sea surface temperatures (SSTs) reported in the literature.
3.5. Comparative Temperature at Different Depths
The temperature data reported in this study are from an average depth of 1.2 m. An example of how this station compares to the tide (in blue at top) and to temperatures at different depths from close adjacent sites over a 10-day period is shown in Figure 8. The hourly temperature variation was consistent at all sites and corresponded to the tide.
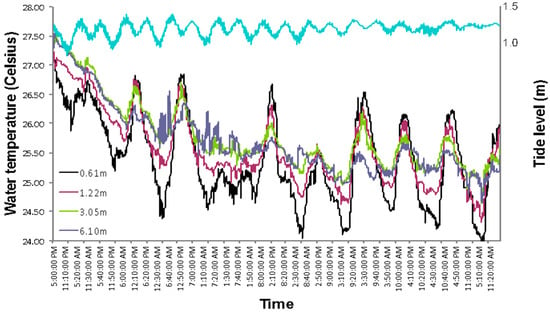
Figure 8.
Temperature and tide level data over a ten-day period (1 December to 10 December 2010) at Wee Wee Caye, Belize. Temperature data represent four loggers placed at increasing depth increments (0.61, 1.22, 3.05, 6.10 m), and tide data (in blue) were recorded from one logger at 1.2 m depth.
3.6. Comparative Temperature between Satellite Data and In Situ Logger
The temperature data in Figure 9 are matched to the time that the satellite acquired data (0600 Hrs local time). The degree heating weeks (DHW) are from the NOAA CRW website for the same time period at WWC lat/long. These values, in yellow, are directly from the CRW website https://coralreefwatch.noaa.gov/satellite/education/tutorial/crw24_dhw_product.php#:~:text=The%20units%20for%20DHW%20are,especially%20in%20more%20sensitive%20species, accessed on 1 December 2023.
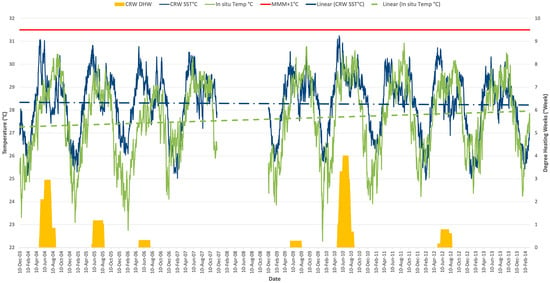
Figure 9.
The 10-year record at 0600 Hrs daily. The red line is the calculated MMM + 1 °C for WWC using the in situ data for December 2003 to March 2014, which yielded a MMM temperature of 30.5 °C and a MMM + 1 °C of 31.5 °C. The blue dashed line is linear relationship for CRW SST measurements (r2 = 0.001; p = 0.124) during our time period and the green dashed line is linear relationship for our in situ temp measurements (r2 = 0.016; p < 0.001). The degree heating weeks (DHW) are shown as yellow bar graphs along the x-axis.
Monthly mean SSTs were higher than in situ temperature measurements during Jan.–May and again in Oct.–Dec. During the summer months, the in situ temps were lower than the SSTs (Figure 10). The SSTs and in situ temperature data were correlated with a correlation coefficient of 0.668 (p < 0.001) but were significantly different (using a paired t-test). The mean difference between the measurements was 0.667 (p < 0.001). The significant threshold for severe coral bleaching is when the heat stress reaches four degree C-weeks (CRW website). In our 10-year dataset, the four-degree C-week was only reached once, during June–July 2010 (Figure 9).
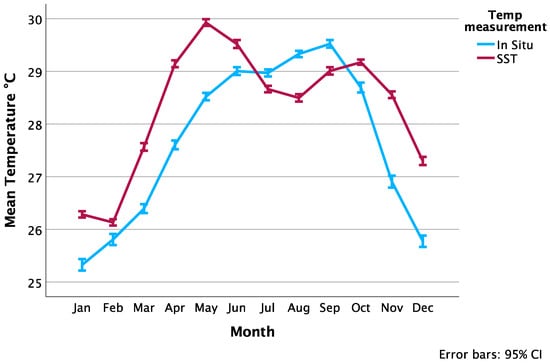
Figure 10.
The 10-year in situ record compared to SST showing the monthly means. Each point is 9 years of data for each month with 95% CI. The mean difference between the measurements was 0.667 (p < 0.001).
4. Discussion
This study contributes an additional set of in situ seawater temperature measurements for the Belize Barrier Reef Lagoon. The closest in situ environmental monitoring location to this station is the Smithsonian Institution’s Environmental Research Laboratory on Carrie Bow Cay, 7 km to the east and located on the barrier reef crest, which is exposed to the open ocean. Ocean temperatures for 2004 at Carrie Bow Cay (https://invertebrates.si.edu/CCRE/belize/ accessed on 1 November 2016) were more variable and had a greater range than those found at Wee Wee Cay for that same year. Water temperatures at Carrie Bow exceeded the bleaching threshold 108 days as compared to 30 days at Wee Wee Cay in 2004. These extreme temperatures may result from the shallow depth of the environmental monitoring system at Carrie Bow Cay (between 0.2–0.5 m) as compared to the 1.2 m to 2.5 m depth of the logger at Wee Wee Cay. Another study collected data at four sites in Belize and deposited the datasets online, but without analyses [11]. Our in situ data were higher than the SST data overall except for the summer months July, August, and September when satellite SSTs were lower than in situ measurements. Comparative results from other studies found that SSTs were lower than in situ temperatures [12,13]. The key point is that the satellite data do not match temperature data at the depths where corals are growing. This demonstrates a need for a better ground-truth network of underwater loggers. A consideration for future researchers deploying temperature loggers is to standardize the depth of the logger stations to provide better comparability of the data from different locations. Atmospheric weather station data also obtained on site would be valuable.
Four mass coral bleaching events have impacted Belize: 1995, 1998 and 2005 [14], with an additional widespread southern Caribbean event during 2010 [15]. Bleaching in Belize was reported in 2010 [16]. Satellite SST data show that the shallow reefs of the Belize Reef system were exposed to temperatures above the estimated by [10] regional bleaching threshold of 29.7 °C for between 54 and 78 days per year between the years 2003–2012 [8]. Following these bleaching events there has been a dramatic decrease in some corals [10,14]. The DHW in 2010 (Figure 9) corresponds to bleaching observed in the region [15]. The combination of rising ocean temperatures and local stressors including pollution and habitat destruction are impacting Belize reef corals throughout the BBR [8,16].
Annual mean temperatures are increasing at a rate of 0.0805 °C year−1 as compared to Intra Atlantic regional satellite derived estimates of 0.015 °C year−1 measured between 1982–2012 [17], suggesting that warming is occurring much faster in Belize. Additionally, warming trends based on monthly means between 1984 and 2003 in three regions in Belize ranged from 0.0024 °C to 0.0028 °C month−1 [18]. The data from Wee Wee Cay from 2003 to 2014 showed an increase in temperature of 0.0063 °C month−1, suggesting a greater rate of warming here than other regions inside the Belize Barrier Reef lagoon.
This study revealed increasing lagoon water temperatures over the course of 10 years. It adds a point of comparison for other sites in Belize (e.g., [3,8,12,13,16,19]) and elsewhere in the Western Caribbean region (e.g., [5]). Temperatures were more variable and higher inside the lagoon than at the nearby reef crest of Carrie Bow Cay). Belize had escaped severe impact from bleaching events until the 1997/1998 El Niño warming event. The subsequent bleaching and mortality from this event were unprecedented during the previous 3000 years [20,21]. During the 1998 year, the bleaching threshold was only exceeded on four days at Carrie Bow Cay [10]. Within the Wee Wee Cay time series presented here, bleaching thresholds were exceeded for more than two or three sequential weeks in five of the ten years studied. The data from this study show a higher number of days in which temperatures exceeded the bleaching threshold as compared to neighboring stations. However, even though temperatures exceeded bleaching thresholds for extended periods during multiple years and the DHW threshold of 4 in year 2010, local corals have survived. Suggesting that these specific coral colonies represent phenotypes adapted to these extremes and would be good targets for future study.
Increasing temperature is accompanied by a decrease in dissolved oxygen in the water. This causes an increased respiratory and metabolic demand on larger fishes, which might suffer more than smaller fishes. Overall, much more is known about the thermal tolerances of coral species than of fishes. Thermal tolerance has been defined for only one Belizean fish, Elacatinus lobeli [22,23]. The range in thermal response among different organisms can shift the species structure when temperatures increase, as shown for algae and corals [24]. The data in this study add to the documentation of the impacts of coral bleaching and pollution in the waters around Belize. Ecosystem shifts and species extinctions have been recognized in Belize [2,3,8,9,10,16,19,20,25].
As with coral species, some fishes may also be better adapted to the warmer conditions than their congeners [22,23]. However, there are other species that may be less tolerant of the broad impacts of climate change inside the Belize Barrier Reef (BBR). Several fish species have populations that are either endemic or most highly concentrated within the BBR including several recently described species, such as those shown in Figure 11 [6]. These species are all restricted to the Gulf of Honduras. The conservation status of these fishes has been documented on the IUCN Red List of Threatened species [26,27,28,29]. These species are at risk of extinction from climate change impacts such as warming water, which results in coral bleaching and overall degraded water conditions. Halichoeres socialis [30] and Hypoplectrus maya [31] are currently listed as endangered, and Elacatinus lobeli [32] is listed as near threatened (www.iucnredlist.org accessed on 1 September 2023). The hamlet fish, Hypoplectrus maya, is endemic to the Belize lagoon and is only found inside the Belize barrier reef [6,31,33]. The wrasse, Halichoeres socialis, is found only inside the BBR and along the Honduran coastal reefs but not on the outer open ocean atolls [34]. The Belize Reef system, and especially its huge lagoon, have unique marine ecological habitats that support a regional fauna, with many species being adapted to this particular environment. Oceanographic conditions in this region should be monitored and the reef-animal populations carefully surveyed to assess changes in fisheries and the coral reefs (e.g., as nicely exemplified by [12,19]).
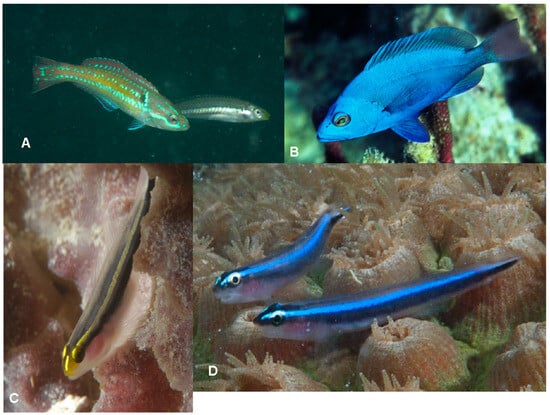
Figure 11.
Recently discovered Gulf of Honduras fishes include: (A) Halichoeres socialis Randall & Lobel 2003 (Labridae), (B) Hypoplectrus maya Lobel 2011 (Serranidae), (C) Elacatinus coloni Randall & Lobel 2009 (Gobiidae), and (D) Elacatinus lobeli Randall & Colin 2009 (Gobiidae). Photos by P.S. Lobel.
5. Conclusions
The temperature of the ocean is rising, but long-term data sets are lacking. More long-term monitoring stations are needed on coral reefs to document both spatial and temporal trends. Monitoring stations should be set at a standard depth for easy and direct comparisons with satellite-derived data. Corals are well studied in terms of their temperature tolerance and resiliency. However, similar studies on fishes and other macro-invertebrates are few, and thus the impacts of global warming are not yet well defined. The Belize lagoon is an especially sensitive aquatic system that should have a series of oceanographic monitoring stations to track environmental changes. Such data will have important applications in the management of local fisheries and tourism.
Supplementary Materials
The following supporting information can be downloaded at: https://www.mdpi.com/article/10.3390/d16010057/s1, Table S1: The 10-year dataset.
Author Contributions
P.S.L. and L.K.L. contributed equally to this study. All authors have read and agreed to the published version of the manuscript.
Funding
This project was supported by the Coral Reef Fish field course, Boston University Marine Program.
Data Availability Statement
Data are contained within the article or supplementary material. The 10-year dataset is in Supplementary Material Table S1.
Acknowledgments
We thank the staff of the Wee Wee Cay Marine Lab and the teaching assistants and students in the BUMP field courses for their help over the years.
Conflicts of Interest
The authors declare no conflicts of interest.
References
- Hoegh-Guldberg, O. Climate change, coral bleaching and the future of the world’s coral reefs. Mar. Freshw. Res. 1999, 50, 839–866. [Google Scholar] [CrossRef]
- Wilkinson, C.; Souter, D. Status of Caribbean Coral Reefs after Bleaching and Hurricanes in 2005; Global Coral Reef Monitoring Network, and Reef and Rainforest Research Centre: Townsville, Australia, 2008; 152p. [Google Scholar]
- Castillo, K.D.; Ries, J.B.; Weiss, J.M.; Lima, F.P. Decline of fore reef corals in response to recent warming linked to history of thermal exposure. Nat. Clim. Chang. 2012, 2, 756–760. [Google Scholar] [CrossRef]
- Walker, Z. South Water Cay Reserve Management Plan 2010–2015; Wildtracks Report; WildTracks: La Isla Rd, Belize, 2009; 270p. [Google Scholar]
- Chollett, I.; Mumby, P.J.; Müller-Karger, F.E.; Chuanmin, H. Physical environments of the Caribbean Sea. Limnol. Oceanogr. 2012, 57, 1233–1244. [Google Scholar] [CrossRef]
- Lobel, P.S.; Lobel, L. Endemic marine fishes of Belize: Evidence of isolation in a unique ecological region. In Too Precious to Drill: The Marine Biodiversity of Belize; Palomares, M.L.D., Pauly, D., Eds.; Fisheries Centre Research Reports; Fisheries Centre, University of British Columbia: Kelowna, BC, USA, 2011; Volume 19, pp. 48–51. [Google Scholar]
- Smale, D.A.; Wernberg, T. Satellite-derived SST data as a proxy for water temperature in nearshore benthic ecology. Mar. Ecol. Prog. Ser. 2009, 387, 27–37. [Google Scholar] [CrossRef]
- Baumann, J.H.; Townsend, J.E.; Courtney, T.A.; Aichelman, H.E.; Davies, S.W.; Lima, F.P.; Castillo, K.D. Temperature regimes impact coral assemblages along environmental gradients on lagoonal reefs in Belize. PLoS ONE 2016, 11, e0162098. [Google Scholar] [CrossRef] [PubMed]
- Koltes, J.H.; Opishinski, T.B. Patterns of water quality and movement in the vicinity of Carrie Bow Cay, Belize. Smithson. Contrib. Mar. Sci. 2009, 38, 379–390. [Google Scholar]
- Aronson, R.; Precht, W.; Toscano, M.; Koltes, K. The 1998 bleaching event and its aftermath on a coral reef in Belize. Mar. Biol. 2002, 141, 435–447. [Google Scholar]
- Helmuth, B.; Leichter, J.J.; Rotjan, R.D.; Castillo, K.D.; Fieseler, C.; Jones, S.; Choi, F. High resolution spatiotemporal patterns of seawater temperatures across the Belize Mesoamerican Barrier Reef. Sci. Data 2020, 7, 396. [Google Scholar] [CrossRef]
- Greer, L.; Curran, H.A.; Wirth, K.; Humston, R.; Johnson, G.; McManus, L.; Stefanic, C.; Clark, T.; Lescinsky, H.; Forman-Castillo, K. Coral Gardens Reef, Belize: An Acropora spp. Refugium under threat in a warming world. PLoS ONE 2023, 18, e0280852. [Google Scholar] [CrossRef]
- Castillo, K.D.; Lima, F.P. Comparison of in situ and satellite-derived (MODIS-Aqua/Terra) methods for assessing temperatures on coral reefs. Limnol. Oceanogr. Methods 2010, 8, 107–117. [Google Scholar] [CrossRef]
- McField, M.; Bood, N.; Fonseca, A.; Arrivillaga, A.; Franquesa Rinos, A.; Loreto Viruel, R. Status of the Mesoamerican Reef after the 2005 coral bleaching event. In Status of Caribbean Coral Reefs after Bleaching and Hurricanes in 2005; Wilkinson, C., Souter, D., Eds.; Global Coral Reef Monitoring Network, and Reef and Rain- Forest Research Centre: Townsville, Australia, 2005; pp. 45–60. [Google Scholar]
- Alemu, I.; Clement, J.B.; Mass, Y. Coral Bleaching in 2010 in the Southern Caribbean. PLoS ONE 2014, 9, e83829. [Google Scholar] [CrossRef] [PubMed]
- Baumann, J.H.; Ries, J.B.; Rippe, J.P.; Courtney, T.A.; Aichelman, H.E.; Westfield, I.; Castillo, K.D. Nearshore coral growth declining on the Mesoamerican Barrier Reef System. Glob. Chang. Biol. 2019, 25, 3932–3945. [Google Scholar] [CrossRef] [PubMed]
- Glenn, E.; Comarazamy, D.; González, J.E.; Smith, T. Detection of recent regional sea surface temperature warming in the Caribbean and surrounding region. Geophys. Res. Lett. 2015, 42, 6785–6792. [Google Scholar] [CrossRef]
- Hayes, R.L.; Goreau, T.J. Satellite-derived sea surface temperature from Caribbean and Atlantic coral reef sites, 1984–2003. Rev. Biol. Trop. 2008, 56 (Suppl. S1), 97–118. [Google Scholar] [CrossRef][Green Version]
- Alves, C.; Valdivia, A.; Aronson, R.B.; Bood, N.; Castillo, K.D.; Cox, C.; Fieseler, C.; Locklear, Z.; McField, M.; Mudge, L.; et al. Twenty years of change in benthic communities across the Belizean Barrier Reef. PLoS ONE 2022, 17, e0249155. [Google Scholar] [CrossRef]
- Aronson, R.B.; Precht, W.F.; MacIntyre, I.G.; Murdock, T.J.T. Coral bleach-out in Belize. Nature 2000, 405, 36. [Google Scholar] [CrossRef]
- Peckol, P.M.; Curran, H.A.; Floyd, E.Y.; Robbart, M.L.; Greenstein, B.J.; Buckman, K.L. Assessment of selected reef sites in Northern and Southern Belize, including recovery from bleaching and hurricane disturbances (Stony corals, algae and fish). In J.C. Lang (ed.), Status of coral reefs in the western Atlantic: Results of initial Surveys, Atlantic and Gulf Rapid Reef Assessment (AGRRA) Program. Atoll Res. Bull. 2003, 496, 146–171. [Google Scholar]
- Di Santo, V.; Lobel, P.S. Size affects digestive responses to increasing temperature in fishes: Physiological implications of being small under climate change. Mar. Ecol. 2016, 37, 813–820. [Google Scholar] [CrossRef]
- Di Santo, V.; Lobel, P.S. How to beat the heat: Body size affects thermal tolerance in tropical gobies. J. Expl. Mar. Biol. Ecol. 2017, 487, 11–17. [Google Scholar] [CrossRef]
- Anton, A.; Randle, J.L.; Garcia, F.C.; Rossbach, S.; Ellis, J.I.; Weinzierl, M.; Duarte, C.M. Differential thermal tolerance between algae and corals may trigger the proliferation of algae in coral reefs. Glob. Chang. Biol. 2020, 26, 4316–4327. [Google Scholar] [CrossRef]
- McField, M.D. Coral response during and after mass bleaching in Belize. Bull. Mar. Sci. 1999, 64, 155–172. [Google Scholar]
- Pezold, F.; van Tassell, J.; Tornabene, L.; Aiken, K.A. Elacatinus lobeli. The IUCN Red List of Threatened Species. 2015. Available online: https://www.iucnredlist.org/species/187435/46944387 (accessed on 1 November 2016).
- van Tassell, J.; Pezold, F.; Tornabene, L.; Aiken, K.A.; Bouchereau, J.-L. Elacatinus colini. The IUCN Red List of Threatened Species. 2015. Available online: https://www.iucnredlist.org/species/187435/46944387 (accessed on 1 November 2016).
- Rocha, L.A. Halichoeres socialis. The IUCN Red List of Threatened Species. 2015. Available online: https://www.iucnredlist.org/species/187435/46944387 (accessed on 1 November 2016).
- Moran, B.; Puebla, O. Hypoplectrus maya. The IUCN Red List of Threatened Species. 2020. Available online: https://www.iucnredlist.org/species/187435/46944387 (accessed on 1 November 2016).
- Randall, J.E.; Lobel, P.S. Halichoeres socialis, a new labrid fish from Belize, Caribbean. Copeia 2003, 2003, 124–130. [Google Scholar] [CrossRef]
- Lobel, P.S. A review of the hamlets (Serranidae, Hypoplectrus) with description of two new species. Zootaxa 2011, 3096, 1–17. [Google Scholar] [CrossRef]
- Randall, J.E.; Colin, P.L. Elacatinus lobeli, a new cleaning goby from Belize and Honduras. Zootaxa 2009, 2173, 31–40. [Google Scholar] [CrossRef]
- Moran, B.M.; Hench, K.; Waples, R.S.; Höppner, M.P.; Baldwin, C.C.; McMillan, W.O.; Puebla, O. The evolution of microendemism in a reef fish (Hypoplectrus maya). Mol. Ecol. 2019, 28, 2872–2885. [Google Scholar] [CrossRef]
- Sun, Z.X.; Lobel, P.S. Pelagic larval duration of the Meso-American reef fish, Halichoeres socialis (Labridae). Environ. Biol. Fishes 2023, 106, 1971–1982. [Google Scholar] [CrossRef]
Disclaimer/Publisher’s Note: The statements, opinions and data contained in all publications are solely those of the individual author(s) and contributor(s) and not of MDPI and/or the editor(s). MDPI and/or the editor(s) disclaim responsibility for any injury to people or property resulting from any ideas, methods, instructions or products referred to in the content. |
© 2024 by the authors. Licensee MDPI, Basel, Switzerland. This article is an open access article distributed under the terms and conditions of the Creative Commons Attribution (CC BY) license (https://creativecommons.org/licenses/by/4.0/).