Abstract
An amplicon-based metagenomic survey of archaea, fungi, and bacteria was performed on Livingston Island, Maritime Antarctica. In many of the samples, patterns of antagonism between these three superkingdoms were observed in the form of an inversely proportional dependence of the richnesses of the three types of microorganisms. The antagonism was quantified—based on the observed numbers of the total tags and the numbers of the operational taxonomic units (OTUs), and on four alpha diversity parameters—using the Shannon, the Simpson, the Chao1, and the ACE indices. We found that the most discriminative results in the antagonism measuring were obtained when the numbers of the OTUs and the ACE community richness estimator were compared. The antagonism between archaea and fungi was most potent, followed by that of archaea and bacteria. The fungi–bacteria antagonism was slightly detectable. Pearson and Spearman correlation analyses also showed a statistically significant negative correlation between the fungal and archaeal effective tags, while the correlation between archaeal and bacterial diversity was positive. Indications of the order of primary microbial succession in barren ecological niches were also observed, demonstrating that archaea and bacteria are the pioneers, followed by fungi, which would displace archaea over time.
1. Introduction
Despite being isolated, remote, and challenging to access because of its geographic position and characteristics, Antarctica can be considered a major climate generator [1]. Microorganisms are the few life forms that can survive in the Antarctic harsh terrestrial environments. They also form the major component of the biomass within the water ecosystems, where they are also the leading role-player in energy flow and substances circulation [2,3]. Antarctic microorganisms possess specific adaptations, allowing them to survive in these challenging environments [4,5]. However, these adaptations render them susceptible to environmental changes, thereby emphasizing the need to investigate them further.
The total number of bacterial and archaeal cells on earth is estimated to be around 1.2 × 1030, distributed in five major habitats: the deep oceanic subsurface, the upper oceanic sediment, the deep continental subsurface, soil, and oceans [6]. There are no such quantitative estimations for fungi, probably because they can exist in unicellular and multicellular forms. However, they also represent a substantial percentage of the earth’s biomass—12.7% [7]—and show tremendous species diversity and functional roles in almost all ecosystems [8]. Still, with very few exceptions [9], the mutual ecological relationships between these three domains of microorganisms as a whole are poorly investigated. Even with the advent of NGS-based metagenomics, most studies focus on research within a single domain in a given ecological niche [2,3].
Unfortunately, Antarctic microbial communities are still poorly studied. However, this task became more feasible with the advances of the next-generation sequencing (NGS)-based metagenomics techniques. Some good examples of such metagenomic studies are the works of Picazo et al., Kim et al. [3], Coleine et al. [10], and Fernández et al. [11]. Yet, the focus of these studies was not on the existing relationships between these three domains.
In January–February 2022, during the 30th Bulgarian polar expedition to Livingston Island (South Shetland Islands, Maritime Antarctica), one of the research projects that members of the team worked on was focused on the taxonomical characterization of some soil and water microbial ecosystems. The main goal of the Antarctic expedition was to investigate the microbial species composition. However, when we first saw the results of the metagenomic sequencing statistics, it became evident that patterns of antagonisms between the super domains should exist, and thus we decided to investigate them in this work. The microbiotas of submerged microbial mats of rocks and algae, sediments, soils, biomass sludges from ice-melting ponds, lithotelms and glacial lakes (tarns), fresh waters, and marine waters (Table 1) were investigated with the means of amplicon-based metagenomics. We were surprised to find low archaeal richness, as well as an inversely proportional dependence between the richesses of archaea and fungi, and to a lesser extent between bacteria and archaea, and fungi and bacteria. Even though an antagonism between bacteria and fungi has been reported for agricultural soils [9], no data were available for the Arctic and the Antarctic regions, so we decided to investigate these domains’ patterns of antagonism, which could be related to and/or be more acute in the harsh and in most cases oligotrophic Antarctic environment. We hypothesized that in these inhospitable environments, the different life domains as a whole should probably be concurrent for the occupations of the ecological niches. Because we could not find similar studies within the scientific literature, we decided to quantify these antagonistic patterns based on some of the metagenomic sequencing data parameters and not to put the focus on species or higher taxonomic rank levels.

Table 1.
Sampling sites.
2. Materials and Methods
2.1. Sampling Sites and Sampling Methods
During the Antarctic research season of 2021–2022, four water and fourteen solid samples were collected around the Bulgarian Polar Base. All sampling sites are listed in Table 1 and are located around the Bulgarian Antarctic Base “St. Kliment Ohridski” on Livingston Island, Maritime Antarctica (Figure 1). For the solid samples, 150–250 mg of sludge biomass or sediment was collected in as much as possible sterile conditions with a sterile spatula and put into sterile Eppendorf tubes. For the water samples, 2 L of water was collected in unused plastic bottles, which were washed three times with the water of the sampling site before the collection. All samples were transported to the research station, and DNA was obtained immediately after.
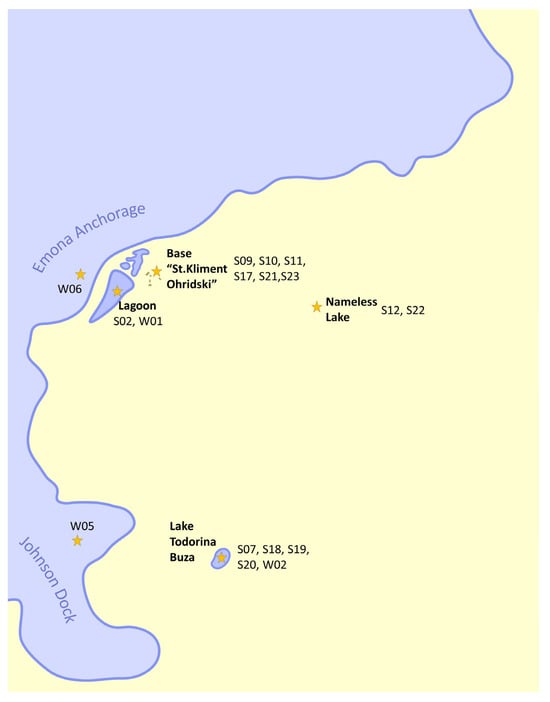
Figure 1.
Map of the sampling sites around the Bulgarian Antarctic base “St. Kliment Ohridski”. Hannah Point is not shown, being on the other side of the South Bay.
2.2. DNA Extraction
Total DNA from the samples was isolated just after the collection to reduce to a minimum the possible shifts in the microbial compositions. For the solid samples, the extraction was performed using the ZR Soil Microbe DNA MiniPrep Kit (Zymo Research Corp., Irvine, CA 92614, USA) according to the manufacturer’s instructions manual. For the water samples, two liters of the water were filtered through a 0.2 µm filter, and then the biomass was washed off with 700 µL of the ZR Soil Microbe DNA MiniPrep Kit’s bashing beads buffer. The eluted biomass was transferred within the kit’s bashing beads tubes and further processed as for the solid samples. The final elution step was performed in 50 µL of the provided elution buffer. Two microliters of the eluted DNA were used to determine the concentration on a Quantus Fluorimeter (Promega Corp., Madison, WI 5371, USA). The eluted DNA samples were kept and transported at −20 °C.
2.3. Metagenomic Sequencing
The extracted DNA was shipped on dry ice to the Novogene Company Ltd. (Cambridge, UK) for sequencing on the Illumina HiSeq 2 × 250 paired-end reads platform. The V3–V4 region of the genes encoding the 16S rRNA was chosen for the amplification of eubacterial 16S rRNA with primers 341F (5′-CCTAYGGGRBGCASCAG-3′) and 806R (5′-GGACTACNNGGGTATCTAAT-3′). For fungi, the ITS2 region was amplified using primers ITS3-2024F (5′-GCATCGATGAAGAACGCAGC-3′) and ITS4-2409R (5′-TCCTCCGCTTATTGATATGC-3′), while for archaea the V4–V5 16S rRNA region was amplified using primers Arch519F (5′- CAGCCGCCGCGGTAA-3′) and Arch915R (5′- GTGCTCCCCCGCCAATTCCT-3′). The sequencing was performed to generate 30,000 tags per sample. Novogene Company LTD performed the primary bioinformatic processing.
2.4. Data Processing and Operational Taxonomic Units (OTUs) Analyses
The raw files generated from the NGS platform were first subjected to demultiplexing and trimming. Next, the FLASH V1.2.7 software tool [12] was used to merge the paired-end reads. The raw tags quality filtering was performed according to Bokulich et al. [13] and Caporaso et al. [14]. The UCHIME algorithm was used to detect chimera sequences by comparing the tags with the reference database [15]. The effective tags were obtained by removing the chimera sequences, according to Haas et al. [16]. The Uparse v7.0.1001 software [17] was used to assign the effective tags with ≥97% similarity into OTUs. For species annotation at each taxonomic rank, each eubacterial and archaeal representative sequence was compared against the SSUrRNA Database of the SILVA138 Database using the Mothur software V1.48.0 [18,19]. For fungi, the comparison was performed again using the Mothur software against the Unite V8.2 database [20]. The alpha diversity analysis was estimated based on the community richness index using the Chao1 estimator [21] and the ACE estimator [22,23]. Community diversity was assessed using the Shanon and Simpson indices [24,25]. Rarefaction curves were constructed to assess the reliability of the data obtained [26].
2.5. Antagonism Analyses and Relative Measuring
The mean values of the number of total tags, number of OTUs, and Shannon, Simpson, Chao1, and ACE indices were calculated. Each sample was attributed to “+” or “−“ depending on whether its own value was greater or lesser than the mean value for the given type of microorganisms. The relative values were used as indicators to interpret possible antagonisms. Then, the three types of binome antagonism indicators in each sample were relatively quantified as the sums of the cases where a discrepancy was observed between the two compared types of microorganisms.
2.6. Pearson and Spearman Correlation Analyses
Pearson and Spearman correlation analyses were performed between the three groups of microorganisms for each alpha diversity metric, as well as for the effective tags. For testing the statistical significance of the results regarding the community as a whole, a significance threshold of p = 0.05 was chosen. Pearson correlation assesses the presence of a linear correlation between two variables with normal distribution, while Spearman correlation assesses the presence of a monotonic relationship. These values range from −1 for the presence of a high negative correlation, to 0 for the absence of a correlation, and to 1 for the presence of a high positive correlation.
3. Results
3.1. Sequencing Statistics and Alpha Diversity Indices
The numerical values of the amplicon-based sequencing statistics and calculated alpha diversity indices are presented in Table 2, where the average values of each index in the three types of microorganisms are calculated in the last row. The rarefaction curves of each sample are shown in Figure 2.
Table 2.
Sequencing statistics and alpha diversity index values.
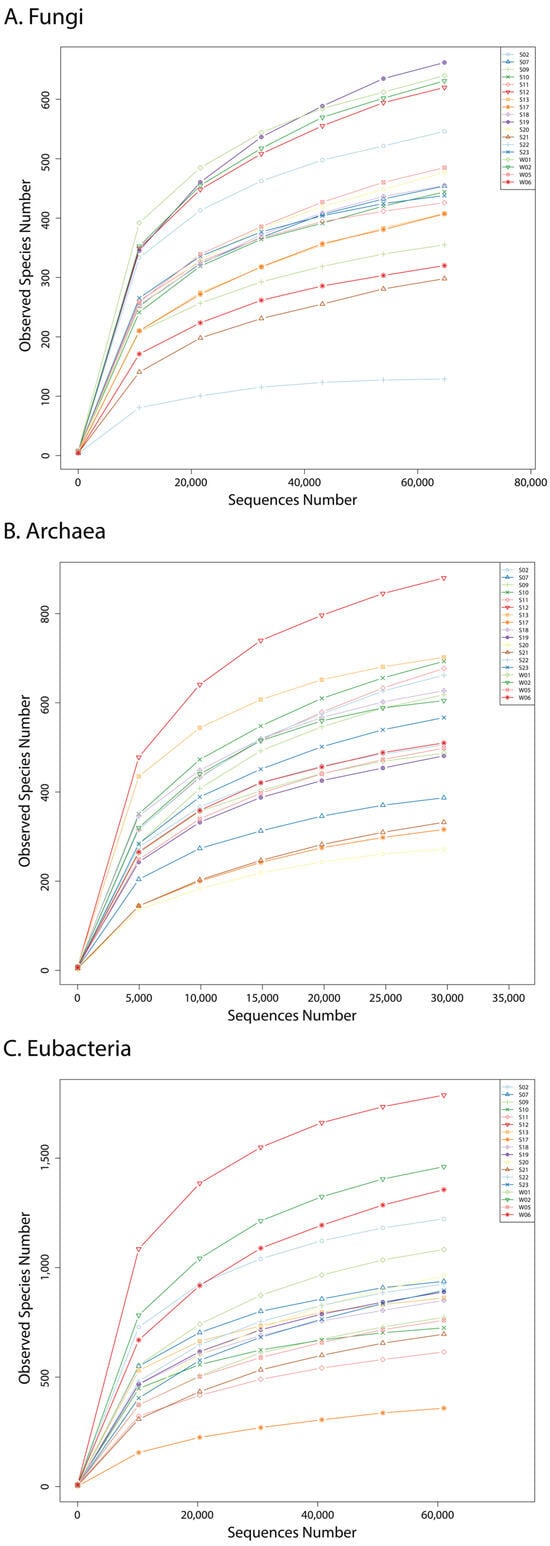
Figure 2.
Rarefaction curves of fungi (A), archaea (B), and bacteria (C) in the samples.
3.2. Antagonism Assessment
The numerical values for each index (i.e., the number of total tags, the number of OTUs, and the Shannon, Simpson, Chao1, and ACE indices) in each sample are presented as bar histograms regarding the mean values in Figure 3. To ease the interpretation of the results, each sample was attributed to “+” if it was more significant than the mean value or “−” if it was less significant than the mean value (Table 3). A summarization of the cases of discrepancies is presented in Table 4 as total numbers as well as percentages.
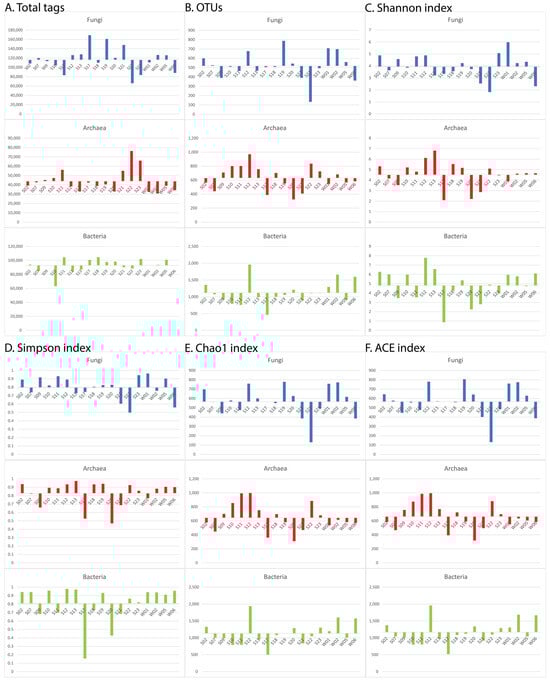
Figure 3.
Discrepancies between the three domains in the observed numbers of the total tags (A), and OTUs (B), as well as in the calculated Shannon (C), Simpson (D), Chao1 (E), and ACE (F) alpha diversity community richness estimators.
Table 3.
Comparisons matrix based on the greater or lesser value with regard to the mean value of the indices.
Table 4.
Discrepancies between the three microorganisms’ domains in the 18 samples included within this study.
Pearson linear correlation showed a statistically significant negative correlation between the effective tags of archaea and fungi but not between any of the other metrics (Table 5). On the other hand, a very high positive correlation was shown between archaea and bacteria regarding both the Simpson and Shannon diversity indices.
Table 5.
Pearson and Spearman correlation coefficients between the different groups of microorganisms. Statistically significant correlations using a significance level of 0.05 are marked with “*”.
4. Discussion
Since we observed negatively correlating alpha diversity indices of the different biotas, we hypothesized that they could witness patterns of antagonistic relationships. Although the microbiotas’ compositions are strongly influenced by environmental factors that were investigated previously [2,3] and could impact the patterns we observed, the main objective of this study was to investigate these antagonistic patterns by making a snapshot picture. Unfortunately, wholistic studies of the superkingdoms’ antagonisms, which could help us to compare our findings, are practically absent. The only exception was the study of Li et al., which dealt with the antagonisms between bacteria and fungi in agricultural soils [9].
The obtained data were considered reliable and informative due to the slopes of the rarefaction curves, which reached a plateau (Figure 2), meaning that the data were representative [27]. However, two observations came into our sight before the in-depth analysis of the sequencing data. First, the number of the archaea as total tags was much lower than those of fungi and bacteria. Second, the archaeal alpha diversity indices (Shannon, Simpson Chao1, and ACE) were from the same order as those of the two other studied domains, meaning comparable species richnesses in all three superkingdoms (Table 2) [27]. These two observations suggest that the presence of archaeal cells within the samples was significantly lower in number compared to bacterial and fungal cells despite all three kingdoms exhibiting similar levels of richness.
One of the most probable explanations of this disparity is the assumption that some antagonism between archaea and the other two domains should exist, in turn probably caused by the harsh, and in some cases oligotrophic, Antarctic conditions. We opted to assess this antagonistic relationship straightforwardly—by comparing binomial pairs. Specifically, we examined how frequently, in a given set of samples, one domain exhibited a higher representation than the average while the other domain showed a lower representation than the average. These results, graphically presented in Figure 3, were difficult to quantify, so a simpler comparison matrix composed of only “+” and “−” was constructed (Table 3) which in turn was used in our quantitative analysis of the antagonism relationships (Table 4).
The number of the total tags, which represents the number of effective tags after merging and filtering the sequencing reads, is the most informative parameter because it directly reflects the distribution of the number of the sequenced DNA molecules within the sample. These patterns of antagonism were observed in 10 of 18 cases (56%) in all three binomial comparison groups: fungi vs. archaea, fungi vs. bacteria, and archaea vs. bacteria.
The next analyzed parameter was the number of OTUs in each sample. Analyzing the OTU numbers has the advantage of reflecting the taxonomic groups [28]. In this case, the discrepancy between archaea and fungi was more distinct—it was observed in two thirds of all samples and even more in the water samples—in three fourths of the cases (the two seawater samples and one of the freshwater samples). Concerning the binome fungi–bacteria, the discrepancy was less distinct than in the case of the total number of the tags (in only 44% of the samples), while between archaea and bacteria, discrepancies were observed within the same percentage as within the total number of the tags.
No such clear tendencies could be observed in the four observed alpha diversity indices. Still, in our opinion, they should also be considered because they reflect the microbial communities’ structures. The observed discrepancies in all three binomes concerning the Shanon and the Simposon indices varied between 17% and 50%. Both are used as estimators of the species’ richness and evenness, so the low percentages could be explained by the high OTU values for the three domains within the analyzed samples. On the other hand, more interesting results were obtained for the abundance-based Chao1 and the ACE richness estimators [21,22,23].
Regarding the Chao1 index, a discrepancy in more than 50% of the cases was observed only for the binome archaea–bacteria. This observation can be explained by the fact that this index is based on the singletons and the doubletons, thus estimating the “missed” species [27], bacteria being essentially the most species-abundant superkingdom according to our own observations. On the other hand, discrepancies in the ACE indices in 56% and 61% of the cases were observed, respectively, for the binomes fungi–archaea and archaea–bacteria. This tendency corresponds more to those observed for the numbers of the total tags and OTUs because the ACE richness estimator considers both abundant and rare species and thus should be more informative when domains’ antagonisms are investigated.
The presence of a moderate, negative correlation between the effective tags of fungi and archaea, coupled with the lack of such a distinct correlation in the rest of the metrics, hints at a possible explanation for these results. First, it is essential to note that the effective tags represent the sequencing reads before they are grouped into OTUs based on a 97% similarity threshold. If the majority of the effective tags that are associated with the presence of a correlation between two groups is also assigned to a small number of OTUs, it is most likely that any potential interactions are limited within a subset of the species in the sample, and thus will not be as apparent in the alpha diversity metrics. On the other hand, if no correlation is observed between the number of effective tags, yet such a correlation is present within the alpha diversity metrics, this could point to a large number of species contributing to the interaction. We see a similar trend in some of the interactions between archaea and bacteria, where a very high correlation follows the lack of correlation in effective tags in diversity.
Additionally, it is crucial to outline that the samples represent vastly different ecological niches, encompassing sediment, salt water, fresh water, sludge biomass, and mat samples. In fact, roughly half of the samples are from a type of mat. Thus, the correlation results will inevitably be skewed in favor of the specific interactions within those types of communities. The annotated taxonomy, which is not included in this paper, also points to the existence of microbial profiles that are specific to each sampling location. Hence, the interactions that take place on the scale of the sampling locations will inevitably overlap with the presence of any macro-scale interactions that could be attributed to the Antarctic climate. However, due to the lack of samples for a larger number of the sampling sites, it is difficult to exclude them from the dataset without compromising how representative the sample is of the Antarctic community on Livingston Island as a whole.
An interesting case is sample S22, obtained from a microbial mat on a submerged rock in the new nameless tarn located several hundred meters northeast of the Bulgarian Polar Base “St. Kliment Ohridski.” This sample was the only one where the numbers of the total tags and the OTUs in archaea exceeded those of fungi and approached those of bacteria. More interestingly, the number of the archaeal total tags was about 16% greater than the fungal one. However, the archaeal OTUs were more than six times more numerous than the fungal ones. Not surprisingly, the greatest Chao1 and ACE community richness estimators among archaea were observed in this sample compared to all other samples we analyzed. Still, it is worth noting that this tarn was formed only very recently. During the last pre-COVID-19 Bulgarian Antarctic expedition in 2018–2019, a permanent glacier existed in its location, and the tarn was discovered only during the 2020–2021 expedition when the scientists returned to the Bulgarian Polar Base (the 2019–2020 expedition being only logistical for base maintenance). Thus, we cannot say if the glacier retracted to form the tarn one or two years before the sample was taken off, but indeed, this tarn represents a very new ecosystem. This fact makes plausible the speculation of primary succession of the superkingdoms in newly colonized areas. It has been observed that microorganisms are the first colonizers after the receding glaciers in the mountains [29], so it is logical that the same process occurs in Antarctica. Unfortunately, the primary microbial succession in barren lands and other ecological niches is poorly investigated [30]. According to our hypothesis, archaea and bacteria are the first, while more time is needed for fungi to colonize the new environment. If this hypothesis is true, it would explain why in the “old” ecological niches in our study, fungi generally dominated over archaea. Despite there being no data about the shifting of the archaeal communities within the deglaciated areas, studies on the bacterial and fungal communities in these areas show a more rapid shifting for the bacterial communities [31]. Although there are no reports on microbial successions in newly formed Antarctic tarns, significant and distinct changes in edaphic and lithic bacterial and fungal communities associated with soil development and cryptogamic colonization were reported [32]. These observations could explain our observations; however, at this stage of research, it would be difficult and, to a some extent, speculative to extrapolate them. Our observation concurs with the general logic that pristine environments are first colonized by autotrophs as primary producers, with the heterotrophs coming somewhat later [33]. Although such studies in Antarctica are relatively scarce [2,3,31,32], successions of heterotrophic microorganisms after first colonization by autotrophic microorganisms were documented for Alpine and Andes environments after glacier retractions in Italy and Chile, respectively [34,35,36].
One of the reasons we consider our data informative and reflecting the actual situation is that we chose a non-discriminative method for DNA isolation based on the physical destruction of the microbial cells. Another one is that we used the same DNA samples for the three types of metagenomic analyses in combination with equal sequencing efforts—the generation of at least 30,000 tags per sample, which resulted in 3–4 times more tags except for archaea (meaning that the archaeal DNA is indeed less represented within the sample). That means that comparisons between the three investigated domains are possible, especially in light of the plateaued refraction curves, which are prerequisites for correct enough quantitative analyses in amplicon-based metagenomics, where primer annealing biases could be a concern.
Our study, as a pioneering one, has some drawbacks. We acknowledge that physicochemical parameters in the different ecological niches studied could impact the observed patterns interpreted as antagonistic. Still, we believe that the tendencies we observed are visible enough. Unfortunately, studying the exact mechanisms of the antagonistic interactions was far beyond the scope of the research project. At present, we can only suspect that both types of antagonistic interactions are involved—active, due to the synthesis of different types of antimicrobials, and passive, resulting from the concurrence for nutrients and energy between the different types of microorganisms. This is the reason why the manuscript should be regarded as a preliminary communication that could be the basis for future research projects.
5. Conclusions
The results of our study demonstrate differences in abundance and distribution patterns among archaea, bacteria, and fungi. While this might be related to differences in environmental requirements, which were not investigated in our study, we believe that antagonistic interactions could play a significant role. We could only speculate about the causes of the observed patterns interpreted as antagonistic between the three major microbial phyla in Maritime Antarctica. However, our data suggest that some antagonisms exist, especially between fungi and archaea and between archaea and bacteria, based on the values of the numbers of the total tags and the OTUs, as well as on the values of the Chao1 and the ACE community richness indices. Furthermore, we observed some indications regarding the order of colonization of new barren ecological niches, according to which archaea and bacteria are the first, followed by fungi. Based on our findings, the best indicators of antagonism are the numbers of the OTUs and the ACE estimator, which give the most discriminative results. Unfortunately, because of the general lack of similar studies, not only for Antarctica but also worldwide, we cannot either compare our findings or explain the causes of the antagonisms.
Our results of the studies of pioneer microbial communities are only preliminary; thus, further studies, including of inter-domain functional relationships, are undoubtedly needed. Yet, we demonstrated the power of NGS-based metagenomics in research on inter-domain relationships and in investigating the primary colonization of new ecological recesses.
Author Contributions
Conceptualization, S.G.D. and N.N.; methodology, S.G.D. and V.V.D.; software, S.G.D.; validation, S.G.D., R.I. and M.I.; formal analysis, S.G.D., V.V.D. and D.G.M. and S.P.; investigation, S.G.D., V.V.D., T.M., R.I., M.K. and S.P.; resources, S.G.D. and N.N.; data curation, S.G.D.; writing—original draft preparation, S.G.D., N.N., T.M. and D.G.M.; writing—review and editing, S.G.D., N.N. and M.K.; visualization, S.G.D.; supervision, S.G.D.; project administration, S.G.D., L.K. and M.I.; funding acquisition, S.G.D. All authors have read and agreed to the published version of the manuscript.
Funding
This research was funded by Grant № 70-25-72 from 3 August 2021 of the National Center for Polar Studies—Sofia University “St. Kliment Ohridski”.
Institutional Review Board Statement
Not applicable.
Data Availability Statement
The raw sequencing reads of this study have been deposited in the Nacional Center for Biotechnology Information of the National Library of Medicine as sequence reads archives under the following accession numbers: PRJNA979344 (for archaea), PRJNA979782 (for fungi), and PRJNA979776 (for bacteria).
Acknowledgments
The authors would like to thank the logistics team of the Bulgarian Polar Base in Livingston Island for their valuable help and support, which made this research possible. Furthermore, we owe special thanks to Hristo Pimpirev from Bulgarian Antarctic Institute, and Dragomir Mateev, science and logistic coordinator of the Bulgarian polar expeditions.
Conflicts of Interest
The authors declare no conflicts of interest.
References
- Barker, P.F.; Filippelli, G.M.; Florindo, F.; Martin, E.E.; Scher, H.D. Onset and role of the Antarctic Circumpolar Current. Deep Sea Res. Part II: Top. Stud. Oceanogr. 2007, 54, 2388–2398. [Google Scholar] [CrossRef]
- Picazo, A.; Rochera, C.; Villaescusa, J.A.; Miralles-Lorenzo, J.; Velázquez, D.; Quesada, A.; Camacho, A. Bacterioplankton Community Composition Along Environmental Gradients in Lakes From Byers Peninsula (Maritime Antarctica) as Determined by Next-Generation Sequencing. Front. Microbiol. 2019, 10, 908. [Google Scholar] [CrossRef] [PubMed]
- Kim, S.; Kim, J.-H.; Lim, J.-H.; Jeong, J.-H.; Heo, J.-M.; Kim, I.-N. Distribution and Control of Bacterial Community Composition in Marian Cove Surface Waters, King George Island, Antarctica during the Summer of 2018. Microorganisms 2020, 8, 1115. [Google Scholar] [CrossRef]
- Bej, A.K.; Mojib, N. Cold adaptation in Antarctic biodegradative microorganisms. In Polar Microbiology: The Ecology, Biodiversity and Bioremediation Potential of Microorganisms in Extremely Cold Environments; CRC Press: Boca Raton, FL, USA, 2009; pp. 157–177. [Google Scholar]
- Robinson, C.H. Cold adaptation in Arctic and Antarctic fungi. New Phytol. 2001, 151, 341–353. [Google Scholar] [CrossRef]
- Flemming, H.-C.; Wuertz, S. Bacteria and archaea on Earth and their abundance in biofilms. Nat. Rev. Microbiol. 2019, 17, 247–260. [Google Scholar] [CrossRef] [PubMed]
- Bar-On, Y.M.; Phillips, R.; Milo, R. The biomass distribution on Earth. Proc. Natl. Acad. Sci. USA 2018, 115, 6506–6511. [Google Scholar] [CrossRef]
- Peay, K.G.; Kennedy, P.G.; Talbot, J.M. Dimensions of biodiversity in the Earth mycobiome. Nat. Rev. Microbiol. 2016, 14, 434–447. [Google Scholar] [CrossRef]
- Li, X.; Garbeva, P.; Liu, X.; klein Gunnewiek, P.J.A.; Clocchiatti, A.; Hundscheid, M.P.J.; Wang, X.; de Boer, W. Volatile-mediated antagonism of soil bacterial communities against fungi. Environ. Microbiol. 2020, 22, 1025–1035. [Google Scholar] [CrossRef]
- Coleine, C.; Biagioli, F.; de Vera, J.P.; Onofri, S.; Selbmann, L. Endolithic microbial composition in Helliwell Hills, a newly investigated Mars-like area in Antarctica. Environ. Microbiol. 2021, 23, 4002–4016. [Google Scholar] [CrossRef]
- Fernández, G.C.; Lecomte, K.; Vignoni, P.; Rueda, E.S.; Coria, S.H.; Lirio, J.M.; Mlewski, E.C. Prokaryotic diversity and biogeochemical characteristics of benthic microbial ecosystems from James Ross Archipelago (West Antarctica). Polar Biol. 2022, 45, 405–418. [Google Scholar] [CrossRef]
- Magoč, T.; Salzberg, S.L. FLASH: Fast length adjustment of short reads to improve genome assemblies. Bioinformatics 2011, 27, 2957–2963. [Google Scholar] [CrossRef] [PubMed]
- Bokulich, N.A.; Subramanian, S.; Faith, J.J.; Gevers, D.; Gordon, J.I.; Knight, R.; Mills, D.A.; Caporaso, J.G. Quality-filtering vastly improves diversity estimates from Illumina amplicon sequencing. Nat. Methods 2013, 10, 57–59. [Google Scholar] [CrossRef]
- Caporaso, J.G.; Kuczynski, J.; Stombaugh, J.; Bittinger, K.; Bushman, F.D.; Costello, E.K.; Fierer, N.; Peña, A.G.; Goodrich, J.K.; Gordon, J.I.; et al. QIIME allows analysis of high-throughput community sequencing data. Nat. Methods 2010, 7, 335–336. [Google Scholar] [CrossRef] [PubMed]
- Edgar, R.C.; Haas, B.J.; Clemente, J.C.; Quince, C.; Knight, R. UCHIME improves sensitivity and speed of chimera detection. Bioinformatics 2011, 27, 2194–2200. [Google Scholar] [CrossRef]
- Haas, B.J.; Gevers, D.; Earl, A.M.; Feldgarden, M.; Ward, D.V.; Giannoukos, G.; Ciulla, D.; Tabbaa, D.; Highlander, S.K.; Sodergren, E. Chimeric 16S rRNA sequence formation and detection in Sanger and 454-pyrosequenced PCR amplicons. Genome Res. 2011, 21, 494–504. [Google Scholar] [CrossRef] [PubMed]
- Edgar, R.C. UPARSE: Highly accurate OTU sequences from microbial amplicon reads. Nat. Methods 2013, 10, 996–998. [Google Scholar] [CrossRef] [PubMed]
- Quast, C.; Pruesse, E.; Yilmaz, P.; Gerken, J.; Schweer, T.; Yarza, P.; Peplies, J.; Glöckner, F.O. The SILVA ribosomal RNA gene database project: Improved data processing and web-based tools. Nucleic Acids Res. 2012, 41, D590–D596. [Google Scholar] [CrossRef]
- Wang, Q.; Garrity, G.M.; Tiedje, J.M.; Cole, J.R. Naïve Bayesian Classifier for Rapid Assignment of rRNA Sequences into the New Bacterial Taxonomy. Appl. Environ. Microbiol. 2007, 73, 5261–5267. [Google Scholar] [CrossRef]
- Kõljalg, U.; Nilsson, R.H.; Abarenkov, K.; Tedersoo, L.; Taylor, A.F.S.; Bahram, M.; Bates, S.T.; Bruns, T.D.; Bengtsson-Palme, J.; Callaghan, T.M.; et al. Towards a unified paradigm for sequence-based identification of fungi. Mol. Ecol. 2013, 22, 5271–5277. [Google Scholar] [CrossRef]
- Chao, A. Non-parametric estimation of the classes in a population. Scand. J. Stat. 1984, 11, 265–270. [Google Scholar]
- Chao, A.; Lee, S.M. Estimating the Number of Classes via Sample Coverage. J. Am. Stat. Assoc. 1992, 87, 210–217. [Google Scholar] [CrossRef]
- Chao, A.; Ma, M.C.; Yang, M.C.K. Stopping Rules and Estimation for Recapture Debugging with Unequal Failure Rates. Biometrika 1993, 80, 193–201. [Google Scholar] [CrossRef]
- Lemos, L.N.; Fulthorpe, R.R.; Triplett, E.W.; Roesch, L.F.W. Rethinking microbial diversity analysis in the high throughput sequencing era. J. Microbiol. Methods 2011, 86, 42–51. [Google Scholar] [CrossRef] [PubMed]
- Magurran, A. Measursuring Biological Diversity; Blackwelll Publisher Company: Hoboken, NJ, USA, 2004. [Google Scholar]
- Lundberg, D.S.; Yourstone, S.; Mieczkowski, P.; Jones, C.D.; Dangl, J.L. Practical innovations for high-throughput amplicon sequencing. Nat. Methods 2013, 10, 999–1002. [Google Scholar] [CrossRef]
- Kim, B.R.; Shin, J.; Guevarra, R.; Lee, J.H.; Kim, D.W.; Seol, K.H.; Lee, J.H.; Kim, H.B.; Isaacson, R. Deciphering Diversity Indices for a Better Understanding of Microbial Communities. J. Microbiol. Biotechnol. 2017, 27, 2089–2093. [Google Scholar] [CrossRef] [PubMed]
- He, Y.; Caporaso, J.G.; Jiang, X.-T.; Sheng, H.-F.; Huse, S.M.; Rideout, J.R.; Edgar, R.C.; Kopylova, E.; Walters, W.A.; Knight, R.; et al. Stability of operational taxonomic units: An important but neglected property for analyzing microbial diversity. Microbiome 2015, 3, 20. [Google Scholar] [CrossRef] [PubMed]
- Ciccazzo, S.; Esposito, A.; Borruso, L.; Brusetti, L. Microbial communities and primary succession in high altitude mountain environments. Ann. Microbiol. 2016, 66, 43–60. [Google Scholar] [CrossRef]
- Ni, G.; Lappan, R.; Hernández, M.; Santini, T.; Tomkins, A.G.; Greening, C. Functional basis of primary succession: Traits of the pioneer microbes. Environ. Microbiol. 2023, 25, 171–176. [Google Scholar] [CrossRef]
- Gyeong, H.; Hyun, C.-U.; Kim, S.C.; Tripathi, B.M.; Yun, J.; Kim, J.; Kang, H.; Kim, J.H.; Kim, S.; Kim, M. Contrasting early successional dynamics of bacterial and fungal communities in recently deglaciated soils of the maritime Antarctic. Mol. Ecol. 2021, 30, 4231–4244. [Google Scholar] [CrossRef]
- Garrido-Benavent, I.; Pérez-Ortega, S.; Durán, J.; Ascaso, C.; Pointing, S.B.; Rodríguez-Cielos, R.; Navarro, F.; de los Ríos, A. Differential Colonization and Succession of Microbial Communities in Rock and Soil Substrates on a Maritime Antarctic Glacier Forefield. Front. Microbiol. 2020, 11, 126. [Google Scholar] [CrossRef]
- Lekevičius, E. Appearance of Modern Ecological Pyramids: Summing Up. In Biodiversity: Maintenance, Function, Origin, and Self-Organisation into Life-Support Systems; Lekevičius, E., Ed.; Springer International Publishing: Cham, Switzerland, 2022; pp. 197–211. [Google Scholar] [CrossRef]
- Franzetti, A.; Navarra, F.; Tagliaferri, I.; Gandolfi, I.; Bestetti, G.; Minora, U.; Azzoni, R.S.; Diolaiuti, G.; Smiraglia, C.; Ambrosini, R. Temporal variability of bacterial communities in cryoconite on an alpine glacier. Environ. Microbiol. Rep. 2017, 9, 71–78. [Google Scholar] [CrossRef] [PubMed]
- Fernández-Martínez, M.A.; Pérez-Ortega, S.; Pointing, S.B.; Allan Green, T.G.; Pintado, A.; Rozzi, R.; Sancho, L.G.; de los Ríos, A. Microbial succession dynamics along glacier forefield chronosequences in Tierra del Fuego (Chile). Polar Biol. 2017, 40, 1939–1957. [Google Scholar] [CrossRef]
- Franzetti, A.; Pittino, F.; Gandolfi, I.; Azzoni, R.S.; Diolaiuti, G.; Smiraglia, C.; Pelfini, M.; Compostella, C.; Turchetti, B.; Buzzini, P.; et al. Early ecological succession patterns of bacterial, fungal and plant communities along a chronosequence in a recently deglaciated area of the Italian Alps. FEMS Microbiol. Ecol. 2020, 96, fiaa165. [Google Scholar] [CrossRef]
Disclaimer/Publisher’s Note: The statements, opinions and data contained in all publications are solely those of the individual author(s) and contributor(s) and not of MDPI and/or the editor(s). MDPI and/or the editor(s) disclaim responsibility for any injury to people or property resulting from any ideas, methods, instructions or products referred to in the content. |
© 2024 by the authors. Licensee MDPI, Basel, Switzerland. This article is an open access article distributed under the terms and conditions of the Creative Commons Attribution (CC BY) license (https://creativecommons.org/licenses/by/4.0/).