Article

Climate Change Influence on the Potential Distribution of Some Cavity-Nesting Bees (Hymenoptera: Megachilidae)

1
Entomology Department, Faculty of Science, Ain Shams University, Abbassia, Cairo 11566, Egypt
2
Division of Invertebrate Zoology, American Museum of Natural History, Central Park West at 79th Street, New York, NY 10024-5192, USA
3
Department of Plant Protection, Faculty of Agriculture, Suez Canal University, Ismailia 41522, Egypt
*
Authors to whom correspondence should be addressed.
Diversity 2023, 15(12), 1172; https://doi.org/10.3390/d15121172
Submission received: 1 November 2023 / Revised: 20 November 2023 / Accepted: 21 November 2023 / Published: 24 November 2023
(This article belongs to the Special Issue Emerging Effects of Pollinator Loss on Biodiversity)

Abstract

:
As climatic and other impactful environmental changes continue to gain momentum pollination, services are poised to be harmed, and wild bee species are not an exception. In the present study, maximum entropy (MaxEnt) modeling was used to predict the potential climatic niches of five wild bee species, namely, Chalicodoma flavipes, Chalicodoma sicula, Coelioxys coturnix, Megachile minutissima, and Osmia submicans (all of Megachilidae: Megachilinae). The Maxent model performed better than random for the five species, and all model predictions were significantly robust, giving ratios above null expectations. Under future climate change scenarios, the Maxent model predicted habitat loss for C. flavipes, C. sicula, and M. minutissima in North Africa and habitat loss for O. submicans in Europe and North Africa in all scenarios. Conversely, the study showed that the cleptoparasitic bee Co. coturnix would expand their suitable habitat in most scenarios in Europe, Asia, and the United States, although this species would also suffer habitat loss in North Africa in two scenarios. Between the present situation and future scenarios, the potential distribution for all species decreased in their suitable habitat, with the exception of Co. coturnix. The present results are of considerable value for informed conservation programs and policy decisions regarding wild pollinators.

1. Introduction

The intimate association between bees and their floral hosts is of great importance to the wellbeing of our world. Through their role as the predominant and most vital plant pollinators, bees underpin natural and agricultural ecosystems in virtually every terrestrial region. While such pollination services are largely thought of as the role of managed honey bees or bumble bees, these social species are minor players in global pollination activities. Among the more than 20,500 currently documented bee species worldwide, less than 5% of them are social and even fewer of those (1%) are domesticated and used in managed pollination services [1]. Wild bees not managed by humans comprise the majority of pollinators, and their behavior is often the least understood. Certainly, wild bees are most often thought of within the context of natural environments, but their ecological services are also a critical complement to honey bees and other managed pollinators, especially when it comes to agricultural pollination [2,3]. The presence of native bees in addition to honey bees can enhance and increase the efficiency of crop pollination services [4]. Moreover, some plants are dependent on specialized pollinators, either from a particular genus or, in very limited cases, a single bee species, and, in these systems, the success of wild bees is absolute. Regardless of the degree of host–pollinator specialization, the decoupling of this plant–insect pollinator association can lead to local extirpation of floral species and degradation of the habitat, which, in turn, may end up with further declines in tertiary plant or animal associates. Such cascades of events through the ecosystem can influence a region badly; hence, it is therefore vital to understand and promote wild pollinators, especially bees [5].
The Mediterranean region is considered to house one of the richest bee faunas. However, comparatively little information exists on the biogeography, biodiversity, and status of climatic impact for this area, especially in the southern Mediterranean (i.e., northern Africa) [6]. This fauna is impacted by several environmental and anthropogenic factors such as urbanization, land degradation, nesting habitat fragmentation, agriculture intensification, pathogens, natural enemies, and pesticides. The decline of pollinators caused by these toxic influences is well documented in several major reviews [5,7,8,9,10].
In Egypt, native wild bees are the most important natural resources, and their conservation is critical for the success of several important crops, especially in dry lands. Decline of native pollinators, especially bees, would have a very negative impact, resulting in a pollination deficit, food insecurity, and significant losses to the Egyptian economy [11]. Currently, the population of cavity bees in Egypt, particularly those that nest in mud walls (cavity-nesting bees), such as Chalicodoma sicula (Rossi 1792), Chalicodoma flavipes Spinola 1838, Megachile minutissima Radoszkowski 1876, and Osmia submicans Morawitz 1870, are already at high risk [12,13]. This risk is exacerbated by the gradual reduction in suitable nesting sites, caused by the growing availability of new concrete housing replacing the old conventional mud houses growers used to live in. This change may cause bees to become completely extirpated from the region within a few years.
Recently, several studies used ecological niche modeling techniques for different insect pollinator species to understand speciation patterns in bees [14] and predict conservation areas for making conservation management decisions [15,16,17,18]. Niche modelling techniques have been also used to predict the potential distribution of bee species in current and future periods [19], and to address the potential effects of climate change on the distributions of species [20,21,22]. To the best of our knowledge, no study has been conducted to model the effects of climate change on wild bees in Egypt. Based on periodic field surveys, the populations of target species in this study are decreasing year by year due to the loss of natural nesting aggregations. Yet, while this was observed for most species, the abundance of the cleptoparasitic bee Coelioxys coturnix increased, thereby placing greater stress on their hosts. With this concern in mind, the present study aims to: (1) estimate the potential distribution of C. flavipes, C. sicula, M. minutissima, and O. submicans by modelling their suitable habitats in current and future scenarios of climate change. This would also include providing a better understanding of their ecology for conservation planning; (2) to anticipate the global potential distribution of the invasive cleptoparasitic bee Coelioxys coturnix, which victimizes the nests of some of the aforementioned species, also under current and future scenarios. The present work would also aim to achieve these goals by using an ecological niche modeling approach via the maximum entropy algorithm (MaxEnt).

2. Materials and Methods

2.1. Occurrence Data

In the present study, the occurrence records for five wild megachiline bee species found commonly in agricultural ecosystems across Egypt, C. flavipes, C. sicula, Co. coturnix, M. minutissima, and O. submicans, were assembled. All of these species nest in cavities in mud walls and are also active in the spring–summer seasons when they forage on Egyptian clover, except C. sicula, which is active in the winter and forages on broad bean. A primary 618 records for the five species were gathered from the Global Biodiversity Information Facility GBIF; www.gbif.org (accessed on 19 February 2022, iNaturalist www.inaturalist.org (accessed on 2 March 2022) (Supplementary File S1), and previous literature [12]. Records were also gathered from original collections by M.A.S. during several field trips across Egyptian ecological zones during the years 2000 to 2020. The initial occurrence datasets were subjected to data cleaning steps to reduce possible biases in calibrating ecological niche models [23]. We eliminated all duplicate records, then the data were filtered by spatially rarefy function available in SDMtoolbox 2.4 [24,25] in ArcGIS 10.3 to remove all redundant records occurring in a distance ≤2.5′ (≈5 km). The final occurrence records for five species have included 387 occurrence points (Supplementary File S2). The occurrence records for each species were divided into two equal portions using Hawth’s Tools [26] available in ArcGIS10.3: 50% for calibrating current and future predictions and 50% for evaluating model predictions.

2.2. Environmental Variables

Climatic data were downloaded from the WorldClim version 2.1 (www.worldclim.org) with a spatial resolution of 2.5 arcminutes for both current and future climate data, and this version was used because these data performed better than other climatic data [27]. The current variables included 19 bioclimatic variables (Table 1) derived from monthly temperature and precipitation records from 1970 to 2000 and these variables are used in species distribution modeling [28]. Four bioclimatic variables were excluded from the analysis due to spatial artifacts in these variables: mean temperature of the wettest quarter (Bio 8), mean temperature of the driest quarter (Bio 9), precipitation of the warmest quarter (Bio 18), and precipitation of the coldest quarter (Bio 19) [29,30]. We used the jackknifing function in Maxent to estimate the most important set of the remaining 15 environmental variables, and we then removed the highly correlated variables using the test in SDMTools in ArcGIS 10.3 to check the Pearson correlation coefficient, assuming r > |0.7| as the threshold value [31]. The reduced number of predictor variables for C. flavipes was four, five for C. sicula, six for Co. coturnix, six for M. minutissima, and seven for O. submicans (Supplementary File S3). All these bioclimatic layers were clipped using ArcGIS software V. 10.3 to match the study area for each species and saved in ASCII grid format for insertion in MaxEnt [32]. For future data, we used parallel datasets for Shared Socioeconomic Pathways (SSPs). Three different scenarios were chosen available in the WorldClim 2.1 database [27]. We ran separate models for each wild bee species using future climate data from these three scenarios. These models were the Beijing Climate Center Climate System Model (BCC-CSM2-MR), the Earth system (ES) model (CNRM-ESM2), and the sixth version of the Model for Interdisciplinary Research on Climate (MIROC6) [33,34,35,36]. The mean of these future climate simulations was used to reduce the uncertainty of a single climate model scenario [37]. We prepared predictions for two shared socio-economic pathways (SSPs), 370 and 585, for three timelines: 2041–2060, 2061–2080, and 2081–2100.

2.3. Predictive Modeling
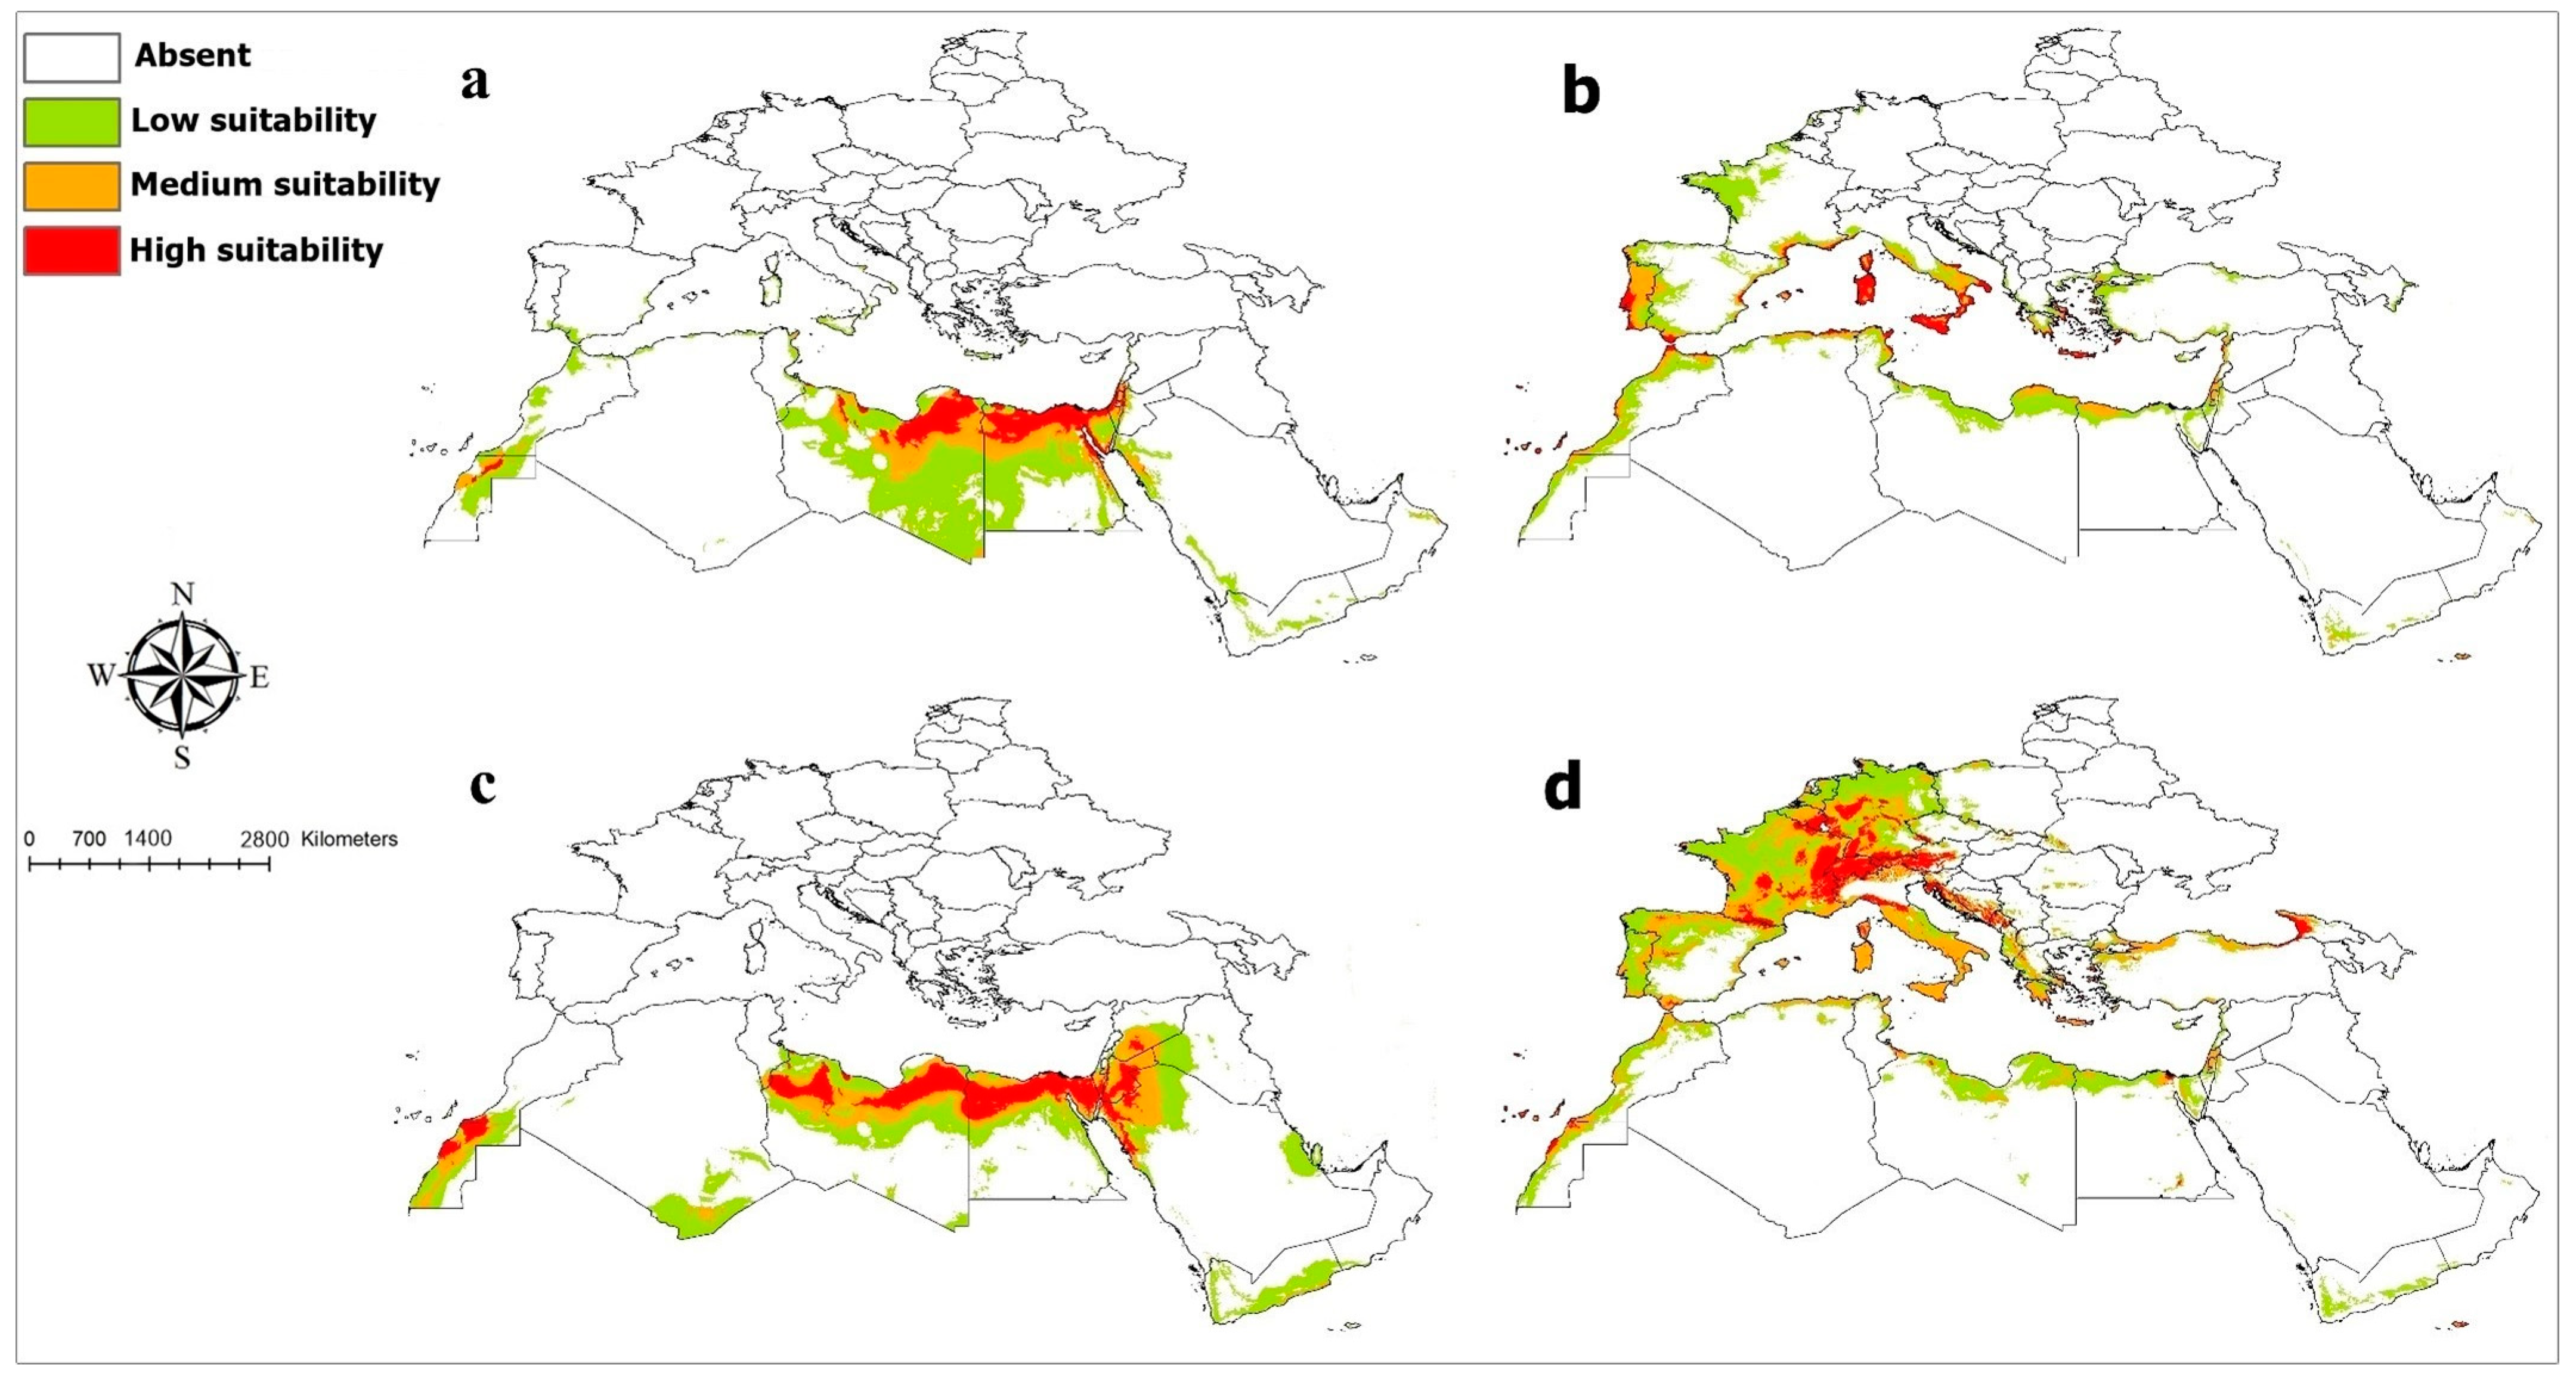
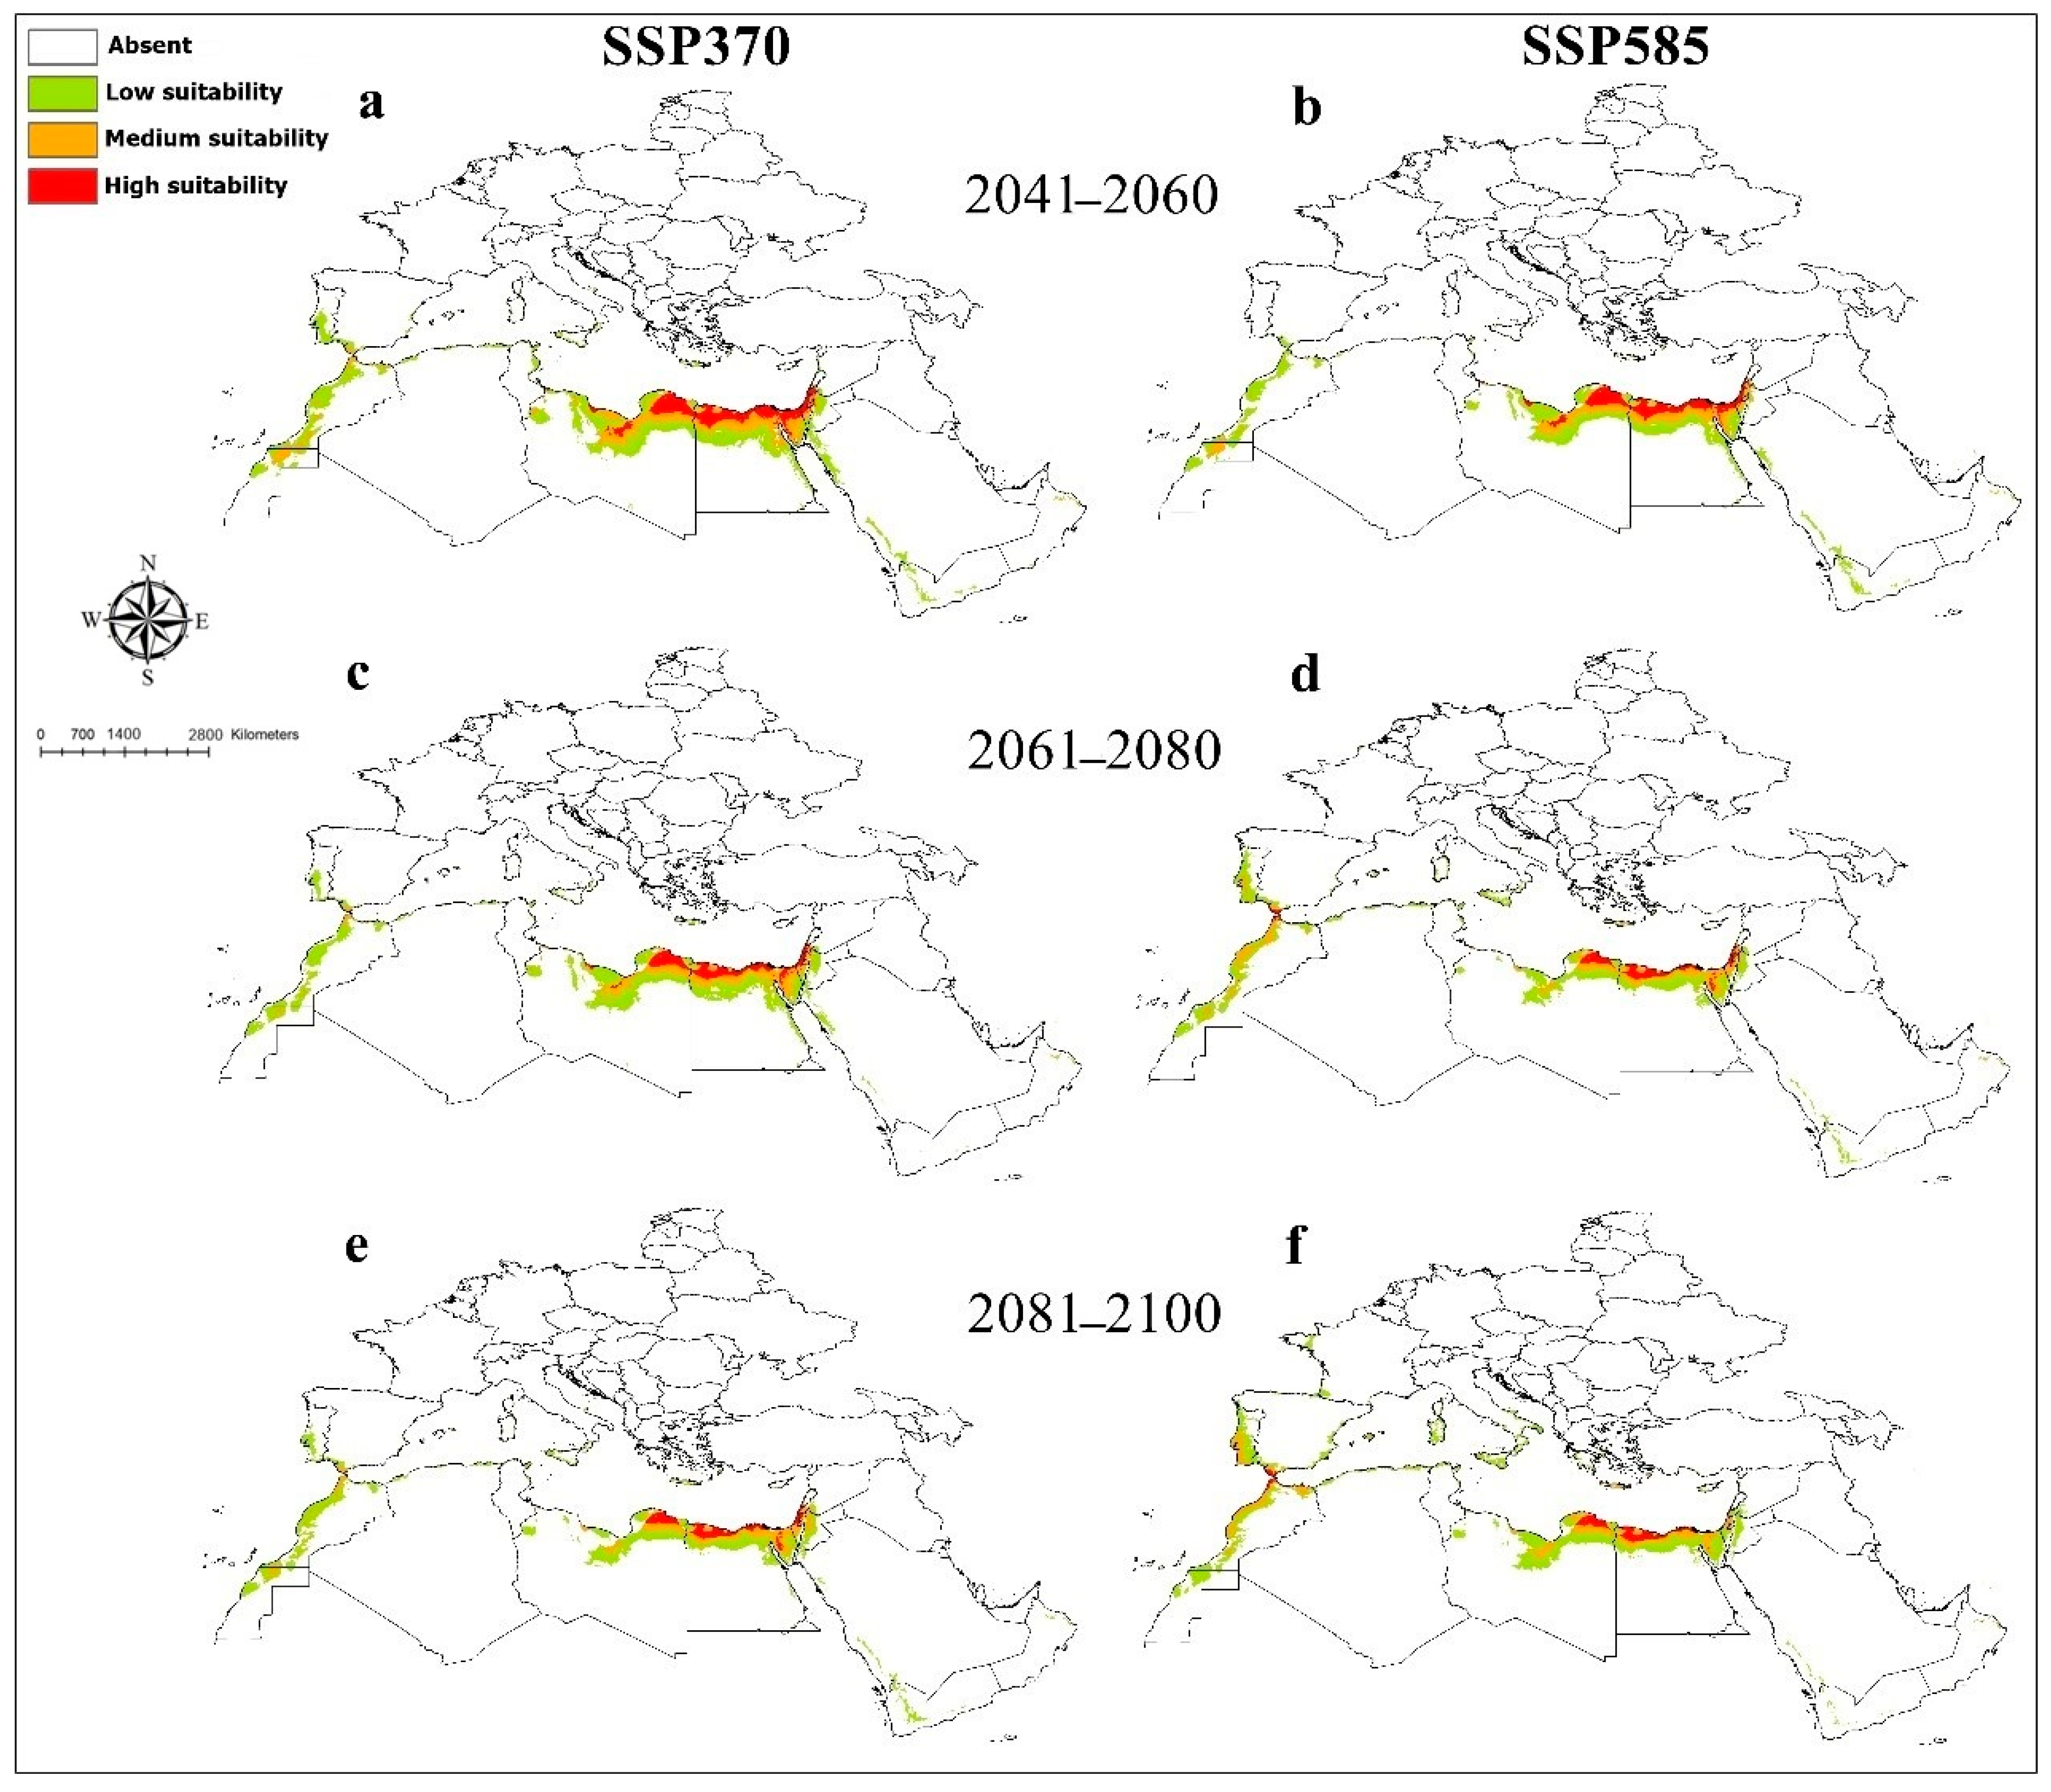
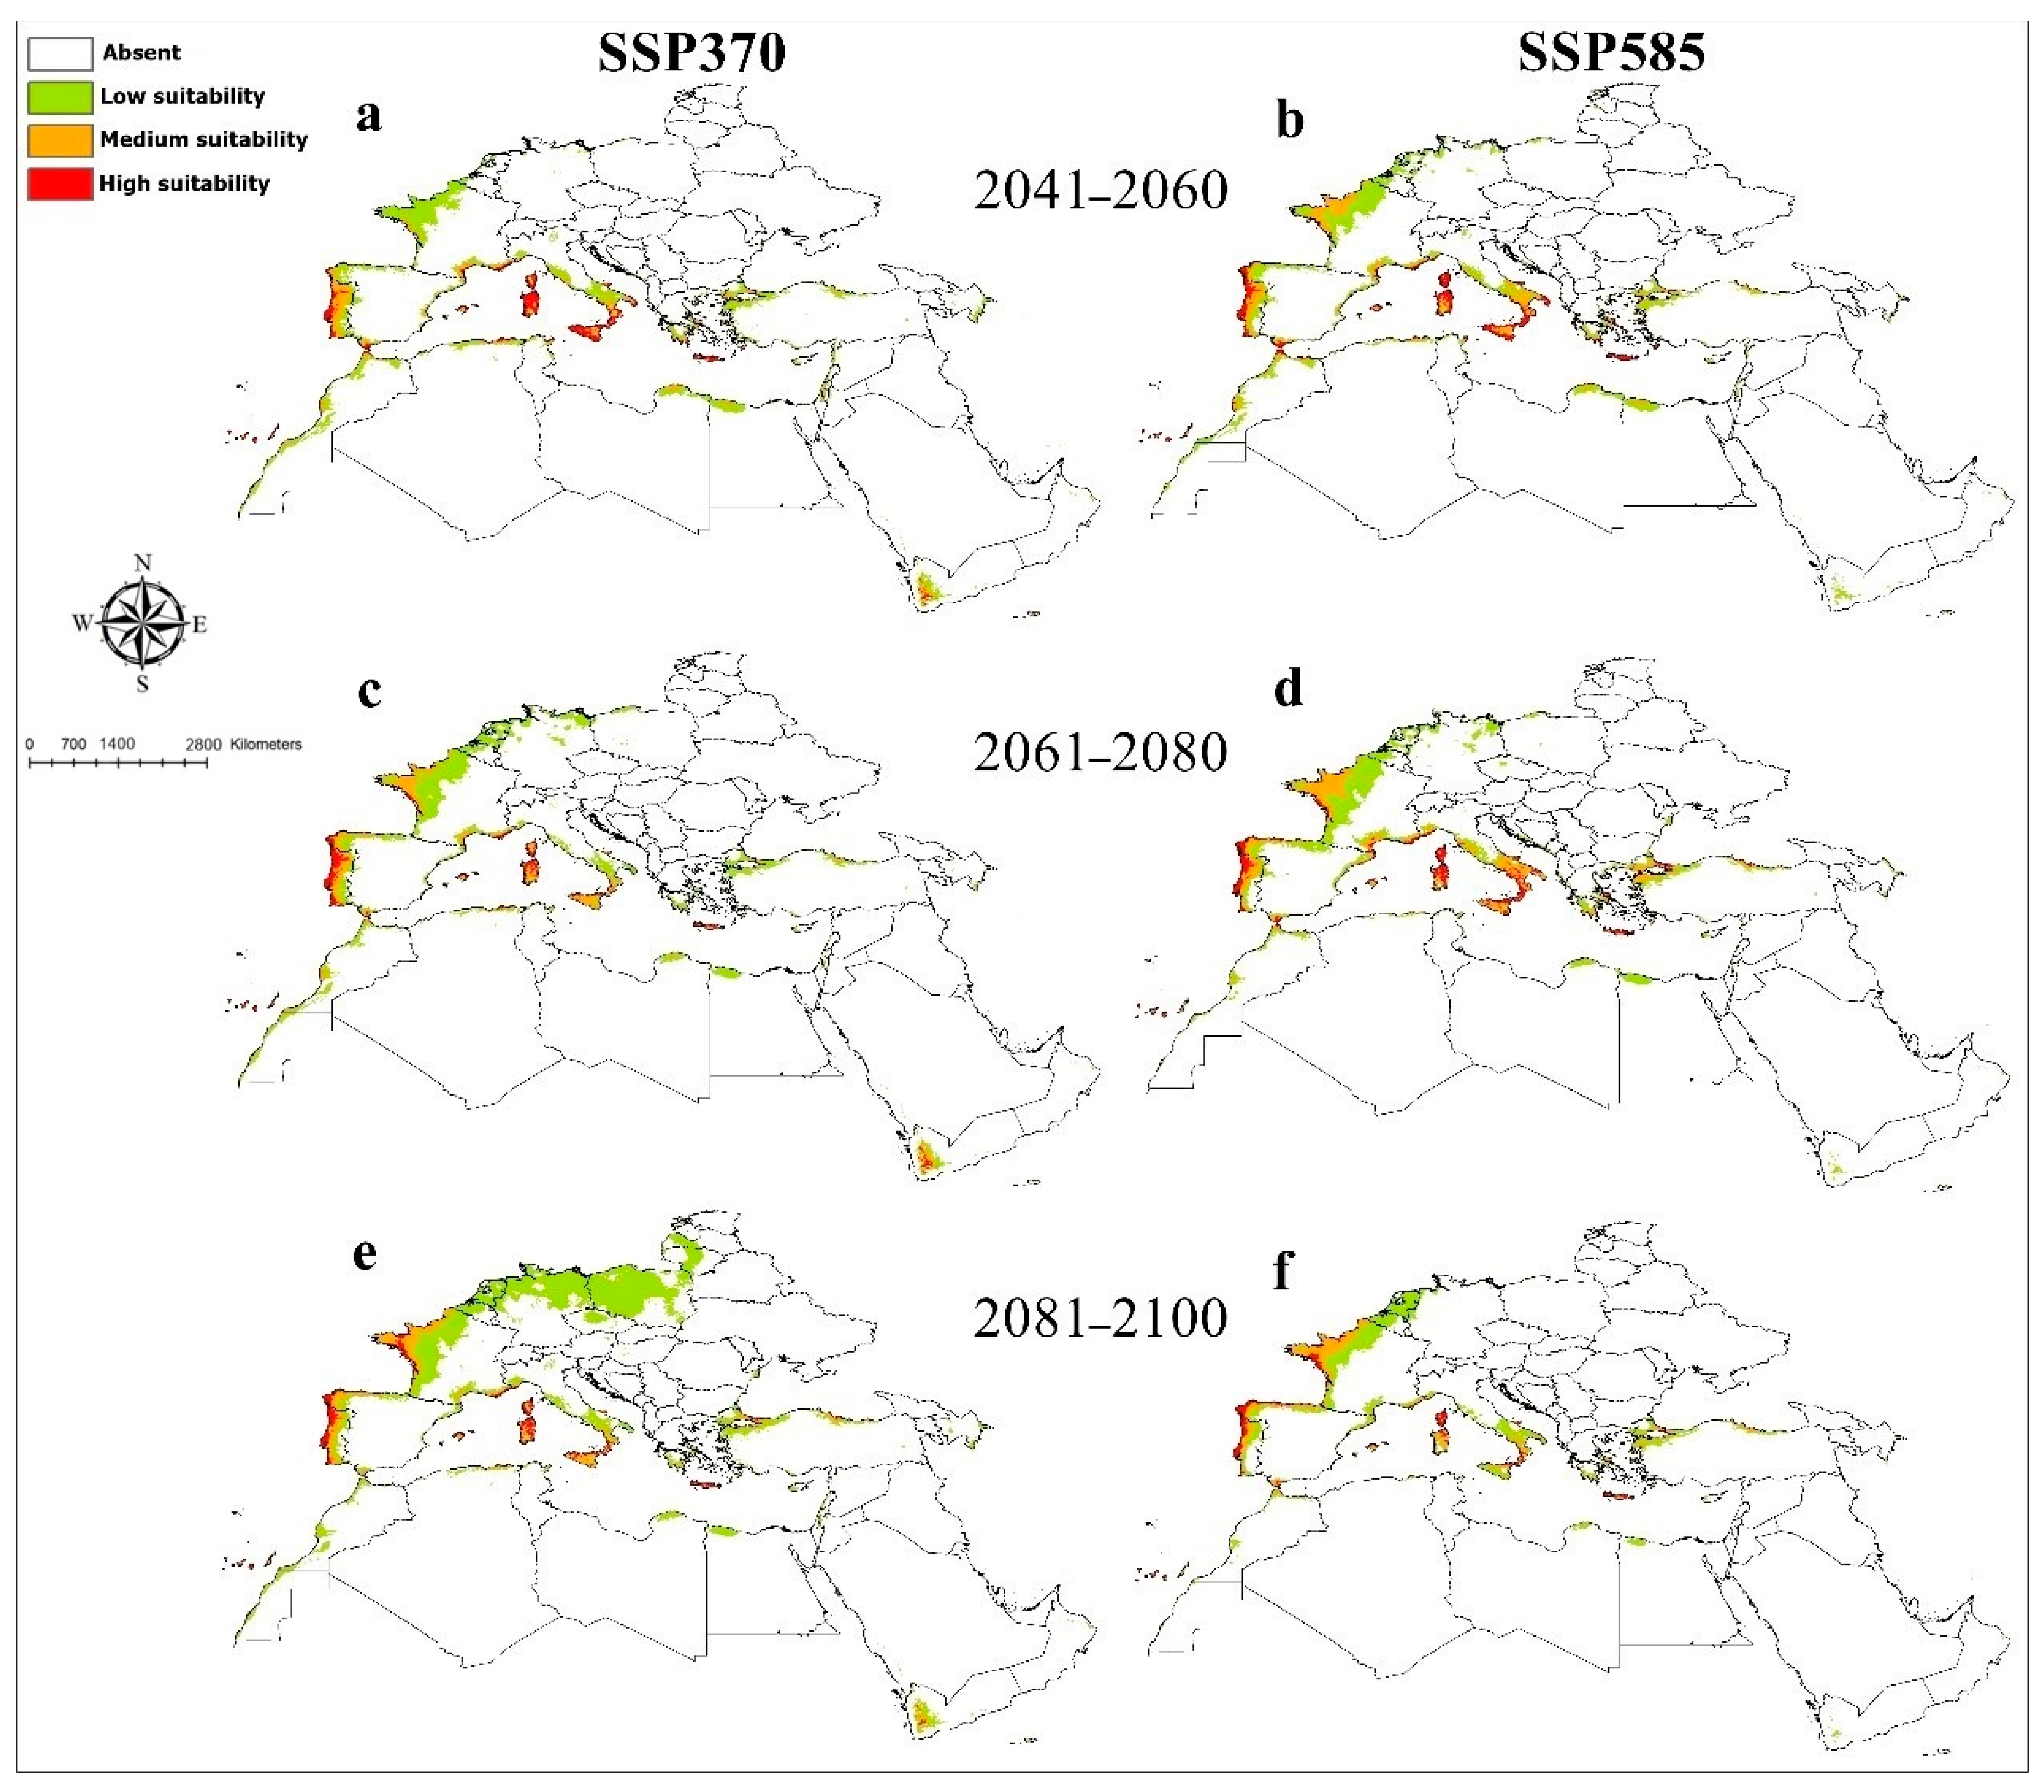
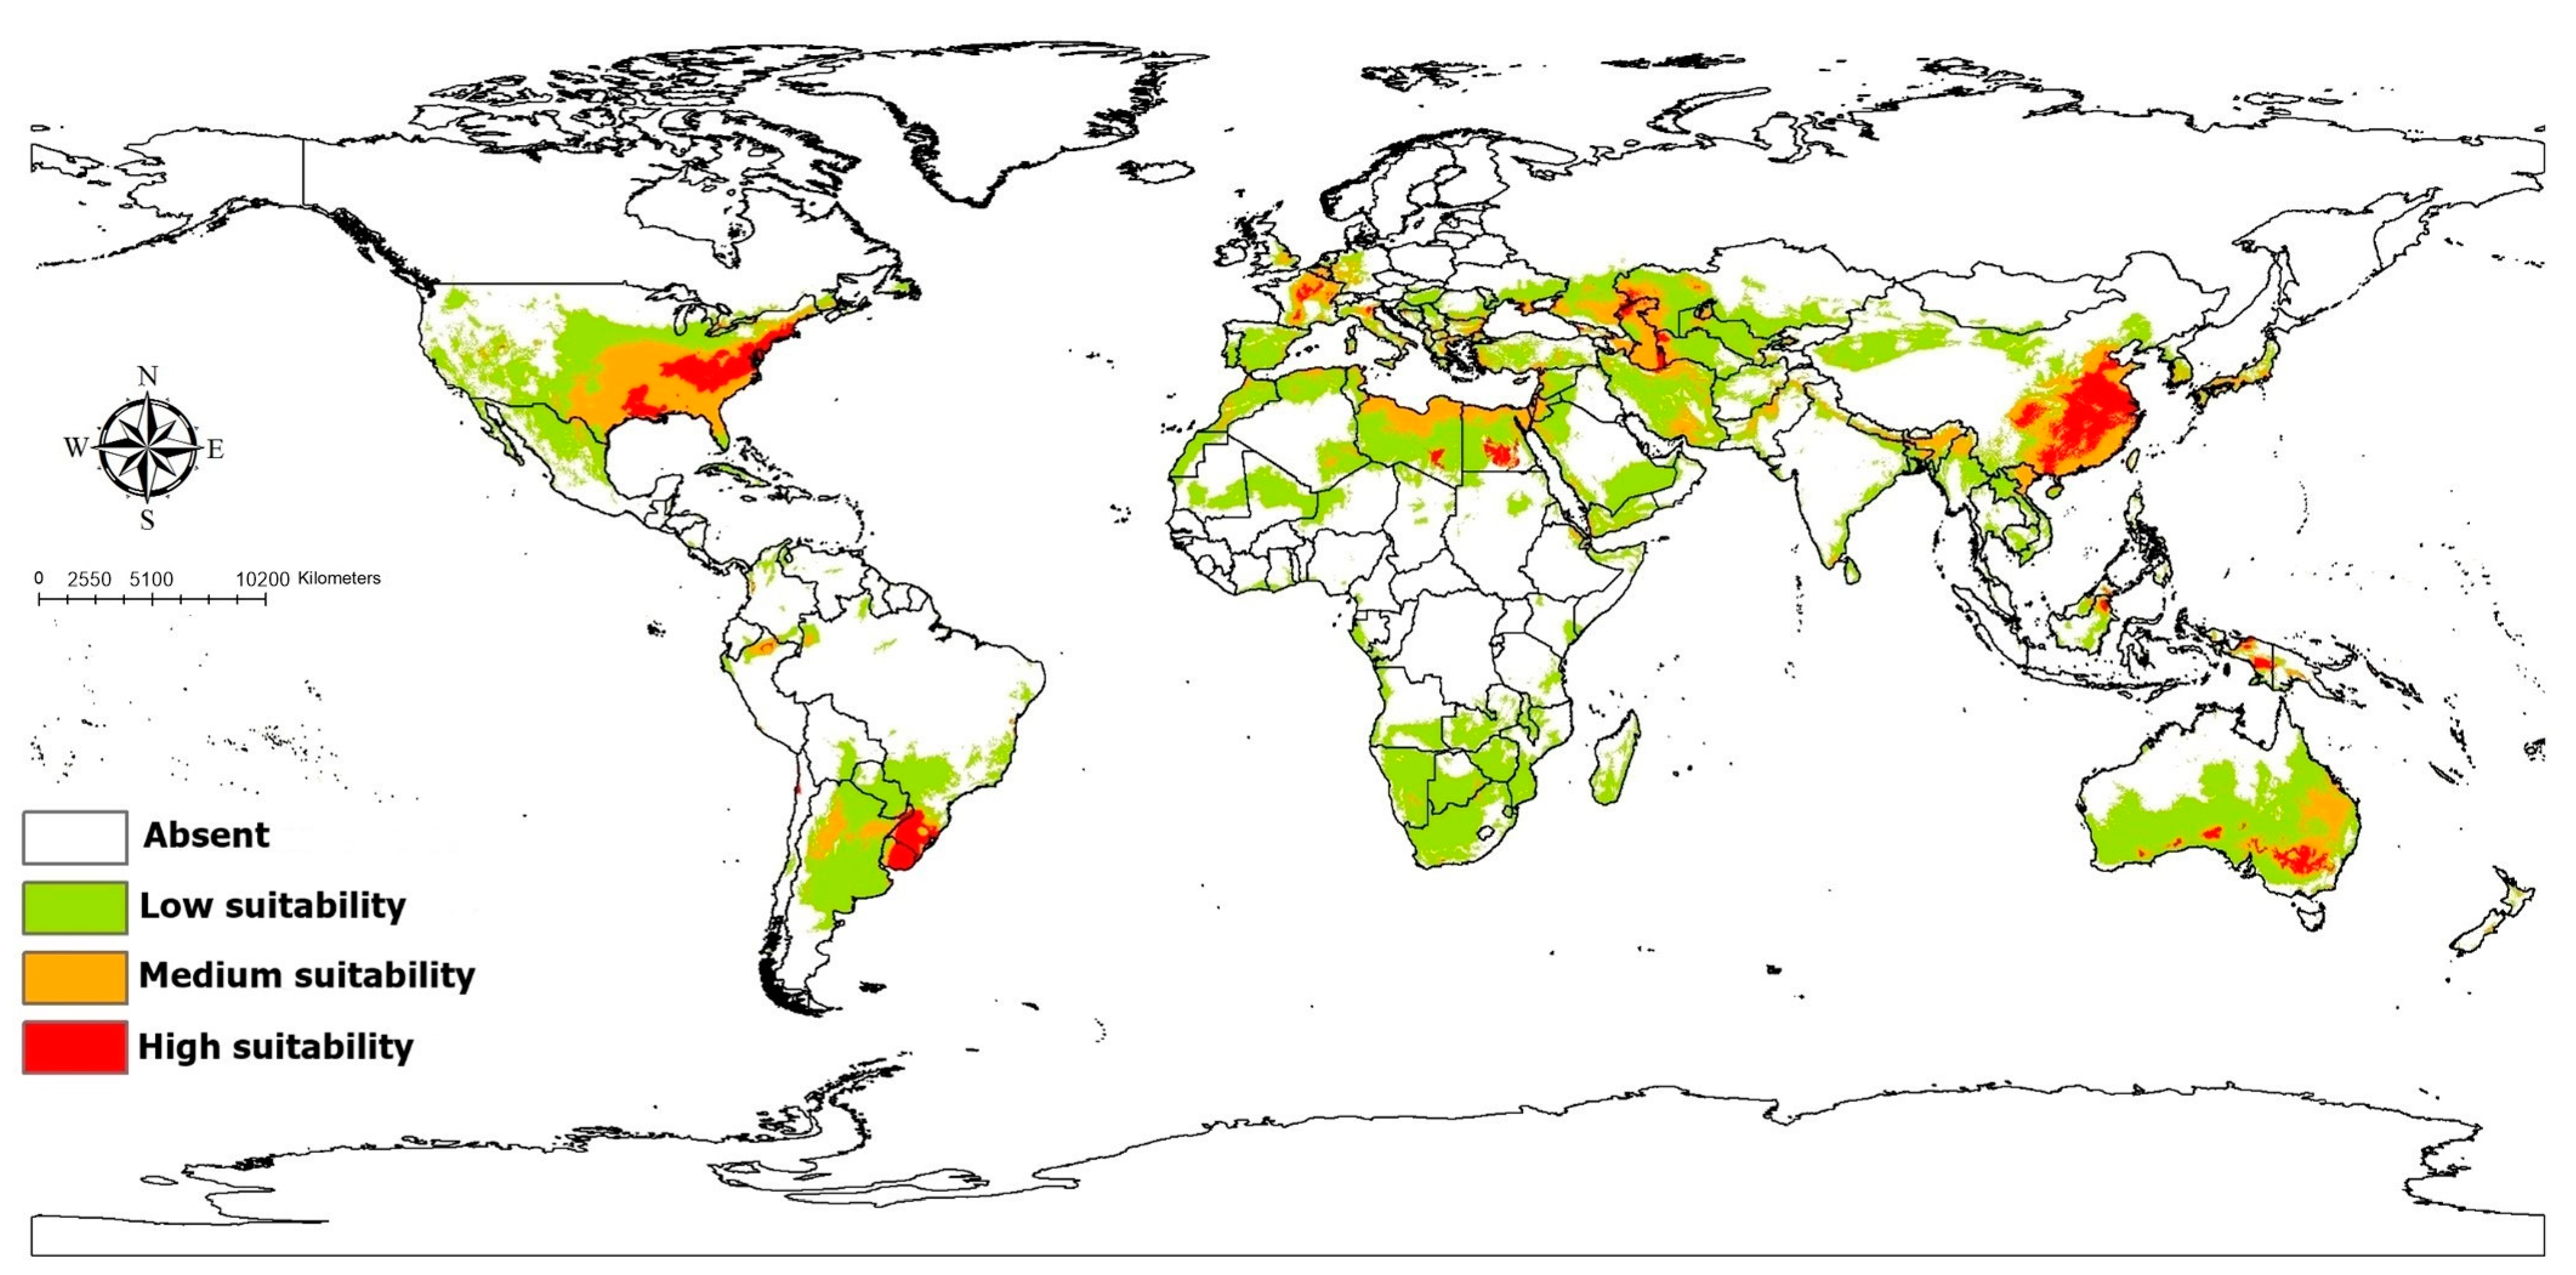
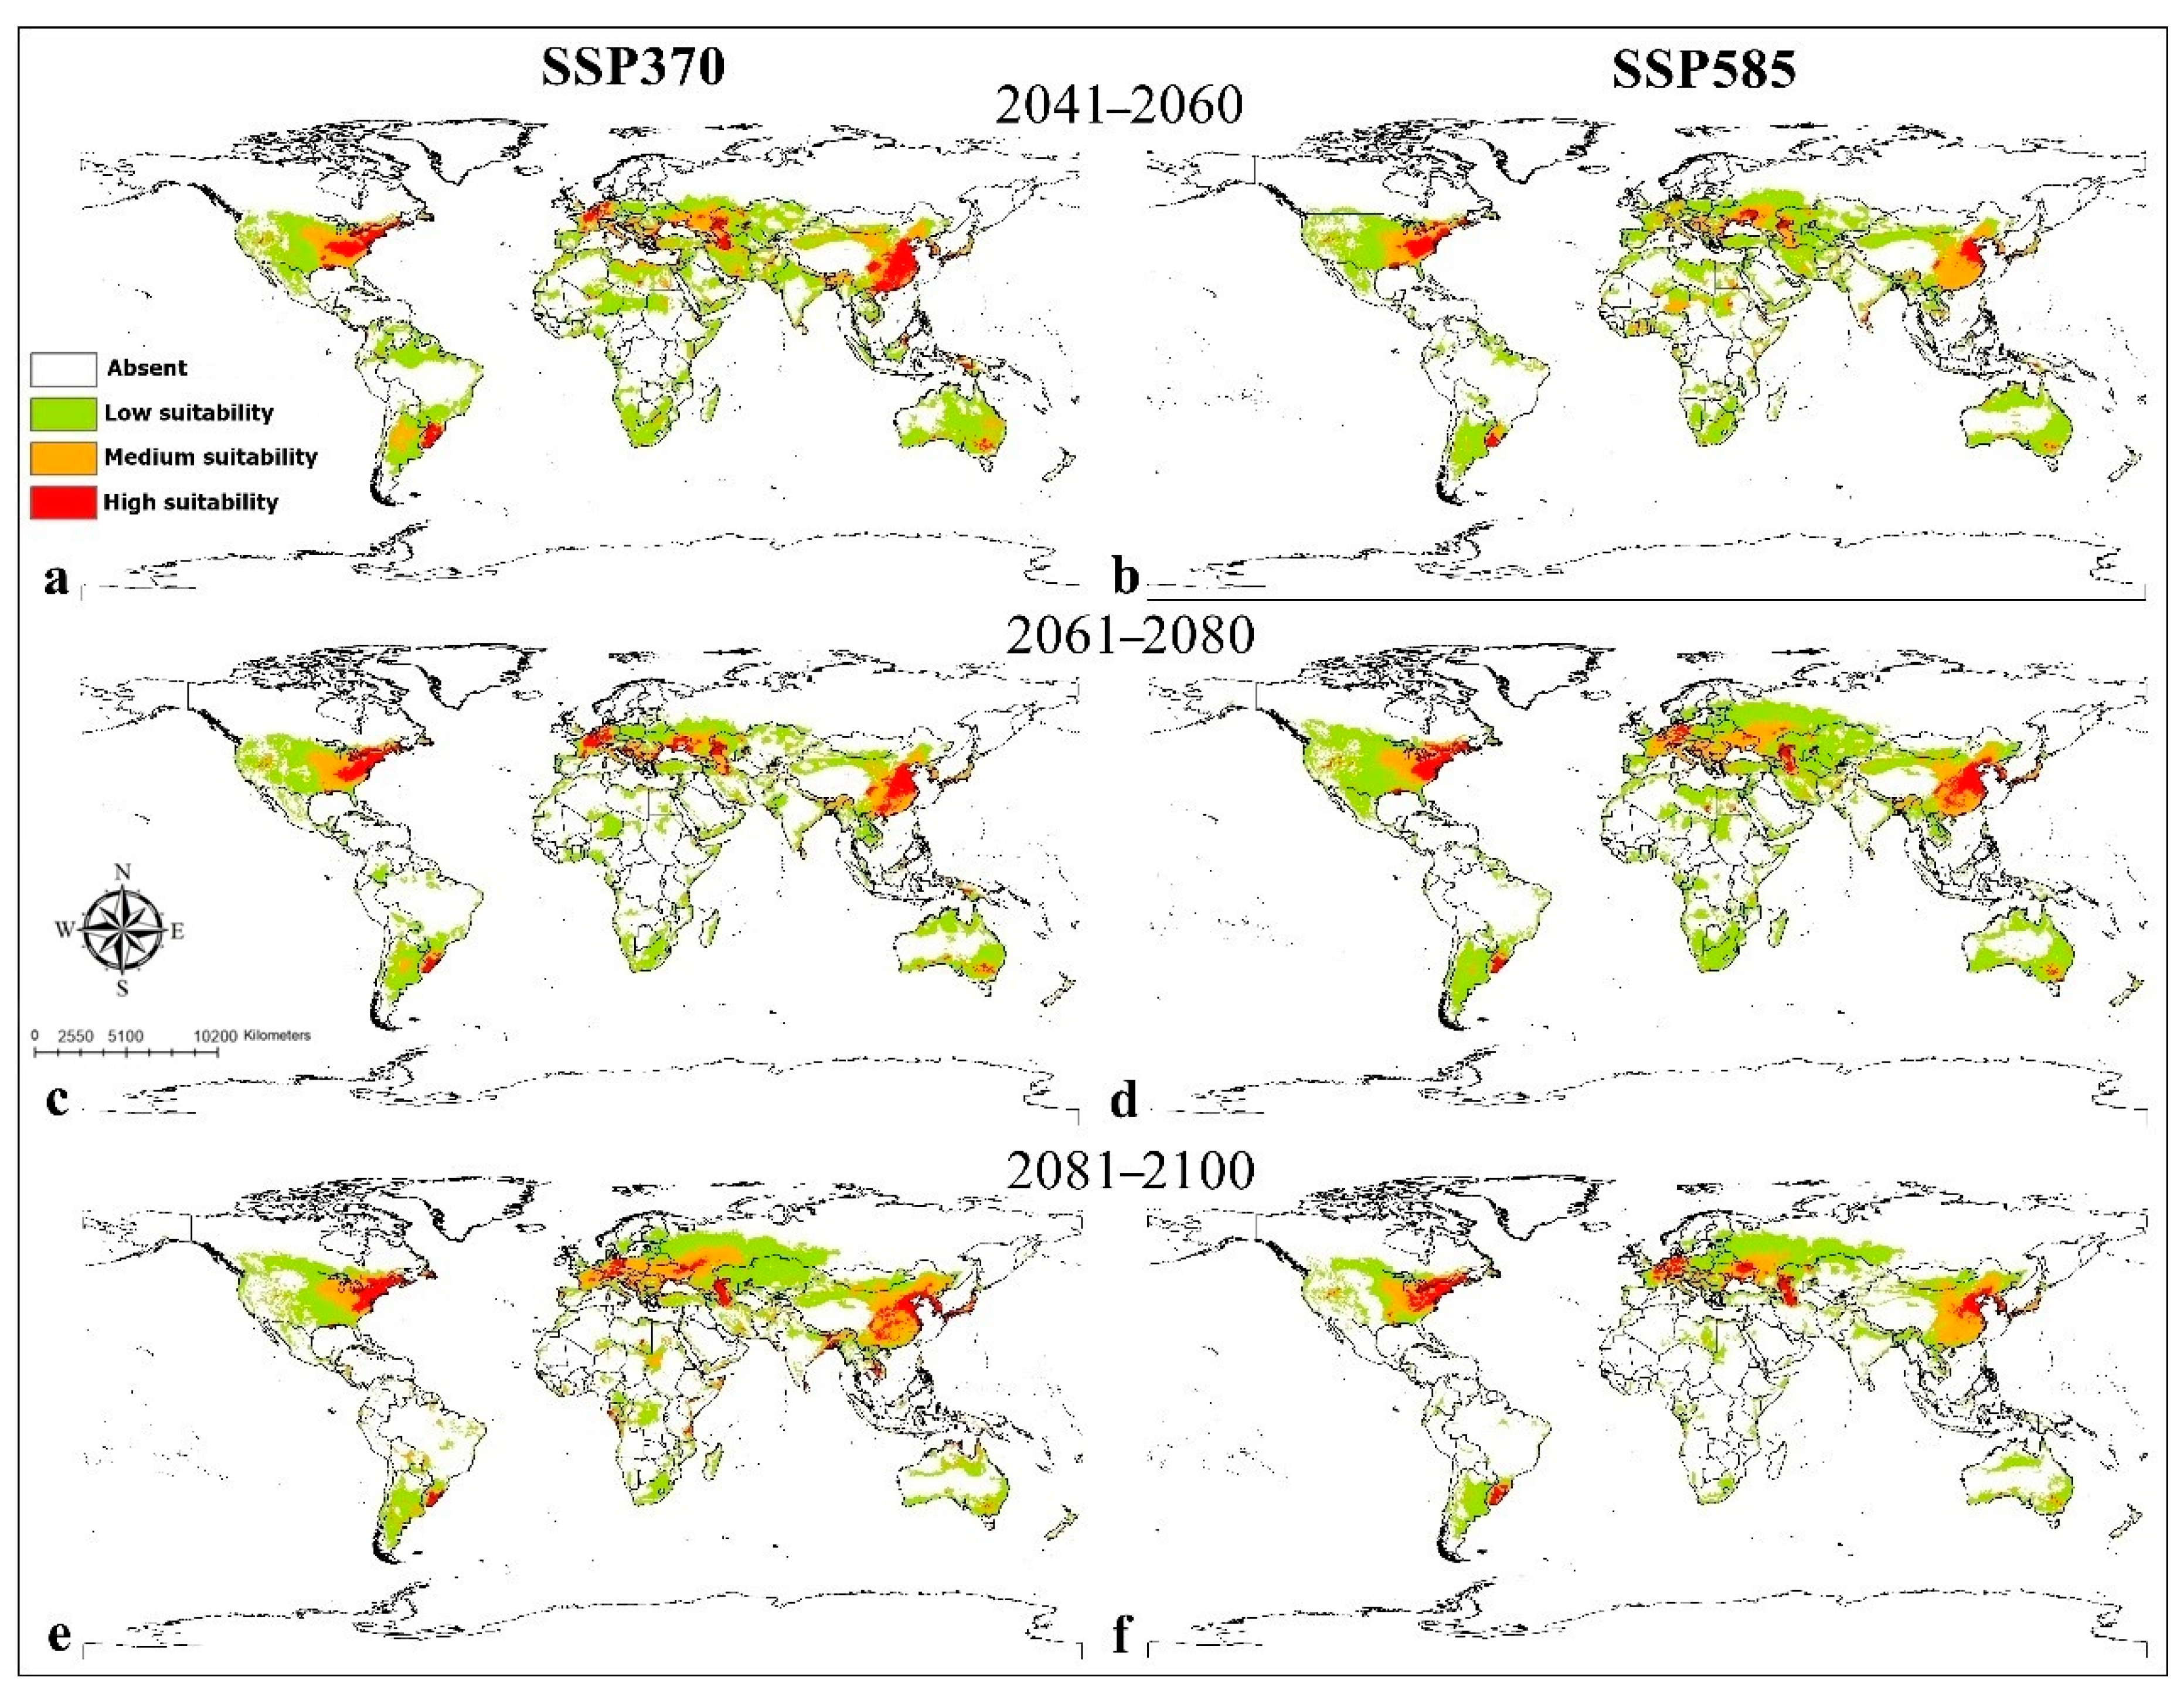
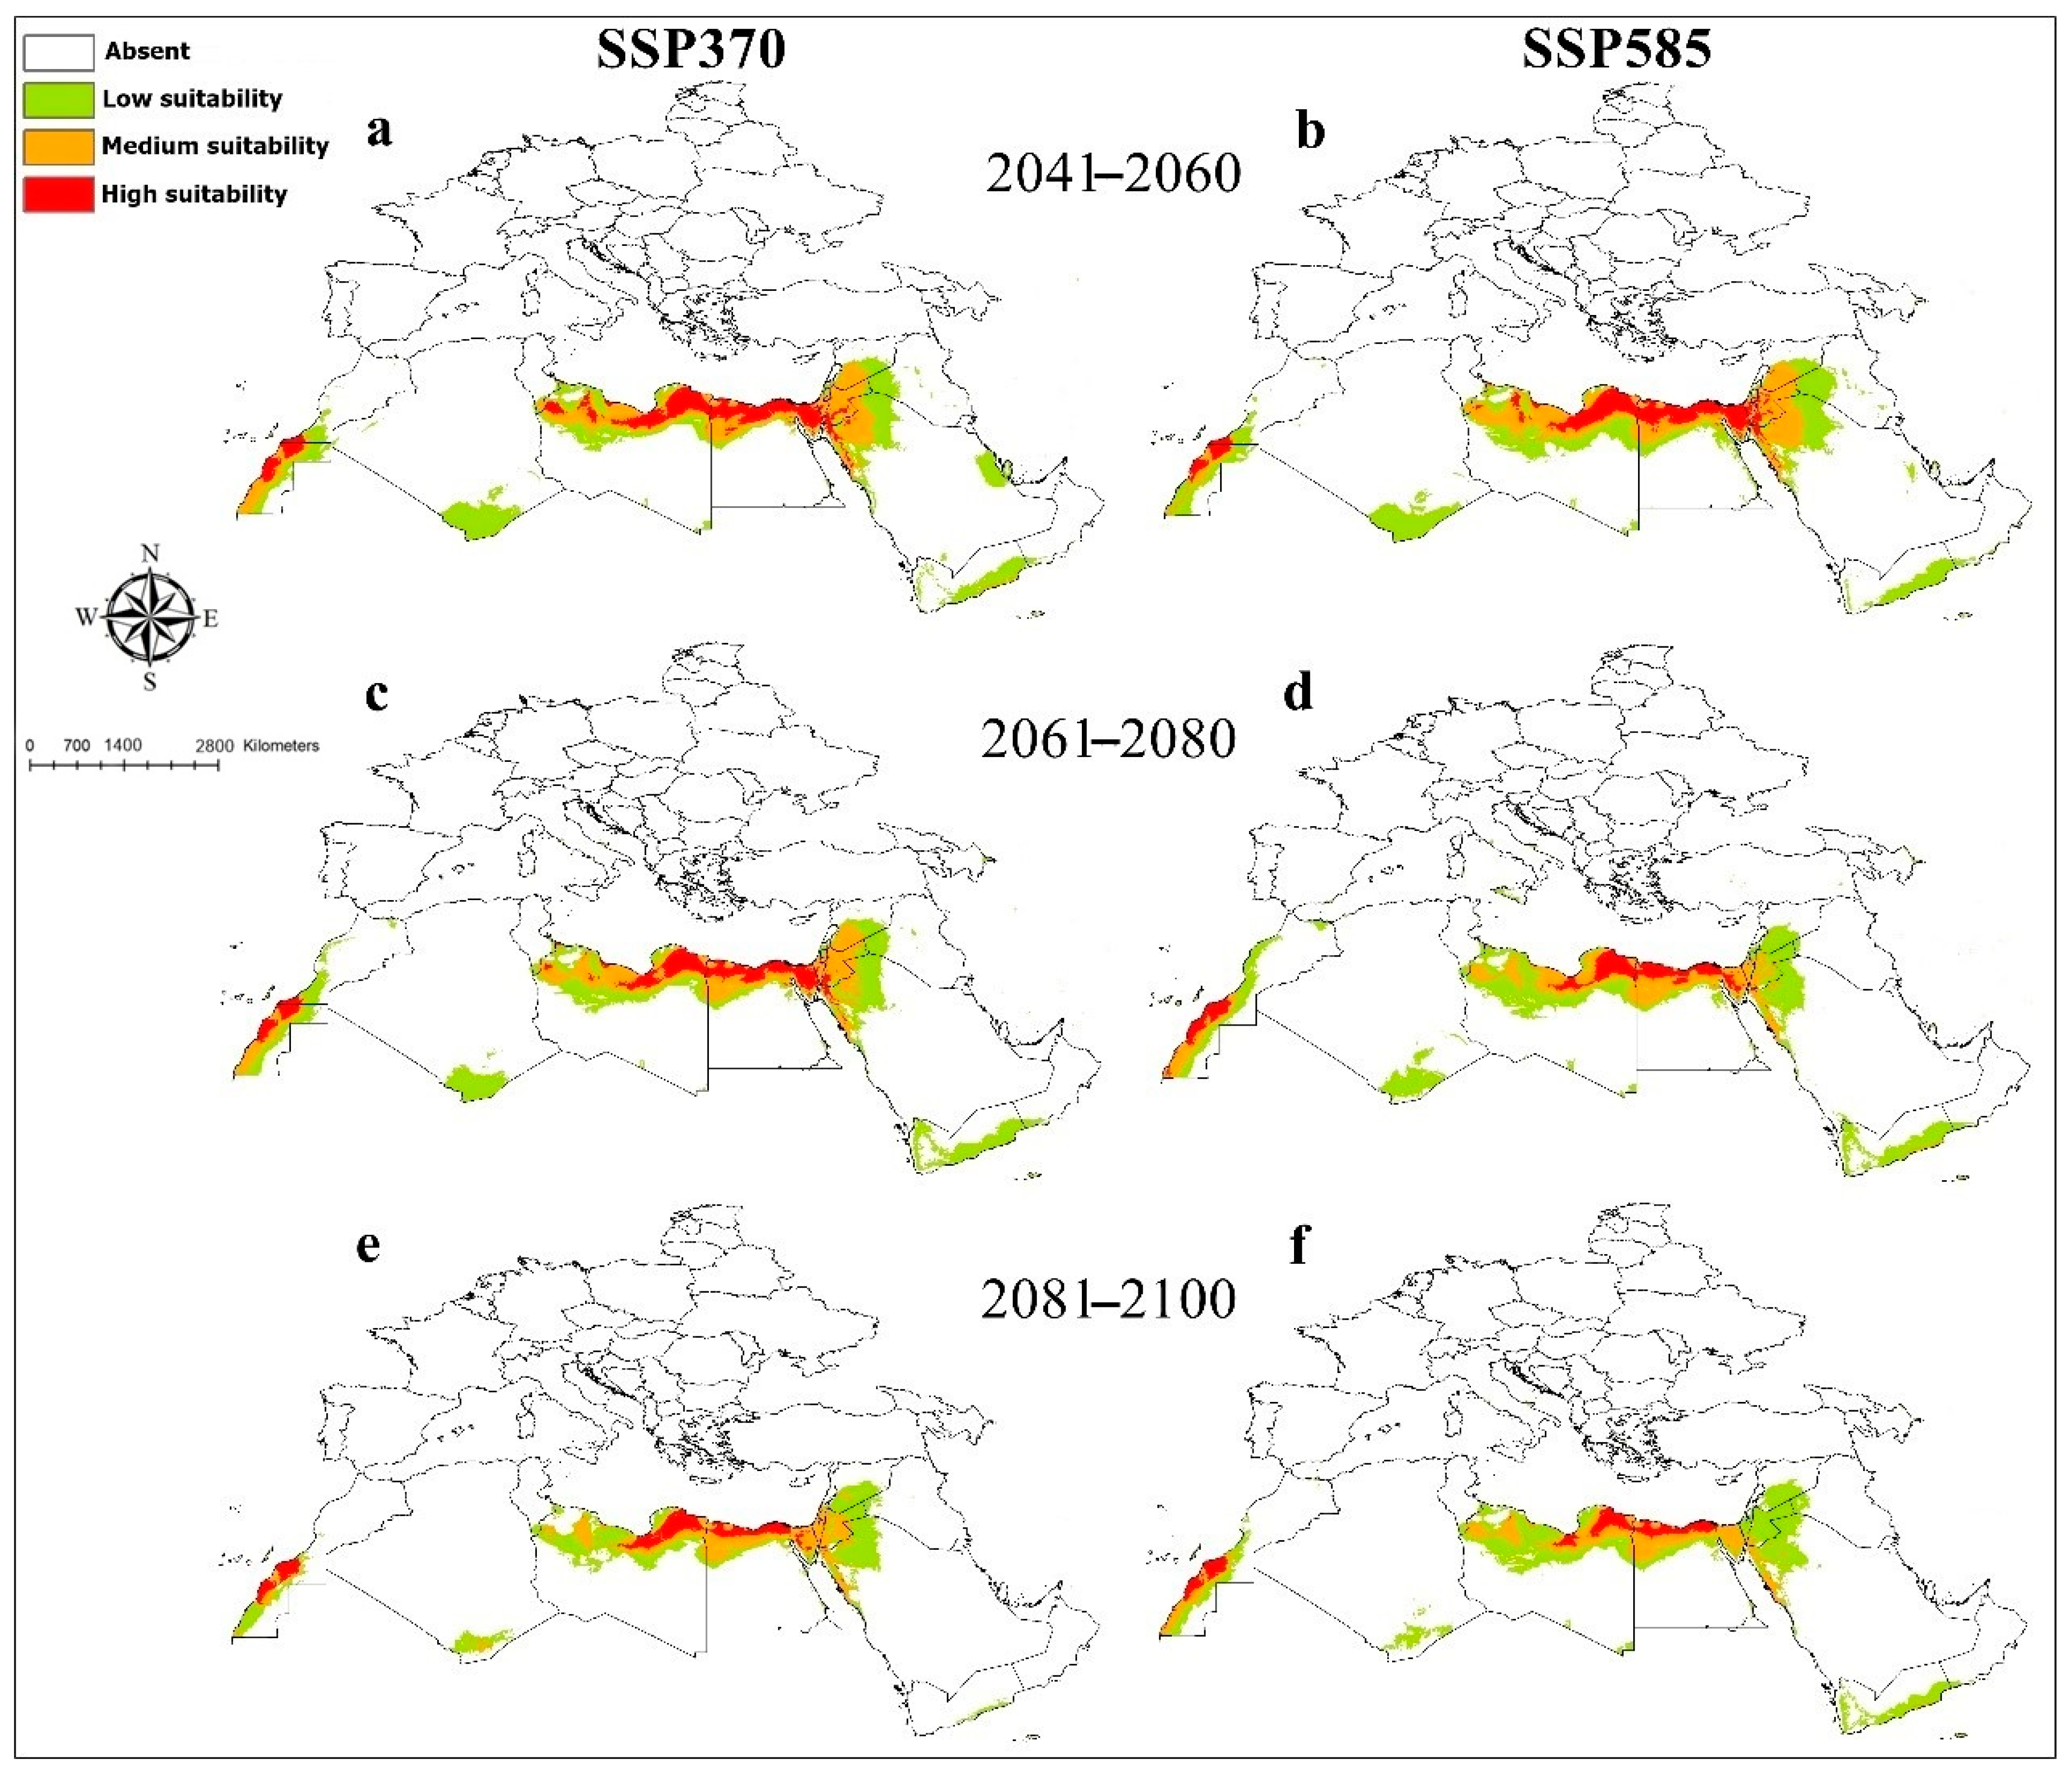
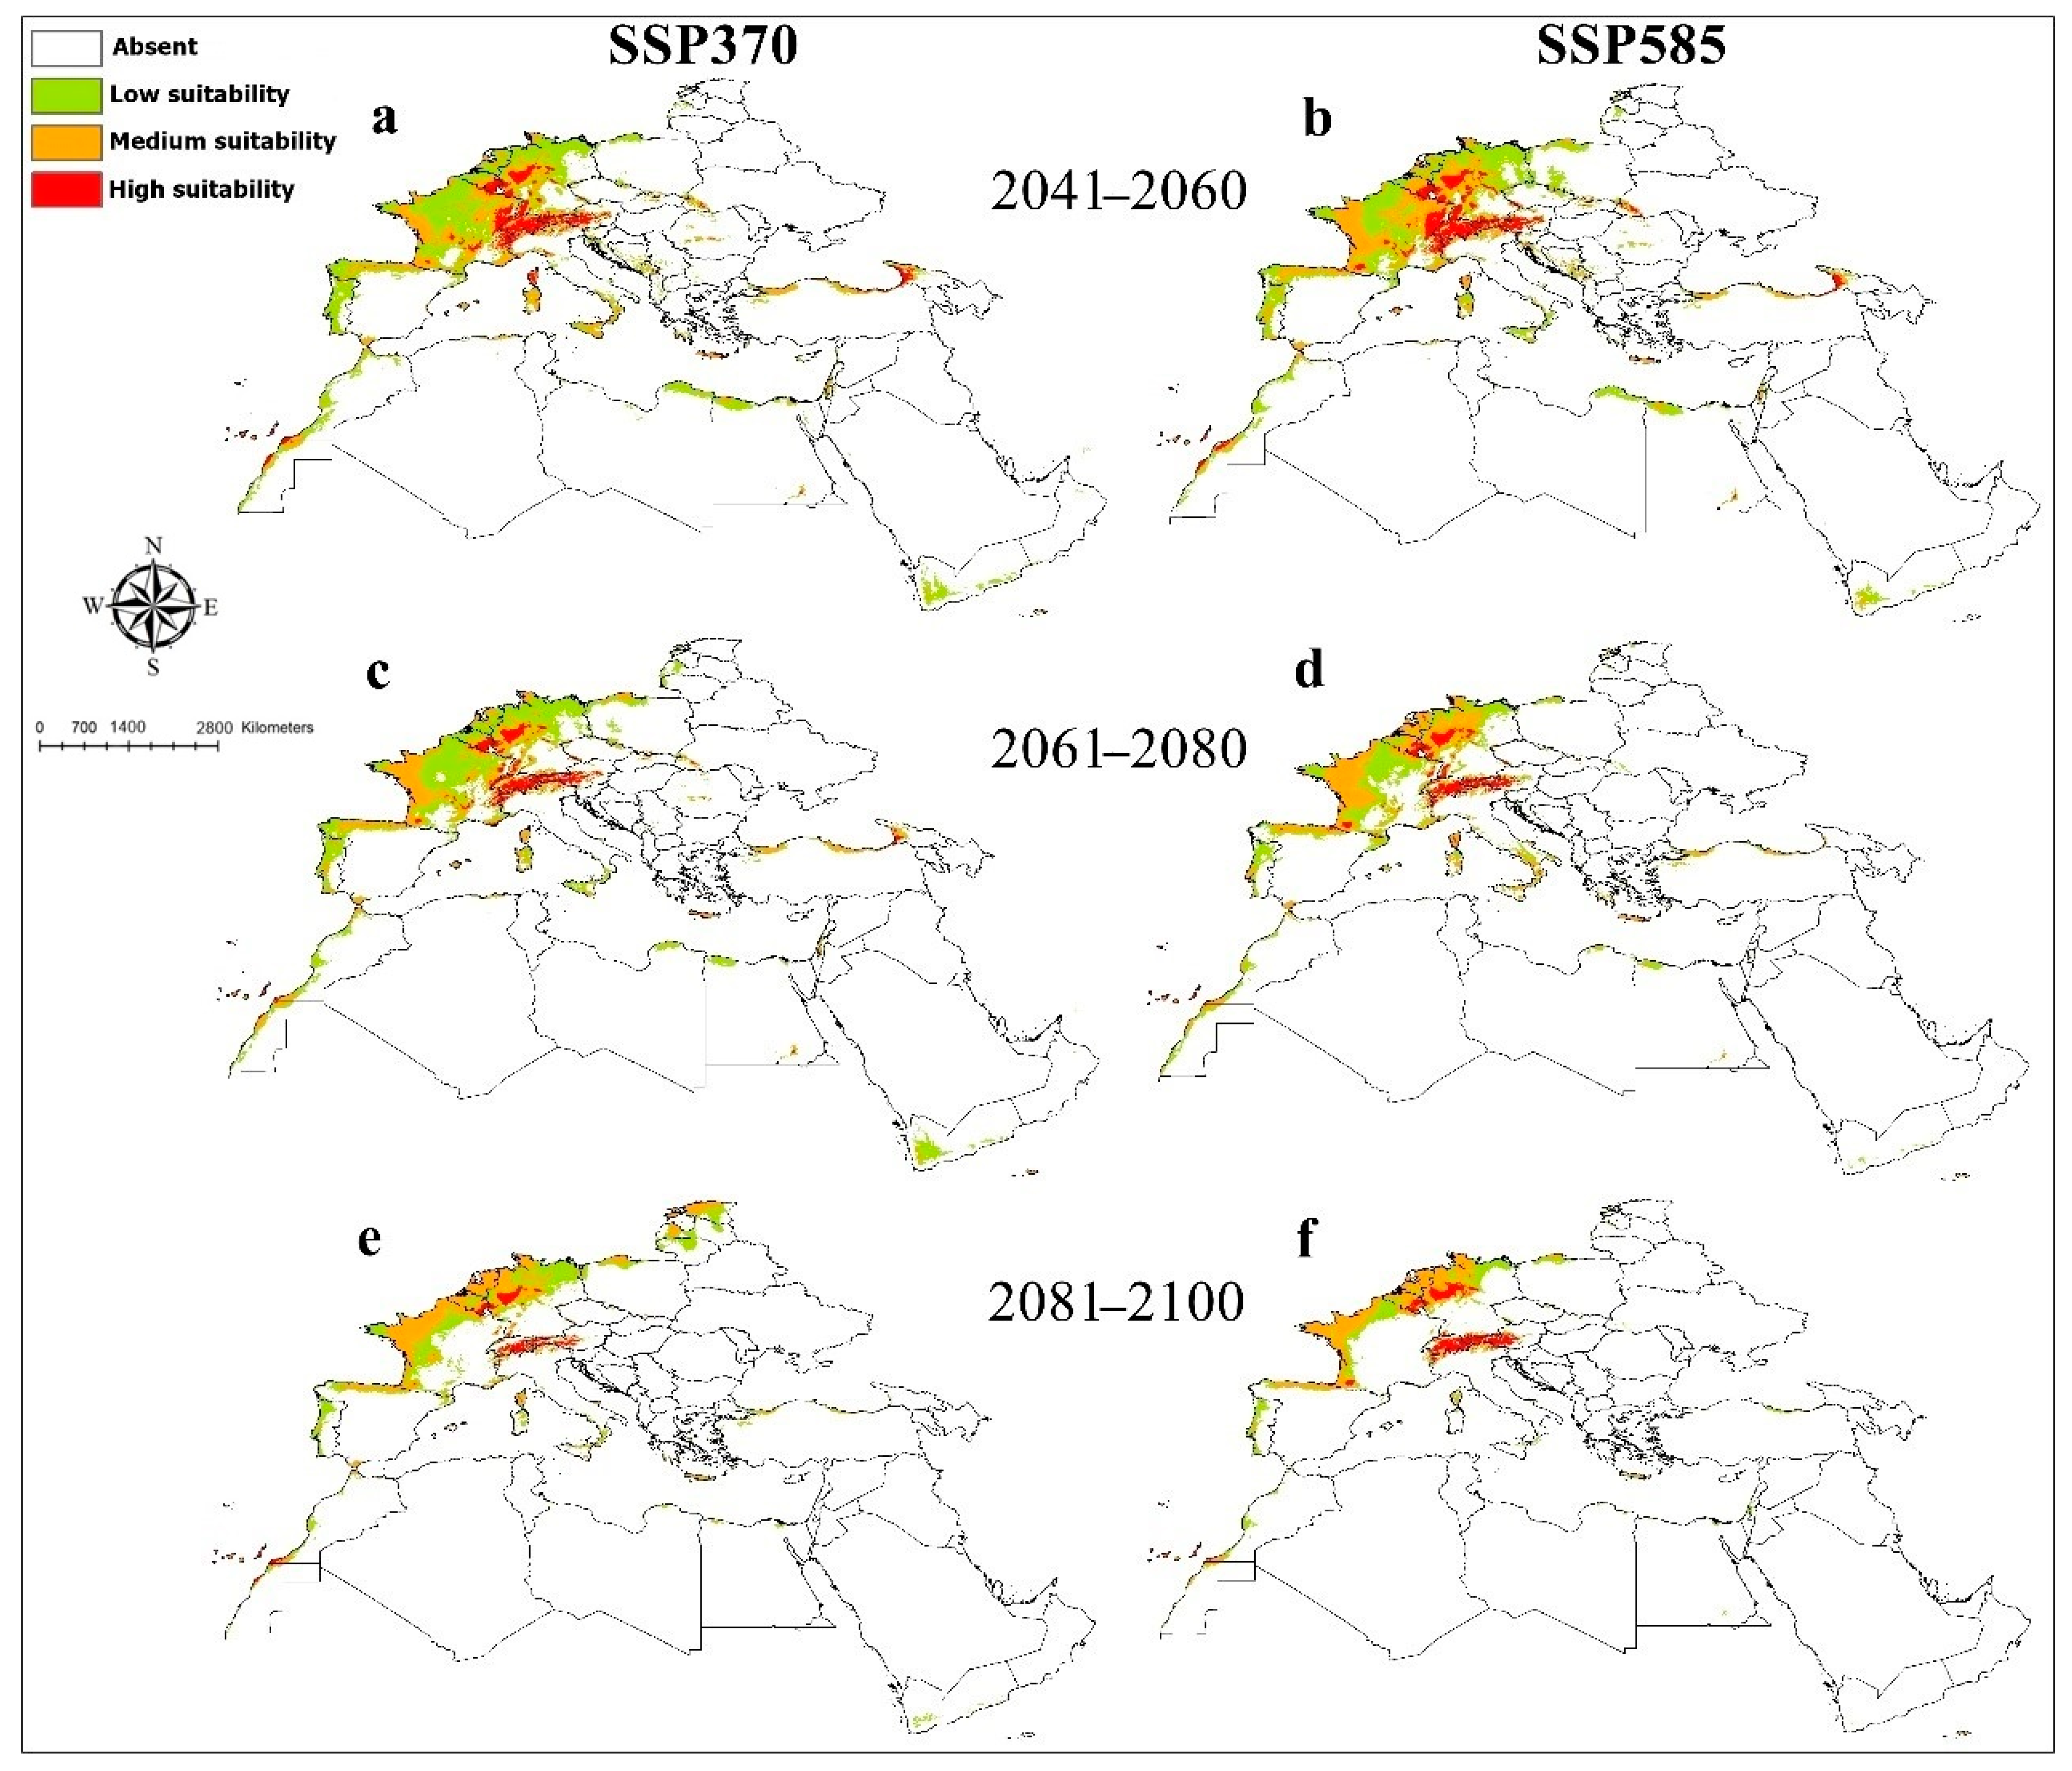
The Grinnellian niche model for each species was estimated based on the maximum entropy model (MaxEnt version 3.3.3; [38]; http://www.cs.princeton.edu/wschapire/maxEnt/, accessed on 19 February 2022). MaxEnt algorithm uses presence-only data to predict the habitat suitability models and works well with smaller sample sizes than other modeling methods [39,40]. It estimates habitat suitability for the species that varies from 0 (low suitability) to 1 (high suitability) and produces a response curve for each predictive climatic variable [17]. For each species, the bioclimatic layers were clipped to match the dimensions of the study area by using the “extract by mask” function implemented in ArcGIS software V. 10.3 and saved in ASCII grid format for implementation in the MaxEnt software version 3.3.3 [17]. We used bootstrap function in MaxEnt to run 100 replicates for each species and averaged the results. To avoid clamped pixels and the risk of over-predictions from the final predictions under future climate scenarios, clamping and extrapolation options in MaxEnt were deactivated [41,42]. To compare the predictions between current and future, we estimated the total number of suitable pixels for each species in current and each scenario in future by using “Project Raster” and “Raster Calculator” functions available in ArcGIS 10.3. Three approaches were used to measure the model performance for each species: the area under the curve (AUC), true skill statistics (TSS), and partial receiver operating characteristic (pROC) statistics [43,44,45]. The value of AUC is between 0.5 and 1, where 0.5 (the model not better than random) and >0.9 (excellent model) [46,47]. The accuracy of the predicted models was assessed using true skill statistics (TSS), where the TSS values vary from −1 to 1. Values close to negative indicate that the potential distribution is not much better than random, whereas positive values represent strong association between the predicted models and actual distribution of species [45]. The model predictions were also evaluated using the partial ROC (pROC) statistics to test model performance using the Partial ROC function available in ENMGadgets package version 0.1.0.1 for R 3.6.1 (Supplementary File S4) [48,49].

3. Results

Models for the five species performed better than random, with average AUC values ranging from 0.96 to 0.97. The results of the TSS show a high degree of confidence with values of 0.73, 0.82, 0.87, 0.78, and 0.8 for C. flavipes, C. sicula, Co. coturnix, M. minutissima, and O. submicans, respectively. ENMs for six wild bee species were significantly better than random expectations in partial ROC analyses for all models, with AUC ratios uniformly above null expectations (p < 0.001; Table 2).
The current and future predictions of the distribution of the species as modeled are as follows: The MaxEnt model for C. flavipes gave satisfactory results with an AUC value of 0.96. Current suitable habitats for C. flavipes were predicted to be high in the northeast part of Libya, Egypt in the north, South Sinai and the west, the east coast of the Gulf of Suez in the Eastern Desert, the Sinai Peninsula, and the Suez, Port Said, and Ismailia governorates. This would also include some areas in the Lower Nile valley, including the Delta and Western Desert, and also zones in Palestine and Israel that showed highly suitable habitats (Figure 1). Medium and lower occurrences were predicted in Libya, Egypt, Western Sahara, Morocco, Saudi Arabia in Red Sea coast, Palestine, and Israel; small patches in Jordan, Yemen, Oman, Tunisia, and Algeria; and limited narrow zones in South Italy and Spain. The mean annual temperature (Bio1) showed higher effects on the distribution of C. flavipes relative to other predictive variables (Supplementary File S5). The habitat suitability of C. flavipes decreased sharply with increasing the mean annual temperature (Supplementary File S6). Averaged future predictions for three climatic scenarios in SSPs 370 and 585 from 2041 to 2100 showed that C. flavipes decreased in their suitable habitats under changing climates (Figure 2). The predictions showed differences between diverse SSPs from 2041 to 2100. Between the present day and future, the suitable habitat pixels of C. flavipes decreased by 46%, 61.8%, 60.5%, 65%, 66%, and 59.3% in three timelines: 2041–2060, 2061–2080, and 2081–2100 under SSP 370 and SSP 585 (Supplementary File S7).
The model performance for C. sicula performed very well, resulting in an average AUC value of 0.97. The current prediction showed highly suitable areas in a limited narrow zone along the Mediterranean coast of Greece, France, Spain, Tunisia, Algeria, Morocco, South Italy, and the Atlantic coasts of Portugal. Medium and lower suitable habitats were predicted in the Coastal strip and Sinai Peninsula in Egypt and North Libya and narrow zones in Algeria, Syria, Lebanon, Jordan, Tunisia, Yemen, Morocco, Western Sahara, Greece, France, Spain, Italy, Portugal, and Turkey (Figure 1). Temperature annual range (Bio7) was the most important predictor of C. sicula’s habitat distribution (Supplementary File S5). The environmental suitability of C. sicula decreased sharply with increasing the temperature annual range (Supplementary File S6). Averaged future predictions for three climatic scenarios in SSPs 370 and 585 from 2041–2100 showed that C. sicula suffered from future habitat loss in North Africa, whereas low suitable habitats were predicted to occur in Western Europe under climate change that were not present in current conditions (Figure 3). The predictions showed differences between diverse SSPs from 2041 to 2100. Between the present day and future, the suitable habitat pixels of C. sicula decreased by 29.40%, 30.30%, 30%, 24.60%, 6%, and 46.20% in three timelines: 2041–2060, 2061–2080, and 2081–2100 under SSP 370 and SSP 585 (Supplementary File S7).
The Maxent model for Co. coturnix performed very well, with an average AUC value of 0.96. High-potential areas in current condition were anticipated in Upper Egypt, France, China, South Brazil, Uruguay, South Australia, and Eastern United States (Figure 4). Medium and lower suitable habitats were predicted in South and West Europe, North and South Africa, West, Central, and Southeast Asia, China, India, Australia, United States, Brazil, Paraguay, and Argentina. Precipitation seasonality (Bio15) contributed most to the prediction model (Supplementary File S5). The suitability of habitat for Co. coturnix decreased with increasing the precipitation seasonality (Supplementary File S6). Averaged future predictions for three climatic scenarios in SSPs 370 and 585 from 2041–2100 showed that Co. coturnix increased in their suitable habitat in all scenarios and the range of expansion was indicated in Europe, Asia, and United States; however, this species suffered from habitat loss in North Africa in two scenarios in SSP 370 from 2061 to 2080 and SSP 585 from 2081 to 2100 (Figure 5). The predictions showed differences between diverse SSPs from 2041 to 2100. Between the present day and future, suitable habitat pixels of Co. coturnix were anticipated to increase by 38.10%, 18.70%, 9%, 40.50%, 25.40%, and 0.30% in three timelines: 2041–2060, 2061–2080, and 2081–2100 under SSP 370 and SSP 585 (Supplementary File S7).
The model performance for M. minutissima was better than random, with an AUC value of 0.96. The environmentally suitable areas in current condition were high in North Libya, Sinai Peninsula, some areas in Lower Nile valley, including the Delta and Western Desert in Egypt, limited narrow zones in Morocco, Western Sahara, Syria, Israel, and Palestine, and Saudi Arabia in the Red Sea coast and Jordan. Medium and lower suitable habitats were anticipated in Egypt, Libya, South Algeria, Western Sahara, Saudi Arabia, Syria, Jordan, Israel, Palestine, Iraq, Qatar, and Yemen (Figure 1). Precipitation of driest quarter (Bio17) was the strongest predictor for M. minutissima distribution (Supplementary File S5). The probability of the presence of M. minutissima sharply decreased with the increase in precipitation of driest quarter (Supplementary File S6). Averaged future predictions for three climatic scenarios in SSPs 370 and 585 from 2041–2100 showed that M. minutissima decreased in their suitable habitats under changing climates, particularly in SSPs 370 and 585 for the years from 2081 to 2100 (Figure 6). The predictions showed differences between diverse SSPs from 2041 to 2100. Between the present day and future, suitable habitat pixels of M. minutissima were anticipated to decrease by 16.00%, 7.00%, 22.30%, 13.50%, 47%, and 31.30% in three timelines: 2041–2060, 2061–2080, and 2081–2100 under SSP 370 and SSP 585 (Supplementary File S7).
The Maxent model for O. submicans had an AUC value of 0.96. The predicted distribution of this species showed areas with high suitability in Western Europe in France and Germany, Central Europe in Austria and Switzerland, and Southeast Europe in Croatia, Bosnia, Herzegovina, Montenegro, and North Italy (Figure 1). Medium and lower suitable habitats were predicted in West and South Europe, North Africa, the Black Sea coast of Turkey, Israel, Yemen, Palestine, Jordan, and Syria. Temperature annual range (Bio7) provided the most useful information for O. submicans (Supplementary File S5). The probability of the presence of O. submicans decreased with increasing the temperature annual range (Bio7) (Supplementary File S6). Averaged future predictions for three climatic scenarios in SSPs 370 and 585 from 2041–2100 showed that O. submicans decreased in their suitable habitats in North Africa, West, Central, and South Europe, particularly in SSPs 370 and 585 for the years from 2081 to 2100 (Figure 7). The predictions showed differences between diverse SSPs from 2041 to 2100. Between the present day and future, suitable habitat pixels of O. submicans decreased by 36.00%, 37.70%, 46.10%, 56.70%, 62%, and 73.40% in three timelines: 2041–2060, 2061–2080, and 2081–2100 under SSP 370 and SSP 585, respectively (Supplementary File S7).

4. Discussion

In recent years, several studies have used ecological niche modeling to anticipate current and future potential distributions of endangered and economically important species and to support conservation priorities and forecasting strategies [14,17,18,19,20,21,46,50,51,52,53]. The present study predicts the potential distribution of five wild megachiline bee species and indicates that four of them (C. flavipes, C. sicula, M. minutissima, and O. submicans) will be exposed to habitat loss in the future according to prediction maps (Figure 2, Figure 3, Figure 6, and Figure 7). Therefore, conservation efforts and climate adaptation strategies for these wild bee species are urgently needed in North Africa, especially in Egypt.
Natural populations of wild bee species and other insects contributed greatly to the pollination of many vital crops [54]. Almost 40% of the annual value of crops under consideration represented the net returns derived from bee pollination. More than 99% of these advantages are attributed to pollination by feral bees [55]. Climate change and habitat loss are considered the main factors of bee decline [20]. According to current and future prediction models, we conclude that C. flavipes and M. minutissima seem to suffer from habitat loss more than C. sicula and O. submicans. This is likely owing to the fact that C. flavipes and M. minutissima lack suitable habitats in Europe under current conditions, thereby preventing migration into Europe as North Africa becomes less habitable. Conversely, C. sicula and O. submicans, although potentially suffering from habitat loss in North Africa, should have suitable habitats present in Europe, at least allowing for the possibility of a shift in their distributions. The studied species varied in their sensitivity to climatic variables. The distribution of C. sicula, C. flavipes, and O. submicans decreased with the increase in the temperature. Chalicodoma sicula is a winter-flying species, whereas C. flavipes and O. submicans are vernal species [12]. Under expected future climatic changes, these species are expected to decline. Bees are sensitive to environmental temperatures in several ways, especially during overwintering, in addition to notable reductions in foraging time. Temperature was the most important predictor of urban bee abundance [56]. This was clearly reported in several bumble bee species [57], but these, however, tend to nest in hollows in the ground. Species such as those included in the current study are cavity nesting and, like all above-ground nesters, are more sensitive to increased temperature than ground-nesting bees, which are better insulated against high temperatures [58]. Warmer winter temperatures decreased the body weight and fat body content of Osmia rufa [59]. In another species of the same genus, O. lignaria, exposure to cold temperatures was necessary for the completion of diapause [60]. On the other hand, the distribution of M. minutissima and Co. coturnix have decreased with the increase in precipitation. Both species, host and parasite, are early summer species [12,61] and live in exceptionally dry areas, such as central Saudi Arabia and the Mediterranean [62]. Precipitation had an indirect effect on the bee diversity, and bees responded negatively to rainfall, but high precipitation positively affected flower resources. It resulted in a severe restriction for soil-nesting bees, whereas, alternatively, the increased availability of cavities in plants and other materials could favor cavity-nesting species [63]. Ultimately, it is possible that both species are less sensitive to climate change, and the decline of M. minutissima would be more greatly impacted by other anthropogenic and environmental factors [64].
In North Africa, C. sicula, C. flavipes, and O. submicans all suffered and decreased in their suitable habitats under changing climate. This result matches observations over the last two decades, with the destruction of mud walls where those species nest and the changes in villages into urban and suburban areas (Supplementary File S8) [64,65,66]. The effects of urbanization on wild bees remain unclear in many cases and are not comprehensively understood, and these could offer some benefits such as grasslands and expanded foraging areas [67,68]. There are some examples of anthropogenic influences benefiting bees [69], but, in most cases, habitat loss and fragmentation have far more devastating impacts [70,71,72]. Urbanization negatively affects bee communities through reductions in nesting sites, frequent losses of foraging areas, increased toxicity from wastes and gas fumes, and urban warming [73]. Urbanization has more negative impacts on ground-nesting bees than cavity-nesting bees [74,75,76]. Nonetheless, cavity-nesting bees are vulnerable to changes in suitable nesting resources in urban areas due to the destruction and removal of nesting sites [77]. Yet, some remedies have been documented, such as those of O. bicornis, where reductions in nesting sites were partially offset by artificial nests from conservation programs [78]. The same protocols of conservation were prepared in the last two decades for trapping all studied species in Egypt but on a smaller scale [66].
Parasites are another factor in addition to climate change and urbanization that can affect the decline of cavity-nesting bees Egypt. Several species of cleptoparasitic bees, such as Co. decipiens Spinola 1838, Co. coturnix Pérez 1884, and Radoszkowskiana rufiventris (Spinola 1838), are associated with many different megachilid species (Supplementary File S8) [12,61]. We studied the future scenarios of one such cleptoparasitic species, Co. coturnix, and we reached the conclusion that this species would be abundant in suitable available habitat. This species was recorded recently as invasive in the USA [79], a result that concurs with our current and future predictions. Species of Coelioxys have been recorded attacking species of the genus Megachile, sometimes with high infestation rates [80,81,82] but also victimizing other genera [83]. Naturally, the cleptoparasites rely on the occurrences of their host bees. If the host bees are negatively impacted by climate and other changes, then the cleptoparasites will also be negatively influenced by a reduction in their hosts. A greater challenge, however, is whether already weakened and reduced populations will be exacerbated by increased infestation rates caused by increased suitability for the parasites. If this is the case, then even if wild pollinators persist, albeit at significantly reduced levels, despite loss of nesting sites, increased temperatures, and other negative anthropogenic influences, the increased parasite load could push such populations over the edge, further leading to local extirpation and the cascade of negative influences on food and economic security in the region.

5. Conclusions

Bees are threatened by several environmental and anthropogenic factors that might lead to pollination deficits and losses of plant genetic diversity. Public awareness of current stressors on bees would be useful for better conservation. Still, some factors are controversial between positive and negative impacts, so they should be studied and emphasized case by case. The present study revealed that three factors would lead to cavity nesting bees’ extinction across Egypt, including climate change, urbanization (habitat loss), and cuckoo bees (cleptoparasitism). Conservation efforts must be undertaken to protect these species. All the studied species except C. coturnix are important pollinators for several crops such as Egyptian clover, alfalfa, and broad bean. Given this, the conservation of these populations is crucial for better seed production and food security in the region. The results of this study suggest that increased efforts should be made for the construction, establishment, and protection of artificial nesting sites to ensure the presence of the bees and promote ecosystem sustainability. This study encourages similar studies in other regions and with bee groups such as ground-nesting bees to reveal potential impacts. Ultimately, stronger and more comprehensive efforts must be made to conserve bees, thereby ensuring their future pollination services.

Supplementary Materials

The following supporting information can be downloaded at: https://www.mdpi.com/article/10.3390/d15121172/s1, Supplementary File S1: URL links for GBIF and Inaturalist containing the row data for the studied bee species. Supplementary File S2: Final occurrence records for all studied bee species. Supplementary File S3: Environmental variables used in Maxent to predict the habitat suitability distribution for the five target species. Variables with (–) sign were removed because of high cross-correlations. Supplementary File S4: R script code for PartialROC analysis. Supplementary File S5: Jacknife for each species show the most effective environmental variables and their contribution on produced models. Supplementary File S6: Response curves showing the relationships between the probability of presence of each species and one top bioclimatic predictor: values shown are average over ten replicate runs. Supplementary File S7: Number of suitable pixels in current and future (2041–2100) climate conditions for bee species. Supplementary File S8: (a) and (b) Two old mud walls of houses surrounded by new houses and would be exchanged with new houses; (c) and (d) Habitat of two cavity nesting bees of C. nigripes and C. sicula; (e) and (f) Two species of cleptoparasitic bees Coelioxys decipiens and Radoszkowskiana rufiventris (Spinola, 1838).

Author Contributions

Conceptualization, M.O., M.S.E. and M.A.S.; methodology, M.O., M.S.E. and M.A.S.; software, M.O., M.S.E. and M.A.S.; validation, M.O., M.S.E. and M.A.S.; formal analysis, M.O., M.S.E. and M.A.S.; investigation, M.O., M.S.E. and M.A.S.; resources, M.O., M.S.E. and M.A.S.; data curation, M.O., M.S.E. and M.A.S.; writing—original draft preparation, M.O., M.S.E. and M.A.S.; writing—review and editing, M.O., M.S.E. and M.A.S.; visualization, M.O., M.S.E. and M.A.S.; supervision, M.O., M.S.E. and M.A.S.; project administration, M.O., M.S.E. and M.A.S. All authors have read and agreed to the published version of the manuscript.

Funding

This research received no external funding.

Institutional Review Board Statement

Not applicable.

Data Availability Statement

The data supporting the results of this manuscript are available through direct (and reasonable) request to the corresponding authors.

Acknowledgments

We thank the Department of Entomology of Ain Shams University and Department of Plant Protection, Suez Canal University for their supports of this work. We are so indebted to Soliman M. Kamel for his tireless efforts for cavity nesting bees’ conservation in Egypt.

Conflicts of Interest

The authors declare no conflict of interest.

References

  1. Michener, C.D. The Bees of the World, 2nd ed.; Johns Hopkins University Press: Baltimore, MD, USA, 2007; p. 953. [Google Scholar]
  2. Freitas, B.M.; Paxton, R.J. A comparison of two pollinators: The introduced honey bee Apis mellifera and an indigenous bee Centris tarsata on cashew Anacardium occidentale in its native range of NE Brazil. J. Appl. Ecol. 1998, 35, 109–121. [Google Scholar] [CrossRef]
  3. Garibaldi, L.A.; Steffan-Dewenter, I.; Winfree, R.; Aizen, M.A.; Bommarco, R.; Cunningham, S.A.; Kremen, C.; Carvalheiro, L.G.; Harder, L.D.; Afik, O.; et al. Wild Pollinators Enhance Fruit Set of Crops Regardless of Honey Bee Abundance. Science 2013, 339, 1608–1611. [Google Scholar] [CrossRef] [PubMed]
  4. Greenleaf, S.S.; Kremen, C. Wild bees enhance honey bees’ pollination of hybrid sunflower. Proc. Natl. Acad. Sci. USA 2006, 103, 13890–13895. [Google Scholar] [CrossRef] [PubMed]
  5. Vanbergen, A.J.; The Insect Pollinator Initiative. Threats to an ecosystem service: Pressures on pollinators. Front. Ecol. Environ. 2013, 11, 251–259. [Google Scholar] [CrossRef]
  6. Shebl, M.A.; Ben Abdelkader, F.; Bendifallah, L.; Benachour, K.; Bataw, A.A.; Bufliga, E.M.; Osman, M.A.; Kamel, S.M. The melittology research in northern Africa and the Middle East: Past and present situations. J. Basic Appl. Zool. 2021, 82, 18. [Google Scholar] [CrossRef]
  7. Cane, J.H.; Tepedino, V.J. Causes and extent of declines among native North American invertebrate pollinators: Detection, evidence, and consequences. Conserv. Ecol. 2001, 5, 1. [Google Scholar] [CrossRef]
  8. Kevan, P.G.; Phillips, T.P. The economic impacts of pollinator declines: An approach to assessing the consequences. Conserv. Ecol. 2001, 5, 8. [Google Scholar] [CrossRef]
  9. Biesmeijer, J.C.; Roberts, S.P.M.; Reemer, M.; Ohlemüller, R.; Edwards, M.; Peeters, T.; Schaffers, A.P.; Potts, S.G.; Kleukers, R.; Thomas, C.D.; et al. Parallel declines in pollinators and insect-pollinated plants in Britain and the Netherlands. Science 2006, 313, 351–354. [Google Scholar] [CrossRef]
  10. Ollerton, J. Pollinator diversity: Distribution, ecological function, and conservation. Annu. Rev. Ecol. Evol. Syst. 2017, 48, 353–376. [Google Scholar] [CrossRef]
  11. Brading, P.; El-Gabbas, A.; Zalat, S.; Gilbert, F. Biodiversity economics: The value of pollination services to Egypt. Egypt. J. Biol. 2009, 11, 46–51. [Google Scholar]
  12. Shebl, M.; Kamel, S.; Mahfouz, H. Bee fauna (Apoidea: Hymenoptera) of the Suez Canal region, Egypt. J. Apic. Sci. 2013, 57, 33–44. [Google Scholar] [CrossRef]
  13. Osman, M.A.M.; Shebl, M.A. Vulnerability of crop pollination ecosystem services to climate change. In Climate Change Impacts on Agriculture and Food Security in Egypt: Land and Water Resources—Smart Farming—Livestock, Fishery, and Aquaculture; Ewis Omran, E.-S., Negm, A.M., Eds.; Springer International Publishing: Cham, Switzerland, 2020; pp. 223–247. [Google Scholar]
  14. Miranda, E.A.; Carvalho, A.F.; de Jesus Gomes-Miranda, J.; de Souza, C.R.; Costa, M.A. Priority areas for conservation of orchid bees (Apidae, Euglossini) in the Atlantic Forest. J. Insect Conserv. 2019, 23, 613–621. [Google Scholar] [CrossRef]
  15. Giannini, T.C.; Acosta, A.L.; da Silva, C.I.; de Oliveira, P.E.A.M.; Imperatriz-Fonseca, V.L.; Saraiva, A.M. Identifying the areas to preserve passion fruit pollination service in Brazilian Tropical Savannas under climate change. Agric. Ecosyst. Environ. 2013, 171, 39–46. [Google Scholar] [CrossRef]
  16. Carvalho, A.F.; Del Lama, M.A. Predicting priority areas for conservation from historical climate modelling: Stingless bees from Atlantic Forest hotspot as a case study. J. Insect Conserv. 2015, 19, 581–587. [Google Scholar] [CrossRef]
  17. Nasser, M.; El-Hawagry, M.; Okely, M. Environmental niche modeling for some species of the genus Anthrax Scopoli (Diptera: Bombyliidae) in Egypt, with special notes on St. Catherine protected area as a suitable habitat. J. Insect Conserv. 2019, 23, 831–841. [Google Scholar] [CrossRef]
  18. Hu, X.; Liu, J.; Ding, G.; Naeem, M.; Li, J.; Ma, F.; Huang, J.; An, J. An evaluation of habitat uses and their implications for the conservation of the Chinese bumblebee Bombus pyrosoma (Hymenoptera: Apidae). Front. Ecol. Evol. 2021, 9, 667949. [Google Scholar] [CrossRef]
  19. Nascimento, A.C.; Montalva, J.; Ascher, J.S.; Engel, M.S.; Silva, D.P. Current and future distributions of a native Andean bumble bee. J. Insect Conserv. 2022, 26, 559–569. [Google Scholar] [CrossRef]
  20. Nemésio, A.; Silva, D.P.; Nabout, J.C.; Varela, S. Effects of climate change and habitat loss on a forest-dependent bee species in a tropical fragmented landscape. Insect Conserv. Divers. 2016, 9, 149–160. [Google Scholar] [CrossRef]
  21. Gonzalez, V.H.; Cobos, M.E.; Jaramillo, J.; Ospina, R. Climate change will reduce the potential distribution ranges of Colombia’s most valuable pollinators. Perspect. Ecol. Conserv. 2021, 19, 195–206. [Google Scholar] [CrossRef]
  22. Rahimi, E.; Barghjelveh, S.; Dong, P. Estimating potential range shift of some wild bees in response to climate change scenarios in northwestern regions of Iran. J. Ecol. Environ. 2021, 45, 14. [Google Scholar] [CrossRef]
  23. Syfert, M.M.; Smith, M.J.; Coomes, D.A. The effects of sampling bias and model complexity on the predictive performance of MaxEnt species distribution models. PLoS ONE 2013, 8, e55158. [Google Scholar] [CrossRef]
  24. Brown, J.L.; Bennett, J.R.; French, C.M. SDMtoolbox 2.0: The next generation Python-based GIS toolkit for landscape genetic, biogeographic and species distribution model analyses. PeerJ 2017, 5, e4095. [Google Scholar] [CrossRef] [PubMed]
  25. Okely, M.; Al-Khalaf, A.A. Predicting the potential distribution of the cattle fever tick Rhipicephalus annulatus (Acari: Ixodidae) using ecological niche modeling. Parasitol. Res. 2022, 121, 3467–3476. [Google Scholar] [CrossRef] [PubMed]
  26. Beyer, H. Hawth’s Analysis Tools for ArcGIS. 2004. Available online: http://www.spatialecology.com/htools (accessed on 7 April 2019).
  27. Fick, S.E.; Hijmans, R.J. WorldClim 2: New 1-km spatial resolution climate surfaces for global land areas. Int. J. Climatol. 2017, 37, 4302–4315. [Google Scholar] [CrossRef]
  28. Hortal, J.; Roura-Pascual, N.; Sanders, N.J.; Rahbek, C. Understanding (insect) species distributions across spatial scales. Ecography 2010, 33, 51–53. [Google Scholar] [CrossRef]
  29. Escobar, L.E.; Lira-Noriega, A.; Medina-Vogel, G.; Peterson, A.T. Potential for spread of the white-nose fungus (Pseudogymnoascus destructans) in the Americas: Use of Maxent and NicheA to assure strict model transference. Geospat. Health 2014, 9, 221–229. [Google Scholar] [CrossRef]
  30. Datta, A.; Schweiger, O.; Kühn, I. Origin of Climatic Data Can Determine the Transferability of Species Distribution Models. Neobiota 2020, 59, 61–76. [Google Scholar] [CrossRef]
  31. Dormann, C.F.; Elith, J.; Bacher, S.; Buchmann, C.; Carl, G.; Carré, G.; Marquéz, J.R.G.; Gruber, B.; Lafourcade, B.; Leitão, P.J.; et al. Collinearity: A review of methods to deal with it and a simulation study evaluating their performance. Ecography 2013, 36, 27–46. [Google Scholar] [CrossRef]
  32. Alahmed, A.M.; Naeem, M.; Kheir, S.M.; Sallam, M.F. Ecological distribution modeling of two malaria mosquito vectors using geographical information system in Al-Baha Province, Kingdom of Saudi Arabia. Pak. J. Zool. 2015, 47, 1797–1806. [Google Scholar]
  33. Di Febbraro, M.; Bosso, L.; Fasola, M.; Santicchia, F.; Aloise, G.; Lioy, S.; Tricarico, E.; Ruggieri, L.; Bovero, S.; Mori, E.; et al. Different facets of the same niche: Integrating citizen science and scientific survey data to predict biological invasion risk under multiple global change drivers. Glob. Change Biol. 2023, 29, 5509–5523. [Google Scholar] [CrossRef]
  34. Xu, Y.; Zhou, J.; Liu, T.; Liu, P.; Wu, Y.; Lai, Z.; Gu, J.; Chen, X.-G. Assessing the risk of spread of Zika virus under current and future climate scenarios. Biosaf. Health 2022, 4, 193–204. [Google Scholar] [CrossRef]
  35. Bosso, L.; Luchi, N.; Maresi, G.; Cristinzio, G.; Smeraldo, S.; Russo, D. Predicting current and future disease outbreaks of Diplodia sapinea shoot blight in Italy: Species distribution models as a tool for forest management planning. For. Ecol. Manag. 2017, 400, 655–664. [Google Scholar]
  36. Salvacion, A.R. Soil erosion modeling under future climate change: A case study on Marinduque Island, Philippines. In Water, Land, and Forest Susceptibility and Sustainability; Elsevier: Amsterdam, The Netherlands, 2023; pp. 381–398. [Google Scholar]
  37. Shao, M.; Wang, L.; Li, B.; Li, S.; Fan, J.; Li, C. Maxent Modeling for Identifying the Nature Reserve of Cistanche deserticola Ma under Effects of the Host (Haloxylon Bunge) Forest and Climate Changes in Xinjiang, China. Forests 2022, 13, 189. [Google Scholar] [CrossRef]
  38. Phillips, S.J.; Anderson, R.P.; Schapire, R.E. Maximum entropy modeling of species geographic distributions. Ecol. Model. 2006, 190, 231–259. [Google Scholar]
  39. Elith, J.H.; Graham, C.P.H.; Anderson, R.P.; Dudík, M.; Ferrier, S.; Guisan, A.; Hijmans, R.J.; Huettmann, F.; Leathwick, J.R.; Lehmann, A.; et al. Novel methods improve prediction of species’ distributions from occurrence data. Ecography 2006, 29, 129–151. [Google Scholar]
  40. Pearson, R.G.; Raxworthy, C.J.; Nakamura, M.; Peterson, A.T. Predicting species distributions from small numbers of occurrence records: A test case using cryptic geckos in Madagascar. J. Biogeogr. 2007, 34, 102–117. [Google Scholar] [CrossRef]
  41. Khanum, R.; Mumtaz, A.S.; Kumar, S. Predicting impacts of climate change on medicinal asclepiads of Pakistan using Maxent modeling. Acta Oecol. 2013, 49, 23–31. [Google Scholar] [CrossRef]
  42. Owens, H.L.; Campbell, L.P.; Dornak, L.L.; Saupe, E.E.; Barve, N.; Soberón, J.; Ingenloff, K.; Lira-Noriega, A.; Hensz, C.M.; Myers, C.E.; et al. Constraints on interpretation of ecological niche models by limited environmental ranges on calibration areas. Ecol. Model. 2013, 263, 10–18. [Google Scholar] [CrossRef]
  43. Okely, M.; Anan, R.; Gad-Allah, S.; Samy, A.M. Mapping the environmental suitability of etiological agent and tick vectors of Crimean-Congo hemorrhagic fever. Acta Trop. 2020, 203, 105319. [Google Scholar]
  44. Swets, J.A. Measuring the accuracy of diagnostic systems. Science 1988, 240, 1285–1293. [Google Scholar] [CrossRef]
  45. Allouche, O.; Tsoar, A.; Kadmon, R. Assessing the accuracy of species distribution models: Prevalence, kappa and the true skill statistic (TSS). J. Appl. Ecol. 2006, 43, 1223–1232. [Google Scholar] [CrossRef]
  46. Nasser, M.; Okely, M.; Nasif, O.; Alharbi, S.; GadAllah, S.; Al-Obaid, S.; Enan, R.; Bala, M.; Al-Ashaal, S. Spatio-temporal analysis of Egyptian flower mantis Blepharopsis mendica (order: Mantodea), with notes of its future status under climate change. Saudi J. Biol. Sci. 2021, 28, 2049–2055. [Google Scholar] [CrossRef] [PubMed]
  47. Okely, M.; Nasser, M.; Enan, R.; GadAllah, S.; AlAshaal, S. Mantodea oasis of Palaearctic region: Biogeographical analysis of Mantodea in Egypt. Egypt. J. Biol. Pest. Control 2020, 30, 136. [Google Scholar] [CrossRef]
  48. Lobo, J.M.; Jiménez-Valverde, A.; Real, R. AUC: A misleading measure of the performance of predictive distribution models. Glob. Ecol. Biogeogr. 2008, 17, 145–151. [Google Scholar] [CrossRef]
  49. Peterson, A.T.; Papeş, M.; Soberón, J. Rethinking receiver operating characteristic analysis applications in ecological niche modeling. Ecol. Model. 2008, 213, 63–72. [Google Scholar] [CrossRef]
  50. Martins, A.C.; Silva, D.P.; De Marco, P., Jr.; Melo, G.A.R. Species conservation under future climate change: The case of Bombus bellicosus, a potentially threatened South American bumblebee species. J. Insect Conserv. 2015, 19, 33–43. [Google Scholar] [CrossRef]
  51. Hinojosa-Díaz, I.A.; Alqarni, A.S.; Lira-Noriega, A.; Engel, M.S. Ecological niche modeling of the rare bee Promelitta alboclypeata reveals possible cryptic differentiation across northern Africa and Arabia (Hymenoptera: Melittidae). Apidologie 2016, 47, 509–514. [Google Scholar] [CrossRef]
  52. Yurrita, C.L.; Ortega-Huerta, M.A.; Ayala, R. Distributional analysis of Melipona stingless bees (Apidae: Meliponini) in Central America and Mexico: Setting baseline information for their conservation. Apidologie 2017, 48, 247–258. [Google Scholar] [CrossRef]
  53. Parichehreh, S.; Tahmasbi, G.; Sarafrazi, A.; Tajabadi, N.; Solhjouy-Fard, S. Distribution modeling of Apis florea Fabricius (Hymenoptera, Apidae) in different climates of Iran. J. Apic. Res. 2022, 61, 469–480. [Google Scholar] [CrossRef]
  54. Goulson, D. Conserving wild bees for crop pollination. J. Food Agric. Environ. 2003, 1, 142–144. [Google Scholar]
  55. Kasina, J.M.; Mburu, J.; Kraemer, M.; Holm-Mueller, K. Economic benefit of crop pollination by bees: A case of Kakamega small-holder farming in western Kenya. J. Econ. Entomol. 2009, 102, 467–473. [Google Scholar] [CrossRef] [PubMed]
  56. Hamblin, A.L.; Youngsteadt, E.; Frank, S.D. Wild bee abundance declines with urban warming, regardless of floral density. Urban Ecosyst. 2018, 21, 419–428. [Google Scholar] [CrossRef]
  57. Kerr, J.T.; Pindar, A.; Galpern, P.; Packer, L.; Potts, S.G.; Roberts, S.M.; Rasmont, P.; Schweiger, O.; Colla, S.R.; Richardson, L.L.; et al. Climate change impacts on bumblebees converge across continents. Science 2015, 349, 177–180. [Google Scholar] [CrossRef] [PubMed]
  58. Winfree, R.; Bartomeus, I.; Cariveau, D.P. Native pollinators in anthropogenic habitats. Annu. Rev. Ecol. Evol. Syst. 2011, 42, 1–22. [Google Scholar] [CrossRef]
  59. Fliszkiewicz, M.; Giejdasz, K.; Wasielewski, O.; Krishnan, N. Influence of winter temperature and simulated climate change on body mass and fat body depletion during diapause in adults of the solitary bee, Osmia rufa (Hymenoptera: Megachilidae). Environ. Entomol. 2012, 41, 1621–1630. [Google Scholar] [CrossRef] [PubMed]
  60. Bosch, J.; Sgolastra, F.; Kemp, W.P. Timing of eclosion affects diapause development, fat body consumption and longevity in Osmia lignaria, a univoltine, adult-wintering solitary bee. J. Insect Physiol. 2010, 56, 1949–1957. [Google Scholar] [CrossRef] [PubMed]
  61. Rozen, J.G.; Kamel, S.M. Hospicidal behavior of the cleptoparasitic bee Coelioxys (Allocoelioxys) coturnix, including descriptions of its larval instars (Hymenoptera: Megachilidae). Am. Mus. Novit. 2008, 3636, 1–15. [Google Scholar] [CrossRef]
  62. Alqarni, A.S.; Hannan, M.A.; Gonzalez, V.H.; Engel, M.S. Nesting biology of the leafcutting bee Megachile minutissima (Hymenoptera: Megachilidae) in central Saudi Arabia. Ann. Entomol. Soc. Am. 2014, 107, 635–640. [Google Scholar] [CrossRef]
  63. Faria, L.R.R.; Gonçalves, R.B. Abiotic correlates of bee diversity and composition along eastern Neotropics. Apidologie 2013, 44, 547–562. [Google Scholar] [CrossRef]
  64. Shebl, M.A.; Kamel, S.M.; Abu Hashesh, T.A.; Osman, M.A. The impact of using leafcutting bees (Megachilidae hymenoptera) with different fertilization treatments on alfalfa seed production. Rev. Cienc. Suelo Nutr. Veg. 2009, 9, 134–141. [Google Scholar] [CrossRef]
  65. Shebl, M.A.; Hassan, H.A.; Kamel, S.M.; Osman, M.A.M.; Engel, M.S. Biology of the mason bee Osmia latreillei (Hymenoptera: Megachilidae) under artificial nesting conditions in Egypt. J. Asia Pac. Entomol. 2018, 21, 754–759. [Google Scholar] [CrossRef]
  66. Kamel, S.M.; Osman, M.A.M.; Mahmoud, M.F.; Haggag, E.-S.I.; Aziz, A.R.; Shebl, M.A. Influence of temperature on breaking diapause, development and emergence of Megachile minutissima (Hymenoptera, Megachilidae). Vestn. Zool. 2019, 53, 245–254. [Google Scholar] [CrossRef]
  67. Blackmore, L.M.; Goulson, D. Evaluating the effectiveness of wildflower seed mixes for boosting floral diversity and bumblebee and hoverfly abundance in urban areas. Insect Conserv. Divers. 2014, 7, 480–484. [Google Scholar] [CrossRef]
  68. Fischer, L.K.; Eichfeld, J.; Kowarik, I.; Buchholz, S. Disentangling urban habitat and matrix effects on wild bee species. PeerJ 2016, 4, e2729. [Google Scholar] [CrossRef]
  69. Xie, Z.; Shebl, M.A.; Pan, D.; Wang, J. Synergistically positive effects of brick walls and farmlands on Anthophora waltoni populations. Agric. For. Entomol. 2020, 22, 328–337. [Google Scholar] [CrossRef]
  70. Buonincontri, M.P.; Bosso, L.; Smeraldo, S.; Chiusano, M.L.; Pasta, S.; Di Pasquale, G. Shedding light on the effects of climate and anthropogenic pressures on the disappearance of Fagus sylvatica in the Italian lowlands: Evidence from archaeo-anthracology and spatial analyses. Sci. Total Environ. 2023, 877, 162893. [Google Scholar] [CrossRef]
  71. Forister, M.L.; Black, S.H.; Elphick, C.S.; Grames, E.M.; Halsch, C.A.; Schultz, C.B.; Wagner, D.L. Missing the bigger picture: Why insect monitoring programs are limited in their ability to document the effects of habitat loss. Conserv. Lett. 2023, 16, e12951. [Google Scholar] [CrossRef]
  72. Lozada, A.; Day, C.C.; Landguth, E.L.; Bertin, A. Simulation-based insights into community uniqueness within fragmented landscapes. Landsc. Ecol. 2023, 38, 2533–2546. [Google Scholar] [CrossRef]
  73. Wilson, C.J.; Jamieson, M.A. The effects of urbanization on bee communities depends on floral resource availability and bee functional traits. PLoS ONE 2019, 14, e0225852. [Google Scholar] [CrossRef]
  74. Xie, Z.; Qiu, J.S.; Chen, X.M. Decline of nest site availability and nest density of underground bees along a distance gradient from human settlements. Entomol. Sci. 2013, 16, 170–178. [Google Scholar] [CrossRef]
  75. Shebl, M.A.; Al Aser, R.M.; Ibrahim, A. Nesting biology and seasonality of long-horned bee Eucera nigrilabris Lepeletier (Hymenoptera: Apidae). Sociobiology 2016, 63, 1031–1037. [Google Scholar] [CrossRef]
  76. Pereira, F.W.; Carneiro, L.; Gonçalves, R.B. More losses than gains in ground-nesting bees over 60 years of urbanization. Urban Ecosyst. 2021, 24, 233–242. [Google Scholar]
  77. Matteson, K.C.; Ascher, J.S.; Langellotto, G.A. Bee richness and abundance in New York City urban gardens. Ann. Entomol. Soc. Am. 2008, 101, 140–150. [Google Scholar]
  78. Everaars, J.; Strohbach, M.W.; Gruber, B.; Dormann, C.F. Microsite conditions dominate habitat selection of the red mason bee (Osmia bicornis, Hymenoptera: Megachilidae) in an urban environment: A case study from Leipzig, Germany. Landsc. Urban Plan. 2011, 103, 15–23. [Google Scholar]
  79. Ascher, J.S.; Pickering, J. Discover Life Bee Species Guide and World Checklist (Hymenoptera: Apoidea: Anthophila). 2020. Available online: http://www.discoverlife.org/mp/20q?guide=Apoidea_species (accessed on 13 April 2022).
  80. Da Rocha Filho, L.C.; Garófalo, C.A. Nesting Biology of Megachile (Chrysosarus) guaranitica and High Mortality Caused by Its Cleptoparasite Coelioxys bertonii (Hymenoptera: Megachilidae) in Brazil. Austral. Entomol. 2015, 55, 25–31. [Google Scholar]
  81. O’Neill, K.M.; O’Neill, J.F. Brood Parasitism of the Resin Bee Megachile campanulae (Robertson) by Coelioxys modesta Smith (Hymenoptera: Megachilidae). J. Kans. Entomol. Soc. 2016, 89, 117–127. [Google Scholar]
  82. Sabino, W.D.O.; Antonini, Y. Nest architecture, life cycle, and natural enemies of the neotropical leafcutting bee Megachile (Moureapis) maculata (Hymenoptera: Megachilidae) in a montane forest. Apidologie 2017, 48, 450–460. [Google Scholar]
  83. Parizotto, D.R. Natural enemies of the oil-collecting bee Centris analis (Fabricius, 1804) with notes on the behavior of the cleptoparasite Coelioxys nigrofimbriata Cockerell, 1919 (Hymenoptera, Apidae). J. Hymenopt. Res. 2019, 70, 1–16. [Google Scholar]
Figure 1. Current potential distribution of five species of the family Megachilidae: (a) Chalicodoma flavipes; (b) Chalicodoma sicula; (c) Megachile minutissima; (d) Osmia submicans.
Diversity 15 01172 g001
Figure 2. Future potential distribution of Chalicodoma flavipes based on future climatic conditions: (a,b) represent the period (2041–2060); (c,d) represent the period (2061–2080); (e,f) represent the period (2081–2100).
Diversity 15 01172 g002
Figure 3. Future potential distribution of Chalicodoma sicula based on future climatic conditions: (a,b) represent the period (2041–2060); (c,d) represent the period (2061–2080); (e,f) represent the period (2081–2100).
Diversity 15 01172 g003
Figure 4. Current potential distribution of Coelioxys coturnix based on present-day climatic conditions.
Diversity 15 01172 g004
Figure 5. Future potential distribution of Coelioxys coturnix based on future climatic conditions: (a,b) represent the period (2041–2060); (c,d) represent the period (2061–2080); (e,f) represent the period (2081–2100).
Diversity 15 01172 g005
Figure 6. Future potential distribution of Megachile minutissima based on future climatic conditions: (a,b) represent the period (2041–2060); (c,d) represent the period (2061–2080); (e,f) represent the period (2081–2100).
Diversity 15 01172 g006
Figure 7. Future potential distribution of Osmia submicans based on future climatic conditions: (a,b) represent the period (2041–2060); (c,d) represent the period (2061–2080); (e,f) represent the period (2081–2100).
Diversity 15 01172 g007
Table 1. The initial 19 bioclimatic variables used for prediction of current habitat suitability for bee species.
VariableDescription
Bio 1Annual mean temperature
Bio 2Mean diurnal range (mean of monthly max temp–min temp)
Bio 3Isothermality (bio2/bio7) × 100
Bio 4Temperature seasonality (standard deviation × 100)
Bio 5Max temperature of the warmest month
Bio 6Min temperature of the coldest month
Bio 7Temperature annual range
Bio 8Mean temperature of the wettest quarter
Bio 9Mean temperature of the driest quarter
Bio 10Mean temperature of the warmest quarter
Bio 11Mean temperature of the coldest quarter
Bio 12Annual precipitation
Bio 13Precipitation of the wettest month
Bio 14Precipitation of the driest month
Bio 15Precipitation seasonality (coefficient of variation)
Bio 16Precipitation of the wettest quarter
Bio 17Precipitation of the driest quarter
Bio 18Precipitation of the warmest quarter
Bio 19Precipitation of the coldest quarter
Table 2. Partial area under the curve (AUC) ratios summarizing evaluations of ecological niche models of five megachiline species based on 500 bootstrap iterations.
SpeciesNo. NSpROC Ratio
MinimumMaximumMean
Chalicodomaflavipes5001.531.991.9
Chalicodomasicula5001.911.991.96
Coelioxys coturnix5001.341.871.67
Megachileminutissima5001.631.991.87
Osmiasubmicans5001.91.961.94
Disclaimer/Publisher’s Note: The statements, opinions and data contained in all publications are solely those of the individual author(s) and contributor(s) and not of MDPI and/or the editor(s). MDPI and/or the editor(s) disclaim responsibility for any injury to people or property resulting from any ideas, methods, instructions or products referred to in the content.

