Article

Time-Varying Effective Population Sizes of Group-Living Small Mammals

1
Department of Wildlife, Fisheries and Aquaculture, Mississippi State University, Mississippi State, MS 39762, USA
2
Institute of Zoology, Chinese Academy of Sciences, 1 Beichen West Road, Chaoyang District, Beijing 100101, China
3
Department of Biochemistry, Molecular Biology, Entomology and Plant Pathology, Mississippi State University, Mississippi State, MS 39762, USA
4
Institute for Genomics, Biocomputing & Biotechnology, Mississippi State University, Mississippi State, MS 39762, USA
*
Author to whom correspondence should be addressed.
Diversity 2023, 15(12), 1173; https://doi.org/10.3390/d15121173
Submission received: 30 October 2023 / Revised: 18 November 2023 / Accepted: 21 November 2023 / Published: 24 November 2023
(This article belongs to the Section Biodiversity Loss & Dynamics)

Abstract

:
The Wright–Fisher model predicts that the ratio of effective population size ( N e ) to actual population size ( N ) is <1.0 due to inbreeding and random drifts under constant population sizes. However, social structure may prevent inbreeding and result in outbreeding through coancestry, causing the N e / N ratio to exceed 1.0. We integrated three years of data on seasonal population fluctuations and population genetics of group-living Daurian pikas (Ochotona dauurica) to test the prediction of >1.0 N e / N ratio for social small mammals. We estimated biweekly pika population sizes using capture–recapture data from May 2010 to October 2012. We genotyped all captured pikas in each of the three years with 11 microsatellite markers. We estimated pika effective population sizes for 2010–2011, 2011–2012, and 2010–2012, respectively, using the temporal methods with the program MLNe. Pika populations underwent a 75% decline in the summer of 2010 and exhibited relatively constant seasonal fluctuations from 2011 to 2012. Bayesian clustering with program STRUCTURE identified two distinct genetic clusters for the pikas of 2010 and 2011–2012, respectively. The N e / N ratios of the pikas were 0.46, 1.13, and 0 54 for 2010–2011, 2011–2012, and 2010–2012, respectively. Our findings partially support our hypothesis with the N e / N ratio being >1.0 from 2011 to 2012. The dramatic population decline in the summer of 2010 probably disrupted the social structure of pikas, which subsequently increased the rate of genetic diversity losses. Re-establishments of the social structure during 2011 and 2012 probably restored the outbreeding of pikas like in other social mammals.

1. Introduction

Effective population size is the size of an idealized Wright–Fisher population that has the same rate of genetic diversity loss as in the actual population [1,2]. The idealized population is assumed to be at the Hardy–Weinberg (HW) equilibrium with a constant population size, equal sex ratio, and non-overlapping generation [3,4]. Furthermore, the idealized population is not subjected to any effects of immigration, emigration, mutation, and natural selection [5]. Under those assumptions, effective population size can predict the rate of genetic diversity loss caused by inbreeding (i.e., inbreeding effective population size N e ) or random drift (variance N e ) in a real population [4,5]. Therefore, effective population size is an important population parameter in conservation genetics, conservation biology, and population ecology [6].
Demographic factors such as biased (not 1:1) sex ratio and skewed age structure influence effective population sizes through deviations from the HW equilibrium caused by non-random contributions to the production of gametes or the distribution of allelic frequencies between the sexes and individuals [4,7]. Population fluctuations may result in a very low number of animals and subsequent inbreeding and genetic drift [8]. Behaviors such as immigration, emigration, and non-random mating (e.g., in polygynous mammals) may also alter effective population size through increased linkage disequilibrium (LD) [5,7]. Therefore, the allelic frequency distributions of real populations often deviate from the predictions of the HW equilibrium. Effective population size ( N e ) is often less than the census (N) of real populations. Consequently, the N e / N ratio is centered at 0.5, ranging from 0.25 to 1.0 in the wild populations of overlapping generations [3,9]. Mace and Lande [10] proposed a N e / N ratio of 0.2 as the minimum criterion of endangerment.
The Wright–Fisher idealized populations have been expanded to subdivided populations with subpopulations or islands being treated as small demes subjected to strong random drifts and high rates of genetic diversity losses [2,11]. On the other hand, empirical and theoretical evidence suggests that spatial and social organizations or structures may substantially reduce the rate of genetic diversity loss in vertebrate populations [12,13]. Spatial subdivisions of animal populations may attenuate gene flow among subpopulations or family groups [11,13]. For instance, territoriality and aggressive behaviors towards strange conspecifics may form a social fence to reduce migration (or dispersal) and attenuate gene flow among social groups. Reduced gene flow (e.g., to an intermediate level) may result in high genetic heterozygosity of the entire population, with different genotypes being retained in different social groups through coancestry [12,14,15]. Social groups may reduce genetic diversity loss and conserve the genetic diversity of populations.
The Daurian pika (Ochotona dauurica Pallas 1776; hereafter pika) is a small mammal living in social groups in a burrow system year-round on the Mongolian Plateau [16,17]. A social group consists of 2–5 pikas in Inner Mongolia [18]. The average genetic diversity of pika social groups is inversely related to average genetic relatedness, with about 50% of social groups having positive genetic relatedness [18]. Daurian pikas are believed to be socially monogamous [19]. Populations of Daurian pikas undergo frequent local extinctions, particularly during winters [20]. Dynamics of social groups and fluctuating population sizes may result in time-varying effective population sizes [12]. Therefore, it is plausible to hypothesize that social groups and monogamy would result in a high N e / N ratio (>1.0) in Daurian pikas because social groups slow genetic diversity loss, and monogamous pair bonding avoids inbreeding. However, this hypothesis has not been tested with empirical demographic and genetic data. In this study, we integrated and re-analyzed capture–recapture data for accurate estimates of pika population sizes and microsatellite genetic data to estimate effective population sizes of group-living Daurian pikas. We aimed to test the prediction that social groups would slow the loss of genetic diversity in Daurian pikas, resulting in N e / N ratios of >1.0.

2. Methods

2.1. Study Site

Our study site was located at Naren, Abaga Banner, of northcentral Inner Mongolia, China (44.4333° N, 114.9667° E). Annual total precipitation ranged from 135.0 to 267.2 mm. Monthly mean temperatures fluctuated between −23 and 24 °C. It snowed from mid- or late October to early May [18,21]. Vegetation on the study site was a typical steppe, mainly consisting of Leymus chinense, Artemisia frigid, Allium polyrhizum, Salsola collina, and Chenopodium glaucum [21]. The primary land use in the region was livestock grazing with minimum row-crop agriculture.

2.2. Live-Trapping of Daurian Pikas

We live-trapped Daurian pikas biweekly on a 1.5-ha plot (140 m × 110 m) using wire-mesh live traps (in the dimensions of 28 cm × 13 cm × 10 cm) in the springs and summers (May–October) of 2009–2012 [21]. We placed a wire-mesh live trap at each active burrow entrance in 30 burrow systems with a total of 350–400 traps each trapping week. Traps were set at 05:00–06:00 h, were checked every 1 or 2 h until about 11:00 h, and were closed traps from 11:00 to 15:00 h to avoid trap mortality resulting from heat stress. Trapping resumed at 16:00 h and continued until 19:00 h. Ambient air temperatures were often low and variable at our study site in May, September, and October; traps were set between 06:30 and 07:30 h and were monitored hourly until 17:30 h to avoid trap mortality from cold. Each captured pika was marked with an ear tag having a unique identification (ID) number (S. Roestenburg Inc., Herriman, UT, USA) at its initial capture. We recorded the ID number, trap location (i.e., burrow system ID), sex, and body mass of each capture (see [21] for the details of the live trapping). From 2010 to 2012, we cut a small piece (2 mm × 2 mm) of ear biopsy from each captured pika for DNA extraction with a pair of sterilized surgical scissors [18]. Our trapping and handling of pikas were approved by the Institutional Animal Use and Care Committee (IACUC) of the Mississippi State University (IACUC protocol # 11-031) and the Institute of Zoology, the Chinese Academy of Sciences.

2.3. Estimates of Seasonal Population Sizes

Visual counts of animals have been often used in the calculation of N e / N ratios for wildlife populations. Without accounting for imperfect detection probabilities (i.e., p < 1) of field surveys, the estimates of N e / N ratios may be positively biased because visual counts are often less than real population sizes owing to imperfect detection probabilities. To calculate unbiased N e / N ratios, we used the robust design model within program MARK, which estimates the probabilities of initial captures and subsequent recaptures, to estimate pika population size for each 2-week trapping period [22]. The robust design model combines the Cormack–Jolly–Seber (CJS) model [23,24,25] and closed-capture population models [26,27]. The robust design consists of primary trapping periods (i.e., biweekly trapping periods in our study) over which populations are open and secondary trapping occasions (i.e., four trapping days of each trapping week of our study) within each primary period. Populations are assumed to be closed within each secondary period in the robust design model. The robust design model uses the capture–recapture information from each secondary occasion to improve the estimation of capture and recapture probabilities and subsequently enhance the estimation precision of population sizes [27]. We used four consecutive days of trapping records within each primary period to make encounter history input data for the robust design models from 2009 to 2012, resulting in 36 primary trapping periods. However, we only used the estimates of biweekly population sizes from 2010 to 2012 in this study, corresponding to the availability of microsatellite data.
We assumed that initial capture probabilities (p) were different from or equal to recapture probabilities (c). The probabilities p and c either varied across the primary periods but were constant over the secondary occasions within a primary period, denoted by p(t, .) and c(t, .), or were constant between the primary period but differed among the secondary occasions (p(., t) and c(., t)). We also parameterized the robust design models with the first-order Markov, random, or no emigration. We used Akaike’s information criterion (AIC) to select the most parsimonious models from the candidate models [28]. The best approximating model has the lowest AIC value and greatest Akaike weight. ΔAIC of a model was computed as the AIC difference between the model and the most parsimonious model [28]. No goodness-of-fit tests are available for robust design models [29].

2.4. Microsatellite Analysis

We re-analyzed the microsatellite data on Daurian pikas reported by Wang, Wan, Liu, and Shan [18]. We extracted genomic DNA from the ear tissue samples of captured pikas using phenol-chloroform extraction methods [30]. The quality and quantity of extracted DNA were visually examined on agarose gels stained with ethidium bromide. We cross-amplified 11 microsatellite markers for each tissue sample, ocp1, ocp2, ocp3, and ocp, developed originally for O. princeps (Richardson 1828) [31]; occ02 for O. collaris (Nelson, 1893) [32]; and p7F, p47F, p124R, p149F, p156F, and p172F for O. curzoniae (Hudgson, 1858) [33] to genotype each captured pika using polymerase chain reactions (PCR). We used the same PCR reaction conditions and protocol for each marker as in Peacock, Kirchoff, and Merideth [31]; [33]; and Zgurski, Davis, and Hik [32], respectively. Amplified fragments were electrophoresed on an ABI PRISM 377 automated sequencer (Applied Biosystems, Foster City, CA, USA) and were scored using Genescan® Version 3.7 (Applied Biosystems). We genotyped each pika sample twice independently to assess typing error rates. If differences were detected between two genotyping runs, we continued genotyping until a consensus was reached. We assessed null alleles, short allele dominance, and typing errors associated with stutter using the program MICRO-CHECKER v. 2.2.3 [34].

2.5. Between-Year Difference of Daurian Pika Population Genetic Structure

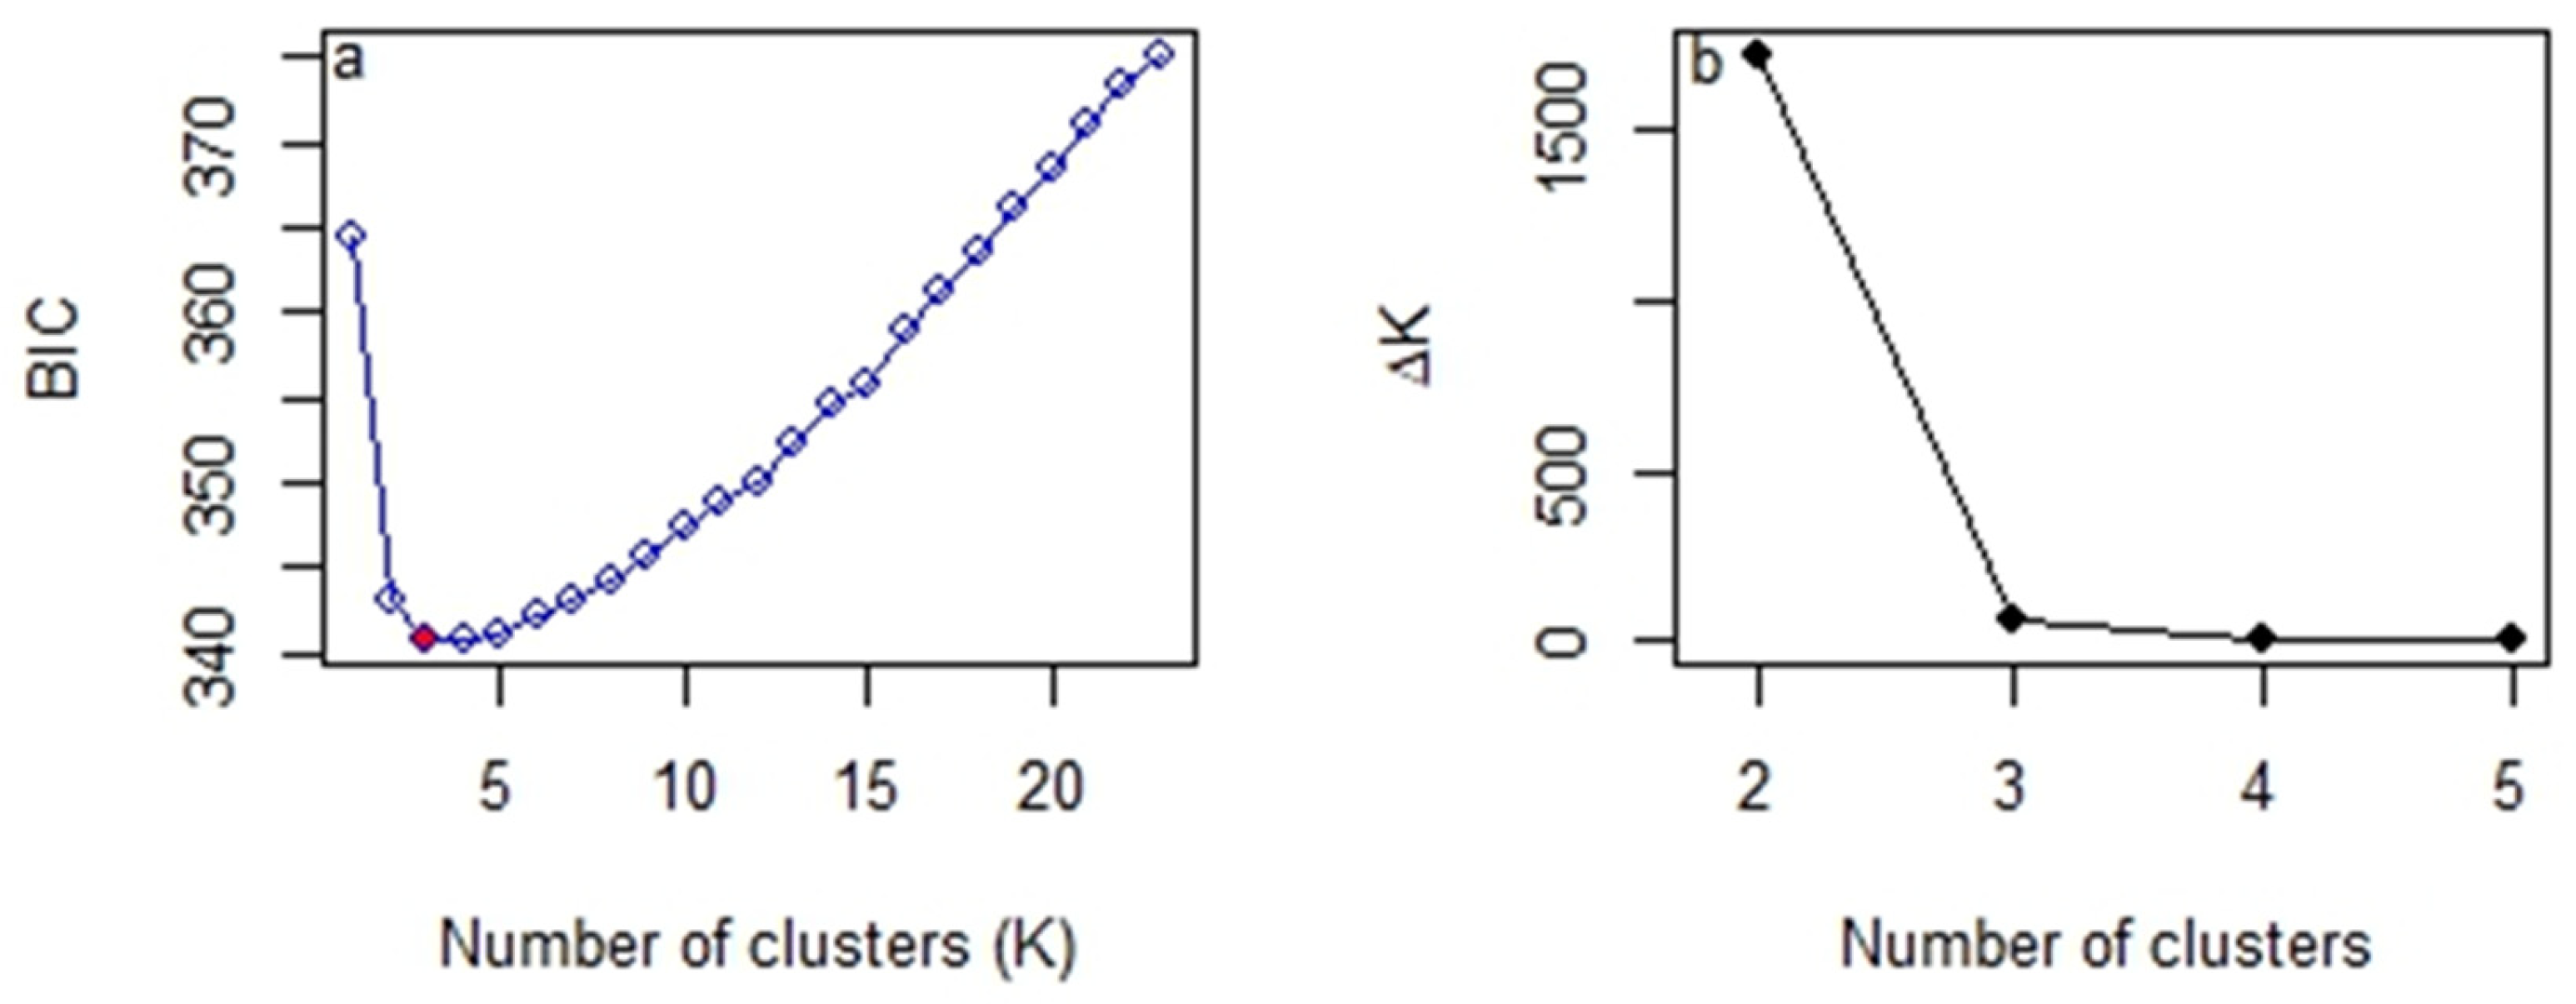
We used discriminant analysis of principal components (DAPC) to identify annual population genetic divisions implemented in the R package adegenet [35]. The DAPC method is a multivariate statistical method for population genetic clustering based on principal component analysis and does not require the HW equilibrium and linkage equilibrium [35]. We chose the number of principal components (PCs) to account for >90% of genetic variability. We used Bayesian information criterion (BIC) to determine the optimal number of genetic subdivisions, at which the BIC was the lowest [35]. The DAPC clustering aimed to test if the pika populations had annual distinct genetic structure over the three years.
We also used Bayesian clustering analysis within the program STRUCTURE 2.3 to estimate the number of genetic clusters (K) [36]. We carried out 15 replicate runs of STRUCTURE for each of the prior K = 1–5 because there were three years of genotyping data. We had 200,000 iterations for Bayesian inferences, with the first 100,000 iterations as a burn-in period for each run. We assumed the admixture model, which allows a mixture of genetic ancestries for an individual. We determined the most likely number of genetic clusters using the ΔK method [37]. The optimal number of genetic clusters had the greatest ΔK value. The two different population genetic clustering methods were used to make robust inferences about pika population’s genetic structure.

2.6. Estimation of Effective Population Size

We used the temporal method implemented in computer software MLNe v. 2.1 to estimate the effective population size N e of Daurian pikas [38]. Changes in the allele frequencies of neural loci (i.e., no selection) over time are likely to be caused by genetic drift and inbreeding, which determines effective population size [39]. Therefore, N e can be estimated using temporal changes in the allelic frequencies with more than two samples [39]. The temporal method is robust to the violations of the assumptions of population spatial structure and age structure and can generate a good estimate of N e with 10–20 microsatellite markers (i.e., neutral loci) [38,39]. We used the maximum likelihood (ML) estimator of N e with three annual samples of Daurian pikas genotyped with 11 microsatellite markers [18].

3. Results

We built a total of 23 robust design models with different combinations of the parameterizations of survival probability, initial capture probability, recapture probability, and temporal emigration (Supplementary Materials Table S1). The best approximating robust design model (Akaike weight = 0.99) for biweekly population sizes indicated that initial capture probability (p) and recapture probability (c) varied between the secondary occasions (i.e., trapping days within a trapping week) but were constant over the primary periods (i.e., every two weeks; Table S1). The estimates of biweekly pika population sizes fluctuated across the study period (i.e., the sub-model denoted with N(t) in Table S1; Figure 1). The average of biweekly population size estimates was 35.06 (standard deviation = 10.77) over the three years.
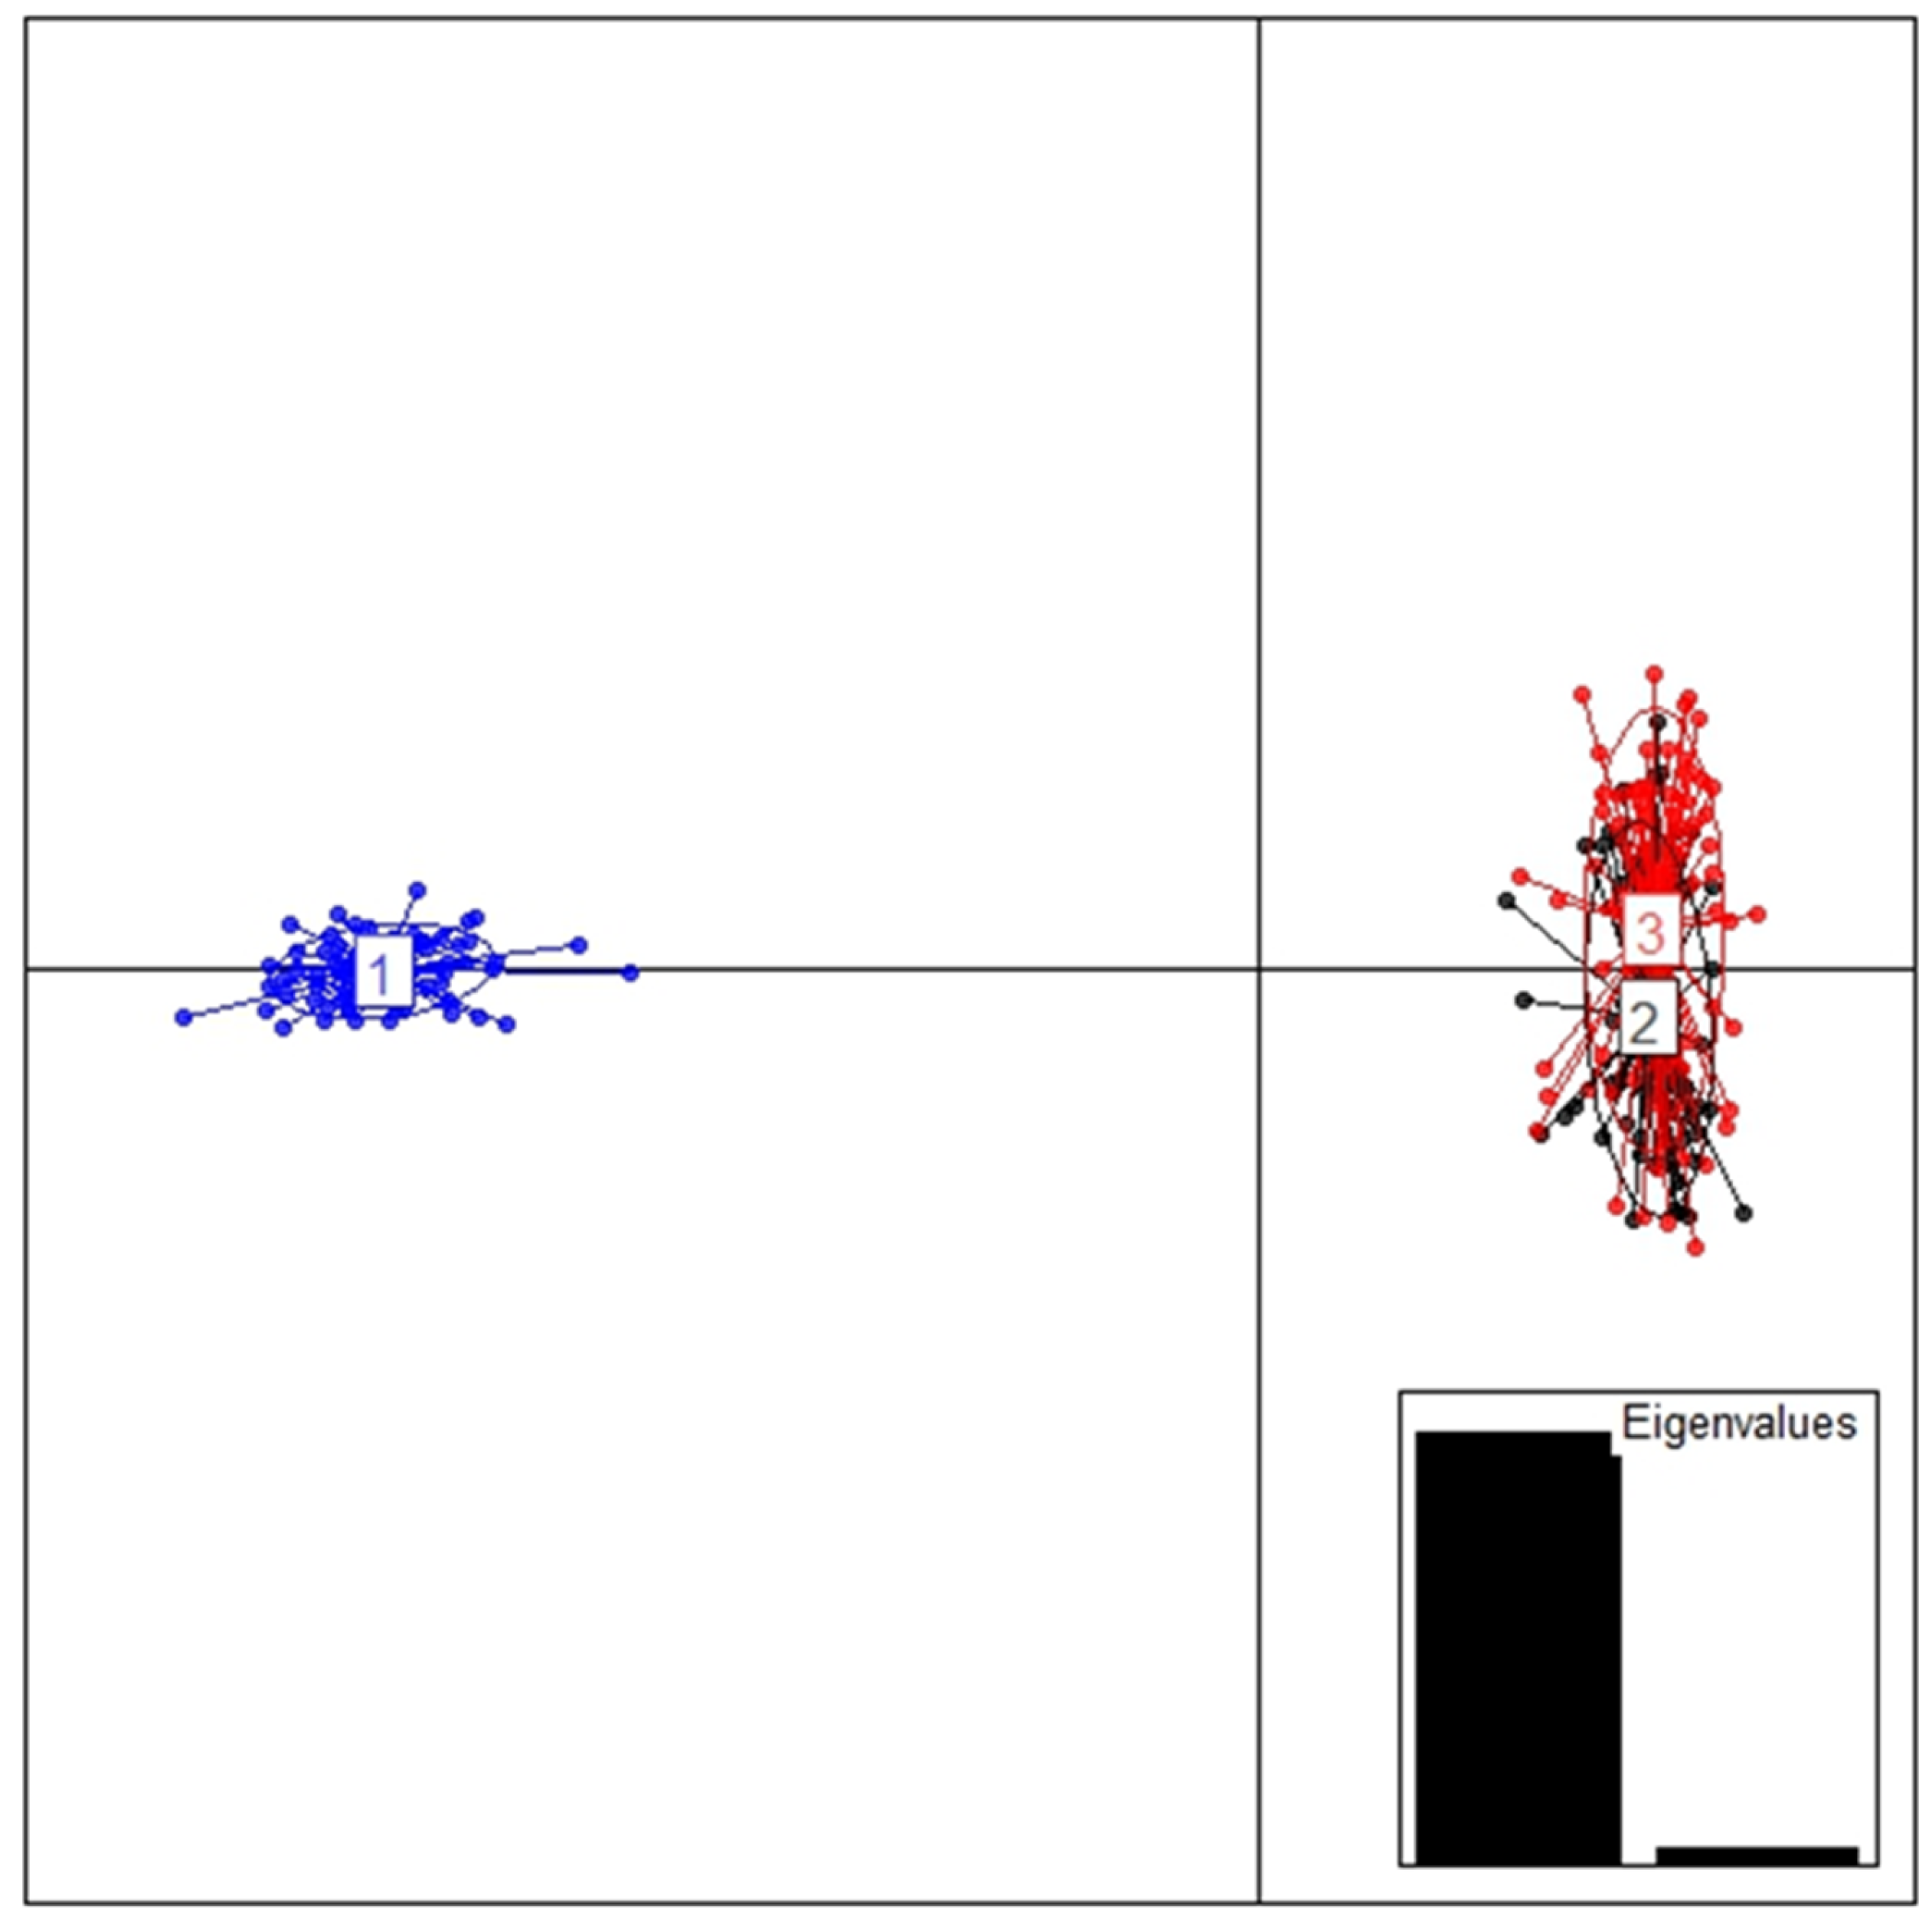
We genotyped 70, 72, and 84 pikas in 2010, 2011, and 2012, respectively, with 11 microsatellite loci. Those pikas were the annually cumulative samples of uniquely identified individuals captured from May to October. Discriminant analysis of principal components identified three clusters with the lowest BIC (Figure 2a). The two discriminant components explained 94% of the genetic variability of 226 genotyped pikas. The DAPC membership assignments indicated cluster 1 only consisted of 70 pikas captured in 2010 (Figure 1). Cluster 1 (2010) was genetically distinct from clusters 2 (2011) and 3 (2012) along the first discriminant component (i.e., the x-axis; Figure 3). Clusters 2 and 3 were only separated slightly along the second discriminant component (the y-axis). However, the second discriminant component explained much less genetic variability than the first component (the inset of Figure 3). Therefore, we combined clusters 2 and 3 together into a cluster for the years 2011 and 2012. STRUCTURE identified two genetic clusters, with ΔK being highest at two clusters (Figure 2b). The Bayesian inferences of the memberships of the genotyped pikas indicated that the pikas of 2010 belonged to a distinct genetic cluster, whereas the pikas of 2011–2012 formed the second cluster (Figure 4), consistent with that of DAPC analysis.
Estimates of effective population sizes by the temporal method with microsatellite data varied during the three years (Table 1). The effective population size during 2010 and 2011 was less than half of that from 2011 to 2012. The overall N e / N ratio of 2010–2012 was 0.54, whereas the N e / N ratio was >1.0 from 2011 to 2012, when population genetic structure did not differ (Table 1, Figure 3 and Figure 4).

4. Discussion

Social organizations and ecological conditions play important roles in determining the rate of genetic diversity losses in wild animal populations [12,13]. Our findings partially support our hypothesis that the effective population size of Daurian pikas was greater than the average population size ( N e / N > 1.0) because social groups slowed the loss of pika genetic diversity. The estimate of N e / N , the ratio of 2011–2012 was greater than 1.0; however, that of 2010–2011 was less than 1.0 following a 75% population decline (from about 78 pikas in mid-June to about 20 pikas mid-July) over summer 2010. However, the population size was about 30 and 33 pikas in mid-July of 2011 and 2012, respectively. Instead of using visual counts of population size and a single sample of microsatellite data, this study integrated three years of biweekly live-trapping data and three temporal samples of microsatellite data to generate reliable estimates of N e / N ratios. As a result, three years of data on the seasonal population dynamics and allelic frequencies revealed temporal variation in the effective population sizes of pikas following a dramatic seasonal population decline. These findings support the need to invoke the concepts of time-varying effective population size and social division to explain the temporal dynamics of population genetic structure in small-sized animals such as small mammals.
The pika population on our site exhibited a declining trend over the three years. Precipitation is an important climate factor influencing the population dynamics of Daurian pikas [17,21]. Chen et al. [21] found that Daurian pika population growth rates decreased with precipitation being greater than the optimal amount. Excessive rainfall during summer may reduce Daurian pika population sizes [21]. The amount of summer rainfall in 2012 was about 2–3 times greater than that of 2010 and 2011 at our site, which might result in pika population declines on our site from 2010 to 2012 [21]. However, pika populations declined in a much lesser magnitude from 2011 to 2012 than from 2010 to 2011.
The Wright–Fisher model does not take into account the roles of social organization in the maintenance of genetic heterozygosity [15]. The Wright–Fisher framework either treats a population as a genetically panmictic unit or deems social groups as small demes having small effective sizes. Therefore, the Wright–Fisher model predicts that social groups would reduce effective population size [40]. On the contrary, our findings from the data of 2011–2012 are consistent with the prediction of the Chesser theory that social groups result in outbreeding and increase genetic heterozygosity through coancestry [41,42]. About 50% of pika social groups had positive genetic relatedness, suggesting coancestry [18]. It has been proposed that social groups may also serve as a mechanism for inbreeding avoidance, particularly in the breeding groups having monogamous breeding tactics [15,40]. Furthermore, Chesser [41] demonstrated social groups would result in outbreeding even without sex-biased dispersal. Likewise, Parreira and Chikhi [40] found that random replacement among the potential reproductive individuals available in a network of social groups alone results in higher heterozygosity than that predicted by the HW principle.
Genetic data such as microsatellite and SNP data have been widely used in the studies of effective population size and population genetic structure, often as the sole source of data [12,38,43]. Studies of effective population size with genetic data often assume constant population size, an assumption of the Wright–Fisher idealized population. However, population fluctuations affect effective population sizes [8]. There are no real animal populations that have constant population sizes, particularly in small mammals or other short-lived animals [44]. The pika population underwent a four-fold decline in our study site during the summer of 2010. We postulated that pikas probably recolonized vacant burrow systems with a mix of individuals from different social groups following the local extinctions of social groups. Such within-population dispersal probably disrupted the kin-based social structure and increased the rate of genetic diversity loss, differentiating the pika population genetic structure between 2010 and 2011. Chen et al. [21] found that a local population at a site about 5 km from our site went extinct in 2009. Likewise, Archie and Chiyo [45] found that poaching disrupted the social structure of African savannah elephants (Loxodonta africana Blumenbach 1797). The loss of kin-based social groups increased genetic diversity loss, reducing the effective population size of the elephants [45]. Our study and other investigations suggest that integrations of population ecological data and genetic data are needed to advance the understanding of the population genetics of social mammals [12,15].
The Wright–Fisher model is still the main theoretic framework for the estimation of effective population size and the gene dynamics of populations [5,38]. The Chesser theory concerning the roles of social structure and coancestry has been developed to explain the outbreeding and excess heterozygosity of social mammals. Both genetic data and observations of social behaviors are required to field test the Chesser theory [15]. For instance, Parreira and Chikhi [40] demonstrated that the random sampling of individuals, instead of a whole social group as a sampling unit, “erased” social structure, which led to the negligence of the outbreeding and excess heterozygosity of social groups. Our samples of microsatellite data included all individuals of monitored social groups [18]; consequently, we observed a N e / N ratio of >1.0 in Daurian pikas from 2011 to 2012. Although we demonstrated that the stabilized social-genetic structure of pikas (i.e., the same genetic grouping of pikas sampled during 2011 and 2012) slowed the loss of genetic diversity, we lacked observations of the social behaviors of pikas to confirm the rapid establishments of coancestry following the dramatic population decline [40]. Furthermore, long-term data on genetics and population ecology are needed to confirm whether the dramatic seasonal fluctuations of population sizes would disrupt social structure, leading to reductions in effective population sizes.
During the past 20 years, the coalescent idealized population has been proposed as a more realistic alternative to the Wright–Fisher idealized population [46,47]. Coalescent effective population size is based on Kingman’s coalescent process [48]. The coalescent effective population size not only considers mutation and genetic drift but also population structure and natural selection, implying all aspects of genetic variation [47]. For instance, theoretical stochastic process models of the coalescent process can predict the observed patterns of the genetic variation of the populations subjected to recurrent local extinctions and local recolonizations [49]. This aspect of the coalescent theory is consistent with the frequent local extinction of the social groups of Daurian pikas. However, the modern coalescent models of effective population size are data-driven and mathematically complex. Therefore, population geneticists, population ecologists, and behavioral ecologists need to work together to develop interdisciplinary approaches to data collection and model testing, including pattern-matching simulations such as agent-based models for population and genetic dynamics [50,51].

Supplementary Materials

The following supporting information can be downloaded at https://www.mdpi.com/article/10.3390/d15121173/s1. Table S1: Model selection of the robust design closed population models for the estimations of population sizes of Daurian pikas (Ochotona dauurica) in Inner Mongolia, China, from May 2010 to October 2012. The letter K denotes the number of unknown parameters, and the letter w is the Akaike weight; symbol p(t,.) denotes the probability of initial capture, which was assumed to change over the primary sessions but remain constant within a secondary session; phi(t) is the estimate of apparent survival; c(t, .) is the probability of recapture, which was assumed to change over the primary sessions but remained constant within a secondary session; γ′ is the probability of emigration; γ″ is the probability of immigration; N is population size; and t is the time effect. Markov refers to random temporary emigration and Markov temporary emigration, respectively. Symbol AICc denotes the Akaike information criterion corrected for small population size and Δ A I C c is the difference in AICc between a model and the best model. Deviance is 2 times negative log-likelihood value of a model.

Author Contributions

All authors contributed to this study’s conception and design. Material preparation and data collection were performed by L.C. and X.W. Data analyses were carried out by G.W. and X.S. The first draft of the manuscript was written by G.W., and all authors commented on previous versions of the manuscript. All authors have read and agreed to the published version of the manuscript.

Funding

This research received no external funding.

Institutional Review Board Statement

Our trapping and handling of pikas were approved by the Institutional Animal Use and Care Committee (IACUC) of the Mississippi State University (IACUC protocol # 11-031) and the Institute of Zoology, the Chinese Academy of Sciences.

Data Availability Statement

The data presented in this study are available on request from the corresponding author. The data are not publicly available due to the ongoing long-term study.

Acknowledgments

We thank Wei Liu, Bing Xu, and Yongzhi Su for their assistance in fieldwork. Guiming Wang was financially supported by the Forest and Wildlife Research Center at Mississippi State University. Xueyan Shan was supported by the Mississippi Agriculture and Forest Experimental Station (MAFES) and the Institute for Genomics, Biocomputing & Biotechnology (IGBB) of Mississippi State University.

Conflicts of Interest

The authors declare no conflict of interest.

References

  1. Fisher, R.A. The Genetical Theory of Natural Selection; Clarendon Press: London, UK, 1930. [Google Scholar]
  2. Wright, S. Evolution in Mendelian populations. Genetics 1931, 16, 97–159. [Google Scholar] [CrossRef] [PubMed]
  3. Frankham, R. Effective population size/adult population size ratios in wildlife: A review. Genet. Res. 1995, 66, 95–107. [Google Scholar] [CrossRef]
  4. Hartl, D.L.; Clark, A.G. Principles of Population Genetics; Sinauer Associates: Sunderland, MA, USA, 1997. [Google Scholar]
  5. Wang, J.; Santiago, E.; Caballero, A. Prediction and estimation of effective population size. Heredity 2016, 117, 193–206. [Google Scholar] [CrossRef] [PubMed]
  6. Harmon, L.J.; Braude, S. Conservation of small populations: Effective population sizes, inbreeding, and the 50/500 rule. In An Introduction to Methods and Models in Ecology, Evolution, and Conservation Biology; Braude, S., Low, B.S., Eds.; Princeton University Press: Princeton, NJ, USA, 2010; pp. 125–138. [Google Scholar]
  7. Wright, S. Evolution and the Genetics of Populations: Vol. 2. The Theory of Gene Frequencies; University of Chicago Press: Chicago, IL, USA, 1969. [Google Scholar]
  8. Vucetich, J.A.; Waite, T.A.; Nunney, L. Fluctuating population size and the ratio of effective to census population size. Evolution 1997, 51, 2017–2021. [Google Scholar] [CrossRef] [PubMed]
  9. Nunney, L. Measuring the ratio of effective population size to adult numbers using genetic and ecological data. Evolution 1995, 49, 389–392. [Google Scholar] [CrossRef]
  10. Mace, G.M.; Lande, R. Assessing extinction threats: Toward a reevaluation of IUCN threatened species categories. Conserv. Biol. 1991, 5, 148–157. [Google Scholar] [CrossRef]
  11. Wang, J.; Caballero, A. Developments in predicting the effective size of subdivided populations. Heredity 1999, 82, 212–226. [Google Scholar] [CrossRef]
  12. Chikhi, L.; Sousa, V.C.; Luisi, P.; Goossens, B.; Beaumont, M.A. The confounding effects of population structure, genetic diversity and the sampling scheme on the detection and quantification of population size changes. Genetics 2010, 186, 983–995. [Google Scholar] [CrossRef]
  13. Chesser, R.K.; Rhodes, O.E., Jr.; Sugg, D.W.; Schnabel, A. Effective sizes for subdivided populations. Genetics 1993, 135, 1221–1232. [Google Scholar] [CrossRef]
  14. Chesser, R.K.; Sugg, D.W.; Rhodes, O.E., Jr.; Novak, J.M.; Smith, M.H. Evolution of mammalian social structure. Acta Theriol. 1993, 38, 163–174. [Google Scholar] [CrossRef]
  15. Sugg, D.W.; Chesser, R.K.; Dobson, F.S.; Hoogland, J.L. Population genetics meets behavioral ecology. Trends Ecol. Evol. 1996, 11, 338–342. [Google Scholar] [CrossRef] [PubMed]
  16. Wang, G.; Zhou, Q.; Zhong, W.; Wang, Z. Spatial overlap between sympatric Microtus brandti (Rodentia, Microtinae) and Ochotona daurica (Lagomorpha, Ochotonidae) in the steppes of inner Mongolia. Mammalia 2003, 67, 349–354. [Google Scholar] [CrossRef]
  17. Wang, G.; Zhong, W. Mongolian gerbils and Daurian pikas responded differently to changes in precipitation in the Inner Mongolian grasslands. J. Arid. Environ. 2006, 66, 648–656. [Google Scholar] [CrossRef]
  18. Wang, G.; Wan, X.; Liu, W.; Shan, X. Genetic diversity and relatedness of group-living small mammals on the Mongolian Plateau. Diversity 2022, 14, 732. [Google Scholar] [CrossRef]
  19. Smith, A.T. Patterns of pikas (Genus Ochotona) life history variation. In Evolution of Life Histories of Mammals; Boyce, M.S., Ed.; Yale University Press: New Haven, CT, USA, 1988; pp. 233–256. [Google Scholar]
  20. Formozov, A.N. Adaptive modifications of behavior in mammals of the Eurasian steppes. J. Mammal. 1966, 47, 208–223. [Google Scholar] [CrossRef]
  21. Chen, L.; Wang, G.; Wan, X.; Liu, W. Complex and nonlinear effects of weather and density on the demography of small herbivorous mammals. Basic Appl. Ecol. 2015, 16, 172–179. [Google Scholar] [CrossRef]
  22. White, G.C.; Burnham, K.P. Program MARK: Survival estimation from populations of marked animals. Bird Study 1999, 46, 120–139. [Google Scholar] [CrossRef]
  23. Cormack, R.M. Estimates of survival from sighting of marked animals. Biometrika 1964, 51, 429–438. [Google Scholar] [CrossRef]
  24. Jolly, G.M. Explicit estimates from capture-recapture data with both death and immigration-stochastic model. Biometrika 1965, 52, 225–247. [Google Scholar] [CrossRef]
  25. Seber, G.A.F. A Note on Multiple-Recapture Census. Biometrika 1965, 52, 249–259. [Google Scholar] [CrossRef]
  26. Kendall, W.L. The robust design for capture-recapture studies: Analysis using program MARK. In Wildlife, Land, and People: Priorities for the 21st Century; Field, R., Warren, R.J., Okarma, H., Sievert, P.R., Eds.; The Wildlife Society: Bethesda, MD, USA, 2001; pp. 361–367. [Google Scholar]
  27. Pollock, K.H. A capture-recapture design robust to unequal probability of capture. J. Wildl. Manag. 1982, 46, 752–757. [Google Scholar] [CrossRef]
  28. Burnham, K.P.; Anderson, D.R. Model Selection and Inference: A Practical Information-Theoretic Approach, 2nd ed.; Springer: New York, NY, USA, 2002. [Google Scholar]
  29. Bailey, L.L.; Simons, T.R.; Pollock, K.H. Estimating detection probability parameters for plethodon salamanders using the robust capture-recapture design. J. Wildl. Manag. 2004, 68, 1–13. [Google Scholar] [CrossRef]
  30. Sambrook, J.; Russell, D.W. Molecular Cloning: A Laboratory Manual, 3rd ed.; Cold Spring Harbor Laboratory Press: Cold Spring, NY, USA, 2001. [Google Scholar]
  31. Peacock, M.M.; Kirchoff, V.S.; Merideth, S.J. Identification and characterization of nine polymorphic microsatellite loci in the North American pika, Ochotona princeps. Mol. Ecol. Notes 2002, 2, 360–362. [Google Scholar] [CrossRef]
  32. Zgurski, J.M.; Davis, C.S.; Hik, D.S. Isolation and characterization of microsatellite loci for the collared pika (Ochotona collaris) and their cross-amplification in five other Ochotona species. Mol. Ecol. Resour. 2009, 9, 867–871. [Google Scholar] [CrossRef] [PubMed]
  33. Li, K.X.; Geng, J.N.; Yang, J.; Zhang, Y.M.; Hu, S.N. Isolation and characterization of 13 microsatellite loci in the plateau pika (Ochotona curzoniae). Conserv. Genet. 2009, 10, 785–787. [Google Scholar] [CrossRef]
  34. Van Oosterhout, C.; Hutchinson, W.F.; Wills, D.P.M.; Shipley, P. MICRO-CHECKER: Software for identifying and correcting genotyping errors in microsatellite data. Mol. Ecol. Notes 2004, 4, 535–538. [Google Scholar] [CrossRef]
  35. Jombart, T.; Devillard, S.; Balloux, F. Discriminant analysis of principal components: A new method for the analysis of genetically structured populations. BMC Genet. 2010, 11, 94. [Google Scholar] [CrossRef] [PubMed]
  36. Pritchard, J.K.; Stephens, M.; Donnelly, P. Inference of population structure using multilocus genotype data. Genetics 2000, 155, 945–959. [Google Scholar] [CrossRef]
  37. Evanno, G.; Regnaut, S.; Goudet, J. Detecting the number of clusters of individuals using the software STRUCTURE: A simulation study. Mol. Ecol. 2005, 14, 2611–2620. [Google Scholar] [CrossRef]
  38. Wang, J. MLNe: Simulating and estimating effective size and migration rate from temporal changes in allele frequencies. J. Hered. 2022, 113, 563–567. [Google Scholar] [CrossRef]
  39. Wang, J.; Whitlock, M.C. Estimating effective population size and migration rates from genetic samples over space and time. Genetics 2003, 163, 429–446. [Google Scholar] [CrossRef] [PubMed]
  40. Parreira, B.R.; Chikhi, L. On some genetic consequences of social structure, mating systems, dispersal, and sampling. Proc. Natl. Acad. Sci. USA 2015, 112, E3318–E3326. [Google Scholar] [CrossRef]
  41. Chesser, R.K. Influence of gene flow and breeding tactics on gene diversity within populations. Genetics 1991, 129, 573–583. [Google Scholar] [CrossRef] [PubMed]
  42. Chesser, R.K. Gene diversity and female philopatry. Genetics 1991, 127, 437–447. [Google Scholar] [CrossRef]
  43. Beaumont, M.A. Detecting population expansion and decline using microsatellites. Genetics 1999, 153, 2013–2029. [Google Scholar] [CrossRef]
  44. Wang, G.M.; Hobbs, N.T.; Slade, N.A.; Merritt, J.F.; Getz, L.L.; Hunter, M.; Vessey, S.H.; Witham, J.; Guillaumet, A. Comparative population dynamics of large and small mammals in the Northern Hemisphere: Deterministic and stochastic forces. Ecography 2013, 36, 439–446. [Google Scholar] [CrossRef]
  45. Archie, E.A.; Chiyo, P.I. Elephant behaviour and conservation: Social relationships, the effects of poaching, and genetic tools for management. Mol. Ecol. 2012, 21, 765–778. [Google Scholar] [CrossRef]
  46. Sjodin, P.; Kaj, I.; Krone, S.; Lascoux, M.; Nordborg, M. On the meaning and existence of an effective population size. Genetics 2005, 169, 1061–1070. [Google Scholar] [CrossRef]
  47. Wakeley, J.; Sargsyan, O. Extensions of the coalescent effective population size. Genetics 2009, 181, 341–345. [Google Scholar] [CrossRef] [PubMed]
  48. Kingman, J.F.C. The coalescent. Stoch. Process. Appl. 1982, 13, 235–248. [Google Scholar] [CrossRef]
  49. Taylor, J.; Véber, A. Coalescent processes in subdivided populations subject to recurrent mass extinctions. Electron. J. Probab. 2009, 14, 242–288. [Google Scholar] [CrossRef]
  50. Tarantino, R.; Panunzi, G.; Romano, V. Modeling of Hardy-Weinberg Equilibrium Using Dynamic Random Networks in an ABM Framework. In Complex Networks and Their Applications XI; Cherifi, H., Mantegna, R.N., Rocha, L.M., Cherifi, C., Miccichè, S., Eds.; Springer: Cham, Switzerland, 2022; pp. 241–250. [Google Scholar]
  51. Tellier, A.; Lemaire, C. Coalescence 2.0: A multiple branching of recent theoretical developments and their applications. Mol. Ecol. 2014, 23, 2637–2652. [Google Scholar] [CrossRef] [PubMed]
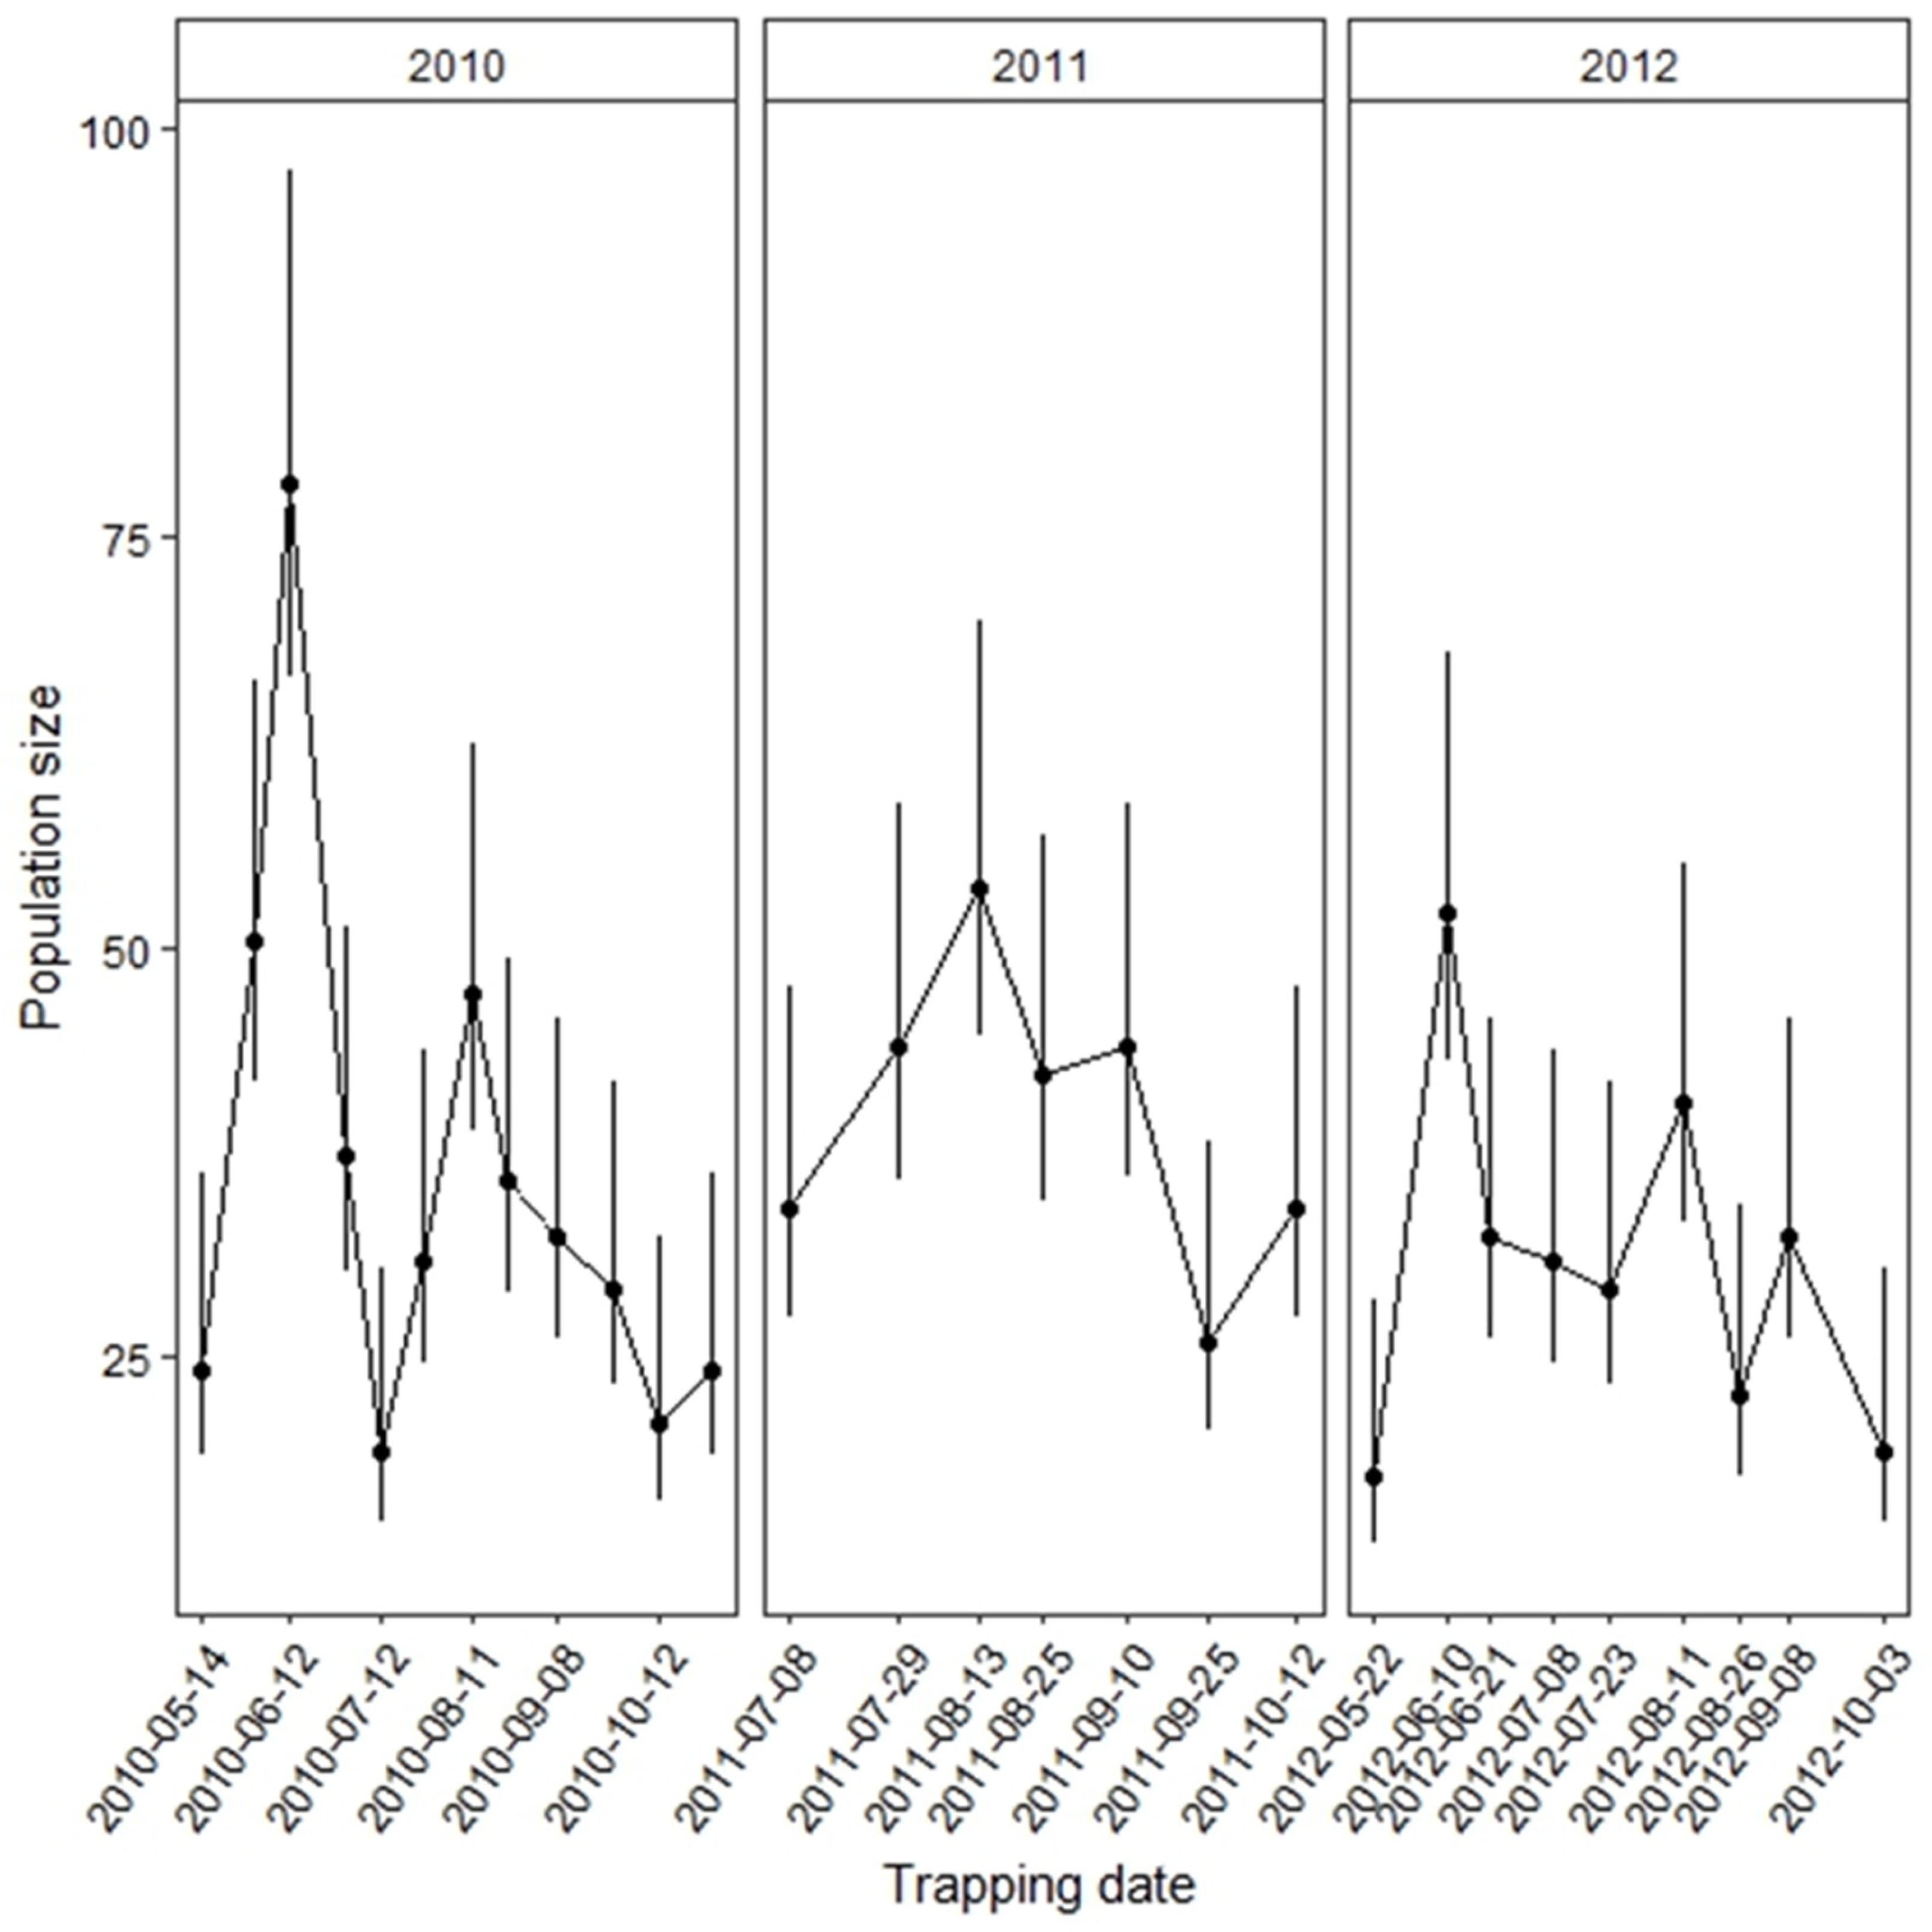
Figure 1. Estimates of biweekly population sizes of Daurian pikas in Inner Mongolia, China, with the robust design Cormack–Jolly–Seber model from May to October of 2010–2012. Vertical bars are the 95% confidence intervals.
Diversity 15 01173 g001
Figure 2. Bayesian information criterion (BIC) values (a) of DAPC analysis and the ΔK values (b) of STRUCTURE analysis for the different numbers of genetical clusters of Daurian pikas in Inner Mongolia, China, from 2010 to 2012.
Diversity 15 01173 g002
Figure 3. Scatter plot of the discriminant analysis of principal components of the genotypes of 226 Daurian pikas with 11 microsatellite loci. Each dot indicates a pika. An oval represents a genetic cluster. Numbers 1, 2, and 3 inside the ellipse indicate years 2010, 2011, and 2012, respectively. The inset at the bottom right corner shows the eigenvalues of two principal components.
Diversity 15 01173 g003
Figure 4. Bayesian genetic clustering of Daurian pikas in Inner Mongolia, China, from 2010 to 2012, using 11 microsatellite loci and the program STRUCTURE. Symbols at the bottom of the figure are labels of years: yr-1 for 2010, yr-2 for 2011, and yr-3 for 2012; vertical black lines are the separators between social groups; and colors represent genetic clusters.
Diversity 15 01173 g004
Table 1. Maximum likelihood (ML) estimates of effective population size ( N e of Daurian pikas using the temporal method and 11 microsatellite loci from 2010 to 2012. Symbol LLM stands for the lower limit of 95% confidence interval; ULM for the upper limit of 95% confidence interval; and word mean stands for the mean ML estimate.
PeriodLLM Mean   N e ULMActual Size (N) N e / N
2010–201115.817.2918.3637.140.46
2011–201232.5339.8353.8434.561.13
2010–201218.0719.4120.735.160.54
Disclaimer/Publisher’s Note: The statements, opinions and data contained in all publications are solely those of the individual author(s) and contributor(s) and not of MDPI and/or the editor(s). MDPI and/or the editor(s) disclaim responsibility for any injury to people or property resulting from any ideas, methods, instructions or products referred to in the content.