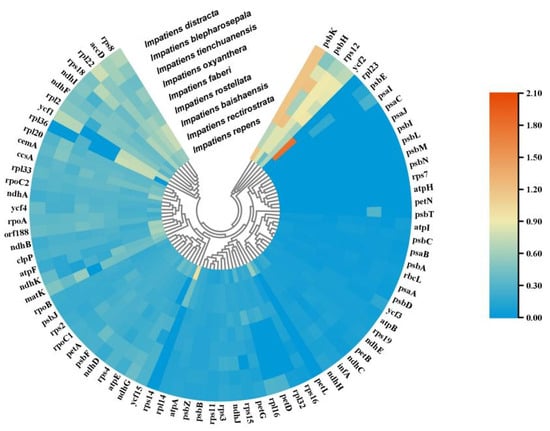
In the original publication [], there was a mistake in the legend for Selective pressure analysis results (Figure 7). Figure 7 is supposed to be for Selection Pressure Analysis, but in the original article, Figure 7 shows Codon Preference Analysis. The correct Figure 7 appears below. The authors state that the scientific conclusions are unaffected. This correction was approved by the Academic Editor. The original publication has also been updated.

Figure 7.
Selective pressure analysis results. Cluster heatmap showing the Ka/Ks values of chloroplast genomes from nine species, using Hydrocera triflora as a reference; the Ka/Ks value varies between 0 and 2.1, corresponding to a colour range of blue to red.
Reference
- Ma, H.; Liu, Z.; Lan, W.; Yang, M.; Mo, Q.; Huang, X.; Wu, P.; Huang, H.; Huang, M. Complete Chloroplast Genomes of 9 Impatiens Species: Genome Structure, Comparative Analysis, and Phylogenetic Relationships. Int. J. Mol. Sci. 2025, 26, 536. [Google Scholar] [CrossRef]
Disclaimer/Publisher’s Note: The statements, opinions and data contained in all publications are solely those of the individual author(s) and contributor(s) and not of MDPI and/or the editor(s). MDPI and/or the editor(s) disclaim responsibility for any injury to people or property resulting from any ideas, methods, instructions or products referred to in the content. |
© 2025 by the authors. Licensee MDPI, Basel, Switzerland. This article is an open access article distributed under the terms and conditions of the Creative Commons Attribution (CC BY) license (https://creativecommons.org/licenses/by/4.0/).