Abstract
The cryopreservation and transplantation of germline stem cells (GSCs) have become the key to conserving fish genetic resources and safeguarding species diversity. This study aimed to investigate the effects of post-mortem temperature and time on the preservation of oogonial stem cells (OSCs) in the marine fish Paralichthys olivaceus. OSCs remained viable after fish death, and they remained viable and could be cultured after storage at 19 °C for 15 h and at 4 °C for 24 h. Combined transcriptomic and metabolomic analysis was used to identify the pathways leading to OSC death. Several genes were differentially expressed in the ovarian tissue post-mortem, with the most enriched pathways being ferroptosis, fatty acid metabolism/biosynthesis, glutathione metabolism, citric acid cycle (TCA cycle), and arachidonic acid metabolism signaling pathways. Genes related to ferroptosis, such as vdac2, p53, and slc7a11, as well as metabolites such as adrenic acid and arachidic acid, can serve as reliable biomarkers for evaluating the viability of post-mortem OSCs. These findings provide valuable insights and theoretical support for the effective use of post-mortem GSCs and enhance strategies for germplasm resource conservation in fish.
1. Introduction
Fish biodiversity is decreasing owing to overfishing, pollution, and climate change. Therefore, conserving significant genetic resources and maintaining long-term protection is critical. Germplasm resources are conserved in vivo by establishing protected areas, breeding farms, and ex situ conservation facilities. However, this approach faces several challenges for endangered fish species, including high costs, slow results, and delayed intervention. Once fish die, their genetic resources of fish species cannot be passed on to future generations [1,2]. The in vitro preservation of germplasm includes the preservation of cell resources, such as sperm, oocytes, embryos, somatic cells, and stem cells, etc., and isolated chromosomes, DNA, and other genetic resources [3]. Fish germ stem cells (GSCs) have advantages over eggs and embryos owing to their developmental plasticity and bidirectional differentiation, which are essential for maintaining genetic continuity [4,5]. The transplantation of GSCs to conserve genetic resources has been successfully implemented in the rainbow trout (Oncorhynchus mykiss), Chinese sturgeon (Acipenser sinensis), and tiger puffer (Takifugu rubripes) and is of significant importance for biodiversity and the protection of endangered genetic resources [6,7,8,9].
GSCs for transplantation are commonly isolated fresh from gonadal tissues [10,11] or from frozen gonadal tissues [12,13]. However, isolating and conserving GSCs in wild and endangered fish remains difficult when death occurs under uncontrolled circumstances and cell isolation takes time [7]. Fish are often stored at an ambient temperature for several hours or days after death, with or without refrigeration [14]. During this period, tissue breakdown complicates the collection of viable cells and creates a considerable barrier to germplasm conservation [15].
Post-mortem cell isolation and its applications have mainly been studied in humans, with the harvesting of stem cells from cadaveric tissues emerging as a promising regenerative medicine approach [16,17,18,19]. Post-mortem adipose-derived mesenchymal stromal/stem cells can be readily isolated and cultured from the adipose tissue [16]. Viable and functional hepatocytes can be isolated within 12 h of thermal ischemic death [17], and transplantable hepatic cells can be isolated within 27 h of storage at 4 °C [18]. Additionally, mesenchymal stem cells have been isolated from equine cadaver suspensory ligaments within 48–72 h post-mortem [19]. Post-mortem gene expression studies in humans aimed to identify reliable molecular markers to improve the prediction of the time of death [20] and models have been developed to predict the time of death based on the effects of post-mortem cold ischemia on tissue transcriptomes [21]. Recent studies have demonstrated the usefulness of RNA expression analysis for post-mortem interval estimation [22,23,24]. To our knowledge, no prior reports have documented successful isolation and culture of GSCs from fish after death, or on post-mortem gene expression and metabolite changes in fish.
Here, we investigated the effects of post-mortem temperature and time on the preservation of oogonial stem cells (OSCs) in a marine fish, Paralichthys olivaceus. We aimed to determine the critical window of time for optimal OSC preservation by collecting and culturing the gonadal tissue of P. olivaceus that had been stored post-mortem at either 4 °C or 19 °C. Additionally, transcriptomic and metabolomic analyses were used to determine metabolite profiles, differential gene expression, and key genes and metabolites that could be used as biomarkers for evaluating the viability of post-mortem OGCs. These findings provide valuable insights and theoretical support for the effective use of post-mortem GSCs and enhance strategies for germplasm resource conservation in fish
2. Results
2.1. In Vitro Culture of OSCs at Different Time Intervals After Death
We examined the in vitro culture of cells from ovarian tissues harvested at different post-mortem intervals. The results from the ND (Normal Digestion temperature) group showed that OSCs could be passaged to at least the third generation when isolated within 15 h post-mortem at 19 °C (ND0h–ND15h), but not at ND18h (Table A1). Similarly, in the FD (Frozen Digestion temperature) group, OSCs could be passaged to at least the third generation when isolated within 24 h post-mortem at 4 °C (FD0h–FD24h), but not at FD27h (Table A2). Morphological examination revealed that ND15h cells migrated from the tissue explant, and the morphology of the passaged cells was comparable to that of the 0 h control (Figure 1A). However, attempts to establish cell lines at ND18h were unsuccessful, as cells initially adhered but subsequently enlarged and underwent apoptosis over time (Figure 1A).
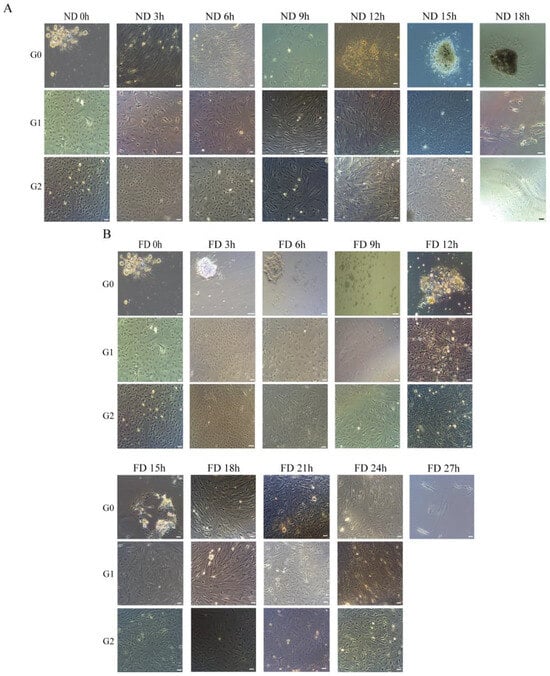
Figure 1.
Morphology of P. olivaceus oogonial stem cells established from post-mortem ovarian tissues at different time intervals. (A) ND group (stored at 19 °C). (B) FD group (stored at 4 °C). The scale bar in all panels represents 50 µm.
As shown in Figure 1B, FD24h cells adhered to the culture surface, and the passaged cells displayed irregular polygonal morphologies. In contrast, FD27h cultures contained only sparse adherent cells, which exhibited an enlarged, flattened morphology and ultimately lost viability (Figure 1B). Notably, cell lines isolated and cultured separately from both ND15h and FD24h have been maintained for over 50 passages.
This loss of culturability was directly correlated with a progressive decline in cell viability, as assessed by trypan blue staining. The FD group maintained a cell survival rate above 60% for 9 h, whereas the ND group maintained a rate above 50% for 6 h. Survival rates decreased progressively in both groups, with the ND group exhibiting significantly lower viability than the FD group. The ND group showed complete loss of viability by 21 h, while the FD group maintained viability until 27 h (Figure 2C). Observation of histological sections showed preserved oocyte morphology with no significant signs of cellular degradation or structural damage in ovarian tissues across all designated time points (0h, ND15h, ND18h, FD24h, and FD27h) (Figure A1). We also observed that the gonadal index (GSI) was higher at ND18h and lower at ND15h, indicating that cell viability or culture success was not affected by GSI (Table A9).

Figure 2.
(A) Alkaline phosphatase detects cell stemness. Scale bar: 50 µm. (B) Marker genes identify cell tissue type and stemness expression. M: maker; vasa: 502 bp; oct4: 205 bp; 18s rRNA: 257 bp. (C) Cell viability assessment by trypan blue exclusion. Data represent mean ± SD of three independent biological replicates (n = 3), with approximately 500 cells counted per replicate. ND group: red line; FD group: blue line. (D) Validation of RNA-Seq results by qRT-PCR. Comparison of log2FoldChange values between RNA-Seq (x-axis) and qRT-PCR (y-axis) for 10 selected genes (n = 3). Pearson correlation coefficient (R) and p-value are shown.
2.2. Detection of Stem Cells Using Alkaline Phosphatase and RT-PCR
Staining for alkaline phosphatase showed strong intracellular purplish-red precipitate in the majority of cells, confirming the presence of oogonial stem cells in the ND15h and FD24h groups (Figure 2A). Further gene expression analysis showed that the germ stem cell marker genes vasa, oct4 and the cell origin gene 18s rRNA from P. olivaceus expressed in the cell lines (Figure 2B). Vasa is a highly conserved RNA helicase specifically expressed in germline cells across animal species, serving as a definitive marker for the germ cell lineage [25]. Oct4 (also known as pou5f1), a POU-domain transcription factor, is a critical regulator of pluripotency and self-renewal in stem cells [26]. These results indicated that the cell line is oogonia stem cells.
2.3. Identification of DEGs at Different Times of ND Group and FD Group
To investigate the molecular mechanisms underlying the observed decline in cell viability and loss of culturability, we performed transcriptomic analysis on ovarian tissues by comparing ND18h vs. ND15h (where OSC cultures failed versus succeeded at 19 °C) and FD27h vs. FD24h (where OSC cultures failed versus succeeded at 4 °C). High-quality transcriptomes were obtained from three independent biological replicates per time point (Q20 > 97%; mapping rate > 90%; Table A3 and Table A4), yielding 21,087 expressed genes. Differential expression analysis was performed by comparing the last viable time point with the first non-viable time point within each storage condition (ND18h vs. ND15h and FD27h vs. FD24h). This comparison identified 91 differentially expressed genes (DEGs) (48 upregulated and 43 downregulated) in the ND group and 3887 DEGs (1942 upregulated and 1945 downregulated) in the FD group. The reliability of the transcriptome data was confirmed by qRT-PCR (Figure 2D).
Subsequently, heat maps were generated based on the differences in gene expression patterns, and the six samples clustered distinctly between ND and FD groups (Figure 3C,D).
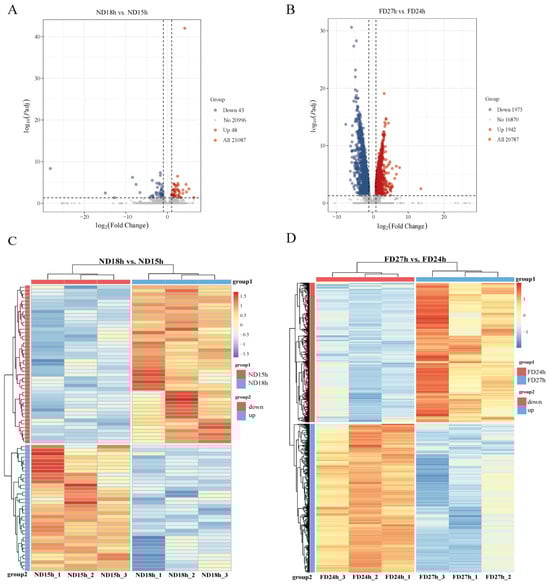
Figure 3.
(A,B) Volcano plots of differentially expressed genes (DEGs) with thresholds of |log2FoldChange| > 1 and padj < 0.05. Red points: significantly upregulated genes; blue points: significantly downregulated genes; gray points: non-significant genes (n = 3). (C,D) Hierarchical clustering heatmaps of DEGs. Color scale represents Z-score normalized expression values.
2.4. Enrichment Analysis of DEGs and Non DEGs
To better understand the biological significance of DEGs between ND18h vs. ND15h, GO enrichment analysis identified 91 DEGs that were significantly associated with biological processes such as pyruvate metabolism, glycolysis, nucleoside diphosphate phosphorylation, ATP generation, and nucleoside diphosphate metabolism. Molecular functions are linked to protein kinase inhibitors and related regulatory activities. (Figure 4A). The top 20 enriched pathways showed that these DEGs were mainly involved in cellular processes such as senescence, necroptosis, p53 signaling, peroxisome function, cell cycle, calcium signaling in environmental processing, and various metabolic pathways, including arginine and proline metabolism, glycolysis/gluconeogenesis, and pyruvate metabolism (Figure 4E and Table A5). These findings suggest that the failure of OSC culture at 19 °C beyond 15 h is associated with disruption in energy metabolism and activation of specific cell death pathways.

Figure 4.
GO enrichment analysis and KEGG pathway enrichment analysis in ND18 vs. ND15h DEGs (A,B), FD27 vs. FD24h DEGs (C,D), FD24h and ND15h non DEGs (E,F) and FD27h and ND18h non DEGs (G,H) (n = 3). GO enrichment analysis of DEGs and non-DEGs. Bar length represents −log10 (p-value). Only significantly enriched terms (p < 0.05) are shown. KEGG pathway enrichment analysis. Bubble size represents gene count; color represents −log10 (p-value).
The 3887 DEGs in FD27h vs. FD24h were significantly enriched in various GO categories, including peptide and amide biosynthetic and metabolic processes in biological processes; ribosome structure, molecule activity, and transcription factor activity in molecular functions; and ribosome and ribonucleoprotein complexes in cellular components (Figure 4B). The top 20 pathway maps indicated the involvement of ribosomes, RNA polymerase, RNA degradation, and proteasomes in genetic information processing; oxidative phosphorylation, lysine degradation, and steroid biosynthesis in metabolism; and cardiac muscle contraction in organismal systems (Figure 4F and Table A6). This comprehensive disruption of core cellular machinery, particularly in protein synthesis and energy production, underlies the loss of cell viability under refrigerated conditions beyond 24 h.
For the 6593 non DEGs (padj > 0.05, log fold change ± 0.5) in FD24h and ND15h, GO enrichment analysis revealed significant involvement in ion transport, immune response, immune system process, developmental process, and anatomical structure development within biological processes. In terms of molecular functions, they were linked to G protein-coupled receptor activity, channel activity, and passive transmembrane transporter activity, whereas in cellular components, they were associated with the extracellular region (Figure 4C). The top 20 enriched pathways showed that these non-DEGs were primarily involved in neuroactive ligand-receptor interactions, cytokine-cytokine receptor interactions, calcium signaling pathways, and MAPK signaling pathways in environmental information processing, as well as in purine metabolism (Figure 4G and Table A7). The stability of these genes and pathways in culturable cells suggests their essential role in maintaining fundamental cellular functions necessary for viability.
For the 6081 non DEGs in FD27h and ND18h, GO enrichment analysis revealed significant involvement in ion transport, immune response, cell adhesion, and biological adhesion within biological processes; G-protein coupled receptor activity, channel activity, and passive transmembrane transporter activity in molecular functions; and the extracellular region and matrix in cellular components (Figure 4D). The top 20 enriched pathways showed that these non-DEGs were primarily associated with neuroactive ligand-receptor interactions, calcium signaling, cytokine-cytokine receptor interactions, and MAPK signaling pathways in environmental information processing, as well as purine metabolism (Figure 4H and Table A8). The preservation of these core cellular processes even in non-viable cells indicates they represent fundamental cellular infrastructure that remains intact despite the activation of cell death mechanisms.
2.5. Identification of DEMs at Different Times of ND Group and FD Group
Metabolite profiling was performed using four independent biological replicates per time point. The PLS-DA score plot showed that samples from both the ND and FD groups were clearly differentiated in the principal components (Figure 5A,B). The evaluation parameters obtained from OPLS-DA are (ND18h vs. ND15h (R2Y = 0.999 cumulative, Q2 = 0.777 cumulative) and FD27h vs. FD24h (R2Y = 0.996 cumulative, Q2 = 0.708), indicating stable and reliable results (Figure 5C,D). The loading plot results revealed that the metabolites with the greatest contribution to the ND18h vs. ND15h groups were predominantly phospholipids, including PC 19:2_18:5, CAR 21:3, LPC O-17:1, PC 37:7, and LPC O-19:1 (Figure 5E). In contrast, the metabolites with the greatest contribution in the FD24h vs. FD27h groups were primarily glycolipids, such as MGDG O-28:6_18:1, N-P-Coumaroyl Spermidine, ST 28:1;O;Hex;FA 18:2, 11-Deoxy prostaglandin F2β, and Prostaglandin K1 (Figure 5F). These metabolites play a key role in the structural formation of cell membranes, helping maintain membrane stability and fluidity.
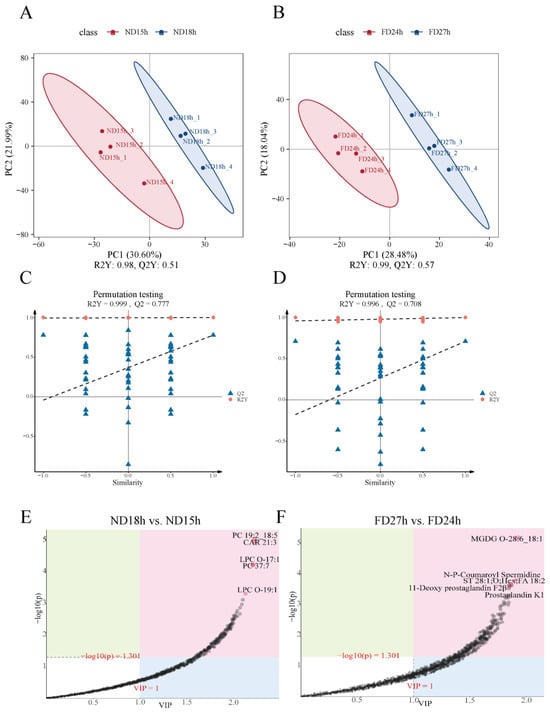
Figure 5.
Score plots for PLS-DA in the (A) ND group and (B) FD group (n = 4). Permutation Test Plot and feature importance metabolites for OPLS-DA in the (C,E) ND18h vs. ND15h and (D,F) FD27h vs. FD24h. Notes: In the score plots, the closer R2Y and Q2 are to 1, the more stable and reliable the model is, Q2 > 0.5 indicates stable and reliable model, 0.3 < Q2 ≤ 0.5 indicates moderate model stability and reliability, and Q2 < 0.3 indicates poor model stability and reliability. In the loading plot, the variables are farther away from the origin in the direction of the horizontal coordinate contributes more to the differentiation between the two sets of samples.
2.6. Enrichment Analysis of DEMs
Of the 171 DEMs selected in the ND18h versus ND15h group, PC 19:2_18:5, PC 37:7, LPC O-19:1, LPC O-17:0, and FAHFA 17:0/22:4 were significantly upregulated. JNJ-1661010, PC 16:0_16:1, Taurochenodeoxycholic Acid (sodium salt), LMK, and CAR 12:0 were significantly down-regulated (Figure 6A). Among the 146 DEMs selected in the FD24h vs. FD27h group, 2-(2-amino-3-methylbutanamido)-3-phenylpropanoic acid, PC O-35:3, JWH 019 N-(6-hydroxyhexyl) metabolite, N-(6-hydroxyhexyl) metabolite and CUMYL-PICA N-pentanoic acid metabolite were significantly up-regulated, 2-[(4-chlorophenyl)sulfonyl]-N,N-dimethylacetamide, FAHFA 17:0/20:3, Androsterone glucuronide, Docosatrienoic acid and FAHFA 18:1/18:2 were significantly down-regulated (Figure 6B). Among the top 10 enriched pathways between the ND15h and ND18h DEMs, the Biosynthesis of unsaturated fatty acids, glyoxylate and dicarboxylate metabolism, citrate cycle (TCA cycle), and fatty acid biosynthesis were significant (Figure 6C). Among the top 10 enriched pathways between the FD24h and FD27h DEMs, 2-Oxocarboxylic acid metabolism, citrate cycle (TCA cycle), porphyrin and chlorophyll metabolism, and C5-Branched dibasic acid metabolism were noticeable (Figure 6D). Arginine and Proline Metabolism and Porphyrin and Chlorophyll Metabolism were significantly enriched in FD24h and ND15h non-DEMs (Figure 6E), whereas Glyoxylate and Dicarboxylate Metabolism, Glycine, Serine and Threonine Metabolism, and Fatty Acid Metabolism/Degradation were enriched in FD27h and ND18h non-DEMs (Figure 6F).
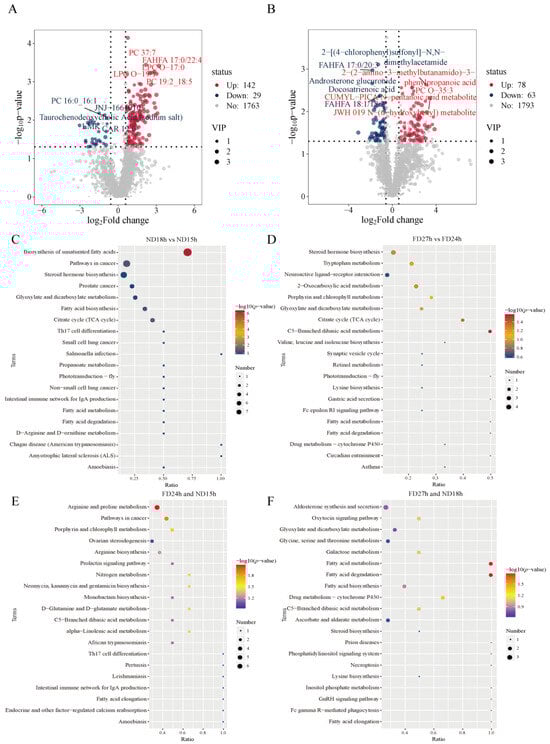
Figure 6.
(A,B) Volcano plot analysis and (C,D) KEGG pathway enrichment analysis of differentially expressed metabolomics in ND18h vs. ND15h and FD27h vs. FD24h (n = 4). KEGG pathway enrichment analysis of (E) FD24h and ND15h, (F) FD27h and ND18h non DEMs (n = 4).
2.7. Joint Analysis of Transcriptome and Metabolomics
To gain a systems-level understanding of the molecular events leading to the loss of cell viability, we performed an integrated analysis of the transcriptomic and metabolomic data from the ND and FD groups. Pathway analysis revealed distinct metabolic disruptions associated with the failure of cell culture in each group. In the ND group, the transition from culturable (ND15h) to non-culturable (ND18h) states was characterized by significant alterations in six key pathways, including fatty acid degradation, glycerolipid metabolism, and pyruvate metabolism, indicating a severe disruption in energy homeostasis and membrane integrity (Figure 7A). A more extensive metabolic collapse was observed in the FD group during the critical window between FD24h and FD27h, involving 18 pathways such as the TCA cycle, fatty acid metabolism, and amino acid biosynthesis, reflecting a systemic failure of core metabolic processes (Figure 7B).

Figure 7.
(A–D) The shared pathways enriched by the com bined analysis of the transcriptome and metabolome.
Further analysis focused on the molecular signatures distinguishing culturable (CE: FD24h and ND15h) from non-culturable (NCE: FD27h and ND18h) conditions. In the CE group, the stability of 6593 genes and 1212 metabolites was associated with 30 shared pathways crucial for cellular maintenance. These included fatty acid metabolism and elongation, which help preserve membrane stability, alongside the activation of glutathione metabolism and the pentose phosphate pathway, which collectively protect cells from oxidative stress (Figure 7C). Conversely, the NCE group, characterized by 6081 stable genes and 1376 stable metabolites, exhibited 39 shared pathways predominantly linked to cell death processes. These were categorized into three major events: (1) activation of specific cell death pathways such as necroptosis and ferroptosis; (2) pathways associated with oxidative stress and mitochondrial dysfunction, including impaired fatty acid degradation and glutathione metabolism; and (3) pathways related to apoptosis, such as perturbations in the TCA cycle and calcium signaling (Figure 7D).
Crucially, a direct comparison between the CE and NCE groups identified arginine and proline metabolism and alpha-linolenic acid metabolism as upregulated in viable cells, while the calcium signaling pathway was downregulated. We propose that these specific pathway differences are critical determinants for the successful in vitro culture of cells, highlighting key metabolic features that distinguish viable OSCs from those that have undergone irreversible damage.
3. Discussion
We discovered that viable cells from P. olivaceus ovaries could be harvested and successfully cultured (>50 passages) in vitro after preservation at 4 °C for up to 24 h or at 19 °C for up to 15 h post-mortem while maintaining their stemness. Combined with our previously established transplantation protocol in this species [7], which demonstrated that OSCs from fresh tissues can colonize recipient gonads and produce functional gametes, the current work provides a practical solution for obtaining donor cells from unexpectedly deceased individuals. This approach could be particularly valuable for conserving genetic resources from elite broodstock that die prematurely in aquaculture operations or from endangered individuals found dead in natural habitats. However, the maximum isolation time window at other temperatures requires further investigation. Comparable human studies have shown that hepatocytes remain functional after 12 h of warm ischemia [17] and can regenerate liver tissue when extracted up to 27 h post-mortem after storage at 4 °C [18]. Additionally, storing the brain post-mortem at 4 °C for a week, 15 °C for 48 h, or 25 °C for 24 h can generate neural stem/progenitor cells [15]. Storing ovarian tissues at 4 °C rather than room temperature is essential for preserving their integrity and oocyte viability in both chickens and post-mortem mice [27,28]. This low-temperature storage maintains oocyte quality and quantity and improves in vitro culture success [29]. It slows metabolic processes and tissue autolysis and reduces cellular damage during ischemia. Although this method is widely used for organ preservation [14,30,31], one study found that ovarian tissues stored at low temperatures could delay cell death and have an advantage in cell culture, especially with long-term storage. Similar results have been reported for fibroblasts from animal ear skin [32,33,34]. This indicates the existence of specificity among different species and tissues. While the present study primarily focuses on OSCs, future investigations on spermatogonial stem cells (SSCs) from post-mortem testicular tissues would provide comprehensive support for germplasm resource conservation strategies.
3.1. Post-Mortem Energy Metabolism Disruption and Its Impact on Cells
Following death, cessation of blood circulation causes hypoxia, leading to impaired aerobic respiration and increased reactive oxygen species (ROS) production [35,36,37]. We found that genes related to early and middle glycolysis, such as aldob, tpi1, and gapdh, were upregulated. Glycolysis produces pyruvate, which is converted to oxaloacetate by pyruvate carboxylase (PC) and enters the TCA cycle [38]. However, PC expression was significantly downregulated at 27 h post-mortem, similar to eHHADH, which affected fatty acid breakdown and acetyl-CoA production. This indicates a decrease in aerobic metabolism and ATP supply, prompting a shift to anaerobic metabolism and lactate production [39].
Amino acids fuel the TCA cycle and replenish its intermediates, thereby sustaining energy production and metabolic homeostasis [40] while also mediating signaling, antioxidant defense, and stress responses [41]. Post-mortem, we observed widespread disruption of amino acid metabolism, with marked reductions in arginine, tryptophan, alanine, aspartate, glutamate, and lysine levels that collectively compromised the energy supply. Arginine is recognized for its antioxidant capacity in alleviating oxidative stress across multiple species [42]—declining 18 h post-mortem and amplifying ROS accumulation and apoptosis. Alanine, aspartate, and glutamate, which normally sustain proliferation and redox balance via energy provision, nucleotide biosynthesis, and antioxidant defense [43], were also significantly depleted, directly weakening the TCA cycle flux. Meanwhile, elevated L-saccharopine and decreased androsterone glucuronide and 2-hydroxyestradiol further disturb amino acid networks, undermining cellular viability and growth [44].
To sustain short-term survival under the initial post-mortem stress, compensatory mechanisms are activated. Consistent with observations in other fish species such as Oreochromis niloticus [45], Cyprinus carpio var. Qingtianensis [46], Crucian carp [47] and C. auratus [48], the pentose phosphate pathway (PPP) is activated to generate nucleotide precursors and NADPH for redox maintenance [49]. Our transcriptomic data from P. olivaceus further reveal that sustained hypoxia rapidly suppresses purine metabolism: key genes—including adenylate cyclase 9 (adcy9), adenylate cyclase 2 (adcy2), phosphoribosylformylglycinamidine synthase (pfas), and 5′-nucleotidase, cytosolic II (nt5c2) were down-regulated, thereby reducing the ATP and nucleotide pools. This is consistent with observations in pearl gentian grouper under hypoxia, where oxidative phosphorylation and energy production are impaired [39], and aligns with the known conservation of this energy-stress response in vertebrates [50].
Simultaneously, our multi-omics analysis indicates a compensatory activation of the glutathione pathway, in which cysteine-driven GSH synthesis assisted by methionine helps scavenge lipid radicals [51]. However, by 27 h post-mortem in our study, amino acid depletion and continued ROS accumulation overwhelm these defenses, and GSH-mediated repair can no longer restore the redox balance. Consequently, no viable cells can be isolated for in vitro culture, indicating that compensatory antioxidant mechanisms are exhausted and metabolic homeostasis is irreversibly lost.
3.2. Post-Mortem Lipid Metabolism Disruption and Its Impact on Cellular Integrity
The lipid metabolic network is central to energy and membrane homeostasis and oxidative stress disrupts lipid metabolism [52]. Glycerophospholipids are essential for maintaining membrane structure, organelle function, and cellular energy balance. In this study, PC 40:9 and PC 37:7 were markedly upregulated, providing fluidity and integrity to the lipid bilayer as a compensatory response to membrane damage. In contrast, phospholipases hydrolyze glycerophospholipids into arachidonic acid (AA) and lysophospholipids; specifically, lysophosphatidylcholines (LysoPC 20:0, 20:1 and 18:2/0:0) and 2,3-dinor-8-epi-PGF2α were significantly elevated, destabilizing membranes and inducing necrosis [53]. These lipid changes are mechanistically linked to the activation of ferroptosis. The marked upregulation of polyunsaturated fatty acids (PUFAs), including adrenic and arachidic acids, supplies the lipid substrates required for peroxidation in ferroptosis [54,55]. This process is further promoted by the upregulation of key ferroptosis-related enzymes—acyl-CoA synthetase long-chain family member 4 (ACSL4) and lysophosphatidylcholine acyltransferase 3 (LPCAT3)—which integrate PUFAs into membrane phospholipids, thereby facilitating peroxidation [56,57]. Ferroptosis, an iron-dependent form of cell death driven by lipid peroxidation [58,59], is also regulated by the p53–SLC7A11 axis. We observed that slc7a11 expression was significantly downregulated in the non-cultivable (NCE) group compared to the cultivable (CE) group, while p53 was upregulated. As slc7a11 is a downstream target of p53 [60,61], its suppression reduces cystine uptake, depletes glutathione, and inactivates glutathione peroxidase, thereby accelerating lipid peroxidation [58,62,63]. Additionally, mitochondrial dysfunction arising from impaired TCA cycle activity upregulates vdac2, enhancing ROS production and further promoting lipid peroxide formation [64,65,66]. In line with this, vdac2 expression was significantly elevated at ND27h, reinforcing a vicious cycle of oxidative damage. In summary, post-mortem disruption of energy and lipid metabolism converges on ferroptosis as a central executioner of cell death, leading to the irreversible loss of cellular viability and in vitro culturability (Figure 8). Although ferroptosis appears to be the principal mechanism, contributions from other pathways such as autophagy and necroptosis—as suggested by KEGG enrichment results—cannot be excluded and may act in parallel or as secondary processes.
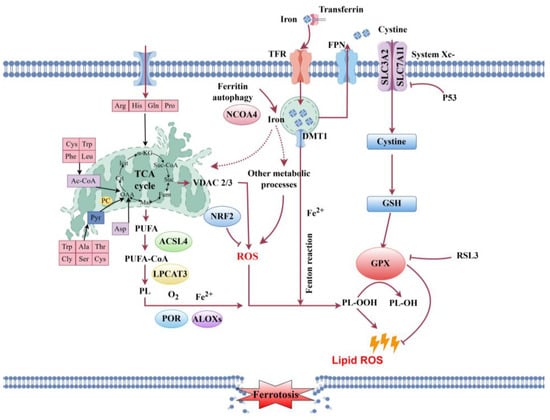
Figure 8.
A proposed model illustrating the molecular mechanisms leading to oogonial stem cell death in post-mortem P. olivaceus ovarian tissue, based on integrated transcriptomic and metabolomic analyses. The model highlights the central role of oxidative stress and the activation of ferroptosis. Key abbreviations and components are: ROS, reactive oxygen species; TCA cycle, tricarboxylic acid cycle; ACSL4, acyl-CoA synthetase long-chain family member 4; LPCAT3, lysophosphatidylcholine acyltransferase 3; PUFA-PL, polyunsaturated fatty acid-containing phospholipids; PUFA-OOH, peroxidized polyunsaturated fatty acids; SLC7A11, solute carrier family 7 member 11 (a subunit of the system Xc-cystine/glutamate antiporter); GPX4, glutathione peroxidase 4; GSH, reduced glutathione; GSSG, oxidized glutathione. The process occurs within the oogonial stem cell, with key events taking place in the mitochondria (ROS production, TCA cycle dysfunction), the endoplasmic reticulum (involvement of ACSL4 and LPCAT3 in lipid metabolism), and at the plasma membrane (location of the system Xc-antiporter and subsequent lipid peroxidation leading to loss of membrane integrity). In this schematic, black and red arrows indicate promoting or activating relationships, while red arrows with blunt ends indicate inhibitory relationships.
4. Materials and Methods
4.1. Experimental Animal and Sampling
All the P. olivaceus used in the trials were yearlings obtained from the Beidaihe Central Experiment Station of the Chinese Academy of Fishery Sciences (Approval Code: BCES2023003). The body weight and gonad weight for all P. olivaceus are provided in Table A9. All P. olivaceus were anesthetized with 100 mg/L MS222 (E808894, macklin, shanghai, China), and then the spinal column was euthanized by spinal transection, and stored at two temperatures, 19 °C (named ND group, Normal Digestion temperature) or 4 °C (named FD group, Frozen Digestion temperature), respectively. Ovarian tissue samples were collected from both ND and FD groups at ten post-mortem intervals (0, 3, 6, 9, 12, 15, 18, 21, 24, and 27 h). A portion of the collected samples was immediately processed for primary cell line establishment according to a previously published protocol [67]. The remaining tissue samples were rapidly frozen in liquid nitrogen and stored at −80 °C for subsequent metabolomic and transcriptomic analyses.
4.2. Detection of Cell Survival Rates
Gonadal tissues were collected from P. olivaceus at each time point and minced into 1–2 mm3 fragments. The fragments were incubated in 1 mL trypsin solution at 23 °C for 30 min with gentle agitation. Digestion was stopped by adding 1 mL of complete medium (supplemented with 10% FBS). The cell suspension was filtered through a 40 μm cell strainer, centrifuged at 300× g for 5 min, and the pellet was resuspended in 1 mL PBS. Cell viability was immediately assessed using the Trypan Blue Cell Viability Detection Kit (C0011, Beyotime, shanghai, China), following the manufacturer’s instructions. Approximately 500 cells per sample were counted using a hemocytometer to distinguish total cells from blue-stained (non-viable) cells. Viability (%) was calculated as [(total cells − blue cells)/total cells] × 100%. Each time point was analyzed in triplicate.
4.3. Alkaline Phosphatase and RT-PCR Analysis
Alkaline phosphatase staining was performed on ND15h and FD24h cells that had been passaged to the third generation. The specific procedure was as follows: cells were first washed twice with PBS, fixed with 4% paraformaldehyde for 30 min, and then subjected to alkaline phosphatase staining using the Beyotime C3250S kit (Beyotime, Shanghai, China) according to the manufacturer’s instructions. Finally, images were captured using an inverted microscope. RT-PCR primers for vasa, oct4 and 18S rRNA (Table A10) were designed using Primer Premier 5.0. The reactions were performed using an S1000 thermal cycler (Bio-Rad, Hercules, CA, USA). Reactions (20 μL) contained 10 μL 2X Hieff PCR Master Mix (With Dye), 10 μM each primer, 1 μL cDNA and 8 μL RNase-free water. Cycling: 94 °C 5 min; 94 °C 30 s, 58 °C 30 s, 72 °C 15 s cycle 30 times; 72 °C 10 min. The products were resolved on a 1% agarose gel at 120 V for 20 min and imaged using a Tanon 5200 Multi system (Tanon, Shanghai, China).
4.4. RNA Sample Collection, Library Construction, and Sequencing
Ovarian samples from the ND and FD groups were collected in triplicate. The samples subjected to 15 h (ND15h) and 18 h (ND18h) of death at 19 °C were named ND15h_1, ND15h_2, ND15h_3, ND18h_1, ND18h_2, and ND18h_3, respectively. The samples subjected to 24 h (FD24h) or 27 h (FD27h) of death at 4 °C were named FD24h_1, FD24h_2, FD24h_3, FD27h_1, FD27h_2, and FD27h_3, respectively. Total RNA was extracted using the Total RNA Extraction Kit (DP419, TIANGEN, Beijing, China) and a Bioanalyzer 2100 system (Agilent Technologies, Santa Clara, CA, USA), and RNA integrity was evaluated using the RNA Nano 6000 Assay Kit. To create tiny fragments, polyA tail-containing mRNA was isolated using oligo (dT) magnetic beads and interrupted with divalent cations in NEB fragmentation buffer [68]. First strand cDNA was generated using random oligonucleotides as primers in an M-MuLV reverse-transcriptase device. The RNA strand was then destroyed with RNase H, and a second strand of cDNA was created using dNTPs in a DNA polymerase I apparatus. The isolated double-stranded cDNA was end-repaired, A-tailed, and ligated to sequencing junctions. cDNAs ranging from 250 to 300 bp were screened with AMPure XP beads, amplified by PCR, purified again with AMPure XP beads to create the final library, and sequenced on an Illumina NovaSeq platform (Novogene, Beijing, China).
4.5. Transcriptome Assembly, Functional Annotation, and Data Analysis
The raw sequencing data was filtered by fastp [69] to exclude reads with adapters, N-containing sequences, and low quality (Q ≤ 5). The error rate and GC content were evaluated to ensure clean readings were aligned to an index reference genome created using HISAT (v2.2.1) [70]. The transcriptome was assembled using StringTie (v2.2.1) [71] and annotated in databases such as Protein Family (Pfam), Gene Superfamily (superfamily), Gene Ontology Database (GO), and Kyoto Encyclopedia of Genes and Genomes (KEGG). Differential analysis was performed using DESeq2 software (v1.38.3) [72], with differential gene screening criteria of |log2 (fold change) > 1| and padj < 0.05. GO functional and KEGG pathway enrichment studies were carried out on the differential gene sets using the ClusterProfiler software (v4.6.2) [73]. A degree with a p-value of 0.05 was deemed statistically significant in these analyses.
4.6. Metabolite Extraction and LC-MS/MS Analysis
Four biological replicates of the ovarian samples from the ND and FD groups were examined using untargeted LC-MS [74,75]. A 100 mg tissue sample from each individual specimen was powdered in liquid nitrogen, added to 500 μL of 80% methanol, vortexed and agitated, stored at 4 °C for 5 min, then centrifuged at 15,000× g for 20 min. The supernatant was collected and diluted to a final concentration of 53% methanol with LC-MS grade water before centrifugation at 15,000× g, 4 °C for 20 min. Finally, the supernatant was fed into the LC-MS (Agilent 5977A, Agilent Tachnologies, Santa Clara, CA, USA) analytical system [76]. A 17 min linear gradient with a flow rate of 0.2 mL/min was used to inject the samples onto a Hypersil Gold column (25002-102130, Thermo Fisher Scientific, Waltham, MA, USA). The positive polarity mode used eluents A (0.1% FA in water) and eluent B (methanol). The eluents for the negative-polarity mode were A (5 mM ammonium acetate, pH 9.0) and B (methanol). The scanning range was set at m/z 100–1500. The data were predicted and normalized to obtain metabolite identification and relative quantification results.
4.7. Metabolomics Data Analysis
Statistical analyses were performed using R (v3.4.3) [77], Python (Python 2.7.6 version) [78] and CentOS (CentOS release 6.6) [79]. The identified metabolites were annotated using KEGG (accessed on 1 February 2024), HMDB (accessed on 1 February 2024), and LIPID MAPS (accessed on 1 February 2024) databases. Data were transformed for principal component analysis (PCA) and orthogonal partial least squares discriminant analysis (OPLS-DA) were performed using R (v3.4.3) with the MetaX package (source code available at https://github.com/wenbostar/metaX, accessed on 1 February 2024) [80]. The default criteria for differential metabolite screening included VIP > 1, p-value < 0.05, and FC ≥ 1.5 or FC ≤ 0.5. Correlation analysis (Pearson’s correlation coefficient) between differential metabolites was performed using R language cor() (v3.4.3), and statistical significance (p-value < 0.05) was achieved via the cor.mtest() (v0.92) in R language. The functions of these metabolites and their metabolic pathways were investigated using the Kyoto Encyclopedia of Genes and Genomes database. Metabolic pathway enrichment of differential metabolites was performed; when the ratio was satisfied by x/n > y/N, the metabolic pathway was considered to be enriched, and when p-value of the metabolic pathway was <0.05, the metabolic pathway was considered to be significantly enriched.
4.8. Combined Analysis of Transcriptomics and Metabolomics
To achieve a comprehensive understanding of the molecular mechanisms driving phenotypic divergence, we performed an extensive cross-omics analysis, integrating transcriptomic and untargeted metabolomic data. Initially, differentially expressed genes (DEGs) with |log2FC| ≥ 1 and a false discovery rate (FDR) < 0.05, along with differentially expressed metabolites (DEMs) characterized by |log2FC| ≥ 1, variable importance in projection (VIP) > 1, and p < 0.05, were mapped to their corresponding KEGG pathways utilizing the clusterProfiler (v4.6.2) [81] and MetaboAnalystR (v3.3) tools [82]. Pathway enrichment analysis was conducted using a hypergeometric test with an FDR threshold of <0.05. To enhance the robustness of our findings, pathways represented by fewer than three DEGs or DEMs were excluded, allowing us to focus on shared pathways for subsequent analyses.
4.9. qRT-PCR Validation of DEGs
We selected ten DEGs from ND group (ND18h vs. ND15h) and FD group (FD27h vs. FD24h), respectively, for qRT-PCR to verify the reliability of the RNA-Seq results. Based on the CDS of the selected gene, twenty pairs of primers were designed using Primer Premier software (version 5.0) (Table A10). β-actin was used as an internal reference gene. qRT-PCR mixture (20 μL) consisted of 10 μL TB Green® Premix Ex Taq™ (Takara, Kusatsu, Japan), 0.5 μL of each primer (10 μM), 1 μL of cDNA, and 8 μL of RNA-free water. Reactions were performed on a q225 qRT-PCR platform (Novogen, Tianjin, China) under the following thermal cycling conditions: 94 °C for 2 min, 94 °C for 30 s, and 60 °C for 20 s. Three biological replicates of each treatment were analyzed. The relative expressions of genes were calculated using the 2−ΔΔCt method [83].
5. Conclusions
This study establishes that viable oogonial stem cells (OSCs) can be successfully isolated and cultured from post-mortem ovarian tissues of P. olivaceus within defined time windows: 15 h at 19 °C and 24 h at 4 °C. Beyond these critical intervals, our predictive analysis revealed that cell culture failure is primarily attributable to ferroptosis triggered by lipid peroxidation. This mechanistic insight is further supported by the identification of key biomarkers, including the genes vdac2, p53, and slc7a11, and metabolites such as adrenic acid and arachidic acid.
Collectively, these findings provide both theoretical and practical foundations for genetic resource conservation. The defined post-mortem viability windows enable a strategic approach to preserve germplasm resources by establishing germline stem cell lines from unexpectedly deceased individuals in wild or captive environments. This methodology transforms previously lost genetic material into valuable biological resources, offering novel solutions for conserving endangered species and enhancing breeding programs in aquaculture. Future investigations into cryopreservation techniques and ferroptosis inhibition could further extend OSC viability, thereby substantially broadening conservation possibilities.
Author Contributions
Conceptualization, Y.R. and Y.Y.; methodology, N.H.; software, G.W.; validation, Z.H. (Zhongwei He), Y.L. and W.C.; formal analysis, X.Z.; investigation, Y.Z.; resources, L.S.; data curation, Y.Y.; writing—original draft preparation, Y.R. and Y.Y.; writing—review and editing, Z.H. (Zengsheng Han) and J.H; visualization, Z.H. (Zengsheng Han) and J.H; supervision, Z.H. (Zengsheng Han) and J.H; project administration, Z.H. (Zengsheng Han) and J.H; funding acquisition, Z.H. (Zengsheng Han) and J.H. All authors have read and agreed to the published version of the manuscript.
Funding
This work was supported by Central Public-interest Scientific Institution Basal Research Fund, CAFS (No. 2022XT0304, 2023TD41), National Natural Science Foundation of China (No. 32302994), National Key R&D Program of China (2022YFD2400404), the Key R&D Program of Hebei Province, China (19226318D), The National Marine Genetic Resource Center, and the China Agriculture Research System (No. CARS-47).
Institutional Review Board Statement
This study followed the guidelines of the Chinese Association for Laboratory Animal Sciences Guide for the Care and Use of Laboratory Animals (No. 2011-2). All experimental protocols were approved by the Animal Care and Use Committee of the Beidaihe Central Experiment Station of the Chinese Academy of Fishery Sciences, on 6 March 2023.
Informed Consent Statement
Not applicable.
Data Availability Statement
The data are contained within the article. RNA-seq data are submitted in China National Center for Bioinformation (BioProject: CRA029868).
Conflicts of Interest
The authors declare no conflicts of interest.
Appendix A

Table A1.
Establishment and passaging of oogonial stem cells in the ND group at different time intervals after death in P. olivaceus.
Table A1.
Establishment and passaging of oogonial stem cells in the ND group at different time intervals after death in P. olivaceus.
| ND Group | 0 h | 3 h | 6 h | 9 h | 12 h | 15 h | 18 h | |
|---|---|---|---|---|---|---|---|---|
| Generation | ||||||||
| G1 | 25 d | 43 d | 30 d | 55 d | 55 d | 90 d | / | |
| G2 | 7 d | 7 d | 15 d | 11 d | 9 d | 15 d | / | |
| G3 | 7 d | 7 d | 4 d | 7 d | 7 d | 7 d | / | |
Table A2.
Establishment and passaging of oogonial stem cells in the FD group at different time intervals after death in P. olivaceus.
Table A2.
Establishment and passaging of oogonial stem cells in the FD group at different time intervals after death in P. olivaceus.
| FD Group | 3 h | 6 h | 9 h | 12 h | 15 h | 18 h | 21 h | 24 h | 27 h | |
|---|---|---|---|---|---|---|---|---|---|---|
| Generation | ||||||||||
| G1 | 45 d | 32 d | 18 d | 17 d | 36 d | 30 d | 21 d | 36 d | / | |
| G2 | 15 d | 3 d | 4 d | 25 d | 5 d | 7 d | 15 d | 5 d | / | |
| G3 | 7 d | 5 d | 8 d | 3 d | 3 d | 7 d | 5 d | 5 d | / | |
Table A3.
Comparison of transcriptome data and reference genome of P. olivaceus at different times chilled and room temperature deaths.
Table A3.
Comparison of transcriptome data and reference genome of P. olivaceus at different times chilled and room temperature deaths.
| Sample | Total | Unmapped (%) | Unique Mapped (%) | Multiple Mapped (%) | Total Mapped (%) |
|---|---|---|---|---|---|
| ND15h-1 | 40,801,018 | 16,440,151 (40.29%) | 37,617,362 (92.2%) | 1,054,338 (2.58%) | 38,671,700 (94.78%) |
| ND15h-2 | 40,310,714 | 16,339,041 (40.53%) | 37,239,993 (92.38%) | 1,103,402 (2.74%) | 38,343,395 (95.12%) |
| ND15h-3 | 46,885,594 | 18,325,940 (39.09%) | 43,250,261 (92.25%) | 1,373,811 (2.93%) | 44,624,072 (95.18%) |
| ND18h-1 | 38,825,814 | 15,930,534 (41.03%) | 35,820,303 (92.26%) | 1,124,155 (2.9%) | 36,944,458 (95.15%) |
| ND18h-2 | 42,378,838 | 18,639,800 (43.98%) | 37,455,412 (88.38%) | 978,946 (2.31%) | 38,434,358 (90.69%) |
| ND18h-3 | 37,283,930 | 15,355,381 (41.18%) | 32,976,563 (88.45%) | 931,946 (2.5%) | 33,908,509 (90.95%) |
| FD24h-1 | 40,445,378 | 16,445,352 (40.66%) | 37,346,216 (92.34%) | 1,119,270 (2.77%) | 38,465,486 (95.1%) |
| FD24h-2 | 48,930,460 | 19,085,661 (39.01%) | 42,725,682 (87.32%) | 1,374,441 (2.81%) | 44,100,123 (90.13%) |
| FD24h-3 | 52,648,168 | 20,366,600 (38.68%) | 46,566,537 (88.45%) | 1,486,062 (2.82%) | 48,052,599 (91.27%) |
| FD27h-1 | 41,534,978 | 17,939,371 (43.19%) | 37,768,396 (90.93%) | 1,139,589 (2.74%) | 38,907,985 (93.68%) |
| FD27h-2 | 43,442,624 | 17,732,956 (40.82%) | 39,693,588 (91.37%) | 1,199,797 (2.76%) | 40,893,385 (94.13%) |
| FD27h-3 | 43,529,080 | 18,317,491 (42.08%) | 39,967,505 (91.82%) | 1,151,657 (2.65%) | 41,119,162 (94.46%) |
Table A4.
Basic information statistics of P. olivaceus at different times of room temperature and chilled deaths.
Table A4.
Basic information statistics of P. olivaceus at different times of room temperature and chilled deaths.
| Sample | Raw Bases (bp) | Clean Bases (bp) | Q20 (%) | Q30 (%) | GC (%) |
|---|---|---|---|---|---|
| ND15h-1 | 6,400,731,900 | 40,801,018 | 39,732,031 (97.38%) | 38,042,869 (93.24%) | 20,849,320 (51.10%) |
| ND15h-2 | 6,585,703,200 | 40,310,714 | 39,302,946 (97.50%) | 37,686,487 (93.49%) | 20,526,216 (50.92%) |
| ND15h-3 | 7,423,662,900 | 46,885,594 | 45,727,520 (97.53%) | 43,819,276 (93.46%) | 24,061,687 (51.32%) |
| ND18h-1 | 6,238,026,600 | 38,825,814 | 37,820,225 (97.41%) | 36,232,250 (93.32%) | 19,719,631 (50.79%) |
| ND18h-2 | 6,912,105,300 | 42,378,838 | 41,336,319 (97.54%) | 39,564,883 (93.36%) | 20,841,913 (49.18%) |
| ND18h-3 | 6,019,846,500 | 37,283,930 | 36,404,029 (97.64%) | 34,890,302 (93.58%) | 18,656,879 (50.04%) |
| FD24h-1 | 6,327,326,700 | 40,445,378 | 39,414,021 (97.45%) | 37,784,072 (93.42%) | 20,675,677 (51.12%) |
| FD24h-2 | 7,364,892,300 | 48,930,460 | 47,795,273 (97.68%) | 45,872,306 (93.75%) | 24,797,957 (50.68%) |
| FD24h-3 | 7,921,212,600 | 52,648,168 | 51,463,584 (97.75%) | 49,399,776 (93.83%) | 26,724,210 (50.76%) |
| FD27h-1 | 6,653,903,100 | 41,534,978 | 40,313,850 (97.06%) | 38,511,232 (92.72%) | 20,796,563 (50.07%) |
| FD27h-2 | 6,899,318,700 | 43,442,624 | 42,208,853 (97.16%) | 40,362,542 (92.91%) | 21,968,935 (50.57%) |
| FD27h-3 | 6,795,099,300 | 43,529,080 | 42,392,971 (97.39%) | 40,595,220 (93.26%) | 21,847,245 (50.19%) |
Table A5.
The top 20 KEGG pathways enriched in ND15h vs. ND18h.
Table A5.
The top 20 KEGG pathways enriched in ND15h vs. ND18h.
| ID | Class | Description | p-Value | Q-Value | Ratio | Num | Up | Down |
|---|---|---|---|---|---|---|---|---|
| pov00330 | Metabolism; Amino acid metabolism | Arginine and proline metabolism | 0.002313977 | 0.141152599 | 0.09 | 3 | 2 | 1 |
| pov00010 | Glycolysis/Gluconeogenesis | Glycolysis/Gluconeogenesis | 0.006390935 | 0.194923503 | 0.09 | 3 | 2 | 1 |
| pov04218 | Cellular senescence | Cellular senescence | 0.019128015 | 0.304633194 | 0.13 | 4 | 2 | 2 |
| pov00260 | Glycine, serine and threonine metabolism | Glycine, serine and threonine metabolism | 0.022065588 | 0.304633194 | 0.06 | 2 | 1 | 1 |
| pov00620 | Metabolism; Carbohydrate metabolism | Pyruvate metabolism | 0.024969934 | 0.304633194 | 0.06 | 2 | 2 | 0 |
| pov04217 | Necroptosis | Necroptosis | 0.04034051 | 0.35638506 | 0.09 | 3 | 1 | 2 |
| pov00310 | Metabolism; Amino acid metabolism | Lysine degradation | 0.05046653 | 0.35638506 | 0.06 | 2 | 1 | 1 |
| pov04020 | Calcium signaling pathway | Calcium signaling pathway | 0.054192134 | 0.35638506 | 0.13 | 4 | 1 | 3 |
| pov00561 | Metabolism; Lipid metabolism | Glycerolipid metabolism | 0.055808883 | 0.35638506 | 0.06 | 2 | 2 | 0 |
| pov04115 | p53 signaling pathway | p53 signaling pathway | 0.067057946 | 0.35638506 | 0.06 | 2 | 2 | 0 |
| pov04146 | Peroxisome | Peroxisome | 0.074443165 | 0.35638506 | 0.06 | 2 | 0 | 2 |
| pov04110 | Cell cycle | Cell cycle | 0.074697428 | 0.35638506 | 0.09 | 3 | 3 | 0 |
| pov01230 | Biosynthesis of amino acids | Biosynthesis of amino acids | 0.075950914 | 0.35638506 | 0.06 | 2 | 1 | 1 |
| pov00430 | Biosynthesis of amino acids | Taurine and hypotaurine metabolism | 0.085790241 | 0.359435202 | 0.03 | 1 | 0 | 1 |
| pov01232 | Nucleotide metabolism | Nucleotide metabolism | 0.089950194 | 0.359435202 | 0.06 | 2 | 2 | 0 |
| pov00053 | Metabolism; Carbohydrate metabolism | Ascorbate and aldarate metabolism | 0.095401578 | 0.359435202 | 0.03 | 1 | 1 | 0 |
| pov00340 | Metabolism; Amino acid metabolism | Histidine metabolism | 0.100170466 | 0.359435202 | 0.03 | 1 | 1 | 0 |
| pov00601 | Metabolism; Amino acid metabolism | Glycosphingolipid biosynthesis—lacto and neolacto series | 0.109635285 | 0.371541799 | 0.03 | 1 | 0 | 1 |
| pov00982 | Metabolism; Xenobiotics biodegradation and metabolism | Drug metabolism—cytochrome P450 | 0.128276447 | 0.404567961 | 0.03 | 1 | 0 | 1 |
| pov00515 | Mannose type O-glycan biosynthesis | Mannose type O-glycan biosynthesis | 0.13287733 | 0.404567961 | 0.03 | 1 | 0 | 1 |
Table A6.
The top 20 KEGG pathways enriched in FD24h vs. FD27h.
Table A6.
The top 20 KEGG pathways enriched in FD24h vs. FD27h.
| ID | Class | Description | p-Value | Q-Value | Ratio | Num | Up | Down |
|---|---|---|---|---|---|---|---|---|
| pov03010 | Genetic Information Processing; Translation | Ribosome | 7.00 × 10−57 | 1.06 × 10−54 | 0.092576419 | 106 | 106 | 0 |
| pov00190 | Metabolism; Energy metabolism | Oxidative phosphorylation | 2.73 × 10⁻¹⁸ | 2.07 × 10⁻¹⁶ | 0.059388646 | 68 | 68 | 0 |
| pov04260 | Cardiac muscle contraction | Cardiac muscle contraction | 4.21 × 10⁻⁷ | 2.13 × 10⁻⁵ | 0.036681223 | 42 | 25 | 17 |
| pov03020 | Genetic Information Processing; Transcription | RNA polymerase | 0.000310433 | 0.01179644 | 0.013100437 | 15 | 13 | 2 |
| pov03018 | Genetic Information Processing; Folding, sorting and degradation | RNA degradation | 0.000539594 | 0.016403653 | 0.025327511 | 29 | 19 | 10 |
| pov03050 | Genetic Information Processing; Folding, sorting and degradation | Proteasome | 0.000994358 | 0.025190408 | 0.016593886 | 19 | 19 | 0 |
| pov03420 | Genetic Information Processing; Replication and repair | Nucleotide excision repair | 0.005929872 | 0.128762935 | 0.017467249 | 20 | 14 | 6 |
| pov03013 | Genetic Information Processing; Translation | Nucleocytoplasmic transport | 0.014518762 | 0.246774467 | 0.026200873 | 30 | 8 | 22 |
| pov03060 | Genetic Information Processing; Folding, sorting and degradation | Protein export | 0.014611646 | 0.246774467 | 0.007860262 | 9 | 8 | 1 |
| pov03040 | Genetic Information Processing; Transcription | Spliceosome | 0.02216678 | 0.334145793 | 0.031441048 | 36 | 28 | 8 |
| pov03030 | Genetic Information Processing; Replication and repair | DNA replication | 0.024181603 | 0.334145793 | 0.011353712 | 13 | 8 | 5 |
| pov04814 | Cellular Processes; Cell motility | Motor proteins | 0.043827537 | 0.555148808 | 0.043668122 | 50 | 15 | 35 |
| pov03460 | Genetic Information Processing; Replication and repair | Fanconi anemia pathway | 0.104087353 | 1 | 0.012227074 | 14 | 6 | 8 |
| pov03022 | Genetic Information Processing; Transcription | Basal transcription factors | 0.142019371 | 1 | 0.009606987 | 11 | 8 | 3 |
| pov00310 | Metabolism; Amino acid metabolism | Lysine degradation | 0.150289521 | 1 | 0.014847162 | 17 | 4 | 13 |
| pov00100 | Metabolism; Lipid metabolism | Steroid biosynthesis | 0.16535451 | 1 | 0.005240175 | 6 | 4 | 2 |
| pov00860 | Metabolism; Metabolism of cofactors and vitamins | Porphyrin metabolism | 0.172198533 | 1 | 0.0069869 | 8 | 7 | 1 |
| pov04110 | Cellular Processes; Cell growth and death | Cell cycle | 0.176882551 | 1 | 0.03580786 | 41 | 14 | 27 |
| pov04150 | Environmental Information Processing; Signal transduction | mTOR signaling pathway | 0.184488124 | 1 | 0.033187773 | 38 | 13 | 25 |
| pov04623 | Organismal Systems; Immune system | Cytosolic DNA-sensing pathway | 0.195926873 | 1 | 0.011353712 | 13 | 10 | 3 |
Table A7.
The top 20 KEGG pathways enriched in FD24h and ND15h no change genes.
Table A7.
The top 20 KEGG pathways enriched in FD24h and ND15h no change genes.
| ID | Class | Description | p-Value | Q-Value | Ratio | Num |
|---|---|---|---|---|---|---|
| pov04080 | Environmental Information Processing; Signaling molecules and interaction | Neuroactive ligand-receptor interaction | 2.2803047891782 × 10−74 | 3.39765413587552 × 10−72 | 0.178278689 | 261 |
| pov04060 | Environmental Information Processing; Signaling molecules and interaction | Cytokine-cytokine receptor interaction | 1.54860757163338 × 10⁻²⁶ | 1.15371264086687 × 10⁻²⁴ | 0.073770492 | 108 |
| pov04020 | Environmental Information Processing; Signal transduction | Calcium signaling pathway | 3.69346909045443 × 10⁻²² | 1.83442298159237 × 10⁻²⁰ | 0.099043716 | 145 |
| pov04514 | Environmental Information Processing; Signaling molecules and interaction | Cell adhesion molecules | 2.20278383435677 × 10⁻¹² | 8.20536978297897 × 10⁻¹¹ | 0.056693989 | 83 |
| pov04744 | Organismal Systems; Sensory system | Phototransduction | 3.28572791644228 × 10⁻⁷ | 9.791469190998 × 10⁻⁶ | 0.017759563 | 26 |
| pov04672 | Organismal Systems; Immune system | Intestinal immune network for IgA production | 9.55222811284292 × 10⁻⁵ | 0.00220169939771074 | 0.012295082 | 18 |
| pov04270 | Organismal Systems; Circulatory system | Vascular smooth muscle contraction | 0.00010343554217433 | 0.00220169939771074 | 0.035519126 | 52 |
| pov04261 | Organismal Systems; Circulatory system | Adrenergic signaling in cardiomyocytes | 0.00013256443189031 | 0.00246901254395702 | 0.049863388 | 73 |
| pov00533 | Metabolism; Glycan biosynthesis and metabolism | Glycosaminoglycan biosynthesis—keratan sulfate | 0.000449363736190256 | 0.00743946629914979 | 0.008196721 | 12 |
| pov04350 | Environmental Information Processing; Signal transduction | TGF-beta signaling pathway | 0.000642067969688125 | 0.00956681274835306 | 0.030737705 | 45 |
| pov00230 | Metabolism; Nucleotide metabolism | Purine metabolism | 0.00104623266514309 | 0.0141716970096655 | 0.035519126 | 52 |
| pov04010 | Environmental Information Processing; Signal transduction | MAPK signaling pathway | 0.00146441859372183 | 0.0181831975387127 | 0.071721311 | 105 |
| pov00140 | Metabolism; Lipid metabolism | Steroid hormone biosynthesis | 0.00186736245711854 | 0.0214028466238971 | 0.010245902 | 15 |
| pov00604 | Metabolism; Glycan biosynthesis and metabolism | Glycosphingolipid biosynthesis—ganglio series | 0.00242041178360021 | 0.0257600968397451 | 0.006147541 | 9 |
| pov00590 | Metabolism; Lipid metabolism | Arachidonic acid metabolism | 0.00817442252971953 | 0.0778334418749539 | 0.012978142 | 19 |
| pov00532 | Metabolism; Glycan biosynthesis and metabolism | Glycosaminoglycan biosynthesis—chondroitin sulfate/dermatan sulfate | 0.00835795348992793 | 0.0778334418749539 | 0.007513661 | 11 |
| pov04916 | Organismal Systems; Endocrine system | Melanogenesis | 0.00930495422181556 | 0.0815551870029717 | 0.028688525 | 42 |
| pov04310 | Environmental Information Processing; Signal transduction | Wnt signaling pathway | 0.0151342015408406 | 0.12527755719918 | 0.040983607 | 60 |
| pov00910 | Metabolism; Energy metabolism | Nitrogen metabolism | 0.0260673964408138 | 0.203009420682821 | 0.006147541 | 9 |
| pov00380 | Metabolism; Amino acid metabolism | Tryptophan metabolism | 0.027249586668835 | 0.203009420682821 | 0.010928962 | 16 |
Table A8.
The top 20 KEGG pathways enriched in FD27h and ND18h no change genes.
Table A8.
The top 20 KEGG pathways enriched in FD27h and ND18h no change genes.
| ID | Class | Description | p-Value | Q-Value | Ratio | Num |
|---|---|---|---|---|---|---|
| pov04080 | Environmental Information Processing; Signaling molecules and interaction | Neuroactive ligand-receptor interaction | 6.15224639748607 × 10−59 | 9.16684713225424 × 10−57 | 0.171344165 | 232 |
| pov04020 | Environmental Information Processing; Signal transduction | Calcium signaling pathway | 5.83044313395946 × 10⁻²⁰ | 4.3436801347998 × 10⁻¹⁸ | 0.098966027 | 134 |
| pov04060 | Environmental Information Processing; Signaling molecules and interaction | Cytokine-cytokine receptor interaction | 2.18024245322315 × 10⁻¹⁶ | 1.0828537517675 × 10⁻¹⁴ | 0.064992614 | 88 |
| pov04514 | Environmental Information Processing; Signaling molecules and interaction | Cell adhesion molecules | 2.28511681686016 × 10⁻¹¹ | 8.51206014280408 × 10⁻¹⁰ | 0.056868538 | 77 |
| pov04744 | Organismal Systems; Sensory system | Phototransduction | 6.20894376944006 × 10⁻⁸ | 1.85026524329314 × 10⁻⁶ | 0.019202363 | 26 |
| pov04672 | Organismal Systems; Immune system | Intestinal immune network for IgA production | 6.58195396633777 × 10⁻⁶ | 0.000163451856830721 | 0.014032496 | 19 |
| pov04010 | Environmental Information Processing; Signal transduction | MAPK signaling pathway | 8.10034590883145 × 10⁻⁶ | 0.000172421648630841 | 0.080502216 | 109 |
| pov04270 | Organismal Systems; Circulatory system | Vascular smooth muscle contraction | 0.000236162899145753 | 0.00439853399658965 | 0.035450517 | 48 |
| pov00230 | Metabolism; Nucleotide metabolism | Purine metabolism | 0.00188063675192268 | 0.0311349862262755 | 0.035450517 | 48 |
| pov04261 | Organismal Systems; Circulatory system | Adrenergic signaling in cardiomyocytes | 0.0030049955859055 | 0.044774434229992 | 0.046528804 | 63 |
| pov00910 | Metabolism; Energy metabolism | Nitrogen metabolism | 0.00446926225877797 | 0.0605381887779925 | 0.007385524 | 10 |
| pov00604 | Metabolism; Glycan biosynthesis and metabolism | Glycosphingolipid biosynthesis—ganglio series | 0.0066887673854356 | 0.0795442582859311 | 0.005908419 | 8 |
| pov04916 | Organismal Systems; Endocrine system | Melanogenesis | 0.00694010307192687 | 0.0795442582859311 | 0.029542097 | 40 |
| pov04350 | Environmental Information Processing; Signal transduction | TGF-beta signaling pathway | 0.0102746435496404 | 0.109351563492602 | 0.028064993 | 38 |
| pov04810 | Cellular Processes; Cell motility | Regulation of actin cytoskeleton | 0.0125372806301676 | 0.124536987592998 | 0.052437223 | 71 |
| pov00532 | Metabolism; Glycan biosynthesis and metabolism | Glycosaminoglycan biosynthesis—chondroitin sulfate/dermatan sulfate | 0.0147359052616125 | 0.137228117748767 | 0.007385524 | 10 |
| pov00533 | Metabolism; Glycan biosynthesis and metabolism | Glycosaminoglycan biosynthesis—keratan sulfate | 0.0158685919402005 | 0.139083541122934 | 0.006646972 | 9 |
| pov00561 | Metabolism; Lipid metabolism | Glycerolipid metabolism | 0.0256715684407054 | 0.212503538759172 | 0.017725258 | 24 |
| pov04814 | Cellular Processes; Cell motility | Motor proteins | 0.0301713061938436 | 0.236606559099089 | 0.043574594 | 59 |
| pov04912 | Organismal Systems; Endocrine system | GnRH signaling pathway | 0.0320475961612918 | 0.238754591401624 | 0.025110783 | 34 |
Table A9.
Basic information of all P. olivaceus used in the experiment.
Table A9.
Basic information of all P. olivaceus used in the experiment.
| Group (n = 3) | Body Length (cm) | Overall Length (cm) | Body Weight (g) | Gonad Weight (g) |
|---|---|---|---|---|
| 0h | 16.67 ± 0.29 | 26.00 ± 0.00 | 226.96 ± 36.13 | 1.23 ± 0.46 |
| ND3h | 13.00 ± 1.00 | 21.90 ± 1.49 | 140.07 ± 38.12 | 0.25 ± 0.03 |
| ND6h | 14.60 ± 0.85 | 19.67 ± 0.58 | 121.17 ± 9.02 | 0.21 ± 0.04 |
| ND9h | 11.83 ± 1.04 | 19.33 ± 0.76 | 135.04 ± 27.57 | 0.22 ± 0.03 |
| ND12h | 15.23 ± 0.64 | 23.67 ± 1.15 | 158.22 ± 32.66 | 0.25 ± 0.06 |
| ND15h | 15.83 ± 0.58 | 20.83 ± 1.44 | 112.22 ± 10.53 | 0.27 ± 0.07 |
| ND18h | 16.00 ± 1.73 | 25.50 ± 2.29 | 223.36 ± 34.30 | 0.80 ± 0.12 |
| FD3h | 13.83 ± 1.26 | 22.50 ± 1.32 | 163.70 ± 34.14 | 0.24 ± 0.04 |
| FD6h | 12.67 ± 0.58 | 21.00 ± 1.73 | 118.42 ± 11.46 | 0.23 ± 0.02 |
| FD9h | 14.00 ± 1.00 | 21.67 ± 1.26 | 143.88 ± 49.04 | 0.25 ± 0.04 |
| FD12h | 10.83 ± 1.04 | 18.50 ± 1.00 | 130.89 ± 26.28 | 0.24 ± 0.02 |
| FD15h | 13.27 ± 0.40 | 20.93 ± 0.12 | 143.05 ± 5.14 | 0.25 ± 0.04 |
| FD18h | 12.67 ± 0.29 | 20.50 ± 1.32 | 151.41 ± 42.16 | 0.39 ± 0.15 |
| FD21h | 13.00 ± 1.00 | 23.33 ± 0.58 | 167.30 ± 38.56 | 0.55 ± 0.17 |
| FD24h | 14.83 ± 1.76 | 24.83 ± 2.02 | 211.88 ± 7.61 | 0.68 ± 0.17 |
| FD27h | 13.33 ± 1.04 | 22.83 ± 0.76 | 201.65 ± 8.40 | 0.69 ± 0.35 |
Table A10.
Primer sequence table.
Table A10.
Primer sequence table.
| NCBI Reference Sequence | Forward | Reverse | Gene Name | Usage |
|---|---|---|---|---|
| XM_069535616.1 | GCCTGACTCCAGCACA | CCATCGCCTACCCAA | trmt61b | qRT-PCR |
| XM_069530630.1 | GGCTGAGGATGAGGTG | GGCTGGTGGCTTGTAG | loc109627311 | |
| XM_020103989.1 | TCACGGGCCATACCAG | TGACCGAGGCAGAGCA | loc109640143 | |
| XM_020081586.1 | CTAACCCACGGCTTTGT | GCTGCGGATTTGAACC | loc109625962 | |
| XM_020086501.1 | TTGGCAAACTCGGGAC | GCAGCGTTGAGGAAAG | loc109629024 | |
| XM_020085544.2 | CACGACTCCCAGACCCA | GCAAGATGCCGACCA | tmprss2 | |
| XM_020104037.2 | CGGCGGGCTTCATTT | AGAACGGCGTGGAGGT | loc109640177 | |
| XM_069511009.1 | TGCCTACGCTGGAGT | CGAGAAGAAATAGTGCC | dhrs1 | |
| XM_020085444.1 | GGTTGATGGCATTTAGGT | CTGCTGTTTACAAGGCTCT | loc109628360 | |
| XM_020085379.1 | AAGCACCACATTCTTCCATA | AGCCACGCTTCCTTTG | tmlhe | |
| XM_020108792.2 | TGGGCTTGGGACATT | GGAAGGCGTGATTGC | rbx1 | |
| XM_020106609.2 | AGGACAAAGAGGGAATC | CAGCACCAAGTGAAGG | rps27a | |
| XM_020096236.2 | GGCGGTTCAAGGGTCA | TGGGCGATCTCAGCAC | rpl32 | |
| XM_020098086.2 | GGAACATAGTGGAGGCT | ATCTGGGTGGTGGAGTA | mrps26 | |
| XM_020094857.2 | CAGCAACACCTCCTCAG | ACAAGCGTCCATCACC | rnf7 | |
| XM_020112725.2 | CGAGCGGAGAAATGA | CCAGCCGATGATGAC | eif3f | |
| XM_020086721.1 | CAAGGCTGTGGTGAGGT | TCGTCTGGCGAGTTCTAT | nudt2 | |
| XM_020089424.1 | GAGTGCGACAAGAAGGAT | GGAGGAGCAGATTAGGG | loc109630913 | |
| XM_020108373.1 | TCCGCACCTCTTCCAC | TTTTCAGCCAGTCGTTC | ntpcr | |
| XM_020106718.1 | CAGGTCCCTCAGGTTGT | AGGCTGCTCTGCTTCA | hddc3 | |
| XM_069524822.1 | GGAAATCGTGCGTGACATTAAG | CCTCTGGACAACGGAACCTCT | β-actin | |
| JQ070418.1 | CTAACCACGAGGGAACTA | GCTGGATGAGGCTGAC | vasa | RT-PCR |
| KJ522774.2 | AGACTTTCTTCCCATTCCC | TGACGGTGTCAGATACTGTTG | oct4 | |
| XR_011242831.1 | CCTGAGAAACGGCTACCACAT | ATCCCGAGGTCCAACTACGAG | 18s rRNA |

Figure A1.
The histology of ovarian tissues at ND0h, ND15h, ND18h, FD0h, FD24h, and FD27h. OSC: oogonial stem cell; PGO: primary growth oocytes; PNO: perinucleolar oocyte; BC, blood cells; Scale: 50 μm.
References
- Liu, Y.; Blackburn, H.; Taylor, S.S.; Tiersch, T.R. Development of germplasm repositories to assist conservation of endangered fishes: Examples from small-bodied livebearing fishes. Theriogenology 2019, 135, 138–151. [Google Scholar] [CrossRef] [PubMed]
- Goswami, M.; Mishra, A.; AS, N.; VL, T.; WS, L. Bio-banking: An Emerging Approach for Conservation of Fish Germplasm. Poult. Fish. Wildl. Sci. 2016, 4, 1000143. [Google Scholar] [CrossRef]
- Wang, T.; Li, Z.; Zheng, D.; Liu, W.; Huang, P.; Zeng, Z.; Xu, C.; Wang, B.; Wei, J. Establishment and characterization of a fibroblast cell line from postmortem skin of an adult Chinese muntjac (Muntiacus reevesi). Vitr. Cell. Dev. Biology Anim. 2020, 56, 97–102. [Google Scholar] [CrossRef]
- Shigunov, P.; Dallagiovanna, B. Stem Cell Ribonomics: RNA-Binding Proteins and Gene Networks in Stem Cell Differentiation. Front. Mol. Biosci. 2015, 2, 74. [Google Scholar] [CrossRef]
- Yoshizaki, G.; Ichikawa, M.; Hayashi, M.; Iwasaki, Y.; Miwa, M.; Shikina, S.; Okutsu, T. Sexual plasticity of ovarian germ cells in rainbow trout. Development 2010, 137, 1227–1230. [Google Scholar] [CrossRef]
- Lee, S.; Iwasaki, Y.; Yoshizaki, G. Long-term (5 years) cryopreserved spermatogonia have high capacity to generate functional gametes via interspecies transplantation in salmonids. Cryobiology 2016, 73, 286–290. [Google Scholar] [CrossRef]
- Ye, H.; Li, C.J.; Yue, H.M.; Du, H.; Yang, X.G.; Yoshino, T.; Hayashida, T.; Takeuchi, Y.; Wei, Q.W. Establishment of intraperitoneal germ cell transplantation for critically endangered Chinese sturgeon Acipenser sinensis. Theriogenology 2017, 94, 37–47. [Google Scholar] [CrossRef]
- Yoshikawa, H.; Ino, Y.; Shigenaga, K.; Katayama, T.; Kuroyanagi, M.; Yoshiura, Y. Production of tiger puffer Takifugu rubripes from cryopreserved testicular germ cells using surrogate broodstock technology. Aquaculture 2018, 493, 302–313. [Google Scholar] [CrossRef]
- Ren, Y.; Sun, Z.; Wang, Y.; Yu, Q.; Wang, G.; He, Z.; Liu, Y.; Jiang, X.; Kang, X.; Hou, J. Production of donor-derived offsprings by allogeneic transplantation of oogonia in the adult Japanese flounder (Paralichthys olivaceus). Aquaculture 2021, 543, 736977. [Google Scholar] [CrossRef]
- Yoshizaki, G.; Takashiba, K.; Shimamori, S.; Fujinuma, K.; Shikina, S.; Okutsu, T.; Kume, S.; Hayashi, M. Production of germ cell-deficient salmonids by dead end gene knockdown, and their use as recipients for germ cell transplantation. Mol. Reprod. Dev. 2016, 83, 298–311. [Google Scholar] [CrossRef] [PubMed]
- Pšenička, M.; Saito, T.; Rodina, M.; Dzyuba, B. Cryopreservation of early stage Siberian sturgeon Acipenser baerii germ cells, comparison of whole tissue and dissociated cells. Cryobiology 2016, 72, 119–122. [Google Scholar] [CrossRef]
- Zhou, L.; Wang, X.; Liu, Q.; Yang, J.; Xu, S.; Wu, Z.; Wang, Y.; You, F.; Song, Z.; Li, J. Successful Spermatogonial Stem Cells Transplantation within Pleuronectiformes: First Breakthrough at inter-family Level in Marine Fish. Int. J. Biol. Sci. 2021, 17, 4426–4441. [Google Scholar] [CrossRef]
- Marinovic, Z.; Li, Q.; Lujic, J.; Iwasaki, Y.; Csenki, Z.; Urbanyi, B.; Yoshizaki, G.; Horvath, A. Preservation of zebrafish genetic resources through testis cryopreservation and spermatogonia transplantation. Sci. Rep. 2019, 9, 13861. [Google Scholar] [CrossRef] [PubMed]
- de Queiroz Neta, L.B.; Lira, G.P.D.O.; Borges, A.A.; Santos, M.V.D.O.; Silva, M.B.; de Oliveira, L.R.M.; Silva, A.R.; de Oliveira, M.F.; Pereira, A.F. Influence of storage time and nutrient medium on recovery of fibroblast-like cells from refrigerated collared peccary (Pecari tajacu Linnaeus, 1758) skin. Vitr. Cell. Dev. Biol. Anim. 2018, 54, 486–495. [Google Scholar] [CrossRef] [PubMed]
- Hasegawa, A.; Yamada, C.; Tani, M.; Hirano, S.; Tokumoto, Y.; Miyake, J. Caspase inhibitors increase the rate of recovery of neural stem/progenitor cells from post-mortem rat brains stored at room temperature. J. Biosci. Bioeng. 2009, 107, 652–657. [Google Scholar] [CrossRef]
- Saito, T.; Sato, T.; Suzuki, K. Isolation and culture of human adipose-derived mesenchymal stromal/stem cells harvested from postmortem adipose tissues. J. Forensic Leg. Med. 2020, 69, 101875. [Google Scholar] [CrossRef]
- Porretti, L.; Gatti, S.; Gramignoli, R.; Colombo, F.; Lopa, R.; Cattaneo, A.; Scalamogna, M.; Colombo, G.; Rossi, G.; Bonino, F.; et al. Animal model for liver cell banking from non-heart beating donors after prolonged ischaemia time. Dig. Liver Dis. 2006, 38, 905–911. [Google Scholar] [CrossRef]
- Erker, L.; Azuma, H.; Lee, A.Y.; Guo, C.; Orloff, S.; Eaton, L.; Benedetti, E.; Jensen, B.; Finegold, M.; Willenbring, H.; et al. Therapeutic Liver Reconstitution With Murine Cells Isolated Long After Death. Gastroenterology 2010, 139, 1019–1029. [Google Scholar] [CrossRef]
- Shikh Alsook, M.K.; Gabriel, A.; Piret, J.; Waroux, O.; Tonus, C.; Connan, D.; Baise, E.; Antoine, N. Tissues from equine cadaver ligaments up to 72 hours of post-mortem: A promising reservoir of stem cells. Stem Cell Res. Ther. 2015, 6, 253. [Google Scholar] [CrossRef]
- Tolbert, M.; Finley, S.J.; Visonà, S.D.; Soni, S.; Osculati, A.; Javan, G.T. The thanatotranscriptome: Gene expression of male reproductive organs after death. Gene 2018, 675, 191–196. [Google Scholar] [CrossRef] [PubMed]
- Ferreira, P.G.; Munoz-Aguirre, M.; Reverter, F.; Sa, G.C.; Sousa, A.; Amadoz, A.; Sodaei, R.; Hidalgo, M.R.; Pervouchine, D.; Carbonell-Caballero, J.; et al. The effects of death and post-mortem cold ischemia on human tissue transcriptomes. Nat. Commun. 2018, 9, 490. [Google Scholar] [CrossRef]
- Javan, G.T.; Kwon, I.; Finley, S.J.; Lee, Y. Progression of thanatophagy in cadaver brain and heart tissues. Biochem. Biophys. Rep. 2016, 5, 152–159. [Google Scholar] [CrossRef][Green Version]
- Zapico, S.C.; Menéndez, S.T.; Núñez, P. Cell death proteins as markers of early postmortem interval. Cell. Mol. Life Sci. 2014, 71, 2957–2962. [Google Scholar] [CrossRef]
- Javan, G.T.; Can, I.; Finley, S.J.; Soni, S. The apoptotic thanatotranscriptome associated with the liver of cadavers. Forensic Sci. Med. Pathol. 2015, 11, 509–516. [Google Scholar] [CrossRef] [PubMed]
- Wu, X.; Wang, Z.; Jiang, J.; Gao, J.; Wang, J.; Zhou, X.; Zhang, Q. Cloning, expression promoter analysis of vasa gene in Japanese flounder (Paralichthys olivaceus). Comp. Biochem. Physiol. B. Biochem. Mol. Biol. 2014, 167, 41–50. [Google Scholar] [CrossRef] [PubMed]
- Gao, J.; Wang, X.; Zhang, Q. Evolutionary Conservation of pou5f3 Genomic Organization and Its Dynamic Distribution during Embryogenesis and in Adult Gonads in Japanese Flounder Paralichthys olivaceus. Int. J. Mol. Sci. 2017, 18, 231. [Google Scholar] [CrossRef]
- Fujihara, M.; Shiraishi, J.I.; Onuma, M.; Ohta, Y.; Inoue-Murayama, M. Cryopreservation Competence of Chicken Oocytes as a Model of Endangered Wild Birds: Effects of Storage Time and Temperature on the Ovarian Follicle Survival. Animals 2022, 12, 1434. [Google Scholar] [CrossRef]
- Zhang, G.L.; Ma, J.Y.; Sun, Q.; Hu, M.W.; Yang, X.Y.; Gao, S.H.; Jiang, G.J. Effects of postmortem interval on mouse ovary oocyte survival and maturation. PLoS ONE 2014, 9, e98384. [Google Scholar] [CrossRef]
- Chaves, R.N.; Martins, F.S.; Saraiva, M.V.; Celestino, J.J.; Lopes, C.A.; Correia, J.C.; Verde, I.B.; Matos, M.H.; Bao, S.N.; Name, K.P.; et al. Chilling ovarian fragments during transportation improves viability and growth of goat preantral follicles cultured in vitro. Reprod. Fertil. Dev. 2008, 20, 640–647. [Google Scholar] [CrossRef] [PubMed]
- Churchill, T.A.; Cheetham, K.M.; Fuller, B.J. Glycolysis and Energy Metabolism in Rat Liver during Warm and Cold Ischemia: Evidence of an Activation of the Regulatory Enzyme Phosphofructokinase. Cryobiology 1994, 31, 441–452. [Google Scholar] [CrossRef] [PubMed]
- Reinhard, K.; Mutter, M.; Gustafsson, E.; Gustafsson, L.; Vaegler, M.; Schultheiss, M.; Muller, S.; Yoeruek, E.; Schrader, M.; Munch, T.A. Hypothermia Promotes Survival of Ischemic Retinal Ganglion Cells. Investig. Ophthalmol. Vis. Sci. 2016, 57, 658–663. [Google Scholar] [CrossRef]
- de Araujo, J.M.; Oliveira, R.A.; Capobianco, N.E.; Cunha, A.; Dode, M.; Martins, C.F. Effects of Refrigeration at 5 degrees C for Long Periods of Time on Bovine Ear Skin as a Strategy to Transport Biological Material and Isolate Fibroblasts to Use in the Nuclear Transfer. Biopreserv. Biobank. 2022, 20, 323–330. [Google Scholar] [CrossRef]
- Silvestre, M.A.; Sánchez, J.P.; Gómez, E.A. Vitrification of goat, sheep, and cattle skin samples from whole ear extirpated after death and maintained at different storage times and temperatures. Cryobiology 2004, 49, 221–229. [Google Scholar] [CrossRef]
- Walcott, B.; Singh, M. Recovery of proliferative cells up to 15- and 49-day postmortem from bovine skin stored at 25 °C and 4 °C, respectively. Cogent Biol. 2017, 3, 1333760. [Google Scholar] [CrossRef]
- Liu, W.; Han, L.; Yuan, F.; Liu, Q.; Cheng, H.; Jin, X.; Sun, Y. Mechanism of blocking the glutamate pathway to exacerbate oxidative stress, ammonia toxicity and metabolic disorders in crucian carp (Carassius auratus) under saline-alkaline exposure. Comp. Biochem. Physiol. Part C Toxicol. Pharmacol. 2025, 291, 110146. [Google Scholar] [CrossRef]
- Wang, W.; Mou, S.; Xiu, W.; Li, Y.; Liu, Z.; Feng, Y.; Ma, J.; Li, X. Fenpropathrin disrupted the gills of common carp (Cyprinus carpio L.) through oxidative stress, inflammatory responses, apoptosis, and transcriptional alterations. Ecotoxicol. Environ. Saf. 2024, 271, 116007. [Google Scholar] [CrossRef] [PubMed]
- Becerril, M.R.; Savin, T.Z. Bisphenol A Induces Reactive Oxygen Species Production and Apoptosis-Related Gene Expression in Pacific Red Snapper Lutjanus peru Leukocytes. Mar. Biotechnol. 2024, 26, 136–148. [Google Scholar] [CrossRef] [PubMed]
- Dirk, R.; Stuart, C.G. Rethinking the Citric Acid Cycle: Connecting Pyruvate Carboxylase and Citrate Synthase to the Flow of Energy and Material. Int. J. Mol. Sci. 2021, 22, 604. [Google Scholar] [CrossRef] [PubMed]
- Liang, Y.; Wu, R.; Niu, S.; Miao, B.; Liang, Z.; Zhai, Y. Liver transcriptome analysis reveals changes in energy metabolism, oxidative stress, and apoptosis in pearl gentian grouper exposed to acute hypoxia. Aquaculture 2022, 561, 738635. [Google Scholar] [CrossRef]
- Li, P.; Mai, K.; Trushenski, J.; Wu, G. New developments in fish amino acid nutrition: Towards functional and environmentally oriented aquafeeds. Amino Acids 2009, 37, 43–53. [Google Scholar] [CrossRef]
- Paulusma, C.C.; Lamers, W.H.; Broer, S.; van de Graaf, S. Amino acid metabolism, transport and signalling in the liver revisited. Biochem. Pharmacol. 2022, 201, 115074. [Google Scholar] [CrossRef]
- Abdel-Rhman, A.; Morsy, W.; Selim, N.; Abdel-Hady, E.A. L-arginine supplementation attenuates ovarian oxidative stress in female rats subjected to chronic intermittent hypoxia. Physiol. Int. 2023, 110, 326–341. [Google Scholar] [CrossRef]
- Wang, M.; Zhao, S.; Wang, J.; Nie, L.; Li, L.; Zhu, X.; Zhang, L. Multi-omics analysis provides insight into liver metabolism in yellow catfish (Pelteobagrus fulvidraco) under hypoxic stress. Aquaculture 2024, 583, 740531. [Google Scholar] [CrossRef]
- Wen, J.; Feng, Y.; Xue, L.; Yuan, S.; Chen, Q.; Luo, A.; Wang, S.; Zhang, J. High-fat diet-induced L-saccharopine accumulation inhibits estradiol synthesis and damages oocyte quality by disturbing mitochondrial homeostasis. Gut Microbes 2024, 16, 2412381. [Google Scholar] [CrossRef]
- Ma, J.L.; Qiang, J.; Tao, Y.F.; Bao, J.W.; Zhu, H.J.; Li, L.G.; Xu, P. Multi-omics analysis reveals the glycolipid metabolism response mechanism in the liver of genetically improved farmed Tilapia (GIFT, Oreochromis niloticus) under hypoxia stress. BMC Genom. 2021, 22, 105. [Google Scholar] [CrossRef]
- Qi, M.; Wu, Q.; Liu, T.; Hou, Y.; Miao, Y.; Hu, M.; Liu, Q. Hepatopancreas Transcriptome Profiling Analysis Reveals Physiological Responses to Acute Hypoxia and Reoxygenation in Juvenile Qingtian Paddy Field Carp Cyprinus carpio var qingtianensis. Front. Physiol. 2020, 11, 1110. [Google Scholar] [CrossRef] [PubMed]
- Stecyk, J.A.W.; Stensløkken, K.; Farrell, A.P.; Nilsson, G.E. Maintained Cardiac Pumping in Anoxic Crucian Carp. Science 2004, 306, 77. [Google Scholar] [CrossRef] [PubMed]
- Anja, R.; A, M.S.; Thomas, H.; Thorsten, B. Globins and hypoxia adaptation in the goldfish, Carassius auratus. FEBS J. 2008, 275, 3633–3643. [Google Scholar] [CrossRef]
- Li, Y.; Yao, C.; Xu, F.; Qu, Y.; Li, J.; Lin, Y.; Cao, Z.; Lin, P.; Xu, W.; Zhao, S.; et al. APC/CCDH1 synchronizes ribose-5-phosphate levels and DNA synthesis to cell cycle progression. Nat. Commun. 2019, 10, 1–16. [Google Scholar] [CrossRef]
- Huang, Z.; Xie, N.; Illes, P.; Di Virgilio, F.; Ulrich, H.; Semyanov, A.; Verkhratsky, A.; Sperlagh, B.; Yu, S.G.; Huang, C.; et al. From purines to purinergic signalling: Molecular functions and human diseases. Signal Transduct. Target. Ther. 2021, 6, 162. [Google Scholar] [CrossRef] [PubMed]
- Liu, Y.; Zheng, J.; Ge, L.; Tang, H.; Hu, J.; Li, X.; Wang, X.; Zhang, Y.; Shi, Q. Integrated metabolomic and transcriptomic analyses reveal the roles of alanine, aspartate and glutamate metabolism and glutathione metabolism in response to salt stress in tomato. Sci. Hortic. 2024, 328, 112911. [Google Scholar] [CrossRef]
- Chen, Q.L.; Luo, Z.; Huang, C.; Pan, Y.X.; Wu, K. De novo characterization of the liver transcriptome of javelin goby Synechogobius hasta and analysis of its transcriptomic profile following waterborne copper exposure. Fish. Physiol. Biochem. 2016, 42, 979–994. [Google Scholar] [CrossRef] [PubMed]
- Tsukahara, T.; Matsuda, Y.; Haniu, H. Lysophospholipid-Related Diseases and PPARγ Signaling Pathway. Int. J. Mol. Sci. 2017, 18, 2730. [Google Scholar] [CrossRef] [PubMed]
- Doll, S.; Proneth, B.; Tyurina, Y.Y.; Panzilius, E.; Kobayashi, S.; Ingold, I.; Irmler, M.; Beckers, J.; Aichler, M.; Walch, A.; et al. ACSL4 dictates ferroptosis sensitivity by shaping cellular lipid composition. Nat. Chem. Biol. 2017, 13, 91–98. [Google Scholar] [CrossRef] [PubMed]
- Yang, W.S.; Stockwell, B.R. Ferroptosis: Death by Lipid Peroxidation. Trends Cell Biol. 2016, 26, 165–176. [Google Scholar] [CrossRef] [PubMed]
- Dixon, S.J.; Winter, G.E.; Musavi, L.S.; Lee, E.D.; Snijder, B.; Rebsamen, M.; Superti-Furga, G.; Stockwell, B.R. Human Haploid Cell Genetics Reveals Roles for Lipid Metabolism Genes in Nonapoptotic Cell Death. ACS Chem. Biol. 2015, 10, 1604–1609. [Google Scholar] [CrossRef] [PubMed]
- Shah, R.; Shchepinov, M.S.; Pratt, D.A. Resolving the Role of Lipoxygenases in the Initiation and Execution of Ferroptosis. ACS Cent. Sci. 2018, 4, 387–396. [Google Scholar] [CrossRef]
- Dixon, S.J.; Lemberg, K.M.; Lamprecht, M.R.; Skouta, R.; Zaitsev, E.M.; Gleason, C.E.; Patel, D.N.; Bauer, A.J.; Cantley, A.M.; Yang, W.S.; et al. Ferroptosis: An iron-dependent form of nonapoptotic cell death. Cell 2012, 149, 1060–1072. [Google Scholar] [CrossRef] [PubMed]
- Xu, T.; Ding, W.; Ji, X.; Ao, X.; Liu, Y.; Yu, W.; Wang, J. Molecular mechanisms of ferroptosis and its role in cancer therapy. J. Cell. Mol. Med. 2019, 23, 4900–4912. [Google Scholar] [CrossRef]
- Chen, W.; Jiang, L.; Hu, Y.; Tang, N.; Liang, N.; Li, X.F.; Chen, Y.W.; Qin, H.; Wu, L. Ferritin reduction is essential for cerebral ischemia-induced hippocampal neuronal death through p53/SLC7A11-mediated ferroptosis. Brain Res. 2021, 1752, 147216. [Google Scholar] [CrossRef]
- Jiang, L.; Kon, N.; Li, T.; Wang, S.J.; Su, T.; Hibshoosh, H.; Baer, R.; Gu, W. Ferroptosis as a p53-mediated activity during tumour suppression. Nature 2015, 520, 57–62. [Google Scholar] [CrossRef]
- Bridges, R.J.; Natale, N.R.; Patel, S.A. System xc− cystine/glutamate antiporter: An update on molecular pharmacology and roles within the CNS. Br. J. Pharmacol. 2012, 165, 20–34. [Google Scholar] [CrossRef]
- Hu, K.; Li, K.; Lv, J.; Feng, J.; Chen, J.; Wu, H.; Cheng, F.; Jiang, W.; Wang, J.; Pei, H.; et al. Suppression of the SLC7A11/glutathione axis causes synthetic lethality in KRAS-mutant lung adenocarcinoma. J. Clin. Investig. 2020, 130, 1752–1766. [Google Scholar] [CrossRef] [PubMed]
- Lei, G.; Zhuang, L.; Gan, B. Targeting ferroptosis as a vulnerability in cancer. Nat. Rev. Cancer 2022, 22, 381–396. [Google Scholar] [CrossRef]
- Gao, M.; Yi, J.; Zhu, J.; Minikes, A.M.; Monian, P.; Thompson, C.B.; Jiang, X. Role of Mitochondria in Ferroptosis. Mol. Cell 2019, 73, 354–363. [Google Scholar] [CrossRef] [PubMed]
- Liu, Y.; Lu, S.; Wu, L.L.; Yang, L.; Yang, L.; Wang, J. The diversified role of mitochondria in ferroptosis in cancer. Cell Death Dis. 2023, 14, 519. [Google Scholar] [CrossRef] [PubMed]
- Yang, Y.; Ren, Y.; Zhang, Y.; Wang, G.; He, Z.; Liu, Y.; Cao, W.; Wang, Y.; Chen, S.; Fu, Y.; et al. A New Cell Line Derived from the Spleen of the Japanese Flounder (Paralichthys olivaceus) and Its Application in Viral Study. Biology 2022, 11, 1697. [Google Scholar] [CrossRef]
- Parkhomchuk, D.; Borodina, T.; Amstislavskiy, V.; Banaru, M.; Hallen, L.; Krobitsch, S.; Lehrach, H.; Soldatov, A. Transcriptome analysis by strand-specific sequencing of complementary DNA. Nucleic. Acids. Res. 2009, 37, e123. [Google Scholar] [CrossRef]
- Chen, S.; Zhou, Y.; Chen, Y.; Gu, J. fastp: An ultra-fast all-in-one FASTQ preprocessor. Bioinformatics 2018, 34, i884–i890. [Google Scholar] [CrossRef]
- Kim, D.; Langmead, B.; Salzberg, S.L. HISAT: A fast spliced aligner with low memory requirements. Nat. Methods 2015, 12, 357–360. [Google Scholar] [CrossRef]
- Pertea, M.; Pertea, G.M.; Antonescu, C.M.; Chang, T.C.; Mendell, J.T.; Salzberg, S.L. StringTie enables improved reconstruction of a transcriptome from RNA-seq reads. Nat. Biotechnol. 2015, 33, 290–295. [Google Scholar] [CrossRef]
- Love, M.I.; Huber, W.; Anders, S. Moderated estimation of fold change and dispersion for RNA-seq data with DESeq2. Genome Biol. 2014, 15, 550. [Google Scholar] [CrossRef]
- Kanehisa, M.; Goto, S. KEGG: Kyoto encyclopedia of genes and genomes. Nucleic Acids Res. 2000, 28, 27–30. [Google Scholar] [CrossRef]
- Dunn, W.B.; Broadhurst, D.; Begley, P.; Zelena, E.; Francis-McIntyre, S.; Anderson, N.; Brown, M.; Knowles, J.D.; Halsall, A.; Haselden, J.N.; et al. Procedures for large-scale metabolic profiling of serum and plasma using gas chromatography and liquid chromatography coupled to mass spectrometry. Nat. Protoc. 2011, 6, 1060–1083. [Google Scholar] [CrossRef] [PubMed]
- Want, E.J.; Wilson, I.D.; Gika, H.; Theodoridis, G.; Plumb, R.S.; Shockcor, J.; Holmes, E.; Nicholson, J.K. Global metabolic profiling procedures for urine using UPLC-MS. Nat. Protoc. 2010, 5, 1005–1018. [Google Scholar] [CrossRef] [PubMed]
- Want, E.J.; Masson, P.; Michopoulos, F.; Wilson, I.D.; Theodoridis, G.; Plumb, R.S.; Shockcor, J.; Loftus, N.; Holmes, E.; Nicholson, J.K. Global metabolic profiling of animal and human tissues via UPLC-MS. Nat. Protoc. 2013, 8, 17–32. [Google Scholar] [CrossRef]
- The R Core Team. R: A Language and Environment for Statistical Computing; R Foundation for Statistical Computing: Vienna, Austria, 2020; Volume 1. [Google Scholar]
- Python Software Foundation. Python 2.7.6 Documentation. 2014. Available online: https://www.python.org/doc/versions/ (accessed on 17 September 2025).
- CentOS Project. CentOS 6.6 Release Notes. 2014. Available online: https://wiki.centos.org/Manuals(2f)ReleaseNotes(2f)CentOS6(2e)6.html (accessed on 17 September 2025).
- Wen, B.; Mei, Z.; Zeng, C.; Liu, S. metaX: A flexible and comprehensive software for processing metabolomics data. BMC Bioinform. 2017, 18, 183. [Google Scholar] [CrossRef] [PubMed]
- Wu, T.; Hu, E.; Xu, S.; Chen, M.; Guo, P.; Dai, Z.; Feng, T.; Zhou, L.; Tang, W.; Zhan, L.; et al. clusterProfiler 4.0: A universal enrichment tool for interpreting omics data. Innovation 2021, 2, 100141. [Google Scholar] [CrossRef]
- Pang, Z.; Chong, J.; Li, S.; Xia, J. MetaboAnalystR 3.0: Toward an Optimized Workflow for Global Metabolomics. Metabolites 2020, 10, 186. [Google Scholar] [CrossRef]
- Livak, K.J.; Schmittgen, T.D. Analysis of relative gene expression data using real-time quantitative PCR and the 2(-Delta Delta C(T)) Method. Methods 2001, 25, 402–408. [Google Scholar] [CrossRef]
Disclaimer/Publisher’s Note: The statements, opinions and data contained in all publications are solely those of the individual author(s) and contributor(s) and not of MDPI and/or the editor(s). MDPI and/or the editor(s) disclaim responsibility for any injury to people or property resulting from any ideas, methods, instructions or products referred to in the content. |
© 2025 by the authors. Licensee MDPI, Basel, Switzerland. This article is an open access article distributed under the terms and conditions of the Creative Commons Attribution (CC BY) license (https://creativecommons.org/licenses/by/4.0/).