Abstract
This study aims to elucidate the neurodevelopmental toxicity and molecular mechanisms of endocrine-disrupting chemicals (EDCs) in neurodevelopmental disorders (NDDs) through a network toxicology approach, using triclosan exposure as a case example. Potential targets of triclosan were identified via comparative analysis of toxicogenomics databases such as the Comparative Toxicogenomics Database (CTD), Similarity Ensemble Approach (SEA), SwissTargetPrediction, and TargetNet. NDD-related targets were retrieved from GeneCards, Disease Gene Network (DisGeNET), and Online Mendelian Inheritance in Man (OMIM), resulting in 633 overlapping genes associated with disease pathology and triclosan effectors. Protein–protein interaction networks were constructed using STRING and Cytoscape, applying median-based algorithms to identify six core genes: AKT1, TP53, EGFR, FN1, SRC, and ESR1. Gene Ontology (GO) and Kyoto Encyclopedia of Genes and Genomes (KEGG) enrichment analyses via Metascape revealed that triclosan-induced NDDs are primarily associated with endocrine signaling disruption and activation of the PI3K-Akt pathway. Molecular docking with CB-Dock2 demonstrated strong binding affinities between triclosan and the core targets, while YASARA molecular dynamics simulations confirmed stable interactions, notably with EGFR, exhibiting high binding stability. Collectively, these findings delineate the potential molecular mechanisms underlying triclosan-induced NDDs and underscore the utility of network toxicology, molecular docking, and molecular dynamics simulations in assessing neurotoxicity and related molecular pathways. This research provides novel insights for future investigations, enhances understanding of the potential impact of neurodevelopmental disorders on health, and lays a scientific foundation for the development of preventive and therapeutic strategies.
1. Introduction
Triclosan (TCS), as a broad-spectrum antimicrobial agent, has been extensively incorporated into commercial and healthcare formulations such as soaps, dentifrices, hand sanitizers, cosmetics, textiles, and plastics owing to its potent bactericidal and bacteriostatic properties []. In 2012, the World Health Organization (WHO) designated triclosan as an emerging environmental endocrine disruptor, raising concerns regarding its potential endocrine-disrupting effects and associated health risks []. Subsequently, in 2016, the U.S. Food and Drug Administration (FDA) prohibited the inclusion of triclosan in over-the-counter consumer antiseptic products while permitting its use within medical and clinical settings []. Nonetheless, the widespread deployment of disinfectants and hand hygiene products during the COVID-19 pandemic has intensified triclosan accumulation in environmental matrices [], complicating its environmental fate and transport. The synergistic interactions between triclosan and co-occurring pollutants pose additional challenges to environmental safety assessments [,]. Epidemiological and toxicological studies indicate that chronic exposure to triclosan-containing dentifrices correlates with elevated plasma concentrations [], and its frequent detection in maternal biological samples—including urine, blood, breast milk, amniotic fluid, and neural tissues—raises concerns about transplacental transfer and neurodevelopmental risks to the fetus via the blood–brain barrier [,,].
Neurological developmental disorders (NDDs), such as autism spectrum disorder (ASD) and attention deficit hyperactivity disorder (ADHD), may result from teratogenic exposures during gestation and are modulated by a complex interplay of genetic predisposition, epigenetic alterations and environmental factors [,]. Current research on triclosan toxicity primarily focuses on acute toxicity and reproductive developmental toxicity, with limited investigations into its impact on human neurohealth; existing studies provide preliminary epidemiological evidence of potential adverse effects. The neurotoxicity of triclosan is closely associated with dysregulation of multiple signaling pathways due to its endocrine-disrupting properties [,]. Initially, at the nuclear receptor level, triclosan interferes with thyroid hormone homeostasis by competitively binding to TR, thereby affecting critical processes in neurodevelopment []. Furthermore, triclosan acts on GPER to activate downstream pathways PKC/MAPK, leading to the upregulation of miR-144, which causes neurodevelopmental toxicity and abnormal motor behavior in zebrafish larvae []. Triclosan also targets multiple non-nuclear receptor targets. Animal experiments have shown that triclosan regulates the Nrf2/HO-1 pathway through the PI3K/Akt/JNK signaling cascade, increasing intracellular ROS production and upregulating the expression of pro-apoptotic proteins, thus inducing neuronal oxidative damage []. Concurrently, chronic maternal exposure to triclosan can induce neurodevelopmental disorders in offspring by mediating increased peripheral inflammation and hippocampal neuronal synaptic damage, leading to autism-like social behavioral deficits [,]. Moreover, triclosan may activate microglia, increase PKM2 dimerization, and mediate STAT3 phosphorylation, resulting in behavioral disorders and neurotoxicity in offspring []. Epidemiological studies further support these mechanisms, showing a positive correlation between prenatal triclosan exposure levels in pregnant women and the risk of early childhood language development delays and attention deficit symptoms. Additionally, there is a dose-dependent association between the concentration of triclosan metabolites in children’s urine and the severity of core autism symptoms []. Notably, pediatric exposure levels surpass those of adults, compounded by the immature blood–brain barrier in children, rendering them more susceptible to triclosan-induced neurotoxicity []. Nonetheless, the precise molecular targets involved in triclosan-induced neurodevelopmental disorders and transgenerational epigenetic modifications remain to be elucidated; comprehensive mechanistic studies are essential to establish a scientific foundation for early environmental intervention strategies.
This study employed network toxicology approaches to construct complex regulatory networks, elucidating the multifaceted toxicological pathways by which triclosan exacerbates neurodevelopmental disorders. It aims to identify potential pathogenic mechanisms, offering strategic insights for environmental pollutant toxicity assessment, and providing guidance for regulatory policies and the rational application of antimicrobial agents.
2. Results
2.1. Target Identification
A total of 3563 triclosan target genes were identified through integration of data from the CTD, SwissTargetPrediction, SEA, and TargetNet databases (Figure 1A). Additionally, NDD targets were extracted from GeneCards, DisGeNET and OMIM, yielding 2838, 531, and 512 targets, respectively. Deduplication, defined here as the removal of duplicate gene symbols across the three databases to retain unique entries, resulted in 3066 unique targets (Figure 1B). The intersection between disease-related genes and triclosan targets revealed 633 shared genes (Figure 1C), indicating a significant association with triclosan-induced neurodegenerative disorders. Detailed information on each gene set in the Venn Diagram are presented in Supplementary Table S1.
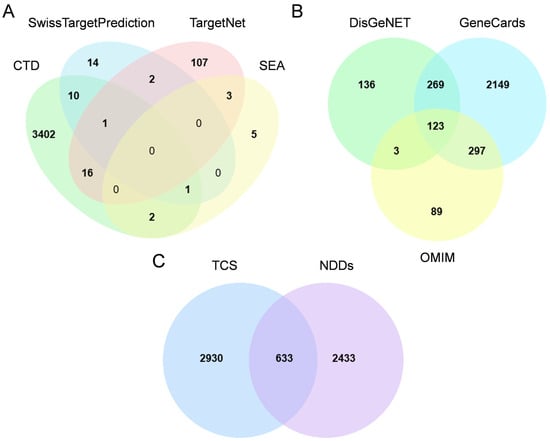
Figure 1.
Target identification workflow. (A) Target collection for triclosan (TCS), including 3563 targets retrieved from Comparative Toxicogenomics Database (CTD), SwissTargetPrediction, Similarity Ensemble Approach (SEA), and TargetNet; (B) target collection for neurodevelopmental disorders (NDDs), including 3066 targets retrieved from GeneCards, Disease Gene Network (DisGeNET) and Online Mendelian Inheritance in Man (OMIM); (C) Venn diagram showing intersecting targets between TCS and NDDs.
2.2. Core Genes of Triclosan-Induced Neurodevelopmental Disorder Shared Gene Network
Following the identification of 633 intersecting genes between triclosan and NDDs, we investigated the potential functional interactions of these genes at the protein level. To this end, a PPI network was constructed using STRING, encompassing all 633 gene products. The resulting network comprised 632 nodes, 985 edges, and an average node degree of 3.12. Following the import of a TSV file generated from STRING into Cytoscape 3.10.0, network topology analysis was performed using the CytoNCA plugin. Employing the median of six topological parameters as a threshold, genes exhibiting parameter values exceeding the median were retained. This approach allows for a comprehensive assessment of node importance from multiple perspectives, ensuring the robust identification of core genes. This process culminated in the identification and visualization of the top 19 hub genes: CAV1, COL1A1, SRC, TGFB1, IGF1, GAPDH, TNF, BRCA1, ESR1, MYC, AKT1, IL6, FN1, EGFR, IGF1R, FOS, FGA, CCND1, and TP53 (Figure 2).
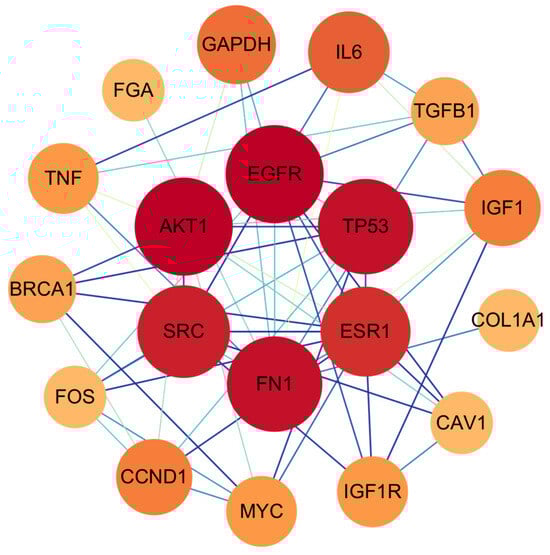
Figure 2.
The protein-protein network interactions in core targets. The network diagram represents complex interactions among 19 core genes, highlighting their functional connections. Node color (red to orange gradient) and node size (large to small gradient) correspond to the degree value: red/larger nodes represent genes with higher degree values, while orange/smaller nodes represent genes with lower degree values.
2.3. Validation of the Core Gene Random Dataset
To validate the core gene expression profiles, we randomly selected the GSE230714 dataset. This dataset includes samples of human embryonic stem cell (hESC)-derived MECP2 wild-type (WT, control group) and MECP2 mutant (KO, simulating NDD subtype RTT pathological state, case group) neurons, with three biologically independent samples in each group. ERCC RNA Spike-in, an external RNA mixture of known concentration, was added to the experiment to correct for differences in cell number input and ensure the standardized accuracy of gene expression data. We performed differential expression analysis of the control and case groups of the dataset using the GEO2R online analysis tool. Visualization of differential expression results was performed via volcano plots on the microarray analysis platform. The results indicate that among the 19 selected core genes, only 12 were present in the gene expression matrix of the dataset, while the remaining 7 were absent. Consequently, the volcano plot only displays these 12 genes that are present in the dataset. Notably, BRCA1 was significantly upregulated in the case group. EGFR, MYC, IGF1R, and IGF1 were significantly downregulated. GAPDH, TP53, and CCND1 exhibited minor expression changes, yet these changes were statistically significant (Figure 3).
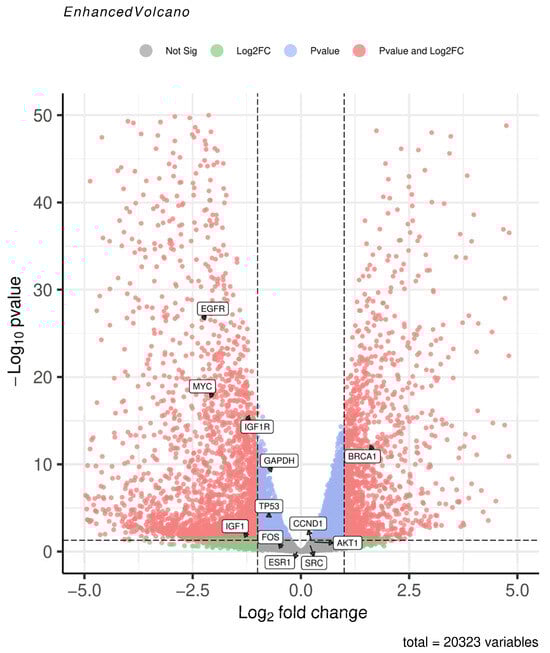
Figure 3.
Volcano plot of the core genes detected and differentially expressed in GSE230714. Significant hits are shown in red: |log2FC| ≥ 1 and p value < 0.05. Positive log2FC (right side): up-regulated in MECP2-KO (case) neurons; Negative log2FC (left side): down-regulated in MECP2-KO neurons.
2.4. Enrichment Analyses for GO Terms and KEGG Pathways
To elucidate the biological mechanisms by which triclosan exacerbates NDDs, GO and KEGG enrichment analyses were performed on 633 shared targets using the Metascape online platform. The top six GO-BP terms include carboxylic acid metabolic process, circulatory system process, and response to exogenous stimuli; GO-CC terms involve the cell body, mitochondrial matrix, and collagen-containing extracellular matrix; GO-MF terms are associated with oxidoreductase activity, protein homodimerization activity, and cell adhesion molecule binding (Figure 4A,B).
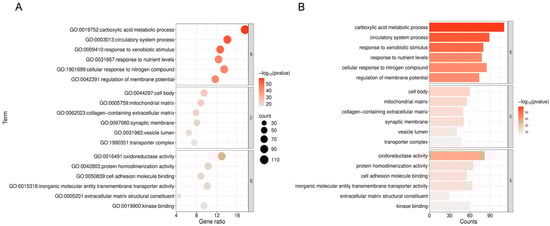
Figure 4.
Enrichment analysis of GO for 633 shared genes. (A) The size of each bubble corresponds to the gene expression level within a specific pathway. “GO:XXXXXXX” is the official Gene Ontology identifier. Gene ratio: the proportion of genes in the set that share the term. (B) The bar chart illustrates the top six enriched GO categories—biological process (BP), cellular component (CC), and molecular function (MF)—with the lowest FDR values among 633 shared genes.
A total of 180 pathways were identified through KEGG pathway enrichment analysis (adjusted p < 0.05). The top 20 pathways with the lowest FDR values were selected for visualization and further analysis. These pathways were depicted using bar plots and bubble charts (Figure 5A,B). The analysis primarily involved metabolic pathways such as carbon metabolism; signal transduction pathways including PI3K-Akt and MAPK pathways; disease-related pathways such as oncogenic signaling and diabetic cardiomyopathy; as well as cellular physiological pathways like cytoskeletal organization in muscle cells.
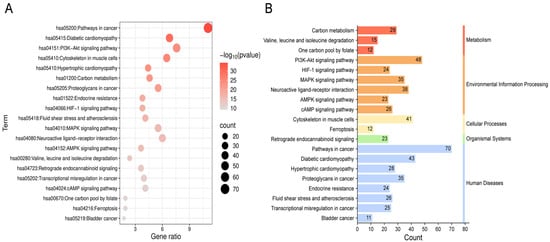
Figure 5.
Enrichment analysis of KEGG for 633 shared genes. (A) The bubble chart depicted the twenty most significantly enriched KEGG signaling pathways, ranked by ascending FDR values. “hsaXXXXX” is the KEGG human pathway identifier. Gene ratio: proportion of input genes that map to the pathway. (B) The count denotes the number of enriched KEGG pathways in each major functional category.
2.5. Molecular Docking Analysis of Core Targets of Triclosan and Neurodevelopmental Disorders
Molecular docking was performed on ESR1 (PDBID: 6SBO), EGFR (PDBID: 8A27), SRC (PDBID: 1FMK),FN1 (PDBID: 4LXO), AKT1 (PDBID: 7MYX) and TP53 (PDBID: 3D06). The CB-Dock2 results indicated binding energies of −7.8, −7.3, −7.2, −6.1, −5.5 and −5.3 kcal/mol, respectively. Binding energies below zero suggest active binding, with values less than −5.0 kcal/mol indicating strong affinity; lower values correspond to higher binding strength. The findings confirm that triclosan exhibits high affinity for these six core targets, implying a pivotal role in the molecular mechanism of triclosan-induced neurodegenerative disorders. Binding modes were visualized through 3D and 2D interaction diagrams (Figure 6).
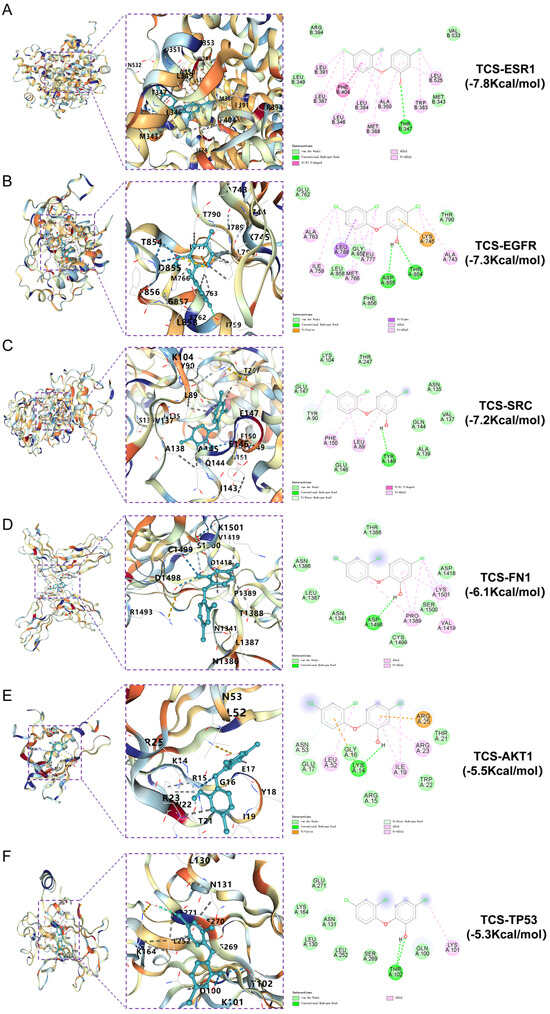
Figure 6.
Molecular docking of triclosan with ESR1, EGFR, SRC, FN1, AKT1 and TP53, showing the lowest binding energies in both 3D and 2D formats. (A) TCS and ESR1; (B) TCS and EGFR; (C) TCS and SRC; (D) TCS and FN1; (E) TCS and AKT1; (F) TCS and TP53.
2.6. Molecular Dynamics Simulation of Core Target Proteins
To further validate the binding affinity of TCS to six core targets, molecular dynamics simulations involving TCS and these targets were conducted in order of decreasing binding free energy. RMSD effectively measures the conformational stability of proteins and ligands, indicating the extent of atomic positional deviation from their initial configurations. Lower RMSD values suggest greater conformational stability [].
RMSD was employed to assess the stability of the simulation systems. Each RMSD plot comprises two traces: the black trace represents the fluctuation of the receptor protein’s backbone, while the red trace denotes the fluctuation of the receptor–triclosan complex’s overall backbone. The near-superimposition of these traces suggests that ligand binding does not induce significant additional conformational perturbation. The stability of the complex is primarily dictated by the protein backbone, with triclosan maintaining a relatively fixed position within the binding site. Notably, the TCS-EGFR complex exhibits relatively low RMSD fluctuations, indicating a particularly stable interaction structure, which is consistent with the molecular docking binding energy results (Figure 7).
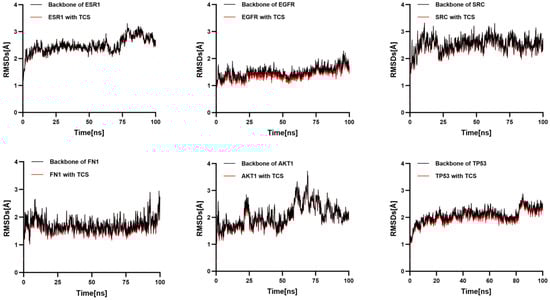
Figure 7.
Temporal variation in RMSD values for protein–ligand complexes.
RMSF indicates the flexibility of amino acid residues within the protein []. Across all complexes, RMSF values for amino acid residues were relatively low (primarily between 1 and 6 Å), except at the C- and N-termini. Additionally, the energy fluctuations of the complexes formed between TCS and the six target proteins remained relatively stable (Figure 8). For example, the TCS-TP53 complex exhibited some oscillations in energy during the simulation but maintained within a specific range, indicating overall energetic stability post-binding. Similarly, the energy curves for TCS-EGFR and TCS-ESR1 complexes showed dynamic equilibrium trends with lower average energies, reflecting particularly stable binding energies with EGFR and ESR1 (Figure 9). These thermodynamic energy fluctuation data support the stability of TCS-target protein interactions, corroborating the conformational stability indicated by RMSD analysis.
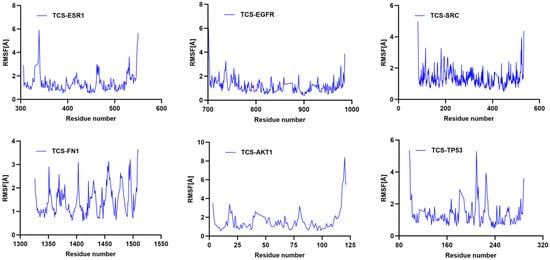
Figure 8.
Temporal variation in RMSF values for protein–ligand complexes.
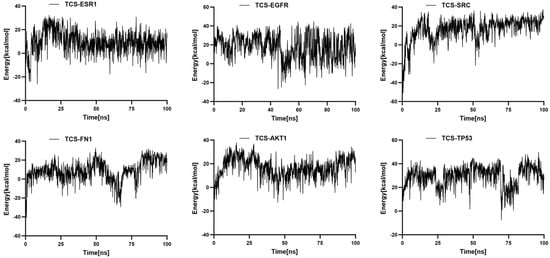
Figure 9.
Temporal variation in binding free energy in protein–ligand complexes.
In summary, aside from AKT1, five target proteins including TP53 demonstrated stable binding interactions with TCS. Notably, TCS exhibited the lowest RMSD value with EGFR, and the system remained stable and compact, suggesting that EGFR may play a key role in TCS-induced NDDs.
3. Discussion
This study employed network toxicology approaches to identify six core genes—EGFR, TP53, AKT1, SRC, FN1, and ESR1—highlighting their potential molecular associations with triclosan and NDDs. Notably, EGFR, a transmembrane receptor tyrosine kinase, exhibits aberrant activation that modulates neuronal survival and apoptosis via the PI3K-Akt and MAPK signaling pathways, which are closely linked to amyloid-beta deposition and tau protein phosphorylation in Alzheimer’s disease [,]. In this investigation, the GSE230714 dataset revealed a significant downregulation of EGFR expression. Molecular docking studies indicated a binding energy of −7.3 kcal/mol with TCS, suggesting that TCS may induce neuronal apoptosis by directly inhibiting EGFR activity and interfering with downstream neuroprotective signaling pathways. As a tumor suppressor gene, TP53 dysfunction may exacerbate neuronal DNA repair deficiencies and induce apoptosis under oxidative stress conditions, intersecting mechanistically with the dopaminergic neurodegeneration observed in Parkinson’s disease []; AKT1, as a central component of the PI3K-Akt signaling pathway [], whose dysregulation can disrupt neuronal energy homeostasis, particularly in glucose uptake and mitochondrial function regulation, is critically involved []. KEGG pathway enrichment analysis indicating abnormalities in carbon metabolism further corroborates the disruption of this signaling cascade. These findings align with the observations of Wang et al. [], who demonstrated that TCS induces neuronal oxidative damage by inhibiting AKT phosphorylation and attenuating the Nrf2/HO-1 antioxidant pathway.
From a pathway-level perspective, the enrichment of GO terms related to carboxylic acid metabolic processes and responses to exogenous stimuli suggests that triclosan may induce chronic neurotoxicity by disrupting neuronal metabolic homeostasis and stress response mechanisms. The association between GO-CC and the FN1 gene warrants further investigation; as a cell adhesion molecule, aberrant FN1 expression could compromise blood–brain barrier integrity or disrupt neuron-glia interaction networks [], potentially contributing to the neuroinflammatory microenvironment observed in neurodevelopmental disorders. The KEGG-identified PI3K-Akt and MAPK signaling pathways serve not only as central convergence points for core oncogenic genes but also directly regulate critical neurobiological processes such as synaptic plasticity and cytokine secretion [,,]. The enrichment of cancer-related pathways may reflect the synergistic interaction between triclosan-induced aberrant proliferative signaling and neurodegenerative mechanisms. It is noteworthy that the methodology employed in this study aligns with the work of Zhang et al. [] concerning phthalate-induced depression. Both studies identify the PI3K-Akt pathway and endocrine resistance as central hubs in the pathogenic mechanisms of endocrine-disrupting chemicals, suggesting that various environmental pollutants may interfere with physiological functions via conserved signaling axes.
The molecular docking results further indicate that triclosan exhibits high binding affinity to six core genes, suggesting its potential to interfere with multiple biological pathways through direct targeting of these proteins. For instance, as an estrogen receptor, ESR1’s interaction with triclosan may mediate endocrine disruption via its estrogenic activity, potentially contributing to NDDs []. Research indicates that prenatal exposure to triclocarban disrupts ESR1-mediated signaling pathways, induces sex-specific epigenetic modifications, and perturbs the expression of neurogenesis and neurotransmitter-related genes in the postnatal murine brain []. Activation of SRC kinases may further facilitate neurotoxicity induced by β-amyloid through modulation of microglial activation states []. These mechanisms collectively delineate a complex network whereby triclosan contributes to neurodevelopmental disorder pathogenesis via a multidimensional cascade involving metabolic dysregulation, signal transduction impairment, and cellular homeostasis imbalance.
Molecular dynamics simulations confirm that EGFR is the core node with the highest binding stability among NDD-related target proteins interacting with TCS. The conformational complex formed between EGFR and TCS can perpetually activate the PI3K-Akt signaling pathway, thereby driving neuronal metabolic dysregulation and inflammatory cascades. Integrating prior network toxicology data and molecular docking results, the characteristic of EGFR’s conformational stability and sustained signaling positions it as a pivotal molecular hub in TCS-induced neurotoxicity. Future investigations should focus on functional validation of the EGFR-TCS complex to elucidate its specific impacts on synaptic plasticity and blood–brain barrier integrity, providing a theoretical basis for targeted prevention strategies against NDDs. Additionally, the observed transient binding of AKT1 with TCS suggests the necessity for further exploration of upstream regulatory modifications, aiming to refine the understanding of the multi-target neurotoxic mechanisms associated with TCS.
It is noteworthy that this study has inherent limitations. Although a potential mechanistic framework was constructed through bioinformatics analysis, there is a lack of in vivo and in vitro experimental validation of the core gene-pathway axis, particularly regarding the differential specificity of triclosan across various NDDs subtypes. Additionally, in human exposure scenarios, triclosan often co-occurs with other environmental pollutants, and the combined toxicological effects and interactions with genetic backgrounds remain to be elucidated. Future research should integrate advanced techniques such as single-cell sequencing and organoid models to further delineate the neurotoxic targets of triclosan within neuron-glia interaction networks, thereby providing more precise scientific evidence for environmental risk assessment of NDDs.
4. Materials and Methods
4.1. Triclosan Target Identification and Data Collection
The chemical structure and SMILES notation of triclosan were retrieved from PubChem (CID: 5460576). Triclosan and its structural formulas are shown in Table 1. Potential triclosan targets were identified through database searches in TargetNet, SEA, SwissTargetPrediction, and the CTD, with the species restricted to Homo sapiens. Target names were standardized using STRING and UniProt databases. The consolidated and deduplicated target list was used to construct the triclosan target repository.

Table 1.
The chemical formula and structural formula of triclosan.
4.2. Neurodevelopmental Disorder Target Identification
Utilize “Neurodevelopmental Disorders” as the search term to retrieve associated targets from GeneCards, OMIM, and DisGeNET databases. Subsequently, integrate these targets into a consolidated NDDs target dataset. Inclusion criteria encompass a relevance score of ≥10 in GeneCards and a GDA score of ≥0.4 in DisGeNET.
4.3. Shared Genetic PPI Network and Core Target Identification
Construct a Venn diagram using the online platform for data analysis and visualization https://www.bioinformatics.com.cn/static/others/jvenn/example.html (accessed on 7 September 2025) to visualize the intersection between triclosan targets and NDDs-associated genes, thereby identifying overlapping genes.
4.4. Protein–Protein Interaction (PPI) Network Construction
Import the shared gene set into the STRING database, setting parameters: species as Homo sapiens, interaction confidence score > 0.9 (ultra-high confidence), to generate the PPI network. Import the TSV file generated from STRING into Cytoscape version 3.10.0 (Cytoscape Consortium, La Jolla, CA, USA). Employ the CytoNCA plugin to perform network topology analysis, identify candidate genes, and compute six key parameters: Betweenness, Closeness, Degree, Eigenvector, LAC, and Network. Subsequently, identify core genes as those exhibiting all six parameter values exceeding the median.
4.5. Validation of Gene Expression in Randomized Samplesn
Retrieve gene expression matrices from the GEO database using the keywords “Neurodevelopmental Disorders” and “Homo sapiens.” Perform grouping and differential expression analysis of key target genes between normal and diseased samples utilizing the GEO2R online tool, with results visualized through volcano plots https://www.bioinformatics.com.cn/plot_enhanced_volcano_plot_138 (accessed on 7 September 2025).
4.6. GO and KEGG Enrichment Analysis
Utilized the Metascape database for GO functional enrichment and KEGG pathway analysis. Converted intersecting gene symbols to Entrez Gene IDs, selected Homo sapiens as the species, and performed enrichment analysis across GO categories (biological process, cellular component, molecular function) and KEGG pathways. Significance threshold was set at p < 0.05 with Benjamini–Hochberg correction. The top six GO terms and top twenty KEGG pathways were selected based on q-values, and the results were exported as CSV files for visualization through bioinformatics tools, generating bubble plots and bar charts https://www.bioinformatics.com.cn/?keywords=pathway (accessed on 7 September 2025).
4.7. Molecular Docking of Triclosan with Core Target Proteins
Molecular docking validation was performed on the CB-Dock2 online platform using triclosan as the ligand and the top six core targets based on degree values from the PPI network as receptors https://cadd.labshare.cn/cb-dock2/ (accessed on 7 September 2025) []. Initially, triclosan isomer SMILES were obtained from PubChem. Crystal structures of Homo sapiens with a resolution < 2.5 Å were downloaded from RCSB PDB based on UniProt ID. If the structure contained a co-crystal ligand, the original ligand was first removed within the platform, and redocking was performed to validate the system’s reliability with RMSD ≤ 2 Å. Subsequently, the platform automatically preprocessed the protein (hydrogenation, side-chain completion, removal of water and heteroatoms) and ligand (charge addition, 3D conformation generation). A blind docking mode was employed, and potential binding sites were identified using a curvature cavity algorithm. The binding mode with the lowest AutoDock Vina version 1.1.2 (The Scripps Research Institute, La Jolla, CA, USA) score was selected as the optimal conformation. Binding affinity was directly characterized using the binding energy (kcal/mol) output by the platform, and the interaction mode was visualized through the CB-Dock2 built-in 3D view and Discovery Studio 2019 (Dassault Systèmes BIOVIA, Vélizy-Villacoublay, France) 2D diagrams.
4.8. Molecular Dynamics Simulation
The receptor and ligand structures were preprocessed using YASARA version 10.3.16 (Bio-Prodict BV, Nijmegen, The Netherlands),which included the removal of irrelevant atoms, the addition of hydrogen atoms, and the assignment of protonation states (pH = 7.4) to optimize the structure. Given that the PDBQT atom types and partial charges generated by CB-Dock2 could not be recognized by YASARA’s AMBER force field, we re-executed molecular docking within YASARA, while maintaining the search grid and exhaustiveness, to screen for the complex with the best binding energy and reasonable conformation as the target system. Subsequently, based on the AMBER force field, the complex was placed in an explicit solvent environment, and a cubic simulation box was established using periodic boundary conditions (“around-all-atoms” mode + 5 Å buffer, α = β = γ = 90°); water and ions were added according to the software’s default settings. After the system was subjected to energy minimization and equilibration, a 100 ns (100,000 ps) molecular dynamics simulation was performed, with real-time recording of parameters such as RMSD, energy, and RMSF. Post-simulation, the resulting data were visualized using GraphPad Prism version 9.0 (GraphPad Software, San Diego, CA, USA), with line graphs generated to facilitate intuitive interpretation of the analysis outcomes.
4.9. Data Sources
All databases were accessed between April and September 2025. The specific versions of these databases are shown in Table 2.
Table 2.
Data source and access link.
5. Conclusions
This study employed network toxicology and molecular docking analyses to comprehensively evaluate the neurodevelopmental hazard potential of triclosan, identifying 633 intersecting targets associated with triclosan-induced NDDs. The mechanistic pathways involve endocrine disruption (including estrogenic activity), enhancement of glycolytic flux via PI3K-Akt pathway interference affecting neuronal energy metabolism, and regulation of synaptic plasticity and cytokine release. Molecular docking results of the top six core targets—EGFR, TP53, AKT1, SRC, FN1, and ESR1—selected through median-based algorithms, indicate their pivotal roles in mediating triclosan-induced NDDs. Molecular dynamics simulations confirm that EGFR exhibits the highest binding stability among NDDs-related targets, with the triclosan–EGFR complex conformation capable of sustained activation of the PI3K-Akt pathway, thereby driving neuronal energy dysregulation and inflammatory cascades. While regulatory assessments of environmental endocrine disruptors like triclosan predominantly focus on acute toxicity and carcinogenicity, this research uniquely applies a multidimensional systems biology approach to elucidate the molecular mechanisms underlying triclosan-induced NDDs, providing a methodological framework for the risk assessment of emerging environmental contaminants on neurodevelopment.
Supplementary Materials
The following supporting information can be downloaded at: https://www.mdpi.com/article/10.3390/ijms26199458/s1.
Author Contributions
Methodology and writing—original draft, H.W.; data curation, Y.D.; writing—review and editing, J.J.; formal analysis and investigation, C.W. and Z.Y.; resources, X.L.; software, Y.L.; funding acquisition and supervision, S.G. All authors have read and agreed to the published version of the manuscript.
Funding
This study was financially supported by the National Natural Science Foundation of China (Grant No. 82260647), the Ningxia Key Research and Development Program (Grant No. 2023BEG02005), the Ningxia Medical University 2023 University-level Scientific Research Project (Grant No. XZ2023001), and the Open competition mechanism to select the best candidates for key research projects of Ningxia Medical University (Grant No. XJKF240317).
Institutional Review Board Statement
Not applicable.
Informed Consent Statement
Not applicable.
Data Availability Statement
The original contributions presented in this study are included in the article. Further inquiries can be directed to the corresponding author.
Conflicts of Interest
The authors declare no conflicts of interest.
References
- Weatherly, L.M.; Gosse, J.A. Triclosan exposure, transformation, and human health effects. J. Toxicol. Environ. Health B Crit. Rev. 2017, 20, 447–469. [Google Scholar] [CrossRef]
- Bergman, Å.; Heindel, J.; Jobling, S.; Kidd, K.; Zoeller, R.T. State-of-the-science of endocrine disrupting chemicals, 2012. Toxicol. Lett. 2012, 211, S3. [Google Scholar] [CrossRef]
- Brose, D.A.; Kumar, K.; Liao, A.; Hundal, L.S.; Tian, G.; Cox, A.; Zhang, H.; Podczerwinski, E.W. A reduction in triclosan and triclocarban in water resource recovery facilities’ influent, effluent, and biosolids following the U.S. Food and Drug Administration’s 2013 proposed rulemaking on antibacterial products. Water Environ. Res. 2019, 91, 715–721. [Google Scholar] [CrossRef] [PubMed]
- Adhikari, S.; Kumar, R.; Driver, E.M.; Perleberg, T.D.; Yanez, A.; Johnston, B.; Halden, R.U. Mass trends of parabens, triclocarban and triclosan in Arizona wastewater collected after the 2017 FDA ban on antimicrobials and during the COVID-19 pandemic. Water Res. 2022, 222, 118894. [Google Scholar] [CrossRef]
- Zhang, D.; Lu, S. A holistic review on triclosan and triclocarban exposure: Epidemiological outcomes, antibiotic resistance, and health risk assessment. Sci. Total Environ. 2023, 872, 162114. [Google Scholar] [CrossRef] [PubMed]
- Luo, N.; Chen, J.; Chen, X.; Wang, M.; Niu, X.; Chen, G.; Deng, C.; Gao, Y.; Li, G.; An, T. Toxicity evolution of triclosan during environmental transformation and human metabolism: Misgivings in the post-pandemic era. Environ. Int. 2024, 190, 108927. [Google Scholar] [CrossRef]
- Cheng, X.; Shen, H.; Zhang, W.; Chen, B.; Xu, S.; Wu, L. Characterizing the effects of triclosan and triclocarban on the intestinal epithelial homeostasis using small intestinal organoids. J. Hazard. Mater. 2024, 479, 135734. [Google Scholar] [CrossRef] [PubMed]
- Cragoe, N.; Sprowles, J.; Woodbury, M.L.; Musaad, S.; Enright, E.; Aguiar, A.; Schantz, S.L. Associations of prenatal maternal urinary concentrations of triclosan and benzophenone-3 with cognition in 7.5-month-old infants. Environ. Res. 2024, 263 Pt 1, 119975. [Google Scholar] [CrossRef]
- Chen, X.; Mou, L.; Qu, J.; Wu, L.; Liu, C. Adverse effects of triclosan exposure on health and potential molecular mechanisms. Sci. Total Environ. 2023, 879, 163068. [Google Scholar] [CrossRef]
- Guo, J.; Wu, C.; Zhang, J.; Xiao, H.; Lv, S.; Lu, D.; Qi, X.; Feng, C.; Liang, W.; Chang, X.; et al. Early life triclosan exposure and neurodevelopment of children at 3 years in a prospective birth cohort. Int. J. Hyg. Environ. Health 2020, 224, 113427. [Google Scholar] [CrossRef]
- Doi, M.; Usui, N.; Shimada, S. Prenatal Environment and Neurodevelopmental Disorders. Front. Endocrinol. 2022, 13, 860110. [Google Scholar] [CrossRef]
- Parenti, I.; Rabaneda, L.G.; Schoen, H.; Novarino, G. Neurodevelopmental Disorders: From Genetics to Functional Pathways. Trends Neurosci. 2020, 43, 608–621. [Google Scholar] [CrossRef]
- Ruszkiewicz, J.A.; Li, S.; Rodriguez, M.B.; Aschner, M. Is Triclosan a neurotoxic agent? J. Toxicol. Environ. Health B Crit. Rev. 2017, 20, 104–117. [Google Scholar] [CrossRef] [PubMed]
- Alizadeh-Tabari, S.; Esfahani, M.L.; Hoseini, S.M.; Rahimi, A. Neurobehavioral toxicity of triclosan in mice. Food Chem. Toxicol. 2019, 130, 154–160. [Google Scholar] [CrossRef] [PubMed]
- Johnson, P.I.; Koustas, E.; Vesterinen, H.M.; Sutton, P.; Atchley, D.S.; Kim, A.N.; Campbell, M.; Donald, J.M.; Sen, S.; Bero, L.; et al. Application of the Navigation Guide systematic review methodology to the evidence for developmental and reproductive toxicity of triclosan. Environ. Int. 2016, 92–93, 716–728. [Google Scholar] [CrossRef]
- Diao, W.; Qian, Q.; Sheng, G.; He, A.; Yan, J.; Dahlgren, R.A.; Wang, X.; Wang, H. Triclosan targets miR-144 abnormal expression to induce neurodevelopmental toxicity mediated by activating PKC/MAPK signaling pathway. J. Hazard. Mater. 2022, 431, 128560. [Google Scholar] [CrossRef]
- Wang, D.; Liu, J.; Jiang, H. Triclosan regulates the Nrf2/HO-1 pathway through the PI3K/Akt/JNK signaling cascade to induce oxidative damage in neurons. Environ. Toxicol. 2021, 36, 1953–1964. [Google Scholar] [CrossRef]
- Hao, Y.; Meng, L.; Zhang, Y.; Chen, A.; Zhao, Y.; Lian, K.; Guo, X.; Wang, X.; Du, Y.; Wang, X.; et al. Effects of chronic triclosan exposure on social behaviors in adult mice. J. Hazard. Mater. 2022, 424 Pt C, 127562. [Google Scholar] [CrossRef] [PubMed]
- Tran, D.N.; Jung, E.-M.; Yoo, Y.-M.; Lee, J.-H.; Jeung, E.-B. Perinatal Exposure to Triclosan Results in Abnormal Brain Development and Behavior in Mice. Int. J. Mol. Sci. 2020, 21, 4009. [Google Scholar] [CrossRef]
- Wei, Z.; Ni, X.; Cui, H.; Shu, C.; Peng, Y.; Li, Y.; Liu, J. Neurotoxic effects of triclosan in adolescent mice: Pyruvate kinase M2 dimer regulated Signal transducer and activator of transcription 3 phosphorylation mediated microglia activation and neuroinflammation. Sci. Total Environ. 2024, 942, 173739. [Google Scholar] [CrossRef]
- Santana, A.B.; Spelta, L.E.; Martinez-Sobalvarro, J.V.; Garcia, R.C.T.; dos Reis, T.M.; Torres, L.H.L. Gestational triclosan exposure and its effects on childneurodevelopment—A systematic review. Reprod. Toxicol. 2025, 132, 108849. [Google Scholar] [CrossRef] [PubMed]
- Chen, M.; Hu, Y.; Lv, C.; Shi, R.; Zhang, Y.; Tang, W.; Yu, X.; Tian, Y.; Gao, Y. Associations between repeated measurements of childhood triclosan exposure and physical growth at 7 years. Chemosphere 2022, 307, 135970. [Google Scholar] [CrossRef]
- Coutsias, E.A.; Wester, M.J. RMSD and Symmetry. J. Comput. Chem. 2019, 40, 1496–1508. [Google Scholar] [CrossRef] [PubMed]
- Sharanya, C.S.; Wilbee, D.S.; Sathi, S.N.; Natarajan, K. Computational screening combined with well-tempered metadynamics simulations identifies potential TMPRSS2 inhibitors. Sci. Rep. 2024, 14, 16197. [Google Scholar] [CrossRef]
- Limantoro, J.; De Liyis, B.G.; Sutedja, J.C. Akt signaling pathway: A potential therapy for Alzheimer’s disease through glycogen synthase kinase 3 beta inhibition. Egypt. J. Neurol. Psychiatry Neurosurg. 2023, 59, 147. [Google Scholar] [CrossRef]
- Tavassoly, O.; Sato, T.; Tavassoly, I. Inhibition of Brain Epidermal Growth Factor Receptor Activation: A Novel Target in Neurodegenerative Diseases and Brain Injuries. Mol. Pharmacol. 2020, 98, 13–22. [Google Scholar] [CrossRef]
- Szybińska, A.; Leśniak, W. P53 Dysfunction in Neurodegenerative Diseases—The Cause or Effect of Pathological Changes? Aging Dis. 2017, 8, 506–518. [Google Scholar] [CrossRef]
- Kumar, B.H.; Kabekkodu, S.P.; Pai, K.S.R. Structural insights of AKT and its activation mechanism for drug development. Mol. Divers. 2025. [Google Scholar] [CrossRef]
- Huang, C.-F.; Liu, S.-H.; Su, C.-C.; Fang, K.-M.; Yen, C.-C.; Yang, C.-Y.; Tang, F.-C.; Liu, J.-M.; Wu, C.-C.; Lee, K.-I.; et al. Roles of ERK/Akt signals in mitochondria-dependent and endoplasmic reticulum stress-triggered neuronal cell apoptosis induced by 4-methyl-2,4-bis(4-hydroxyphenyl)pent-1-ene, a major active metabolite of bisphenol A. Toxicology 2021, 455, 152764. [Google Scholar] [CrossRef] [PubMed]
- Bhattarai, P.; Gunasekaran, T.I.; Belloy, M.E.; Reyes-Dumeyer, D.; Jülich, D.; Tayran, H.; Yilmaz, E.; Flaherty, D.; Turgutalp, B.; Sukumar, G.; et al. Rare genetic variation in fibronectin 1 (FN1) protects against APOEε4 in Alzheimer’s disease. Acta Neuropathol. 2024, 147, 70. [Google Scholar] [CrossRef]
- Chen, S.; Peng, J.; Sherchan, P.; Ma, Y.; Xiang, S.; Yan, F.; Zhao, H.; Jiang, Y.; Wang, N.; Zhang, J.H.; et al. TREM2 activation attenuates neuroinflammation and neuronal apoptosis via PI3K/Akt pathway after intracerebral hemorrhage in mice. J. Neuroinflamm. 2020, 17, 168. [Google Scholar] [CrossRef] [PubMed]
- Liu, B.; Zhang, Y.; Yang, Z.; Liu, M.; Zhang, C.; Zhao, Y.; Song, C. ω-3 DPA Protected Neurons from Neuroinflammation by Balancing Microglia M1/M2 Polarizations through Inhibiting NF-κB/MAPK p38 Signaling and Activating Neuron-BDNF-PI3K/AKT Pathways. Mar. Drugs 2021, 19, 587. [Google Scholar] [CrossRef]
- Wang, L.; Tian, S.; Ruan, S.; Wei, J.; Wei, S.; Chen, W.; Hu, H.; Qin, W.; Li, Y.; Yuan, H.; et al. Neuroprotective effects of cordycepin on MPTP-induced Parkinson’s disease mice via suppressing PI3K/AKT/mTOR and MAPK-mediated neuroinflammation. Free Radic. Biol. Med. 2024, 216, 60–77. [Google Scholar] [CrossRef]
- Zhang, R.; Wen, H.; Lin, Z.; Li, B.; Zhou, X.; Wang, Q. Molecular Mechanisms of Phthalates in Depression: An Analysis Based on Network Toxicology and Molecular Docking. Int. J. Mol. Sci. 2025, 26, 8215. [Google Scholar] [CrossRef]
- He, T.-T.; Li, X.; Ma, J.-Z.; Yang, Y.; Zhu, S.; Zeng, J.; Luo, L.; Yin, Y.-L.; Cao, L.-Y. Triclocarban and triclosan promote breast cancer progression in vitro and in vivo via activating G protein-coupled estrogen receptor signaling pathways. Sci. Total Environ. 2024, 931, 172782. [Google Scholar] [CrossRef]
- Wnuk, A.; Rzemieniec, J.; Przepiórska, K.; Pietrzak, B.A.; Maćkowiak, M.; Kajta, M. Prenatal Exposure to Triclocarban Impairs ESR1 Signaling and Disrupts Epigenetic Status in Sex-Specific Ways as Well as Dysregulates the Expression of Neurogenesis- and Neurotransmitter-Related Genes in the Postnatal Mouse Brain. Int. J. Mol. Sci. 2021, 22, 13121. [Google Scholar] [CrossRef]
- Socodato, R.; Portugal, C.C.; Canedo, T.; Rodrigues, A.; Almeida, T.O.; Henriques, J.F.; Vaz, S.H.; Magalhães, J.; Silva, C.M.; Baptista, F.I.; et al. Microglia Dysfunction Caused by the Loss of Rhoa Disrupts Neuronal Physiology and Leads to Neurodegeneration. Cell Rep. 2020, 31, 107796. [Google Scholar] [CrossRef] [PubMed]
- Liu, Y.; Yang, X.; Gan, J.; Chen, S.; Xiao, Z.-X.; Cao, Y. CB-Dock2: Improved protein-ligand blind docking by integrating cavity detection, docking and homologous template fitting. Nucleic Acids Res. 2022, 50, W159–W164. [Google Scholar] [CrossRef] [PubMed]

Disclaimer/Publisher’s Note: The statements, opinions and data contained in all publications are solely those of the individual author(s) and contributor(s) and not of MDPI and/or the editor(s). MDPI and/or the editor(s) disclaim responsibility for any injury to people or property resulting from any ideas, methods, instructions or products referred to in the content. |
© 2025 by the authors. Licensee MDPI, Basel, Switzerland. This article is an open access article distributed under the terms and conditions of the Creative Commons Attribution (CC BY) license (https://creativecommons.org/licenses/by/4.0/).