Cord Blood Exosomal miRNAs from Small-for-Gestational-Age Newborns: Association with Measures of Postnatal Catch-Up Growth and Insulin Resistance

 , and
, and
Abstract
1. Introduction
2. Results
2.1. Characteristics of the Study Population
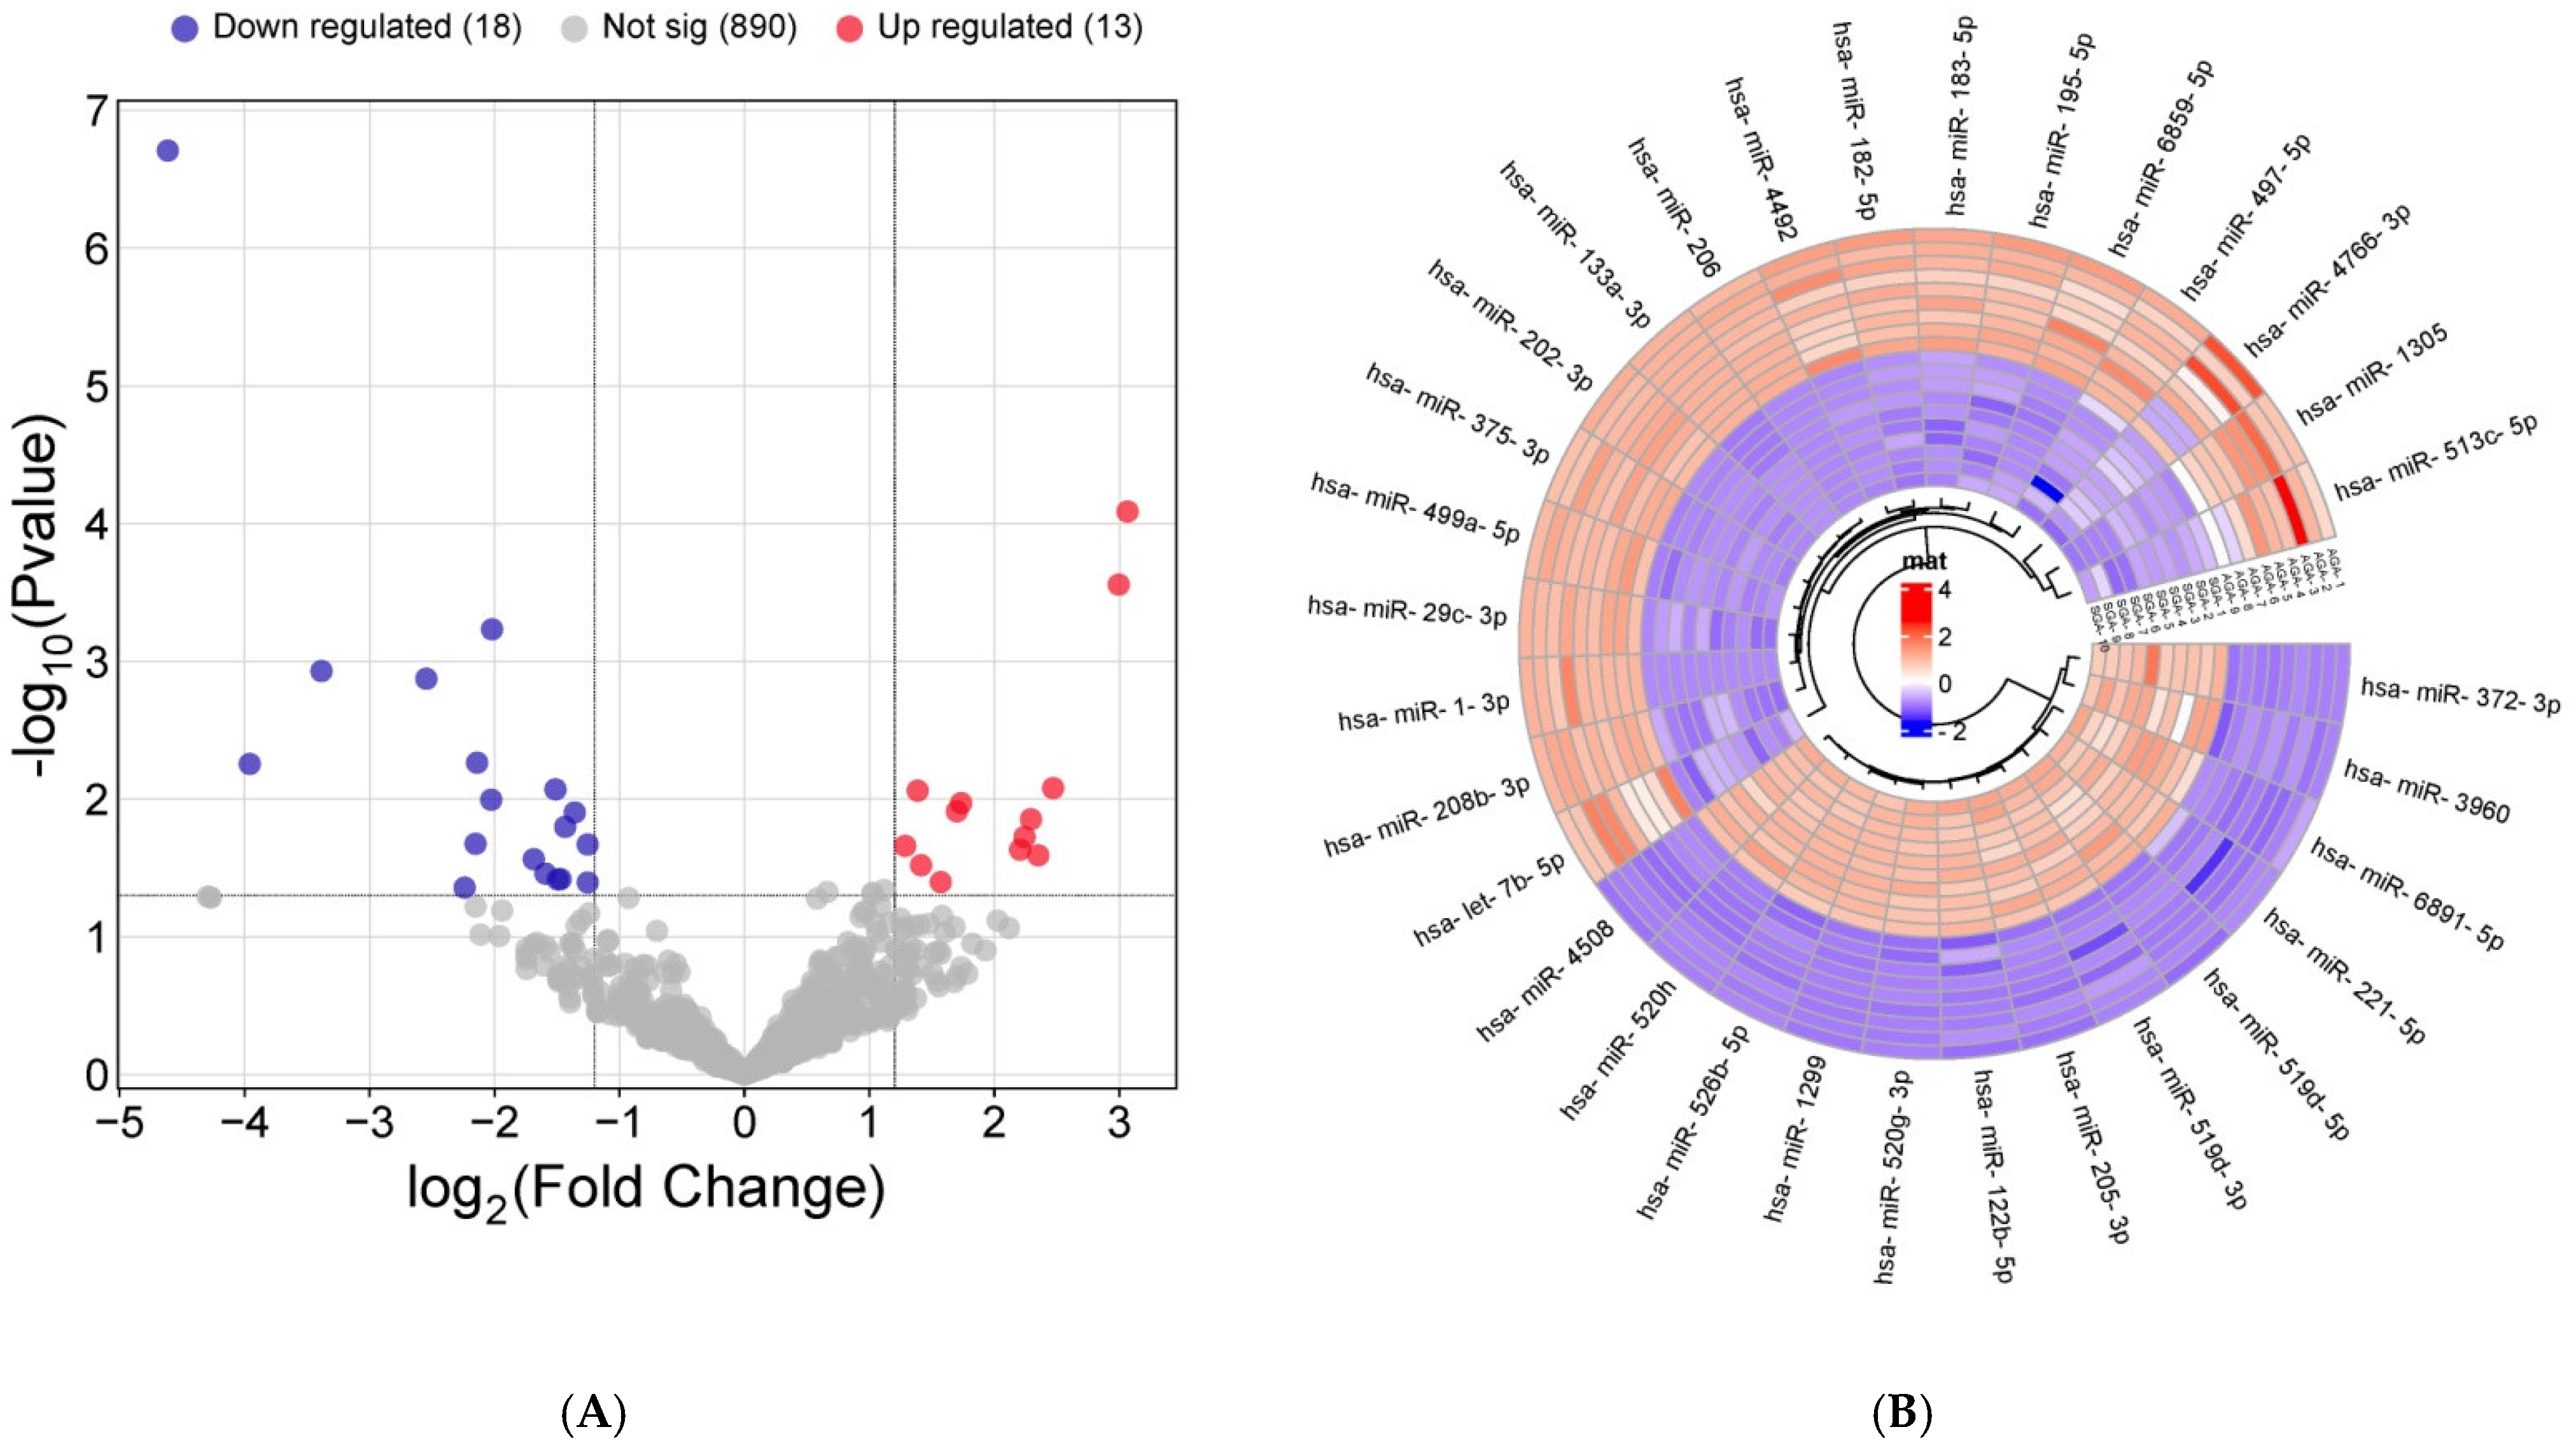
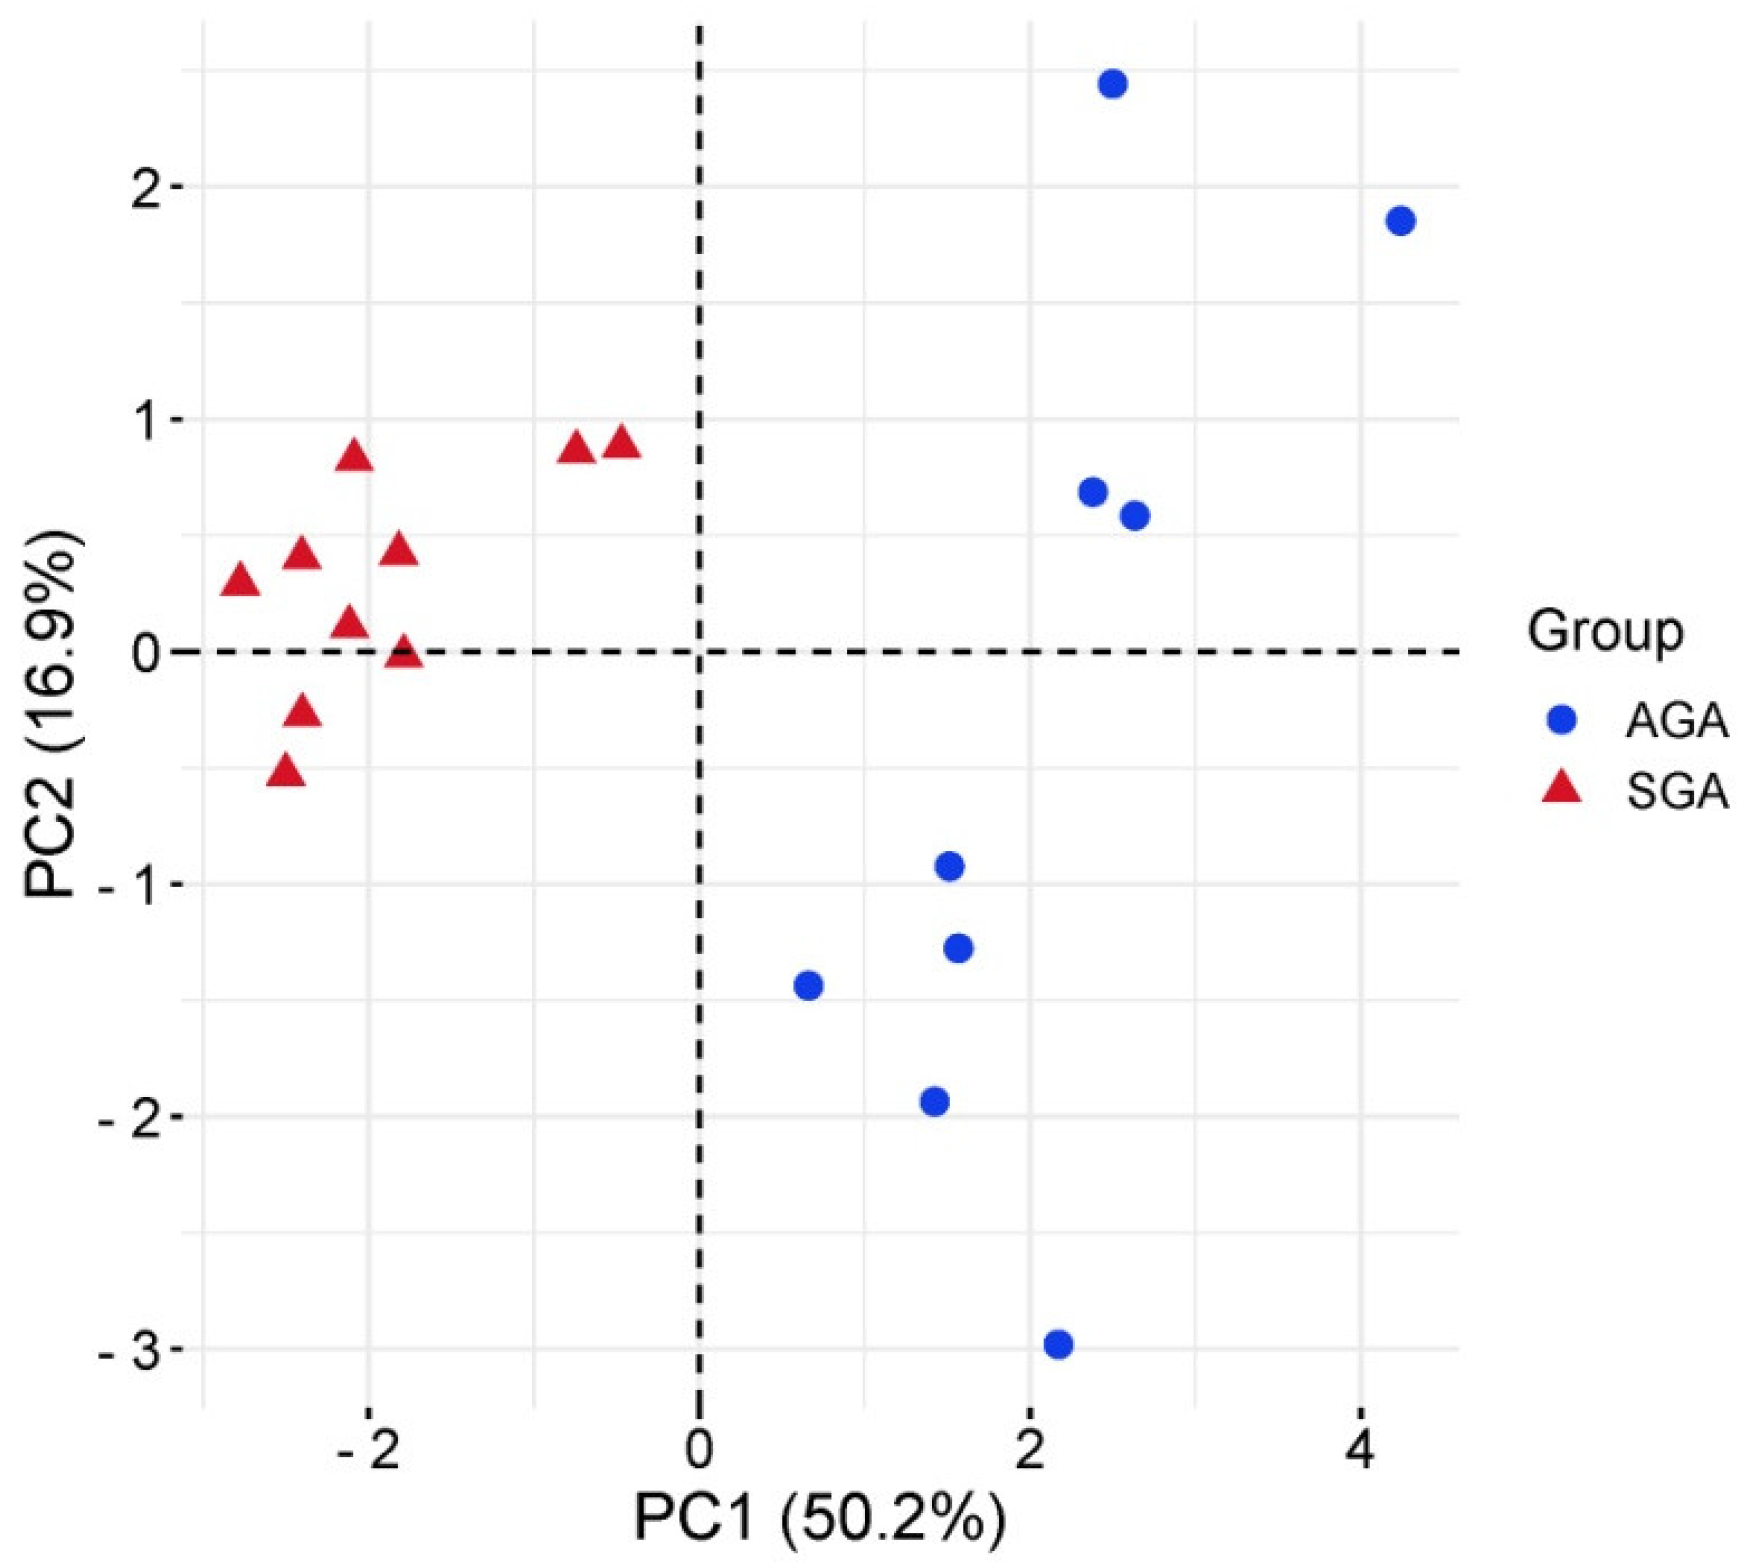
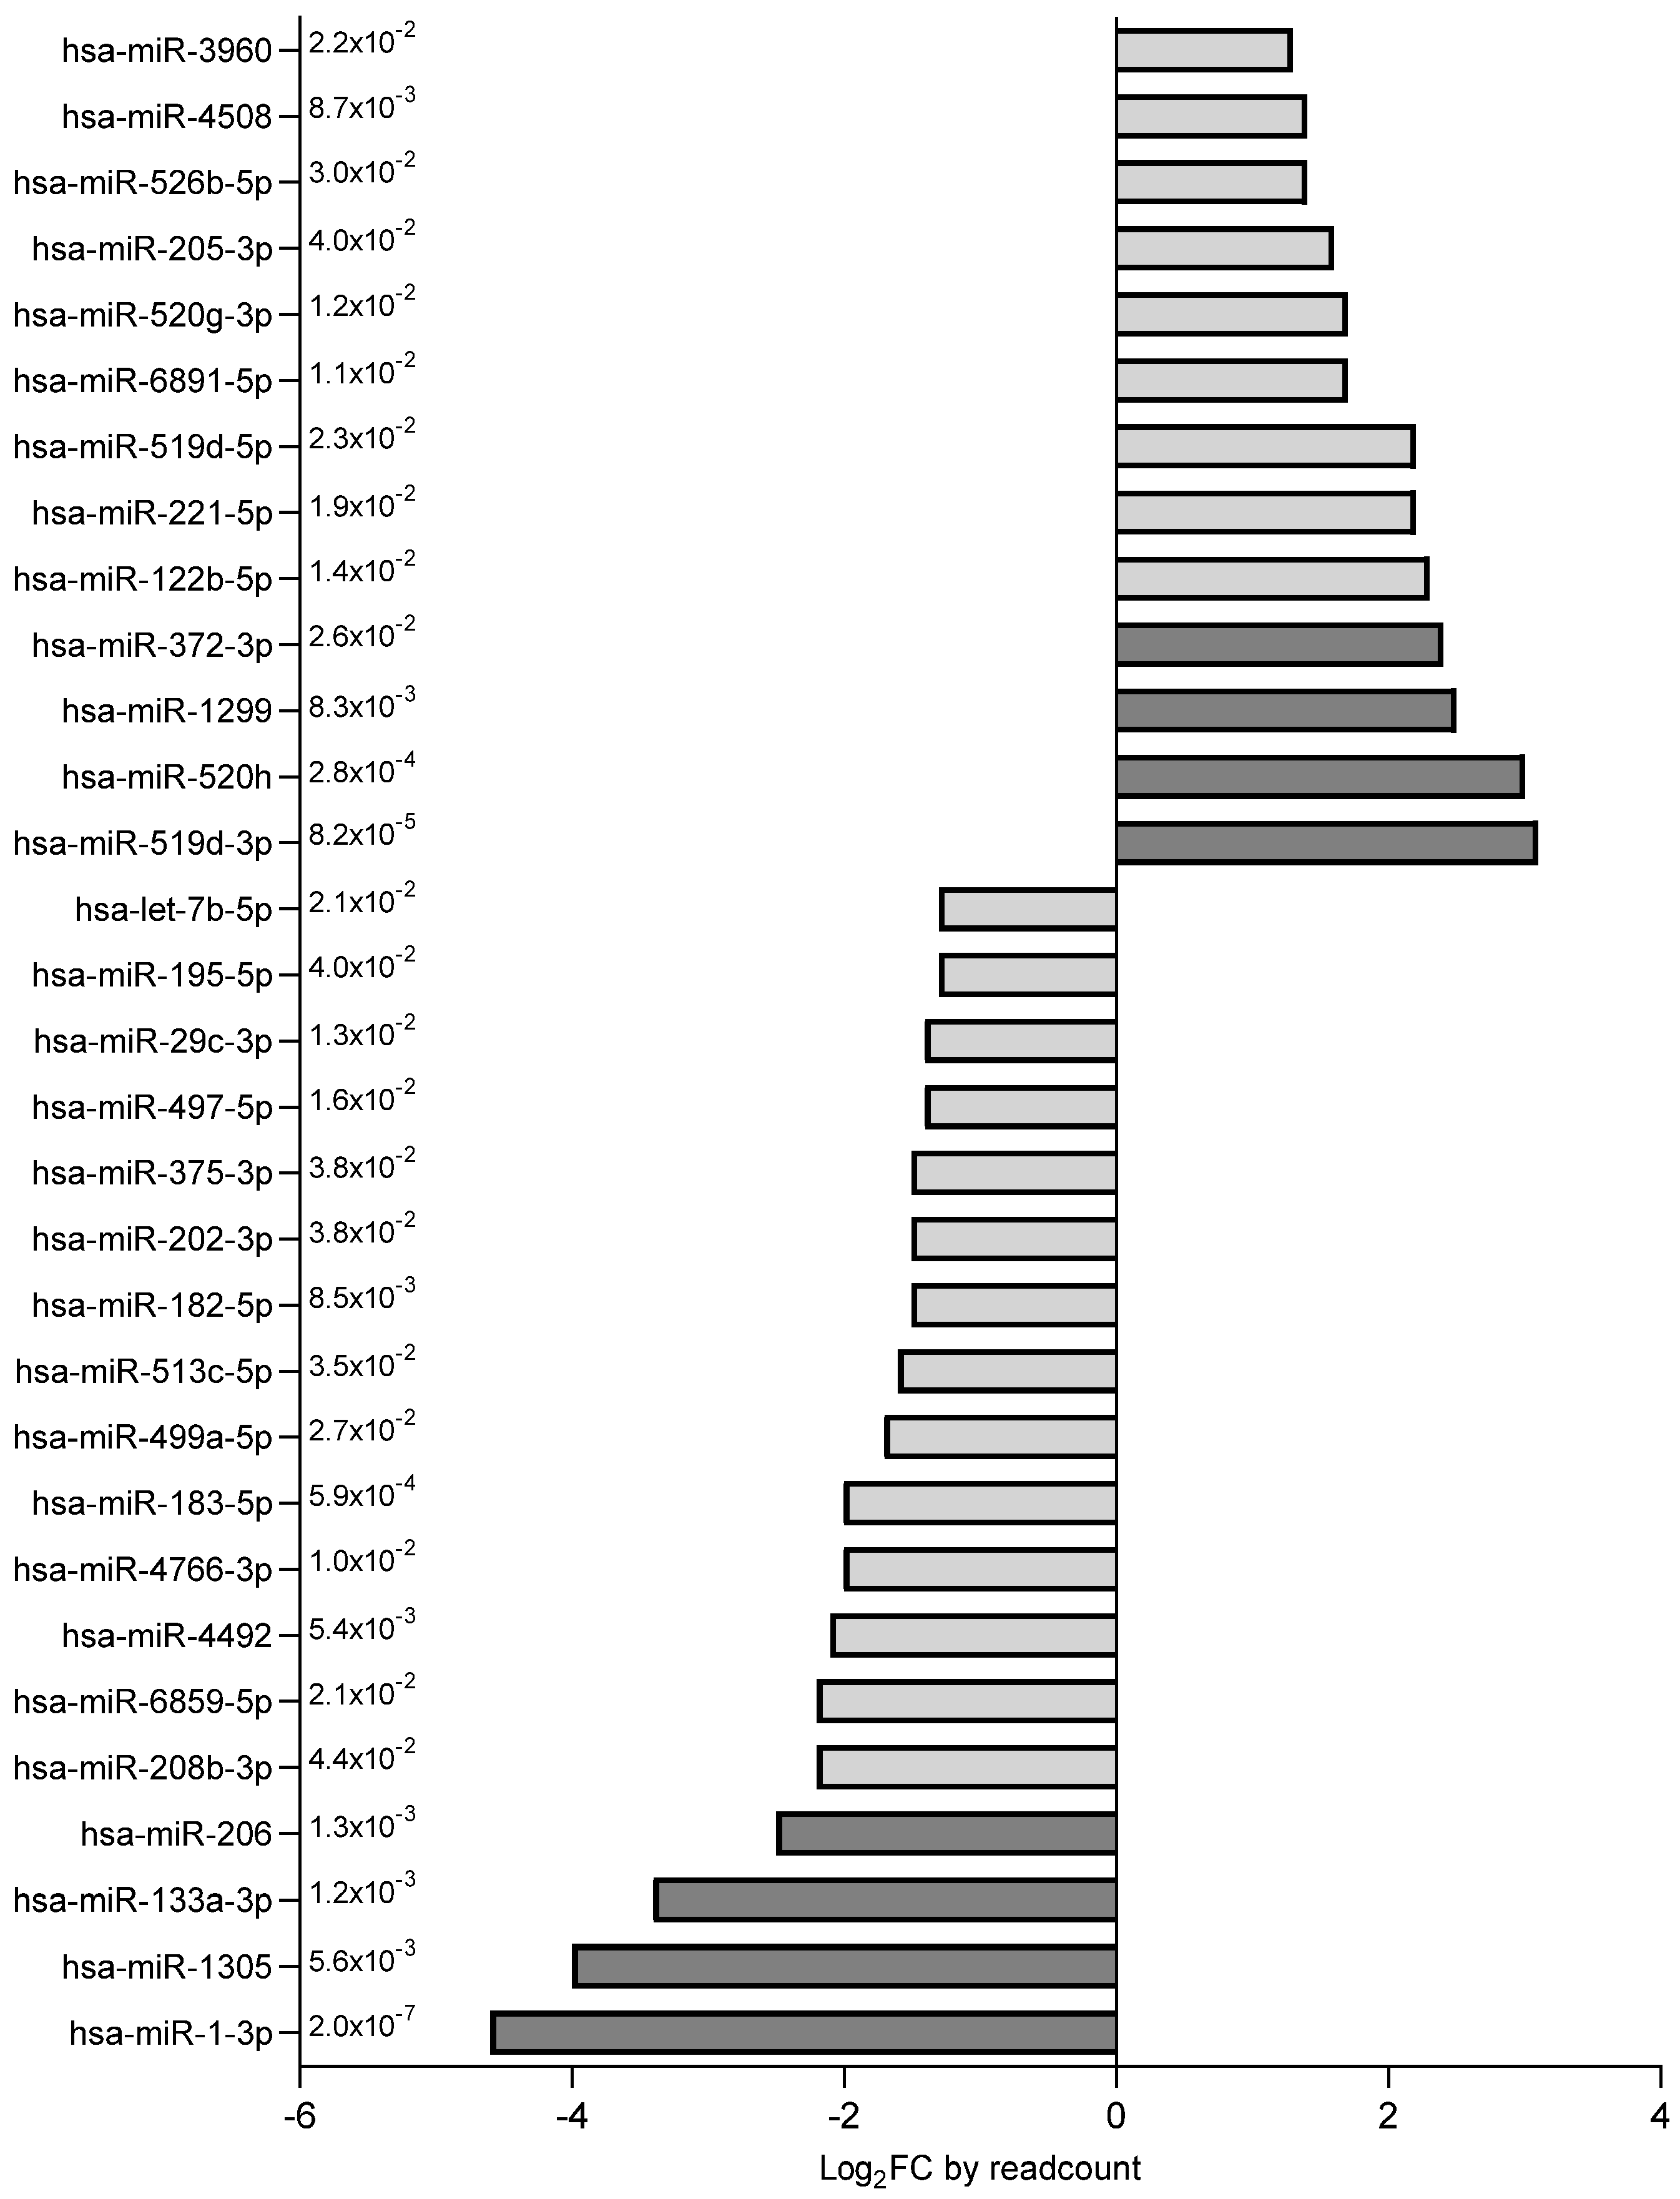
2.2. Exosomal miRNA Expression Profile
2.3. Target Genes of Differentially Expressed miRNAs
2.4. Pathway Analysis of Differentially Expressed miRNAs
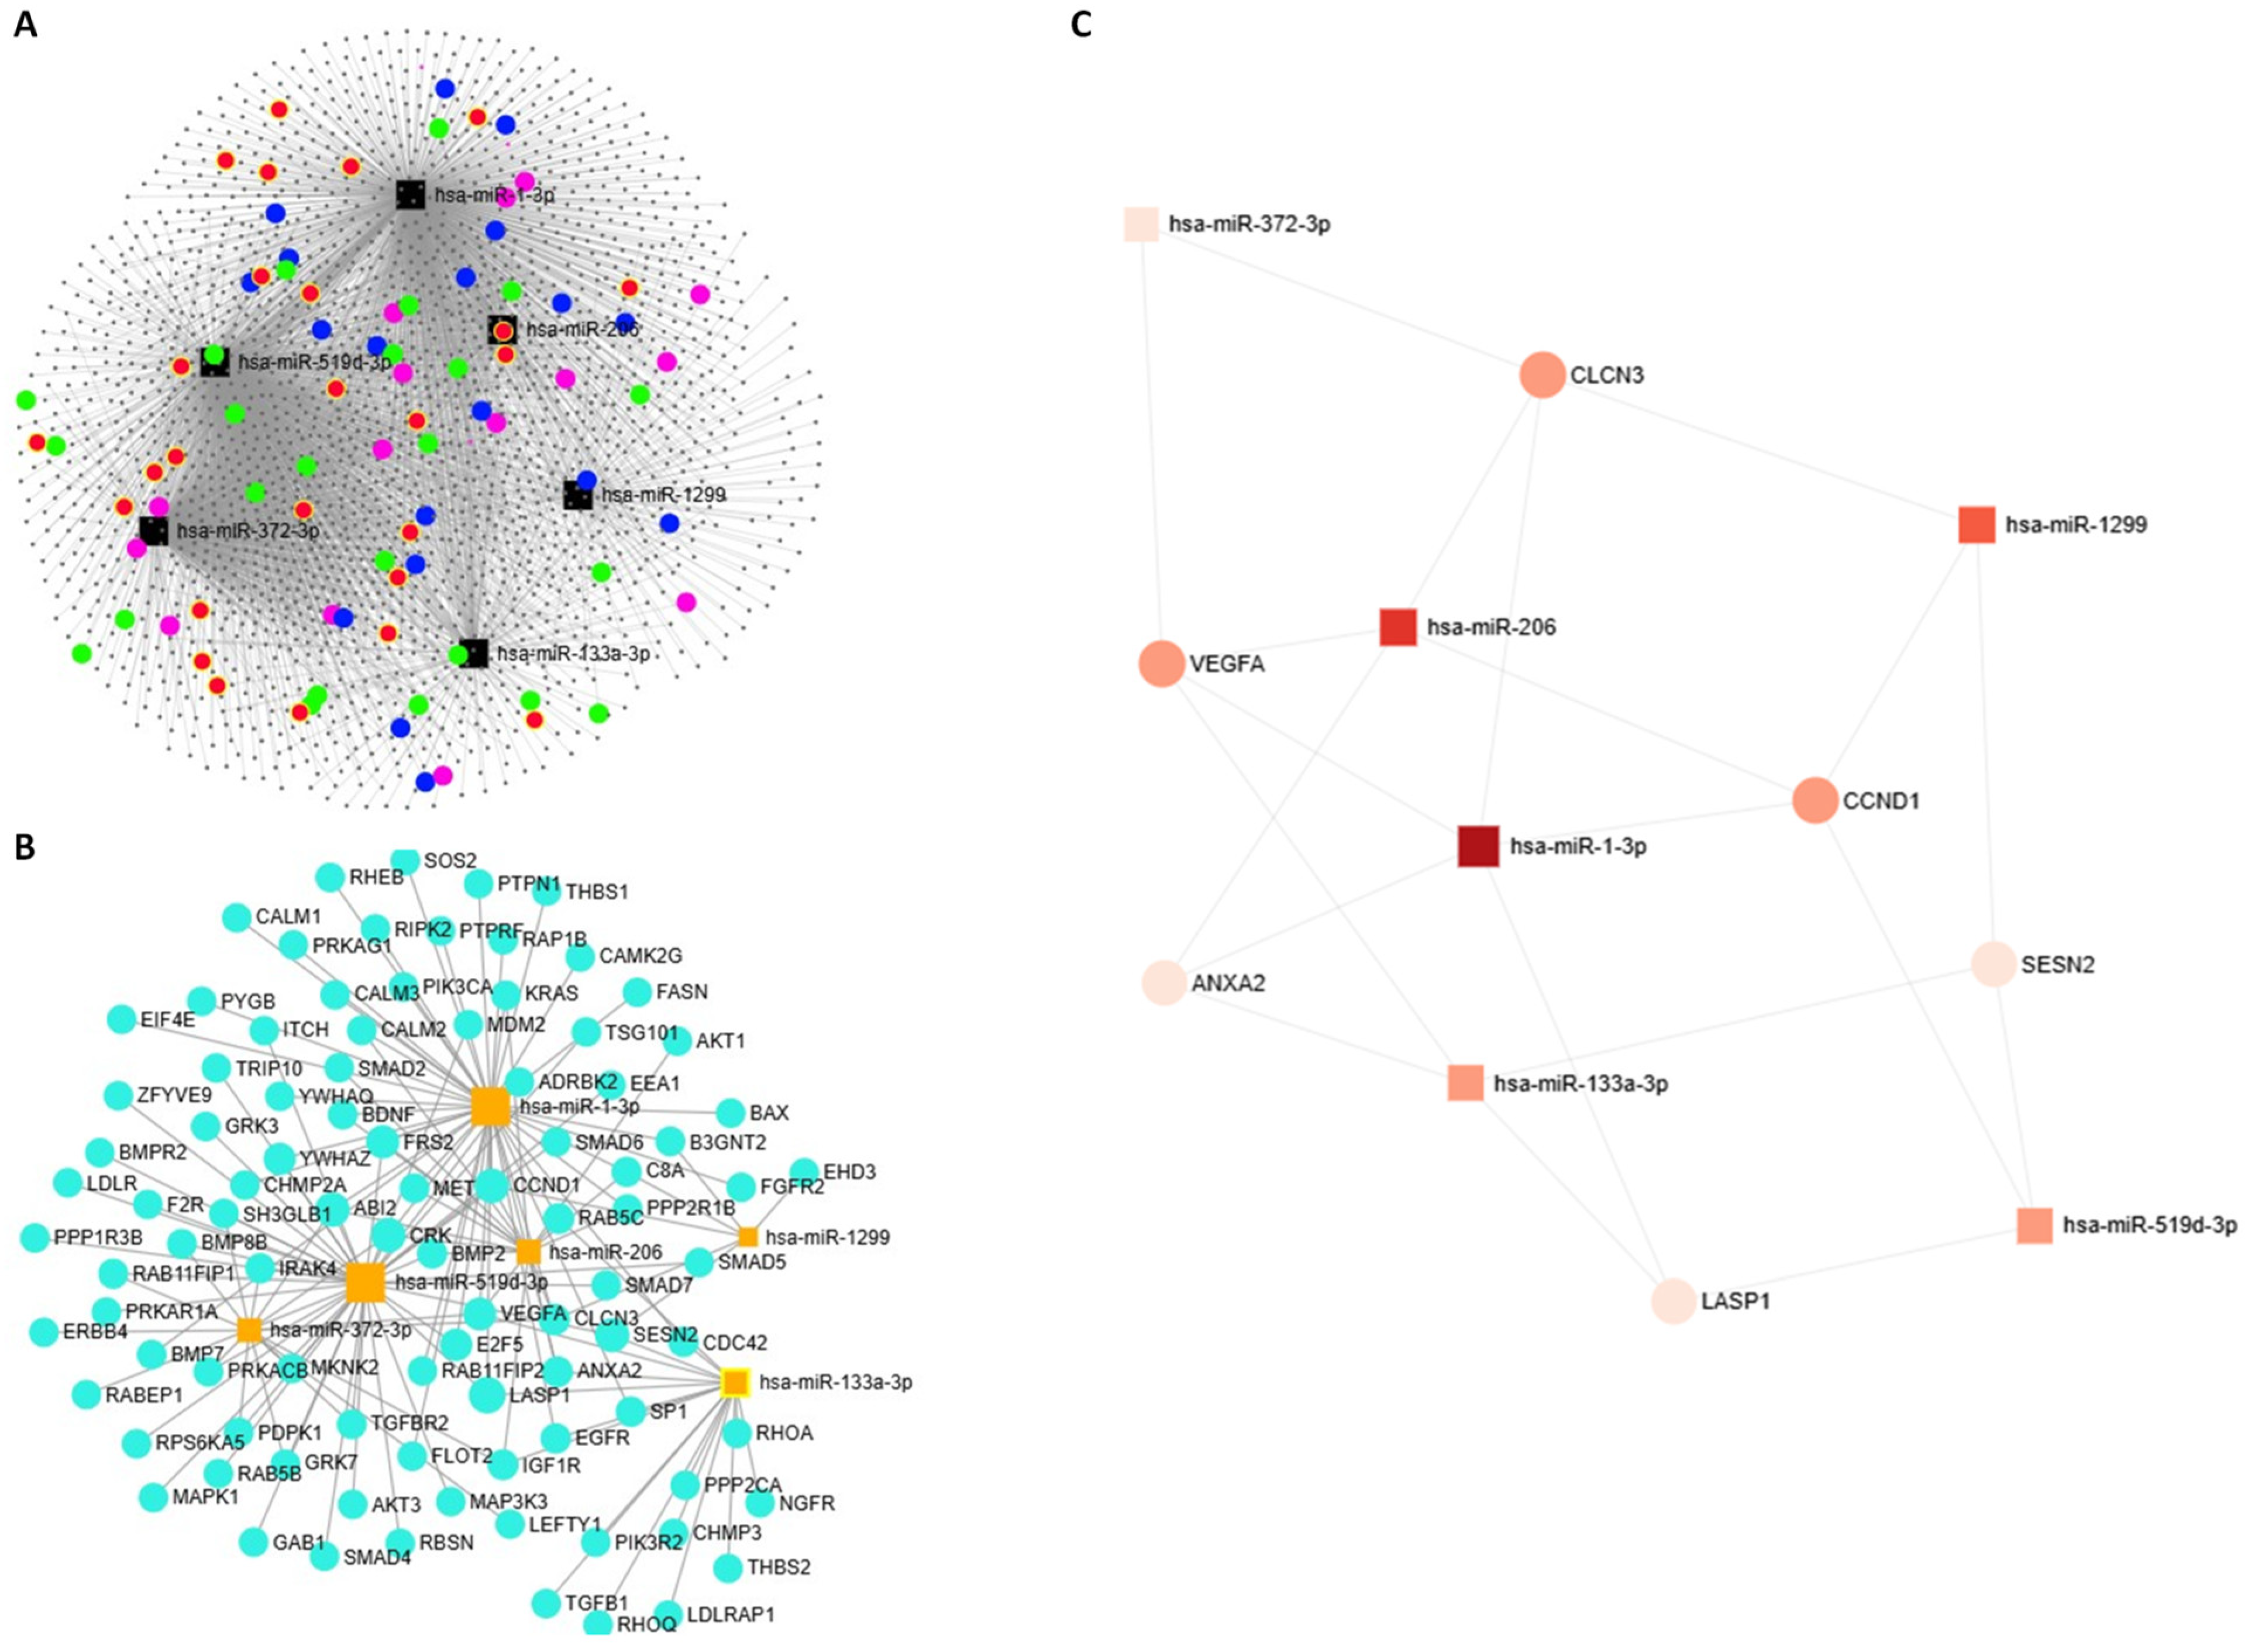
2.5. miRNA–Target Gene Network
2.6. Receiver Operating Characteristics (ROC) Analysis
2.7. Correlation Analysis
3. Discussion
4. Materials and Methods
4.1. Study Population
4.2. Assessments
4.3. RNA Isolation
4.4. Library Preparation and miRNA Sequencing
4.5. Analysis of Sequencing Data
4.6. Enrichment Analysis of Predicted miRNA Target Genes
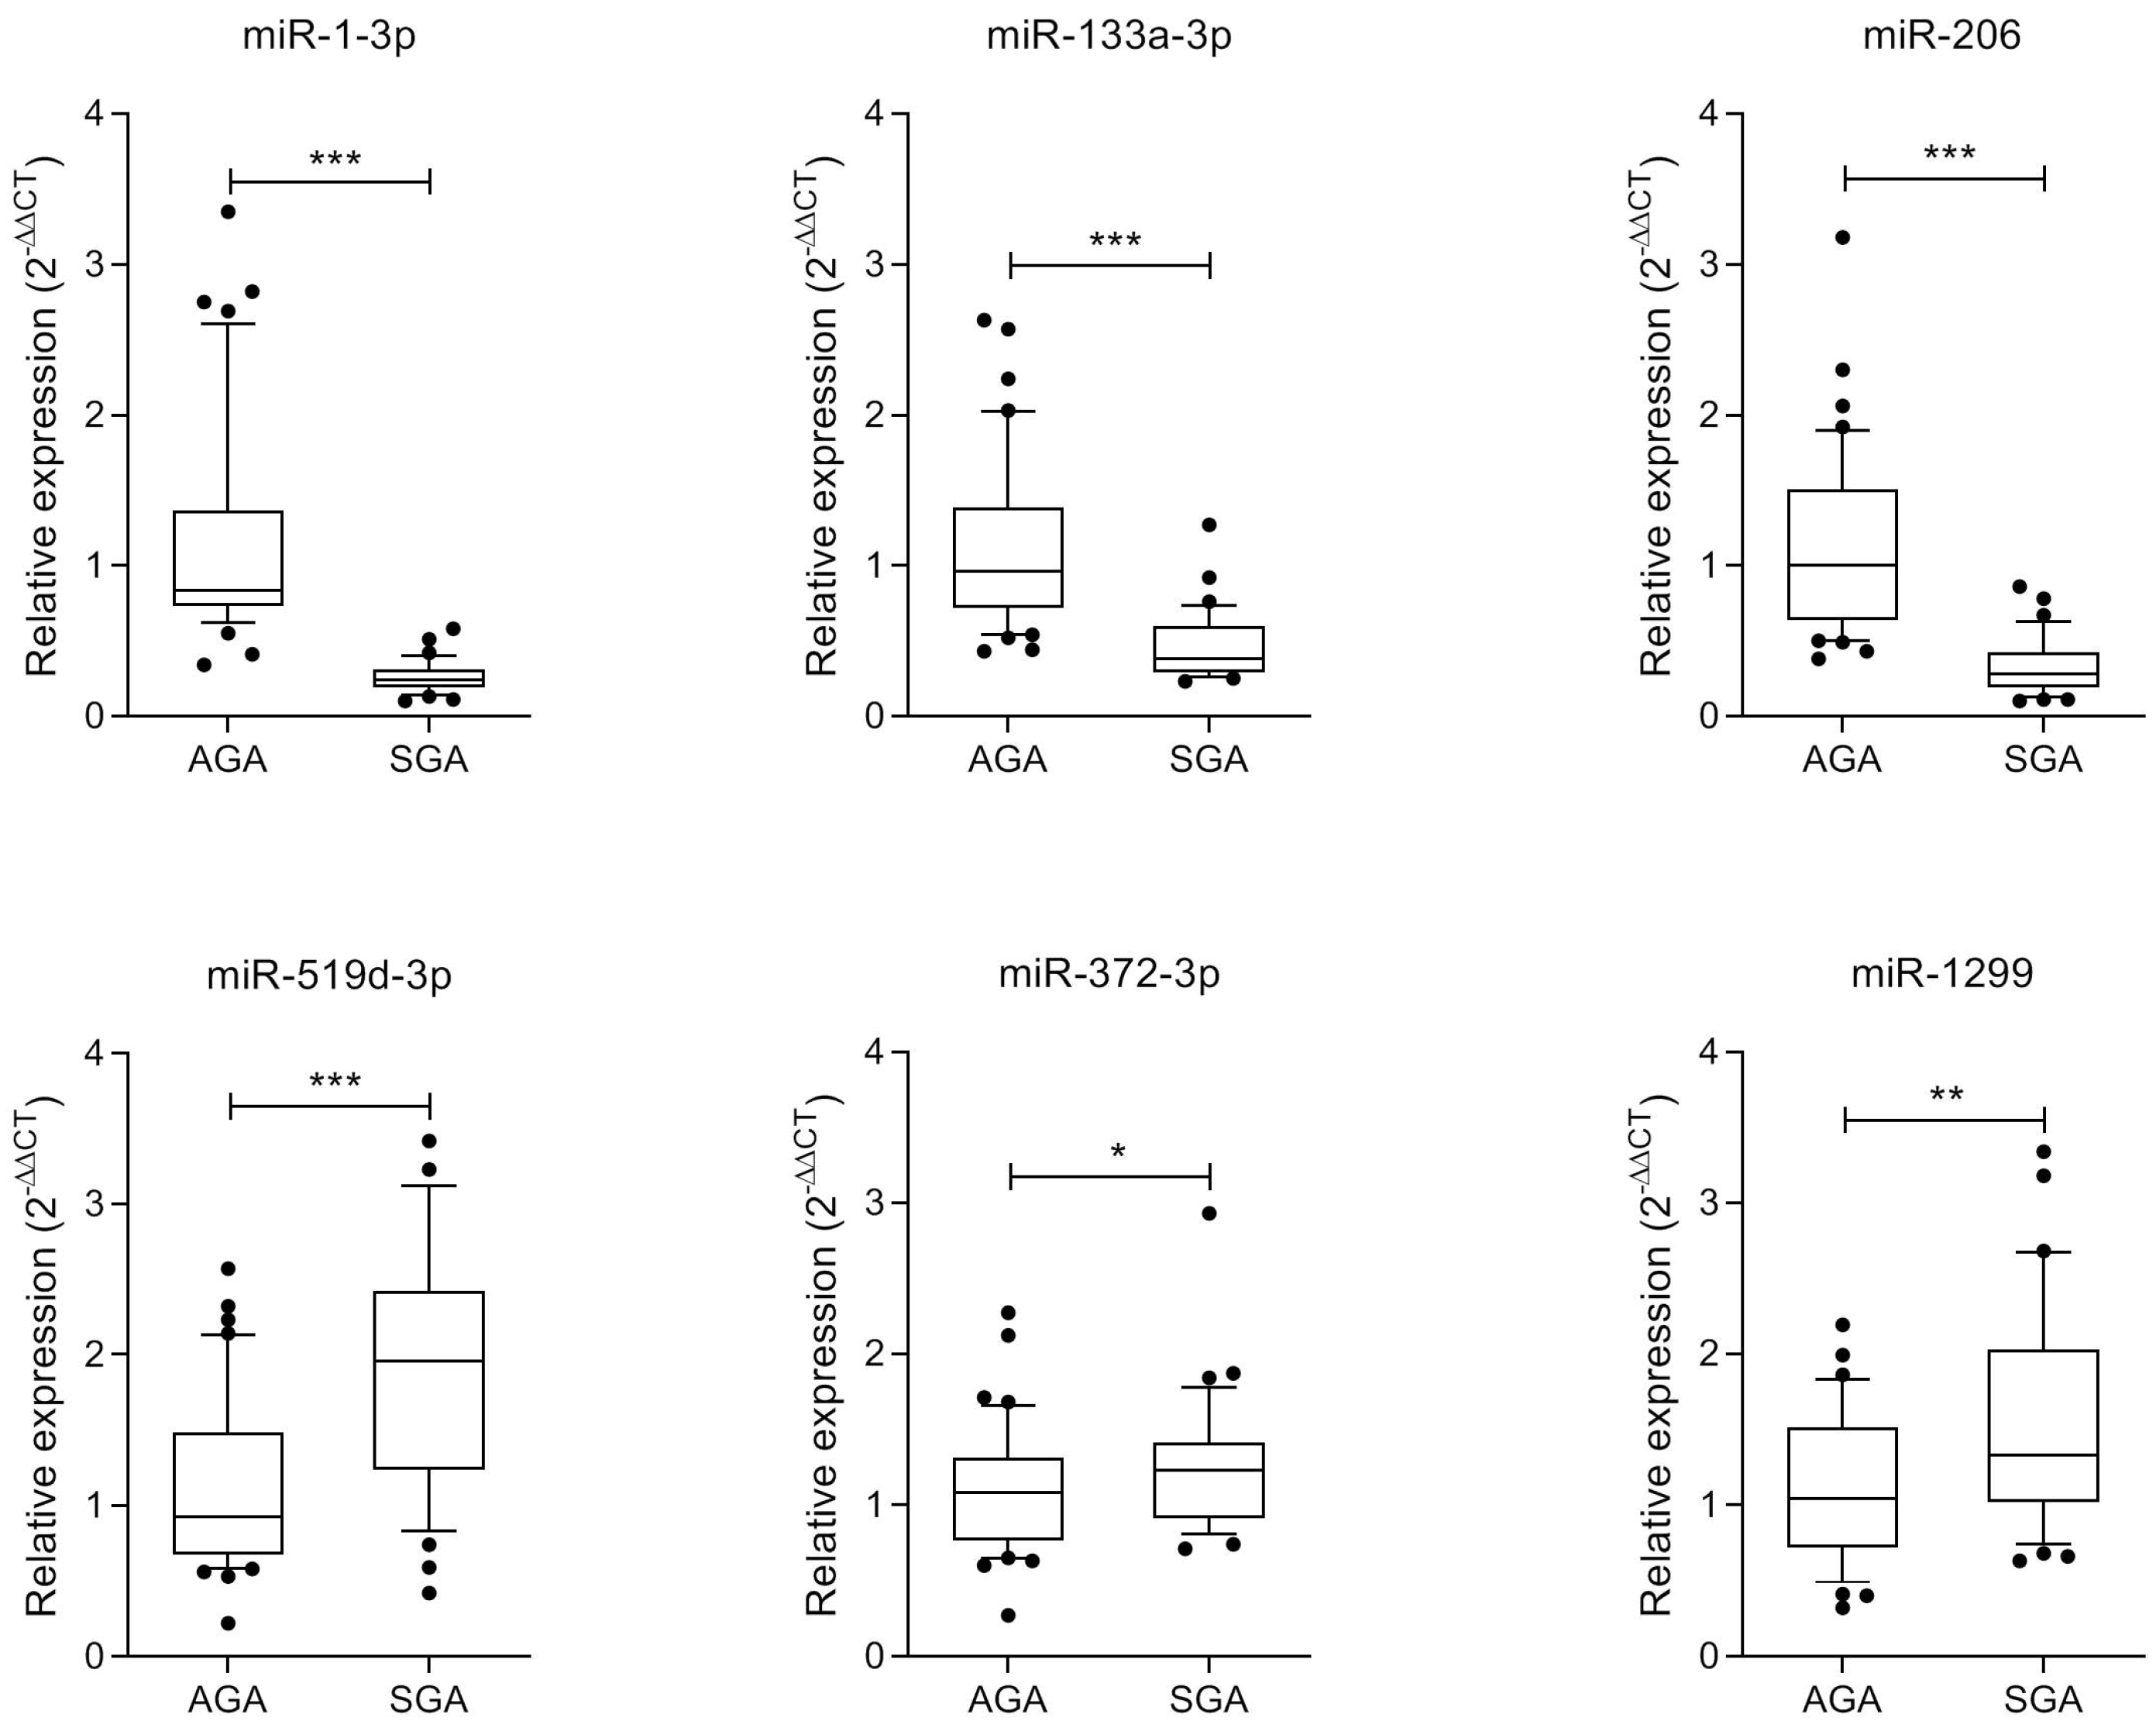
4.7. miRNA Validation by RT-qPCR
4.8. Statistical Analysis and Ethics
Supplementary Materials
Author Contributions
Funding
Institutional Review Board Statement
Informed Consent Statement
Data Availability Statement
Acknowledgments
Conflicts of Interest
References
- Deb, A.; Gupta, S.; Mazumder, P.B. Exosomes: A new horizon in modern medicine. Life Sci. 2021, 264, 118623. [Google Scholar] [CrossRef]
- Isaac, R.; Reis, F.C.G.; Ying, W.; Olefsky, J.M. Exosomes as mediators of intercellular crosstalk in metabolism. Cell Metab. 2021, 33, 1744–1762. [Google Scholar] [CrossRef] [PubMed]
- Filipowicz, W.; Bhattacharyya, S.N.; Sonenberg, N. Mechanisms of post-transcriptional regulation by microRNAs: Are the answers in sight? Nat. Rev. Genet. 2008, 9, 102–114. [Google Scholar] [CrossRef]
- Valadi, H.; Ekström, K.; Bossios, A.; Sjöstrand, M.; Lee, J.J.; Lötvall, J.O. Exosome-mediated transfer of mRNAs and microRNAs is a novel mechanism of genetic exchange between cells. Nat. Cell Biol. 2007, 9, 654–659. [Google Scholar] [CrossRef] [PubMed]
- Thomou, T.; Mori, M.A.; Dreyfuss, J.M.; Konishi, M.; Sakaguchi, M.; Wolfrum, C.; Rao, T.N.; Winnay, J.N.; Garcia-Martin, R.; Grinspoon, S.K.; et al. Adipose-derived circulating miRNAs regulate gene expression in other tissues. Nature 2017, 542, 450–455. [Google Scholar] [CrossRef] [PubMed]
- Garcia-Martin, R.; Wang, G.; Brandão, B.B.; Zanotto, T.M.; Shah, S.; Kumar Patel, S.; Schilling, B.; Kahn, C.R. MicroRNA sequence codes for small extracellular vesicle release and cellular retention. Nature 2022, 601, 446–451. [Google Scholar] [CrossRef]
- Mori, M.A.; Ludwig, R.G.; Garcia-Martin, R.; Brandão, B.B.; Kahn, C.R. Extracellular miRNAs: From Biomarkers to Mediators of Physiology and Disease. Cell Metab. 2019, 30, 656–673. [Google Scholar] [CrossRef]
- Li, C.; Ni, Y.Q.; Xu, H.; Xiang, Q.Y.; Zhao, Y.; Zhan, J.K.; He, J.Y.; Li, S.; Liu, Y.S. Roles and mechanisms of exosomal non-coding RNAs in human health and diseases. Signal Transduct. Target. Ther. 2021, 6, 383. [Google Scholar] [CrossRef]
- Maligianni, I.; Yapijakis, C.; Bacopoulou, F.; Chrousos, G. The Potential Role of Exosomes in Child and Adolescent Obesity. Children 2021, 8, 196. [Google Scholar] [CrossRef]
- Lei, L.M.; Lin, X.; Xu, F.; Shan, S.K.; Guo, B.; Li, F.X.; Zheng, M.H.; Wang, Y.; Xu, Q.S.; Yuan, L.Q. Exosomes and Obesity-Related Insulin Resistance. Front. Cell Dev. Biol. 2021, 9, 651996. [Google Scholar] [CrossRef]
- Satyadev, N.; Rivera, M.I.; Nikolov, N.K.; Fakoya, A.O.J. Exosomes as biomarkers and therapy in type 2 diabetes mellitus and associated complications. Front. Physiol. 2023, 14, 1241096. [Google Scholar] [CrossRef] [PubMed]
- Qi, X.; Lai, J. Exosomal microRNAs and Progression of Nonalcoholic Steatohepatitis (NASH). Int. J. Mol. Sci. 2022, 23, 13501. [Google Scholar] [CrossRef] [PubMed]
- Yi, S.; Cong, Q.; Zhu, Y.; Xu, Q. Mechanisms of Action of Mesenchymal Stem Cells in Metabolic-Associated Fatty Liver Disease. Stem Cells Int. 2023, 2023, 3919002. [Google Scholar] [CrossRef]
- Morales-Prieto, D.M.; Favaro, R.R.; Markert, U.R. Placental miRNAs in feto-maternal communication mediated by extracellular vesicles. Placenta 2020, 102, 27–33. [Google Scholar] [CrossRef] [PubMed]
- Ghafourian, M.; Mahdavi, R.; Akbari Jonoush, Z.; Sadeghi, M.; Ghadiri, N.; Farzaneh, M.; Mousavi Salehi, A. The implications of exosomes in pregnancy: Emerging as new diagnostic markers and therapeutics targets. Cell Commun. Signal. 2022, 20, 51. [Google Scholar] [CrossRef]
- Mericq, V.; Martinez-Aguayo, A.; Uauy, R.; Iñiguez, G.; Van der Steen, M.; Hokken-Koelega, A. Long-term metabolic risk among children born premature or small for gestational age. Nat. Rev. Endocrinol. 2017, 13, 50–62. [Google Scholar] [CrossRef]
- Martín-Calvo, N.; Goni, L.; Tur, J.A.; Martínez, J.A. Low birth weight and small for gestational age are associated with complications of childhood and adolescence obesity: Systematic review and meta-analysis. Obes. Rev. 2022, 23, e13380. [Google Scholar] [CrossRef]
- Goedegebuure, W.J.; Van der Steen, M.; Smeets, C.C.J.; Kerkhof, G.F.; Hokken-Koelega, A.C.S. SGA-born adults with postnatal catch-up have a persistently unfavourable metabolic health profile and increased adiposity at age 32 years. Eur. J. Endocrinol. 2022, 187, 15–26. [Google Scholar] [CrossRef]
- Díaz, M.; Casano, P.; Quesada, T.; López-Bermejo, A.; de Zegher, F.; Villarroya, F.; Ibáñez, L. Circulating exosomes decrease in size and increase in number between birth and age 7: Relations to fetal growth and liver fat. Front. Endocrinol. (Lausanne) 2023, 14, 1257768. [Google Scholar] [CrossRef]
- Díaz, M.; Quesada-López, T.; Villarroya, F.; Casano, P.; López-Bermejo, A.; de Zegher, F.; Ibáñez, L. The Proteome of Exosomes at Birth Predicts Insulin Resistance; Adrenarche and Liver Fat in Childhood. Int. J. Mol. Sci. 2025, 26, 1721. [Google Scholar] [CrossRef]
- Díaz, M.; García, C.; Sebastiani, G.; de Zegher, F.; López-Bermejo, A.; Ibáñez, L. Placental and Cord Blood Methylation of Genes Involved in Energy Homeostasis: Association With Fetal Growth and Neonatal Body Composition. Diabetes 2017, 66, 779–784. [Google Scholar] [CrossRef]
- Rodil-Garcia, P.; Arellanes-Licea, E.D.C.; Montoya-Contreras, A.; Salazar-Olivo, L.A. Analysis of MicroRNA Expression in Newborns with Differential Birth Weight Using Newborn Screening Cards. Int. J. Mol. Sci. 2017, 18, 2552. [Google Scholar] [CrossRef] [PubMed]
- García-Muro, C.; Toledo-Gotor, C.; Pasamón-García, S.; de Pablo-de Las Heras, M.; Esteban-Zubero, E.; Ruiz Del Prado, M.Y.; Domínguez-Garrido, E. miRNAs in umbilical Wharton’s jelly in neonates with different birth weights: A pilot study. Gene 2025, 933, 148984. [Google Scholar] [CrossRef]
- Mas-Parés, B.; Xargay-Torrent, S.; Bonmatí, A.; Lizarraga-Mollinedo, E.; Martínez-Calcerrada, J.M.; Carreras-Badosa, G.; Prats-Puig, A.; de Zegher, F.; Ibáñez, L.; López-Bermejo, A.; et al. Umbilical Cord miRNAs in Small-for-Gestational-Age Children and Association with Catch-up Growth: A Pilot Study. J. Clin. Endocrinol. Metab. 2019, 104, 5285–5298. [Google Scholar] [CrossRef] [PubMed]
- Garcia-Beltran, C.; Carreras-Badosa, G.; Bassols, J.; Malpique, R.; Plou, C.; de Zegher, F.; López-Bermejo, A.; Ibáñez, L. microRNAs in newborns with low birth weight: Relation to birth size and body composition. Pediatr. Res. 2022, 92, 829–837. [Google Scholar] [CrossRef]
- Reithmair, M.; Buschmann, D.; Märte, M.; Kirchner, B.; Hagl, D.; Kaufmann, I.; Pfob, M.; Chouker, A.; Steinlein, O.K.; Pfaffl, M.W.; et al. Cellular and extracellular miRNAs are blood-compartment-specific diagnostic targets in sepsis. J. Cell Mol. Med. 2017, 21, 2403–2411. [Google Scholar] [CrossRef]
- Nik Mohamed Kamal, N.N.S.B.; Shahidan, W.N.S. Non-Exosomal and Exosomal Circulatory MicroRNAs: Which Are More Valid as Biomarkers? Front. Pharmacol. 2020, 10, 1500. [Google Scholar] [CrossRef] [PubMed]
- Kim, K.M.; Abdelmohsen, K.; Mustapic, M.; Kapogiannis, D.; Gorospe, M. RNA in extracellular vesicles. Wiley Interdiscip. Rev. RNA 2017, 8, e1413. [Google Scholar] [CrossRef]
- Townley-Tilson, W.H.; Callis, T.E.; Wang, D. MicroRNAs 1, 133, and 206: Critical factors of skeletal and cardiac muscle development, function, and disease. Int. J. Biochem. Cell Biol. 2010, 42, 1252–1255. [Google Scholar] [CrossRef]
- Merz, K.E.; Thurmond, D.C. Role of Skeletal Muscle in Insulin Resistance and Glucose Uptake. Compr. Physiol. 2020, 10, 785–809. [Google Scholar] [CrossRef]
- Leunissen, R.W.; Kerkhof, G.F.; Stijnen, T.; Hokken-Koelega, A. Timing and tempo of first-year rapid growth in relation to cardiovascular and metabolic risk profile in early adulthood. JAMA 2009, 301, 2234–2242. [Google Scholar] [CrossRef] [PubMed]
- Frias, F.d.T.; de Mendonça, M.; Martins, A.R.; Gindro, A.F.; Cogliati, B.; Curi, R.; Rodrigues, A.C. MyomiRs as Markers of Insulin Resistance and Decreased Myogenesis in Skeletal Muscle of Diet-Induced Obese Mice. Front. Endocrinol. (Lausanne) 2016, 7, 76. [Google Scholar] [CrossRef] [PubMed]
- Sebastiani, G.; Díaz, M.; Bassols, J.; Aragonés, G.; López-Bermejo, A.; de Zegher, F.; Ibáñez, L. The sequence of prenatal growth restraint and post-natal catch-up growth leads to a thicker intima-media and more pre-peritoneal and hepatic fat by age 3–6 years. Pediatr. Obes. 2016, 11, 251–257. [Google Scholar] [CrossRef]
- Kokkinopoulou, I.; Maratou, E.; Mitrou, P.; Boutati, E.; Sideris, D.C.; Fragoulis, E.G.; Christodoulou, M.I. Decreased expression of microRNAs targeting type-2 diabetes susceptibility genes in peripheral blood of patients and predisposed individuals. Endocrine 2019, 66, 226–239. [Google Scholar] [CrossRef] [PubMed]
- Meng, Z.; Li, F.; Wang, B. miR-372-3p is a potential diagnostic factor for diabetic nephropathy and modulates high glucose-induced glomerular endothelial cell dysfunction via targeting fibroblast growth factor-16. Arch. Med. Sci. 2019, 19, 703–716. [Google Scholar] [CrossRef]
- Butt, E.; Howard, C.M.; Raman, D. LASP1 in Cellular Signaling and Gene Expression: More than Just a Cytoskeletal Regulator. Cells 2022, 11, 3817. [Google Scholar] [CrossRef]
- Jabs, N.; Franklin, I.; Brenner, M.B.; Gromada, J.; Ferrara, N.; Wollheim, C.B.; Lammert, E. Reduced insulin secretion and content in VEGF-a deficient mouse pancreatic islets. Exp. Clin. Endocrinol. Diabetes 2008, 116, S46–S49. [Google Scholar] [CrossRef]
- Sellami, N.; Lamine, L.B.; Turki, A.; Sarray, S.; Jailani, M.; Al-Ansari, A.K.; Ghorbel, M.; Mahjoub, T.; Almawi, W.Y. Association of VEGFA variants with altered VEGF secretion and type 2 diabetes: A case-control study. Cytokine 2018, 106, 29–34. [Google Scholar] [CrossRef]
- Feng, Y.; Li, W.; Wang, Z.; Zhang, R.; Li, Y.; Zang, L.; Wang, P.; Li, Z.; Dong, Y. The p-STAT3/ANXA2 axis promotes caspase-1-mediated hepatocyte pyroptosis in non-alcoholic steatohepatitis. J. Transl. Med. 2022, 20, 497. [Google Scholar] [CrossRef]
- Dong, X.C. The potential of sestrins as therapeutic targets for diabetes. Expert Opin. Ther. Targets 2015, 19, 1011–1015. [Google Scholar] [CrossRef]
- Weale, C.J.; Matshazi, D.M.; Davids, S.F.G.; Raghubeer, S.; Erasmus, R.T.; Kengne, A.P.; Davison, G.M.; Matsha, T.E. MicroRNAs-1299; -126-3p and -30e-3p as Potential Diagnostic Biomarkers for Prediabetes. Diagnostics 2021, 11, 949. [Google Scholar] [CrossRef] [PubMed]
- Chen, X.; Tao, X.; Wang, M.; Cannon, R.D.; Chen, B.; Yu, X.; Qi, H.; Saffery, R.; Baker, P.N.; Zhou, X.; et al. Circulating extracellular vesicle-derived miR-1299 disrupts hepatic glucose homeostasis by targeting the STAT3/FAM3A axis in gestational diabetes mellitus. J. Nanobiotechnol. 2024, 22, 509. [Google Scholar] [CrossRef] [PubMed]
- Bhalla, K.; Liu, W.J.; Thompson, K.; Anders, L.; Devarakonda, S.; Dewi, R.; Buckley, S.; Hwang, B.J.; Polster, B.; Dorsey, S.G.; et al. Cyclin D1 represses gluconeogenesis via inhibition of the transcriptional coactivator PGC1α. Diabetes 2014, 63, 3266–3278. [Google Scholar] [CrossRef]
- Lee, Y.; Dominy, J.E.; Choi, Y.J.; Jurczak, M.; Tolliday, N.; Camporez, J.P.; Chim, H.; Lim, J.H.; Ruan, H.B.; Yang, X.; et al. Cyclin D1-Cdk4 controls glucose metabolism independently of cell cycle progression. Nature 2014, 510, 547–551. [Google Scholar] [CrossRef]
- Cauzzo, C.; Chiavaroli, V.; Di Valerio, S.; Chiarelli, F. Birth size; growth trajectory and later cardio-metabolic risk. Front. Endocrinol. (Lausanne) 2023, 14, 1187261. [Google Scholar] [CrossRef]
- Li, M.; Chen, X.; Chen, L.; Chen, K.; Zhou, J.; Song, J. MiR-1-3p that correlates with left ventricular function of HCM can serve as a potential target and differentiate HCM from DCM. J. Transl. Med. 2018, 16, 161. [Google Scholar] [CrossRef]
- Martinelli, R.; Nardelli, C.; Pilone, V.; Buonomo, T.; Liguori, R.; Castanò, I.; Buono, P.; Masone, S.; Persico, G.; Forestieri, P.; et al. miR-519d overexpression is associated with human obesity. Obesity 2010, 18, 2170–2176. [Google Scholar] [CrossRef]
- Wu, H.; Zhang, T.; Pan, F.; Steer, C.J.; Li, Z.; Chen, X.; Song, G. MicroRNA-206 prevents hepatosteatosis and hyperglycemia by facilitating insulin signaling and impairing lipogenesis. J. Hepatol. 2017, 66, 816–824. [Google Scholar] [CrossRef]
- Gerhard, G.S.; Hanson, A.; Wilhelmsen, D.; Piras, I.S.; Still, C.D.; Chu, X.; Petrick, A.T.; DiStefano, J.K. AEBP1 expression increases with severity of fibrosis in NASH and is regulated by glucose; palmitate; and miR-372-3p. PLoS ONE 2019, 14, e0219764. [Google Scholar] [CrossRef]
- Jiang, F.; Chen, Q.; Wang, W.; Ling, Y.; Yan, Y.; Xia, P. Hepatocyte-derived extracellular vesicles promote endothelial inflammation and atherogenesis via microRNA-1. J. Hepatol. 2020, 72, 156–166. [Google Scholar] [CrossRef]
- Petersen, M.C.; Shulman, G.I. Mechanisms of Insulin Action and Insulin Resistance. Physiol. Rev. 2018, 98, 2133–2223. [Google Scholar] [CrossRef]
- Aouadi, M.; Laurent, K.; Prot, M.; Le Marchand-Brustel, Y.; Binétruy, B.; Bost, F. Inhibition of p38MAPK increases adipogenesis from embryonic to adult stages. Diabetes 2006, 55, 281–289. [Google Scholar] [CrossRef]
- Kaneko, K.; Xu, P.; Cordonier, E.L.; Chen, S.S.; Ng, A.; Xu, Y.; Morozov, A.; Fukuda, M. Neuronal Rap1 Regulates Energy Balance; Glucose Homeostasis; and Leptin Actions. Cell Rep. 2016, 16, 3003–3015. [Google Scholar] [CrossRef]
- Rios, M. Neurotrophins and the regulation of energy balance and body weight. Handb. Exp. Pharmacol. 2014, 220, 283–307. [Google Scholar] [PubMed]
- Yadav, H.; Quijano, C.; Kamaraju, A.K.; Gavrilova, O.; Malek, R.; Chen, W.; Zerfas, P.; Zhigang, D.; Wright, E.C.; Stuelten, C.; et al. Protection from obesity and diabetes by blockade of TGF-β/Smad3 signaling. Cell Metab. 2011, 14, 67–79. [Google Scholar] [CrossRef]
- Sheng, J.; Wang, L.; Tang, P.M.; Wang, H.L.; Li, J.C.; Xu, B.H.; Xue, V.W.; Tan, R.Z.; Jin, N.; Chan, T.F.; et al. Smad3 deficiency promotes beta cell proliferation and function in db/db mice via restoring Pax6 expression. Theranostics 2021, 11, 2845–2859. [Google Scholar] [CrossRef] [PubMed]
- Yoshie, M.; Ohishi, K.; Ishikawa, G.; Tsuru, A.; Kusama, K.; Azumi, M.; Tamura, K. Small GTP-binding protein Rap1 mediates EGF and HB-EGF signaling and modulates EGF receptor expression in HTR-8/SVneo extravillous trophoblast cells. Reprod. Med. Biol. 2023, 22, e12537. [Google Scholar] [CrossRef] [PubMed]
- Haider, S.; Lackner, A.I.; Dietrich, B.; Kunihs, V.; Haslinger, P.; Meinhardt, G.; Maxian, T.; Saleh, L.; Fiala, C.; Pollheimer, J.; et al. Transforming growth factor-β signaling governs the differentiation program of extravillous trophoblasts in the developing human placenta. Proc. Natl. Acad. Sci. USA 2022, 119, e2120667119. [Google Scholar] [CrossRef]
- Kaneko, K.; Lin, H.Y.; Fu, Y.; Saha, P.K.; De la Puente-Gomez, A.B.; Xu, Y.; Ohinata, K.; Chen, P.; Morozov, A.; Fukuda, M. Rap1 in the VMH regulates glucose homeostasis. JCI Insight 2021, 6, e142545. [Google Scholar] [CrossRef]
- Gurung, S.; Perocheau, D.; Touramanidou, L.; Baruteau, J. The exosome journey: From biogenesis to uptake and intracellular signalling. Cell Commun. Signal 2021, 19, 47. [Google Scholar] [CrossRef]
- de Zegher, F.; Sebastiani, G.; Diaz, M.; Sánchez-Infantes, D.; Lopez-Bermejo, A.; Ibáñez, L. Body composition and circulating high-molecular-weight adiponectin and IGF-I in infants born small for gestational age: Breast- versus formula-feeding. Diabetes 2012, 61, 1969–1973. [Google Scholar] [CrossRef] [PubMed]
- Diaz, M.; Garde, E.; Lopez-Bermejo, A.; de Zegher, F.; Ibañez, L. Differential DNA methylation profile in infants born small-for-gestational-age: Association with markers of adiposity and insulin resistance from birth to age 24 months. BMJ Open Diabetes Res. Care 2020, 8, e001402. [Google Scholar] [CrossRef] [PubMed]
- Clayton, P.E.; Cianfarani, S.; Czernichow, P.; Johannsson, G.; Rapaport, R.; Rogol, A. Management of the child born small for gestational age through to adulthood: A consensus statement of the International Societies of Pediatric Endocrinology and the Growth Hormone Research Society. J. Clin. Endocrinol. Metab. 2007, 92, 804–810. [Google Scholar] [CrossRef] [PubMed]
- Díaz, M.; Campderrós, L.; Guimaraes, M.P.; López-Bermejo, A.; de Zegher, F.; Villarroya, F.; Ibáñez, L. Circulating growth-and-differentiation factor-15 in early life: Relation to prenatal and postnatal growth and adiposity measurements. Pediatr. Res. 2020, 87, 897–902. [Google Scholar] [CrossRef]
- Robinson, M.D.; McCarthy, D.J.; Smyth, G.K. edgeR: A Bioconductor package for differential expression analysis of digital gene expression data. Bioinformatics 2010, 26, 139–140. [Google Scholar] [CrossRef]
- Gouin, K.; Peck, K.; Antes, T.; Johnson, J.L.; Li, C.; Vaturi, S.D.; Middleton, R.; de Couto, G.; Walravens, A.S.; Rodriguez-Borlado, L.; et al. A comprehensive method for identification of suitable reference genes in extracellular vesicles. J. Extracell. Vesicles 2017, 6, 1347019. [Google Scholar] [CrossRef]


| At Birth | 4 Months | Δ 0–4 Months | 12 Months | Δ 0–12 Months | ||||||
|---|---|---|---|---|---|---|---|---|---|---|
| AGA | SGA | AGA | SGA | AGA | SGA | AGA | SGA | AGA | SGA | |
| Auxology | ||||||||||
| Gestational age (wk) | 39.7 ± 0.2 | 38.5 ± 0.3 ‡ | -- | -- | -- | -- | -- | -- | -- | -- |
| Weight (kg) | 3.3 ± 0.1 | 2.2 ± 0.1 ‡ | 6.6 ± 0.1 | 6.1 ± 0.1 * | 3.3 ± 0.1 | 3.9 ± 0.1 § | 9.8 ± 0.3 | 9.3 ± 0.3 | 6.5 ± 0.3 | 7.1 ± 0.2 |
| Weight Z-score | −0.2 ± 0.1 | −2.4 ± 0.1 ‡ | −0.3 ± 0.2 | −1.2 ± 0.2 § | −0.3 ± 0.2 | −1.2 ± 0.2 § | −0.1 ± 0.2 | −0.5 ± 0.2 | 0.1 ± 0.2 | 1.9 ± 0.2 ‡ |
| Length (cm) | 49.8 ± 0.3 | 45.8 ± 0.3 ‡ | 62.7 ± 0.4 | 60.5 ± 0.5 § | 12.9 ± 0.5 | 14.7 ± 0.5 * | 74.8 ± 0.7 | 73.4 ± 0.5 | 25.0 ± 0.8 | 27.6 ± 0.5 § |
| Length SDS | −0.1 ± 0.2 | −1.7 ± 0.1 ‡ | −0.4 ± 0.2 | −1.3 ± 0.2 § | −0.3 ± 0.3 | 0.4 ± 0.2 * | 0.0 ± 0.3 | −0.5 ± 0.2 | 0.1 ± 0.4 | 1.2 ± 0.2 * |
| BMI (kg/m2) | 13.2 ± 0.1 | 10.6 ± 0.1 ‡ | 17.1 ± 0.4 | 16.6 ± 0.2 | 3.9 ± 0.3 | 6.0 ± 0.2 ‡ | 17.5 ± 0.4 | 17.2 ± 0.3 | 4.3 ± 0.4 | 6.6 ± 0.3 ‡ |
| BMI Z-score (kg/m2) | 0.5 ± 0.1 | −1.7 ± 0.1 ‡ | 0.2 ± 0.2 | −0.2 ± 0.2 | −0.3 ± 0.2 | 1.5 ± 0.2 ‡ | 0.0 ± 0.3 | −0.2 ± 0.2 | −0.5 ± 0.3 | 1.5 ± 0.3 ‡ |
| Sex (% female) | 48 | 51 | -- | -- | -- | -- | -- | -- | -- | -- |
| Delivery (% C-section) | 16 | 40 * | -- | -- | -- | -- | -- | -- | -- | -- |
| Smoking mothers (%) | 17.1 | 45.4 * | -- | -- | -- | -- | -- | -- | -- | -- |
| Endocrine–metabolic variables | ||||||||||
| Glucose (mmol/L) | 4.7 ± 0.2 | 4.3 ± 0.2 | 5.0 ± 0.1 | 4.9 ± 0.1 | 0.3 ± 0.1 | 0.6 ± 0.2 | 4.7 ± 0.1 | 4.6 ± 0.1 | 0.0 ± 0.2 | 0.3 ± 0.2 |
| Insulin (pmol/L) | 35 ± 7 | 28 ± 5 | 38 ± 6 | 43 ± 6 | 3 ± 9 | 15 ± 9 | 25 ± 5 | 29 ± 5 | −10 ± 10 | 1 ± 8 |
| HOMA-IR | 1.2 ± 0.3 | 0.8 ± 0.2 | 1.3 ± 0.2 | 1.4 ± 0.2 | 0.1 ± 0.3 | 0.6 ± 0.3 | 0.8 ± 0.2 | 0.9 ± 0.2 | −0.3 ± 0.4 | 0.1 ± 0.2 |
| IGF-1 (nmol/L) | 7.2 ± 0.5 | 4.7 ± 0.3 ‡ | 5.5 ± 0.4 | 9.9 ± 1.3 ‡ | −1.7 ± 0.6 | 5.2 ± 0.1 ‡ | 7.6 ± 0.7 | 14.6 ± 1.4 ‡ | 0.4 ± 0.9 | 9.9 ± 2.0 ‡ |
| HMW-adip (mg/L) | 32.3 ± 1.8 | 22.4 ± 2.0 ‡ | 29.8 ± 2.2 | 38.3 ± 3.2 * | −2.5 ± 2.6 | 15.9 ± 3.6 ‡ | 17.9 ± 1.5 | 17.3 ± 1.7 | −14.0 ± 2.5 | −5.1 ± 2.9 § |
| Body Composition (DXA) | ||||||||||
| Fat mass (kg) | 0.7 ± 0.1 | 0.4 ± 0.1 ‡ | 2.6 ± 0.1 | 2.4 ± 0.1 | 1.9 ± 0.1 | 2.0 ± 0.1 | 3.6 ± 0.1 | 3.3 ± 0.1 | 2.9 ± 0.1 | 2.9 ± 0.1 |
| Abdominal fat (kg) | 0.04 ± 0.01 | 0.02 ± 0.01 ‡ | 0.15 ± 0.01 | 0.14 ± 0.01 | 0.11 ± 0.01 | 0.12 ± 0.01 | 0.19 ± 0.01 | 0.18 ± 0.01 | 0.15 ± 0.16 | 0.16 ± 0.01 |
| Lean mass (kg) | 3.0 ± 0.1 | 2.3 ± 0.1 ‡ | 4.5 ± 0.1 | 3.9 ± 0.1 § | 1.3 ± 0.1 | 1.6 ± 0.1 | 6.7 ± 0.2 | 6.0 ± 0.2 § | 3.7 ± 0.1 | 3.7 ± 0.2 |
| Category | Term | Count | p-Value | |
|---|---|---|---|---|
| miR-1-3p | KEGG | Focal adhesion | 22 | 3.3 × 10⁻⁵ |
| KEGG | PI3k/Akt signaling pathway | 30 | 1.4 × 10⁻⁴ | |
| KEGG | Neurotrophin signaling pathway | 15 | 2.0 × 10⁻⁴ | |
| KEGG | Apelin signaling pathway | 16 | 3.0 × 10⁻⁴ | |
| KEGG | AGE-RAGE signaling pathway in diabetic complications | 13 | 4.7 × 10⁻⁴ | |
| KEGG | Rap1 signaling pathway | 20 | 5.1 × 10⁻⁴ | |
| WIKIPATHWAYS | Genes targeted by miRNAs in adipocytes | 10 | 3.2 × 10⁻¹⁰ | |
| WIKIPATHWAYS | TGF beta signaling pathway | 16 | 6.0 × 10⁻⁴ | |
| WIKIPATHWAYS | PI3k/Akt signaling | 28 | 1.7 × 10⁻³ | |
| WIKIPATHWAYS | Pentose phosphate metabolism | 4 | 2.5 × 10⁻³ | |
| WIKIPATHWAYS | Focal adhesion | 19 | 2.6 × 10⁻³ | |
| WIKIPATHWAYS | Insulin signaling | 16 | 4.1 × 10⁻³ | |
| miR-133a-3p | KEGG | Adherens junction | 8 | 3.5 × 10⁻³ |
| KEGG | PI3k/Akt signaling pathway | 15 | 2.1 × 10⁻² | |
| KEGG | Insulin secretion | 6 | 3.5 × 10⁻² | |
| KEGG | Endocytosis | 11 | 4.1 × 10⁻² | |
| KEGG | Neurotrophin signaling pathway | 7 | 4.2 × 10⁻² | |
| WIKIPATHWAYS | Genes targeted by miRNAs in adipocytes | 6 | 7.6 × 10⁻⁶ | |
| miR-206 | KEGG | Rap1 signaling pathway | 23 | 1.2 × 10⁻⁵ |
| KEGG | Focal adhesion | 22 | 2.0 × 10⁻⁵ | |
| KEGG | Apelin signaling pathway | 17 | 6.1 × 10⁻⁵ | |
| KEGG | Neurotrophin signaling pathway | 15 | 1.4 × 10⁻⁴ | |
| KEGG | PI3k/Akt signaling pathway | 29 | 1.9 × 10⁻⁴ | |
| KEGG | AGE-RAGE signaling pathway in diabetic complications | 11 | 4.2 × 10⁻³ | |
| WIKIPATHWAYS | Genes targeted by miRNAs in adipocytes | 7 | 7.9 × 10⁻⁶ | |
| WIKIPATHWAYS | TGF beta signaling pathway | 17 | 1.6 × 10⁻⁴ | |
| WIKIPATHWAYS | Focal adhesion | 19 | 2.2 × 10⁻³ | |
| WIKIPATHWAYS | PI3k/Akt signaling | 27 | 2.8 × 10⁻³ | |
| WIKIPATHWAYS | Insulin signaling | 16 | 3.6 × 10⁻³ | |
| miR-519d-3p | KEGG | Endocytosis | 32 | 2.7 × 10⁻⁶ |
| KEGG | TGF beta signaling pathway | 19 | 5.6 × 10⁻⁶ | |
| KEGG | MAPK signaling pathway | 34 | 1.5 × 10⁻⁵ | |
| KEGG | Neurotrophin signaling pathway | 18 | 8.8 × 10⁻⁵ | |
| KEGG | TNF signaling pathway | 17 | 2.6 × 10⁻⁴ | |
| KEGG | PI3k/Akt signaling pathway | 32 | 2.2 × 10⁻³ | |
| WIKIPATHWAYS | TGF beta signaling pathway | 22 | 7.0 × 10⁻⁶ | |
| WIKIPATHWAYS | Insulin signaling | 22 | 1.3 × 10⁻⁴ | |
| miR-372-3p | KEGG | MAPK signaling pathway | 29 | 8.5 × 10⁻⁶ |
| KEGG | TGF beta signaling pathway | 14 | 2.0 × 10⁻⁴ | |
| KEGG | PI3k/Akt signaling | 29 | 2.4 × 10⁻⁴ | |
| KEGG | Rap1 signaling pathway | 19 | 1.1 × 10⁻³ | |
| KEGG | Axon guidance | 17 | 1.6 × 10⁻³ | |
| KEGG | Endocytosis | 20 | 3.2 × 10⁻³ | |
| KEGG | Focal adhesion | 16 | 9.9 × 10⁻³ | |
| WIKIPATHWAYS | TGF beta signaling pathway | 17 | 1.2 × 10⁻⁴ | |
| WIKIPATHWAYS | Hippo signaling regulation | 12 | 2.5 × 10⁻³ | |
| WIKIPATHWAYS | Insulin signaling | 16 | 2.8 × 10⁻³ | |
| miR-1299 * | KEGG | Hedgehog signaling pathway | 13 | 2.7 × 10⁻⁵ |
| KEGG | Insulin resistance | 14 | 4.6 × 10⁻³ | |
| KEGG | AGE-RAGE signaling pathway in diabetic complications | 12 | 1.7 × 10⁻² | |
| KEGG | Cell adhesion molecules | 16 | 1.9 × 10⁻² | |
| WIKIPATHWAYS | Hedgehog signaling pathway | 13 | 3.8 × 10⁻⁶ | |
| WIKIPATHWAYS | Glycosaminoglycan synthesis in fibroblasts | 8 | 8.6 × 10⁻³ | |
| WIKIPATHWAYS | Insulin signaling | 17 | 2.3 × 10⁻³ |
| At Birth | 4 mo | Δ 0–4 mo | 12 mo | Δ 0–12 mo | ||||||
|---|---|---|---|---|---|---|---|---|---|---|
| r | p | R | p | r | p | r | p | R | p | |
| mir-1-3p | ||||||||||
| Auxology | ||||||||||
| GA | 0.339 | 0.003 | -- | -- | -- | -- | -- | -- | -- | -- |
| Weight | 0.596 | <0.0001 | 0.296 | 0.009 | −0.044 | 0.706 | ns | ns | 0.034 | 0.773 |
| Weight Z-score | 0.638 | <0.0001 | 0.306 | 0.008 | −0.406 | 0.0004 | 0.364 | 0.002 | −0.507 | <0.0001 |
| Length | 0.477 | <0.0001 | 0.313 | 0.006 | −0.116 | 0.323 | 0.247 | 0.034 | −0.094 | 0.425 |
| Length Z-score | 0.490 | <0.0001 | 0.305 | 0.008 | −0.129 | 0.268 | 0.312 | 0.007 | −0.123 | 0.296 |
| BMI | 0.544 | <0.0001 | ns | ns | −0.346 | 0.002 | ns | ns | −0.391 | 0.0006 |
| BMI Z-score | 0.625 | <0.0001 | ns | ns | −0.498 | <0.0001 | ns | ns | −0.527 | <0.0001 |
| Endocrine–metabolic variables | ||||||||||
| HOMA-IR | 0.299 | 0.019 | −0.284 | 0.019 | −0.344 | 0.008 | −0.364 | 0.003 | −0.358 | 0.006 |
| IGF-1 | 0.391 | 0.0006 | −0.409 | 0.0004 | −0.460 | <0.0001 | −0.410 | 0.0006 | −0.435 | 0.0002 |
| HMW-adip | 0.385 | 0.0007 | ns | ns | −0.361 | 0.008 | 0.274 | 0.031 | ns | ns |
| DXA | ||||||||||
| Body fat | 0.342 | 0.003 | 0.365 | 0.001 | ns | ns | ns | ns | −0.301 | 0.011 |
| Abdominal fat | 0.273 | 0.019 | ns | ns | ns | ns | ns | ns | −0.262 | 0.029 |
| Lean mass | 0.548 | <0.0001 | ns | ns | ns | ns | 0.305 | 0.009 | ns | ns |
| mir-133a-3p | ||||||||||
| Auxology | ||||||||||
| GA | 0.321 | 0.005 | -- | -- | -- | -- | -- | -- | -- | -- |
| Weight | 0.501 | <0.0001 | ns | ns | −0.259 | 0.028 | ns | ns | −0.294 | 0.013 |
| Weight Z-score | 0.479 | <0.0001 | ns | ns | −0.377 | 0.001 | ns | ns | −0.427 | 0.0002 |
| Length | 0.353 | 0.002 | ns | ns | −0.172 | 0.139 | ns | ns | −0.139 | 0.238 |
| Length Z-score | 0.338 | 0.003 | ns | ns | −0.131 | 0.263 | ns | ns | −0.129 | 0.270 |
| BMI | 0.506 | <0.0001 | ns | ns | −0.378 | 0.0009 | ns | ns | −0.384 | 0.0008 |
| BMI Z-score | 0.495 | <0.0001 | ns | ns | −0.402 | 0.0004 | ns | ns | −0.364 | 0.001 |
| Endocrine–metabolic variables | ||||||||||
| HOMA-IR | 0.334 | 0.011 | −0.337 | 0.006 | −0.343 | 0.007 | −0.319 | 0.009 | −0.344 | 0.008 |
| IGF-1 | 0.319 | 0.006 | −0.256 | 0.029 | −0.345 | 0.003 | −0.337 | 0.004 | −0.398 | 0.0008 |
| HMW-adip | 0.337 | 0.003 | ns | ns | ns | ns | 0.294 | 0.018 | ns | ns |
| DXA | ||||||||||
| Body fat | 0.338 | 0.003 | ns | ns | ns | ns | ns | ns | −0.258 | 0.033 |
| Abdominal fat | 0.245 | 0.036 | ns | ns | ns | ns | ns | ns | −0.264 | 0.028 |
| Lean mass | 0.373 | 0.001 | ns | ns | ns | ns | 0.251 | 0.033 | ns | ns |
| mir-206 | ||||||||||
| Auxology | ||||||||||
| GA | 0.338 | 0.003 | -- | -- | -- | -- | -- | -- | -- | -- |
| Weight | 0.594 | <0.0001 | 0.284 | 0.014 | −0.255 | 0.028 | ns | ns | −0.104 | 0.378 |
| Weight Z-score | 0.585 | <0.0001 | 0.321 | 0.005 | −0.387 | 0.0007 | ns | ns | −0.399 | 0.0005 |
| Length | 0.382 | 0.0007 | ns | ns | −0.137 | 0.239 | ns | ns | −0.106 | 0.371 |
| Length Z-score | 0.369 | 0.001 | 0.229 | 0.048 | −0.065 | 0.577 | ns | ns | −0.069 | 0.555 |
| BMI | 0.625 | <0.0001 | ns | ns | −0.433 | 0.0001 | ns | ns | −0.414 | 0.0003 |
| BMI Z-score | 0.631 | <0.0001 | ns | ns | −0.519 | <0.0001 | ns | ns | −0.444 | <0.0001 |
| Endocrine–metabolic variables | ||||||||||
| HOMA-IR | ns | ns | ns | ns | −0.351 | 0.008 | −0.328 | 0.008 | −0.331 | 0.014 |
| IGF-1 | 0.389 | 0.0007 | −0.308 | 0.009 | −0.371 | 0.001 | −0.412 | 0.004 | −0.491 | <0.0001 |
| HMW-adip | 0.335 | 0.004 | ns | ns | ns | ns | ns | ns | ns | ns |
| DXA | ||||||||||
| Body fat | 0.459 | <0.0001 | 0.240 | 0.039 | ns | ns | ns | ns | −0.288 | 0.016 |
| Abdominal fat | 0.387 | 0.0006 | ns | ns | ns | ns | ns | ns | −0.292 | 0.014 |
| Lean mass | 0.463 | <0.0001 | ns | ns | ns | ns | 0.353 | 0.003 | ns | ns |
| At Birth | 4 mo | Δ 0–4 mo | 12 mo | Δ 0–12 mo | ||||||
|---|---|---|---|---|---|---|---|---|---|---|
| r | p | R | p | r | p | r | p | R | p | |
| mir-519d-3p | ||||||||||
| Auxology | ||||||||||
| GA | −0.305 | 0.009 | -- | -- | -- | -- | -- | -- | -- | -- |
| Weight | −0.425 | 0.0001 | ns | ns | 0.304 | 0.009 | ns | ns | 0.322 | 0.006 |
| Weight Z-score | −0.443 | 0.0001 | ns | ns | 0.393 | 0.0006 | ns | ns | 0.447 | <0.0001 |
| Length | −0.303 | 0.008 | ns | ns | ns | ns | ns | ns | 0.241 | 0.042 |
| Length Z-score | −0.322 | 0.005 | ns | ns | ns | ns | ns | ns | 0.239 | 0.043 |
| BMI | -- | -- | ns | ns | 0.418 | 0.0003 | ns | ns | 0.394 | 0.0007 |
| BMI Z-score | −0.403 | 0.0003 | 0.276 | 0.026 | 0.427 | 0.0002 | 0.305 | 0.014 | 0.386 | 0.0009 |
| Endocrine–metabolic variables | ||||||||||
| HOMA-IR | ns | ns | 0.293 | 0.017 | 0.405 | 0.002 | 0.332 | 0.007 | 0.397 | 0.003 |
| IGF-1 | ns | ns | 0.395 | 0.0007 | 0.362 | 0.002 | 0.403 | 0.0008 | 0.389 | 0.001 |
| HMW-adip | ns | ns | ns | ns | ns | ns | ns | ns | ns | ns |
| DXA | ||||||||||
| Body fat | −0.272 | 0.019 | 0.250 | 0.038 | 0.320 | 0.006 | ns | ns | 0.313 | 0.009 |
| Abdominal fat | ns | ns | 0.351 | 0.002 | 0.455 | <0.0001 | ns | ns | 0.329 | 0.008 |
| Lean mass | −0.353 | 0.002 | −0.245 | 0.036 | ns | ns | −0.289 | 0.016 | ns | ns |
| mir-372-3p | ||||||||||
| Auxology | ||||||||||
| GA | −0.241 | 0.047 | -- | -- | -- | -- | -- | -- | -- | -- |
| Weight | −0.243 | 0.037 | ns | ns | ns | ns | ns | ns | ns | ns |
| Weight Z-score | −0.324 | 0.005 | ns | ns | 0.268 | 0.026 | ns | ns | 0.283 | 0.020 |
| Length | ns | ns | ns | ns | 0.240 | 0.042 | ns | ns | 0.267 | 0.028 |
| Length Z-score | ns | ns | ns | ns | ns | ns | ns | ns | ns | ns |
| BMI | −0.348 | 0.003 | ns | ns | 0.264 | 0.029 | ns | ns | 0.302 | 0.012 |
| BMI Z-score | −0.350 | 0.002 | ns | ns | 0.261 | 0.032 | ns | ns | 0.313 | 0.009 |
| Endocrine–metabolic variables | ||||||||||
| HOMA-IR | −0.270 | 0.036 | 0.373 | 0.002 | 0.339 | 0.009 | ns | ns | 0.355 | 0.007 |
| IGF-1 | −0.252 | 0.035 | 0.256 | 0.033 | 0.326 | 0.007 | 0.272 | 0.025 | 0.333 | 0.006 |
| HMW-adip | ns | ns | ns | ns | ns | ns | ns | ns | ns | ns |
| DXA | ||||||||||
| Body fat | ns | ns | 0.309 | 0.008 | 0.323 | 0.006 | ns | ns | 0.271 | 0.027 |
| Abdominal fat | ns | ns | 0.320 | 0.006 | 0.306 | 0.009 | ns | ns | 0.257 | 0.040 |
| Lean mass | ns | ns | ns | ns | ns | ns | ns | ns | ns | ns |
| mir-1299 | ||||||||||
| Auxology | ||||||||||
| GA | −0.276 | 0.022 | -- | -- | -- | -- | -- | -- | -- | -- |
| Weight | −0.357 | 0.002 | ns | ns | 0.257 | 0.033 | ns | ns | ns | ns |
| Weight Z-score | −0.384 | 0.0009 | ns | ns | 0.249 | 0.034 | ns | ns | 0.299 | 0.011 |
| Length | −0.283 | 0.014 | ns | ns | 0.232 | 0.046 | ns | ns | ns | ns |
| Length Z-score | −0.361 | 0.002 | ns | ns | 0.276 | 0.017 | ns | ns | ns | ns |
| BMI | −0.277 | 0.018 | ns | ns | 0.341 | 0.005 | ns | ns | 0.270 | 0.028 |
| BMI Z-score | −0.269 | 0.021 | ns | ns | 0.329 | 0.007 | ns | ns | 0.327 | 0.009 |
| Endocrine–metabolic variables | ||||||||||
| HOMA-IR | ns | ns | 0.272 | 0.037 | 0.3340 | 0.012 | ns | ns | 0.296 | 0.027 |
| IGF-1 | ns | ns | ns | ns | 0.396 | 0.0006 | 0.314 | 0.009 | 0.389 | 0.001 |
| HMW-adip | −0.266 | 0.025 | ns | ns | ns | ns | ns | ns | ns | ns |
| DXA | ||||||||||
| Body fat | −0.265 | 0.027 | ns | ns | 0.317 | 0.009 | ns | ns | 0.328 | 0.008 |
| Abdominal fat | ns | ns | ns | ns | 0.340 | 0.006 | 0.301 | 0.018 | 0.269 | 0.029 |
| Lean mass | −0.384 | 0.0007 | ns | ns | ns | ns | ns | ns | ns | ns |
Disclaimer/Publisher’s Note: The statements, opinions and data contained in all publications are solely those of the individual author(s) and contributor(s) and not of MDPI and/or the editor(s). MDPI and/or the editor(s) disclaim responsibility for any injury to people or property resulting from any ideas, methods, instructions or products referred to in the content. |
© 2025 by the authors. Licensee MDPI, Basel, Switzerland. This article is an open access article distributed under the terms and conditions of the Creative Commons Attribution (CC BY) license (https://creativecommons.org/licenses/by/4.0/).
Share and Cite
Díaz, M.; Quesada-López, T.; Villarroya, F.; López-Bermejo, A.; de Zegher, F.; Ibáñez, L.; Casano-Sancho, P. Cord Blood Exosomal miRNAs from Small-for-Gestational-Age Newborns: Association with Measures of Postnatal Catch-Up Growth and Insulin Resistance. Int. J. Mol. Sci. 2025, 26, 6770. https://doi.org/10.3390/ijms26146770
Díaz M, Quesada-López T, Villarroya F, López-Bermejo A, de Zegher F, Ibáñez L, Casano-Sancho P. Cord Blood Exosomal miRNAs from Small-for-Gestational-Age Newborns: Association with Measures of Postnatal Catch-Up Growth and Insulin Resistance. International Journal of Molecular Sciences. 2025; 26(14):6770. https://doi.org/10.3390/ijms26146770
Chicago/Turabian StyleDíaz, Marta, Tania Quesada-López, Francesc Villarroya, Abel López-Bermejo, Francis de Zegher, Lourdes Ibáñez, and Paula Casano-Sancho. 2025. "Cord Blood Exosomal miRNAs from Small-for-Gestational-Age Newborns: Association with Measures of Postnatal Catch-Up Growth and Insulin Resistance" International Journal of Molecular Sciences 26, no. 14: 6770. https://doi.org/10.3390/ijms26146770
APA StyleDíaz, M., Quesada-López, T., Villarroya, F., López-Bermejo, A., de Zegher, F., Ibáñez, L., & Casano-Sancho, P. (2025). Cord Blood Exosomal miRNAs from Small-for-Gestational-Age Newborns: Association with Measures of Postnatal Catch-Up Growth and Insulin Resistance. International Journal of Molecular Sciences, 26(14), 6770. https://doi.org/10.3390/ijms26146770