Abstract
Black rockfish (Sebastes schlegelii) is a marine ovoviviparous teleost that exhibits significant sexual dimorphism, with females growing faster and reaching larger sizes than males. Establishing stable oogonial stem cells (OSCs) is critical for understanding germline stem cell dynamics and facilitating all-female breeding. In this study, we successfully isolated and cultured OSCs from S. schlegelii for 12 passages. These cells exhibited alkaline phosphatase activity, expressed germline marker genes (ddx4, cdh1, klf4), and maintained a diploid karyotype (2n = 48). Transcriptomic comparisons between early (P3) and late (P12) passages revealed significant metabolic dysfunction and cell cycle arrest in the late-passage cells. Specifically, the down-regulation of glutathione-related and glycolysis-related genes (gstm3, gstt1, mgst3, gsta1, gsta4, gsto1, gapdh) and key mitotic regulators (cdk1, chk1, cdk4, e2f3, ccne2, ccnb1) suggested that metabolic imbalance contributes to oxidative stress, resulting in cell cycle inhibition and eventual senescence. This study provides a marine fish model for investigating metabolism-cell cycle interactions in germline stem cells and lays the foundation for future applications in germ cell transplantation and all-female breeding.
1. Introduction
In marine aquaculture, the black rockfish (Sebastes schlegelii) is considered an economically valuable species [1]. In 2024, the annual production of S. schlegelii in China reached 20,000 tons, reflecting its significant role in the domestic aquaculture market. Due to the fast growth rate of female S. schlegelii, the development of all-female breeding lines has emerged as an effective strategy for enhancing aquaculture productivity [1,2,3,4]. Germline stem cells (GSCs), particularly oogonial stem cells (OSCs), have been investigated as a promising resource for reproductive biotechnology, such as germ cell transplantation (GCT). However, stable and long-term in vitro culture systems for OSCs in marine fish remain underdeveloped.
GCT is an advanced reproductive technique in which donor-derived germ cells are introduced into the allogeneic or xenogeneic recipients, subsequently colonize the recipient’s genital ridges, proliferate, and differentiate into functional gametes. This technique has powerful applications in shortening the time of fishes’ sexual maturity, sex control breeding, and the conservation of rare and endangere·d fish. This technique has been studied and applied in a variety of teleosts [5], including Oncorhynchus mykiss [6], Paralichthys olivaceus [7], O. masou [8], Danio rerio [9], etc. Thus, the all-female production of S. schlegelii may be achieved by this method. Recent studies have found that primordial germ cells (PGCs), spermatogonial stem cells (SSCs), and OSCs have reproductive stem cell functions and can be used as donor cells for GCT in fish [10,11]. However, the number of OSCs is relatively small, because they begin to undergo meiosis immediately after sex differentiation [12], which greatly limits their utilization as donors in GCT. Therefore, the continuous culture of OSCs in vitro is the key to improve GCT technology in S. schlegelii for the production of all-female offspring.
At present, studies on the in vitro culture of OSCs are rare, and only a few somatic ovarian cell lines have been established in marine fish, including Cephalopholis sonnerati [13], Epinephelus coioides [14], Larimichthys crocea [15], Verasper moseri [16], Silurus meridionalis [17], Ictalurus punctatus [18], etc. Moreover, it has been shown that with various culture conditions, the in vitro culture of S. schlegelii ovarian cells can only maintained to the second passage [19]. Consequently, the ability to maintain OSCs in vitro over extended passages would not only facilitate germline engineering but also provide a platform to study the intrinsic regulatory mechanisms governing stem cell self-renewal and senescence. Previous studies in mammalian and freshwater fish models have shown that cellular metabolism and the cell cycle are intimately linked with stem cell function [20,21]. However, little is known about these interactions in marine teleost.
Here, we reported the successful isolation and long-term in vitro culture of OSCs from S.schlegelii. We further used transcriptomic analysis to compare early and late passage cells, aiming to elucidate the molecular mechanisms associated with OSCs’ aging and decline in vitro culture. Our findings have offered insights into the function of metabolic and cell cycle networks in GSCs’ fate and suggested strategies to improve OSCs’ sustainability in vitro. Our results could facilitate the in vitro culture of OSCs in ovoviviparous teleost and laid a foundation for generating all-female S. schlegelii stocks.
2. Results
2.1. Establishment of a Culture System for Oogonial Stem Cells from S. schlegelii
OSCs isolated from the ovaries of one-year-old S. schlegelii were placed in culture flasks and cultured at 24 °C in complete medium. Following differential adhesion, the initially adherent cells were found to be fibrous (Figure 1a and Figure A1). Gradually the polygonal cells appeared to be adherent (Figure 1b and Figure A2), which were presumed to be the putative OSCs, and they were transferred to 96-well plates for monoclonal culture. After reaching approximately 90% confluence, they were digested and reseeded (Figure 1c,d, Figure A3 and Figure A4). The OSC cells in the passaged culture were polygonal and oval shaped.
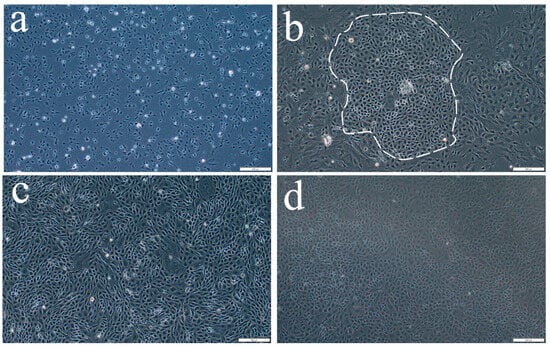
Figure 1.
In vitro culture of S. schlegelii oogonial stem cells (SsOSCs). (a,b) Primary-cultured SsOSCs on the 1th and 7th days. The putative OSCs were circled. (c,d) Sub-cultured SsOSCs in passage 1 (19th day) and passage 10 (4th month). Scale bar = 200 μm.
2.2. Verification of Cell Origination
We performed chromosome number counts on 100 cells in the dividing phase and found that the majority of cells maintained a chromosome number of 2n = 48 (Figure 2a), indicating that the chromosome morphology of SsOSCs was a diploid karyotype with 48 chromosomes (Figure 2b). Upon the establishment of stable SsOSCs, alkaline phosphatase staining demonstrated strong enzymatic activity in 70% of the adherent population (Figure 2c and Figure A5). The expression of germ cell-specific marker genes ddx4 and cdh1, as well as the reproductive stem cell marker gene klf4, were detected. However, the somatic cell marker genes sox9 and fshr were not expressed. Also, the marker genes of ovarian granular cells nanos2 and foxl2 were not expressed, indicating that these cells were not differentiated cells (Figure 2d).
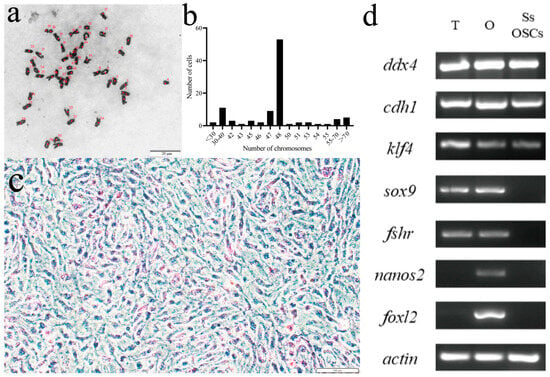
Figure 2.
Verification of cell origination. (a) The chromosome morphology of SsOSCs. The numbers marked in red were the counts of chromosomes. Scale bar = 20 μm. (b) showed the chromosome number distribution of 100 cells. (c) The alkaline phosphatase staining of SsOSCs. Scale bar = 100 μm. (d) Expression of germ cell-related and somatic cell-related marker genes in testis (T), ovary (O), and SsOSCs.
A germ cell-specific marker gene and a stem cell marker gene expression were further analyzed through fluorescence in situ hybridization. The majority of cells exhibited strong germ cell-specific marker gene ddx4 signals (Figure 3a–c), with nearly universal stem cell marker gene klf4 expression (Figure 3d–f). These findings confirmed the successful derivation of OSCs.
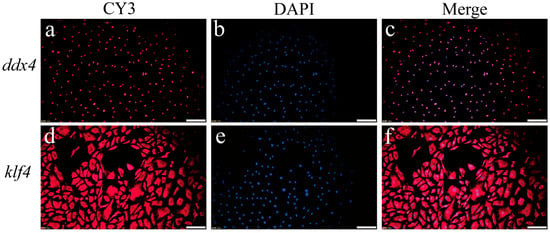
Figure 3.
Detection of germ cell marker gene and stem cell marker gene in passage 12 (P12) SsOSCs. (a) The localization of ddx4 in SsOSCs (red). (b) Cell nuclei were stained with DAPI (blue). (c) Merged image. (d) The localization of klf4 in SsOSCs (red). (e) Cell nuclei were stained with DAPI (blue). (f) Merged image. Scale bar = 100 μm.
2.3. Morphological Changes in SsOSCs During In Vitro Culture
Most of the cells at passage 3 (P3) were oval or round (Figure 4a). The passage 12 (P12) cells changed, with the cell size increasing, an elongation of cytoplasm, and a flat, oblong polygonal shape. Furthermore, some of the P12 cells showed an inadequate membrane, enlarged nuclei, and instances of cell fusion. These morphological changes indicated that cell apoptosis may occur in the process of cell culture (Figure 4b,c). qRT-PCR analysis showed that P12 cells had a significant rise in the expression of apoptosis-related genes p53 and bax (p < 0.0001), as well as caspase-1 (p < 0.001) and bcl-2 (p < 0.01), compared with P3 cells (Figure 4d).
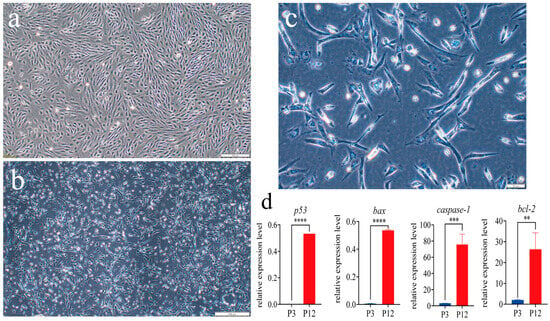
Figure 4.
The morphology of different-passage SsOSCs. (a) Passage 3 (P3) cells at 10× magnification. Scale bar = 200 μm. (b) P12 cells at 10× magnification. Scale bar = 200 μm. (c) P12 cells at 40× magnification. Scale bar = 50 μm; (d) Relative expression level of apoptosis-related genes (t-test, ** p < 0.01; *** p < 0.001; **** p < 0.0001).
2.4. Transcriptome Sequencing and Assembly Analysis
In order to explore the reasons that S. schlegelii OSCs cannot be cultured in vitro sustainably, we performed transcriptome analysis on P3 and P12 cells. Six cDNA libraries (termed P3_1, P3_2, P3_3, P12_1, P12_2, P12_3) were constructed. A total of 278,446,674 raw reads were generated, followed by quality control, leaving 262,860,298 clean reads. The average of Q20 and Q30 were 98.45% and 95.74%, respectively. Subsequently, the clean data were mapped to the S. schlegelii genome. Finally, 94.40% of the clean reads were mapped to the S. schlegelii genome (Table 1). The exceptional sequencing quality of these data guarantees the dependability of the subsequent transcriptome analysis findings.

Table 1.
Summary of transcriptome sequencing.
Based on the FPKM (Fragments Per Kilobase of exon model per Million mapped fragments) values of all the genes in each sample, the correlation coefficients of the intra- and inter-group samples and principal component analysis (PCA) were calculated. The results showed that the differences among the three biological replicates of each group were small, and the correlation coefficient was high (R2 > 0.951, Figure 5a). In addition, the two experimental groups could be clearly distinguished by PC1, indicating that these data could be used for further analysis (Figure 5b).
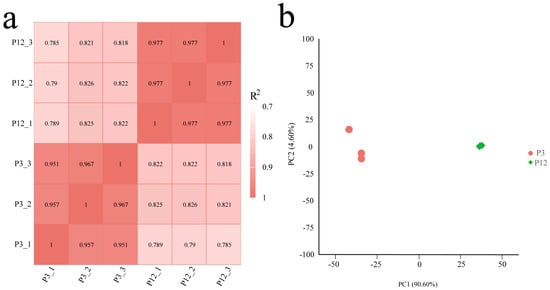
Figure 5.
Correlation analysis of samples used in this study. (a) Pearson’s correlation coefficients between different samples. R2 represented the square of Pearson’s correlation coefficient. (b) Principal component analysis (PCA) of samples.
2.5. GO and KEGG Enrichment Analysis of DEGs
To explore the functions of these DEGs, we performed GO and KEGG enrichment analysis using up- and down-regulated genes, respectively. The up-regulated DEGs were enriched in 79 GO terms under the condition of p-adj < 0.05. The biological process (BP) most enriched terms were intracellular signal transduction, cellular localization, and protein transport, etc. Regarding the cellular components (CCs), the membrane coat, coated membrane, and endomembrane system, etc., were the most enriched. Further, protein serine/threonine kinase activity, phosphatidylinositol binding, and phospholipid binding, etc., were the GO terms most enriched in molecular function (MF) (Figure 6a). On the other hand, a total of 228 GO terms with p-adj < 0.05 were enriched in the down-regulated DEGs (Figure 6b). Terms related to BP included peptide metabolic process, translation, and cellular amide metabolic process, etc. In the CCs, a ribosome, ribonucleoprotein complex, and non-membrane-bounded organelle, etc., were observed. The structural constituent of the ribosome, structural molecule activity, and cytochrome-c oxidase activity, etc. were observed in MF. Interestingly, some BP categories related to cell culture in vitro, such as mitotic cell cycle, mitotic cell cycle process, cell cycle, etc., were also found significantly enriched (Table A1).
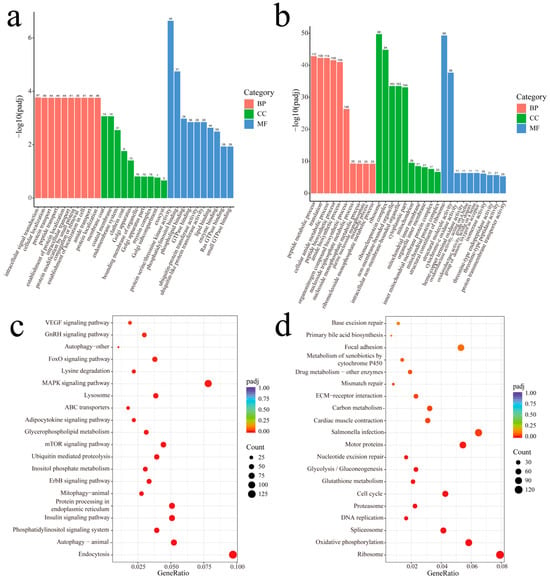
Figure 6.
GO and KEGG enrichment analysis of up-regulated and down-regulated DEGs. (a) Enriched GO terms of up-regulated DEGs in P3 vs. P12 comparison. (b) Enriched GO terms of down-regulated DEGs in P3 vs. P12 comparison. (c) Enriched KEGG pathways of up-regulated DEGs in P3 vs. P12 comparison. (d) Enriched KEGG pathways of down-regulated DEGs in P3 vs. P12 comparison.
KEGG enrichment analysis found that 22 and 17 pathways were enriched in up-regulated and down-regulated DEGs, respectively (p-adj < 0.05). The KEGG pathways significantly enriched by up-regulated DEGs including Endocytosis, Autophagy-animal and the Phosphatidylinositol signaling system. Intriguingly, several of the KEGG pathways enriched were related to metabolism, for example, Inositol phosphate metabolism, Glycerophospholipid metabolism, and Lysosome (Figure 6c). On the other hand, the pathways enriched in down-regulated DEGs included Ribosome, Oxidative phosphorylation, and Spliceosome, etc. KEGGs associated with essential cellular processes such as cell division-related pathways (DNA replication, Cell cycle, Mismatch repair, and Nucleotide excision repair) and metabolism-related pathways (Glutathione metabolism, Glycolysis/Gluconeogenesis, Carbon metabolism, Drug metabolism-other enzymes, and the Metabolism of xenobiotics by cytochrome P450) were also found (Figure 6d).
2.6. Expression Level of KEGG Pathway Genes and qRT-PCR Validation
Based on the KEGG enrichment analysis, we observed that the expression of antioxidant-related genes, including glutathione S-transferase mu 3 (gstm3), glutathione S-transferase theta 1 (gstt1), microsomal glutathione S-transferase 3 (mgst3), glutathione S-transferase alpha 1 (gsta1), glutathione S-transferase alpha 4 (gsta4), and glutathione S-transferase omega 1 (gsto1), were significantly down-regulated in P12 compared to P3, indicating a reduced antioxidant capacity in P12 cells. Meanwhile, glyceraldehyde-3-phosphate dehydrogenase (gapdh), a commonly used metabolic marker, was significantly down-regulated in P12 compared to P3. The downregulation of these genes may indicate metabolic dysregulation associated with impaired cell function, which disrupted cell proliferation, survival, and overall metabolic homeostasis (Figure 7a, p < 0.0001).
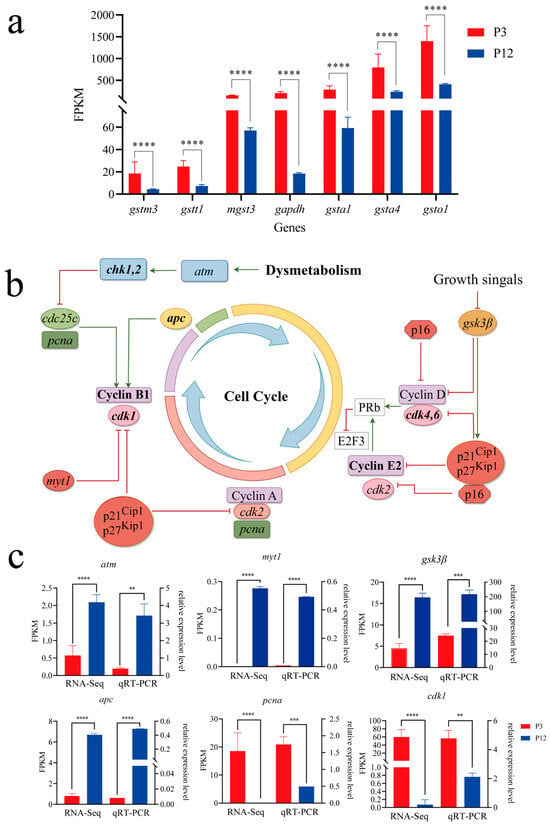
Figure 7.
The signaling pathway and key genes involved in the cell cycle. (a) Expression level of metabolism-related genes in transcriptome data. (b) The schematic diagram of the cell cycle pathway. This pathway was drawn by figdraw. Positive regulation was indicated by green arrows, and negative regulation was indicated by red arrows. (c) The valid transcriptome assembly was verified by qRT-PCR (** p < 0.01; *** p < 0.001; **** p < 0.0001).
In parallel, given the observed metabolic disorders arising from impaired cell function, we focused on several key genes related to the cell cycle. Compared to P3, Checkpoint Kinase 1 (chk1), Cyclin-dependent kinase regulator B1 (ccnb1), Cyclin-dependent kinase 1 (cdk1), E2F transcription factor 3 (e2f3), Cyclin-dependent kinase regulator E2 (ccne2), and Cyclin-dependent kinase 4 (cdk4) all significantly down-regulated in P12. A schematic diagram of the Cell Cycle pathway was presented in Figure 7b. The abnormal expression of these genes may indicate a disruption of the normal mitotic process, which may lead to halted cell growth and division. Based on the differentially expressed genes, GO/KEGG enrichment results, and relevant literature, we hypothesized that the abnormal cell division in vitro was caused by the metabolic disorder during cell culture.
The relative expression levels of key genes in the selected Cell Cycle pathway were validated by qRT-PCR using the same RNA samples, including Ataxia Telangiectasia Mutated (atm), Myelin Transcription Factor (myt1), glycogen synthase kinase 3 beta (gsk3β), Adenomatous Polyposis Coli (apc), proliferating cell nuclear antigen (pcna) and cdk1. Our data revealed that the expression changes in these six genes exhibited regulatory trends consistent with the transcriptome results (Figure 7c). These findings further supported the reliability of our transcriptome data.
3. Discussion
As an important marine economic fish, the value of the artificial cultivation of the S. schlegelii is increasing year by year. As a sex dimorphic species, the female fish grows about 25% faster than the male fish [1,3]. Therefore, the industry of S. schlegelii can be significantly improved by producing all-female seedings. The establishment of a germ cell line can provide a stable source of donors for the GCT of S.schlegelii, and realize the preparation of all-female offspring of S.schlegelii. In this study, for the first time, we continuously cultured S. schlegelii OSCs for 12 passages in vitro. At the same time, through RNA sequencing, we found that metabolic balance was crucial in sustainable cultured cells in vitro, and cell cycle regulation was key for cell division during cell culture.
Previous studies have indicated [19] that the ovarian cell line of S. schlegelii can be maintained in vitro up to the second passage. To optimize these culture conditions, we supplemented the complete culture medium with larval extraction and sterile serum derived from S. schlegelii, creating a culture environment that better resembled in vivo conditions. Using the method of single-cell isolation and culture, we successfully isolated and purified OSCs which could be sustained for 12 passages, retaining an oval morphology characteristic of stem cells [22].
In this study, SsOSCs were successfully expanded through 12 passages and exhibited several morphological changes, including an enlarged cell and nuclear size and a reduced nucleocytoplasmic ratio-hallmarks of cellular senescence during in vitro culture [23,24]. The P12 SsOSCs were notably larger than P3 cells, suggesting that morphological alterations occurred during long-term culture. Cytoplasmic enlargement has been found with in vitro aging in mammalian cells [25]. Moreover, the P12 cells showed a significantly reduced proliferative capacity compared to those from the primary culture (P3), which was a well-established feature of replicative senescence [26,27].The observed morphological changes in P12 SsOSCs were consistent with previous reports and support the conclusion that the cells underwent replicative senescence. Notably, despite signs of apoptosis, the continued expression of stem cell-related genes indicated that the P12 cells retained their identity as undifferentiated OSCs.
It is well documented that ddx4 and cdh1 serve as important germ cell markers [28,29,30,31]. Additionally, klf4 is recognized as a pluripotency marker [14]. In contrast, sox9 and fshr are generally considered somatic cell markers [32]. Genes such as nanos2 [33] and foxl2 [34] are specifically overexpressed in ovarian granulosa cells. These expression patterns suggested that SsOSCs likely originate from germ stem cells rather than somatic ovarian cells. Alkaline phosphatase activity, highly expressed in embryonic germ and stem cells [35,36], was also detected in SsOSCs, indicating the retention of stem cell properties after multiple passages in vitro. Karyotype analysis showed a diploid chromosome number of 2n = 48, consistent with previous reports for this species [37].
We demonstrated that OSCs from S. schlegelii could be cultured for 12 passages, which was the longest reported duration for marine fish OSCs. These cells showed typical stem cell characteristics during early passages, including a high alkaline phosphatase activity, stable diploid karyotype, and expression of germline markers. However, with continuous culture, the cells gradually exhibited senescence phenotypes, including reduced proliferation, increased apoptosis, and transcriptomic changes indicating stress.
Compared to P3 cells, the expression of mgst3, gstm3, gapdh, gsta1, gsta4, gstt1, and gsto1 were significantly down-regulated in the P12 cells, indicating impaired cellular function. mgst3 and gstm3 could facilitate glutathione binding to toxic electrophiles, protecting cells from oxidative stress and damage [38,39]. Similarly, gsta1 and gsta4 detoxify reactive oxygen species (ROS) and lipid peroxidation products [40,41]. gstt1 and gsto1 mediate glutathione’s conjugation to various harmful substrates, including carcinogens and drugs [42,43]. gapdh is a key glycolytic enzyme linking metabolism to energy production and redox balance [44]. Downregulation of these genes suggests reduced antioxidant capacity and compromised oxidative stress management, leading to the accumulation of ROS and cellular damage. Impaired detoxification may lead to the buildup of toxic metabolites, disrupted homeostasis, and negative effects on cell proliferation, survival, and differentiation, ultimately weakening the health and function of cultured OSCs.
Cellular metabolic imbalance disrupted the cell cycle. Analysis of transcriptome data revealed aberrant cell cycle-related gene expression. Cyclin-dependent kinases (CDKs) and their cyclin partners orchestrate cell cycle transitions and stem cell fate [45]. Inactivation of the gsk3β-Cyclin D1 axis arrests cells in the G0/G1 phase [46], while cdk4/6 and cdk2-Cyclin E complexes promote Rb phosphorylation and facilitate E2F-driven DNA replication [47,48,49,50]. pcna supports DNA synthesis during the S phase [51], and myt1 inhibits cdk1 to regulate G2/M transition [52]. Furthermore, atm activation or apc suppression can trigger Cyclin B1’s degradation and mitotic exit [53,54,55]. Several of these genes, including atm, myt1, gsk3β, apc, and pcna, were validated by qPCR and showed expression patterns consistent with transcriptomic data, supporting their role in OSC senescence.
In summary, we established a culture system in vitro for OSCs from S. schlegelii and successfully maintained them for 12 passages. Comparative transcriptomic analysis between P3 and P12 cells revealed that cell cycle arrest was a key bottleneck limiting prolonged culture, while metabolic integrity was essential for sustaining cellular proliferation and viability. We identified key glycolysis-related gene (gapdh), glutathione metabolism genes (gstm3, gsto1, gsta1, gsta4, gstt1, mgst3), and cell cycle regulators (cdk1, atm, myt1, pcna, gsk3β, apc) whose downregulation may underlie the observed senescence. These findings indicated a potential link between metabolic homeostasis and cell cycle progression in regulating the proliferative of germline stem cells during long-term in vitro culture. While further validation is needed, the S. schlegelii OSC culture system provides a promising model for exploring the cellular mechanisms underlying stem cell senescence. This work also lays the groundwork for future strategies aimed at enhancing reproductive biotechnology. For breeding, OSCs enable the rapid generation of genetically improved fish via GCT [36]. Molecular insights optimize culture systems may enhance stem cell performance. Notably, OSCs possess substantial untapped potential awaiting further exploration.
4. Materials and Methods
4.1. Fish and Reagent Preparation
One-year-old Sebastes schlegelii individuals (n = 6, body weight 90.5 ± 12.0 g, total length 17.8 ± 2.1 cm) were obtained from the Muping Aquaculture Base (Yantai, Shandong Province, China). Prior to the experiments, the fish were acclimated for 2 weeks in 500 L circular tanks with flow-through seawater under natural photoperiod conditions. During acclimation, fish were fed twice daily with commercial pellets and showed normal feeding behavior and no signs of disease.
Blood was collected from healthy individuals using sterile syringes and transferred into centrifuge tubes. After standing at 4 °C for 2 h, the blood was centrifuged at 8000 rpm for 15 min at 4 °C. The supernatant was filtered through a 0.22 μm sterile filter to obtain cell-free serum. The complete culture medium were consisted of Leibovitz’s L-15 medium (Solarbio, Beijing, China), supplemented with 20% fetal bovine serum (FBS, Gibco, Billings, MT, USA), 100 IU/mL penicillin, 0.1 mg/mL streptomycin, 50 μg/mL gentamicin (Solarbio, Beijing, China), 1% S. schlegelii serum, 1% S. schlegelii larval extraction, 10 mmol/mL HEPES (Gibco, Billings, MT, USA), 0.34 μL/100 mL 2-mercaptoethanol (Macklin, Shanghai, China), 2 ng/mL recombinant human basic fibroblast growth factor (bFGF, Beyotime, Jiangsu, China), and 2 ng/mL recombinant human leukemia inhibitory factor (LIF, Beyotime, Jiangsu, China).
4.2. Primary Cultivation of Oogonial Stem Cells from S. schlegelii
Healthy female S. schlegelii were selected and acclimated in the laboratory for 24 h. The fish were anesthetized in seawater containing 200 mg/L Tricaine methanesulfonate (MS-222; Sigma, Shanghai, China), followed by surface sterilization using 75% ethanol. Dissection was conducted under sterile conditions. Ovaries were excised, immediately transferred into L-15 medium containing penicillin–streptomycin and gentamicin, and rinsed 3–4 times to remove residual mesangial tissues and blood vessels.
The cleaned ovaries were minced into 1 mm3 fragments and digested with 0.25% trypsin-EDTA for 10–15 min at room temperature (RT, 25 ± 1 °C). The resulting cell suspension was filtered through a 40 μm mesh to obtain single cells, which were seeded into 25 cm2 cell culture flasks and maintained at 24 °C. During primary culture, half of the medium was refreshed every 5–7 days, and cell attachment and morphology were monitored continuously.
Once OSC-like cells appeared, putative SsOSCs were transferred sequentially from 96-well plates to 48-, 24-, 12-, and 6-well plates and eventually to cell culture flasks for expansion. When the cultures reached 80–90% confluency, the cells were passaged. For subculturing, the spent medium was removed, and the cells were rinsed with L-15 containing antibiotics and digested with 1 mL of 0.25% trypsin-EDTA. Once most of the cells had rounded up, they were split at a 1:1 ratio into new flasks with fresh medium. This procedure was used for all subsequent passages.
4.3. Chromosome Karyotype Analysis
The 10th passage SsOSCs were cultured in 75 cm2 flasks at 24 °C for 24 h, then treated with 0.25 μg/mL colchicine for 2 h. After washing with PBS, the cells were digested by trypsin, subjected to hypotonic treatment (0.075 M KCl, 37 °C, 40 min), and fixed in Karnaugh’s solution. Following repeated fixation cycles (3–4×, 40 min each), the cells were dropped onto chilled slides, Giemsa-stained, and imaged by brightfield microscopy.
4.4. Alkaline Phosphatase Staining
The 10th passage SsOSCs with 90% confluence were transferred to 6-well plates for culturing. Alkaline Phosphatase activity experiments were performed with a Leukocyte Alkaline Phosphatase Kit (Beyotime, Jiangsu, China) according to the manufacturer’s instructions. After that, the cells were transferred to an incubator and cultured in the dark for 12–24 h. The cells were observed and photographed under an inverted microscope (IX73, OLYMPUS, Tokyo, Japan).
4.5. Total RNA Extraction, cDNA Reverse Transcription, and Polymerase Chain Reaction
Samples of P12 cells were collected, and the total RNA was extracted using TRIzol (Invitrogen, Waltham, MA, USA) according to the manufacturer’s instructions. The cDNA was synthesized using a Prime-Script™ RT Reagent Kit with gDNA Eraser (TaKaRa, Kusatsu, Japan) following the manufacturer’s manual.
Semi-qPCR was used to detect the expression of cellular marker genes in cells and gonads. The PCR system was as follows: DNA template 200 ng; upstream and downstream primers (10 µmol/L) 0.4 µL each; 2 × EasyTaq SuperMix 10 µL (Vazyme, Nanjing, China); RNA-free water to 20 µL. The PCR conditions were as follows: 94 °C predenaturation for 3 min; 35 cycles: denaturation at 94 °C for 15 s, renaturation at Tm for 15 s, and extension at 72 °C for 5 s; extension at 72 °C for 5 min; and storage at 4 °C. PCR products were analyzed by 1% agarose gel electrophoresis for specific bands. Primers were shown in Table A2.
4.6. Fluorescence in Situ Hybridization
OSCs were inoculated into 12-well plates (NEST, Wuxi, China) until cell fusion reached 80%. FISH fluorescent probes were synthesized using a multi-sequence hybrid probe by Servicebio Inc. (Servicebio, Wuhan, China). Fluorescence in situ hybridization was performed with a FISH kit (Servicebio, Wuhan, China) according to the manufacturer’s requirements. Images were acquired and analyzed using inverted fluorescent microscope (IX73, OLYMPUS, Tokyo, Japan). The probe sequences were shown in Table A2.
4.7. Transcriptome Library Construction and Sequencing
For transcriptome sequencing, total RNA was extracted from passage 3 (P3) and passage 12 (P12) cells using TRIzol (Invitrogen, Waltham, MA, USA). RNA integrity was evaluated using an Agilent 5400 (Agilent Technologies, Santa Clara, CA, USA). All samples exhibited RIN values ≥ 6.7 (mean = 7.6, n = 6). PolyA + mRNA was extracted, fragmented, and reverse-transcribed into cDNA. After adapter ligation and size selection (370–420 bp), the libraries were PCR-amplified. This study employed the Illumina NovaSeq X Plus sequencing platform (Illumina, San Diego, CA, USA) for high-throughput sequencing, utilizing a paired-end 150 bp (PE150) sequencing strategy.
4.8. Data Filtering and Genome Mapping
Raw sequencing data were processed using SOAPnuke (v1.4.0) [56] and Trimmomatic (v0.36) [57] to remove adapters, exclude reads with >3% ambiguous bases, and discard sequences with >20% low-quality bases (Q ≤ 5). High-quality reads were aligned to the S. schlegelii genome (GCA014673565.1) via HISAT2 (v2.0.5) [58] and Bowtie2 (v2.2.5) [59] using default parameters. The feature Counts (1.5.0-p3) was used to calculate the readings mapped to each gene, the Fragments Per Kilobase of exon model per Million mapped fragments (FPKM) of each gene based on its length, and the readings mapped to that gene. DESeq2 software (1.20.0) was used to screen differential expression genes (DEGs). The unigenes with a p-adjust < 0.05 and |log2(fold-change)| ≥ 1 were identified as significant DEGs.
4.9. Identification of Gene Ontology and Kyoto Encyclopedia of Genes and Genomes Enrichment Analysis
The functional annotation of DEGs was performed using the cluster Profiler (v3.8.1), incorporating gene length bias correction. Statistically significant enrichment was defined as a false discovery rate (FDR)-adjusted p-adjust < 0.05 for both GO terms and KEGG pathways.
4.10. Evaluation of Gene Expression by qRT-PCR
To further validate the cell apoptosis and the reliability of the RNA-seq data, apoptosis-related genes and cell cycle-related DEGs were selected for qRT-PCR verification. Primers were designed using Primer 5.0 and synthesized by Qingdao Ruibo Biotechnology Co., LTD., Qingdao, China, (Table A2). qRT-PCR was performed with the QuantiNova SYBR Green PCR Kit (Qiagen, Hilden, Germany). The methods and reaction systems were in accordance with the instructions. The reaction procedure was performed on a LightCycler® 480 II system (Basel, Switzerland) as follows: 95 °C for 2 min; 40 cycles of 95 °C for 5 s and 60 °C for 10 s; 95 °C for 15 s, 60 °C for 1 min, +1 °C/min; and 95 °C for 15 s. β-actin was used as an internal reference gene. Three replicates of each reaction were included in this study, and the relative expression of the genes was analyzed using the 2−∆∆CT method.
All data are represented by mean stand error (x ± SEM). Differences between groups were analyzed by t-test using GraphPad Prism 9.5.0 software (GraphPad, San Diego, CA, USA). All differences were considered statistically significant when p < 0.05.
Supplementary Materials
The following supporting information can be downloaded at: https://www.mdpi.com/article/10.3390/ijms26146772/s1.
Author Contributions
Conceptualization, C.S., Q.W., X.C. and J.Z.; methodology, J.Z., L.L. and Q.W.; software, L.L. and Y.Z.; validation, S.Z. and C.D.; investigation, S.Z. and Y.Z.; resources: Y.L.; visualization: Y.Y., Y.H., H.J. and B.M.; funding acquisition: C.S., Q.W. and X.C.; writing—original draft preparation, J.Z., Q.W. and C.S.; writing—review and editing, J.Z., Q.W. and C.S.; supervision, Q.W. and C.S. All authors have read and agreed to the published version of the manuscript.
Funding
The Key R&D Program of Shandong Province, China: 2024LZGC005; the Central Public-interest Scientific Institution Basal Research Fund, CAFS: 2025XT0603; the National Key Research and Development Program of China: 2022YFD2400100; the Basal Research Fund of State Key Laboratory of Mariculture Biobreeding and Sustainable Goods: BRESG-JB202405; the Central Public-interest Scientific Institution Basal Research Fund, CAFS: NO. 2023XT0203; the Taishan Scholars Program: NO. tstp20221149; to C.S., the National TenThousands Talents Special Support Program to C.S., the Central Public-interest Scientific Institution Basal Research Fund, CAFS: 2023TD19; the Key R&D Program of Hebei Province, China: 21326307D; the Improvement of Aquaculture Seed Industry Program of Yantai: 2023.
Institutional Review Board Statement
The animal study protocol was approved by the Institutional Animal Care and Use Committee (IACUC) of the Yellow Sea Fisheries Research Institute (CAFS) (Qingdao, China) on 5 December 2024 (Approval No. YSFRI-2024076).
Informed Consent Statement
Not applicable.
Data Availability Statement
The data are contained within the article. RNA-seq data are submitted in NCBI (BioProject: PRJNA1132777).
Conflicts of Interest
The authors declare no conflicts of interest.
Appendix A

Table A1.
GO terms related to cell cycle enriched by down-regulated DEGs.
Table A1.
GO terms related to cell cycle enriched by down-regulated DEGs.
| Category | GOID | Description | GeneRatio | BgRatio | Pvalue | Padj | Count |
|---|---|---|---|---|---|---|---|
| BP | GO:0000278 | mitotic cell cycle | 11/1,150 | 17/7,527 | 5.14 × 10⁻⁶ | 6.42 × 10⁻⁵ | 11 |
| BP | GO:1903047 | mitotic cell cycle process | 9/1,150 | 14/7,527 | 4.25 × 10⁻⁵ | 0.000403269 | 9 |
| BP | GO:0007049 | cell cycle | 19/1,150 | 56/7,527 | 0.000404622 | 0.002917837 | 19 |
| BP | GO:0140014 | mitotic nuclear division | 6/1,150 | 10/7,527 | 0.001514911 | 0.00923374 | 6 |
| BP | GO:0022402 | cell cycle process | 12/1,150 | 37/7,527 | 0.006953496 | 0.028944634 | 12 |

Table A2.
Primers and probes for gene expression analysis (semi-qPCR, qRT-PCR) and FISH.
Table A2.
Primers and probes for gene expression analysis (semi-qPCR, qRT-PCR) and FISH.
| Genes | Sequences (5′-3′) | Product Length | Tm | Usage |
|---|---|---|---|---|
| β-actin-F | AAGGACCTGTACGCCAACAC | 248 bp | 57.5 °C | Semi-qPCR and qRT-PCR |
| β-actin-R | TTCCTGTGGACAATGCTGGG | |||
| nanos2-F | CTTCGACATGTGGCACGACT | 314 bp | 55.5 °C | Semi-qPCR |
| nanos2-R | CGTCTGATTTCAGCCGGTGT | |||
| foxl2-F | CAACACCACGACCAAGGAGA | 364 bp | 57.5 °C | |
| foxl2-R | TCGTCTCCGGTAGTTTCCCT | |||
| ddx4-F | GCAGAACAGATAGCAGTGAAT | 550 bp | 55.5 °C | |
| ddx4-R | TGCTGCAGAATAGGGAGCAGG | |||
| sox9-F | CAACGCGGAACTCAGCAAAA | 367 bp | 55.5 °C | |
| sox9-R | CTCACGCTTCAGGTCAGGTT | |||
| fshr-F | CTCGACCGTAAACTTCGCCT | 247 bp | 59.0 °C | |
| fshr-R | GGTTGTGGACGGTCAGGTAG | |||
| cdh1-F | CCGTCCTGGCTAAAGTGTGT | 418 bp | 55.5 °C | |
| cdh1-R | TTGTCGGCTGCCTTCAGATT | |||
| klf4-F | CCCTGTGGAGGGGTCTACTT | 311 bp | 60.0 °C | |
| klf4-R | TTCATATGGAGAGCAAGGTGGT | |||
| ddx4 | CGGCTTCACATAACCCGACTTGCT | \ | \ | FISH |
| TCCAGGACCGCTGAACGCA | ||||
| klf4 | GGCTGCGAGATGGTGCAGGTACTG | \ | \ | |
| GGCTTCGGTTCCTCCGGTAAGCAG | ||||
| TCCCAGTCGCAGTGGTAAGGCTTC | ||||
| p53-F | TGCTGAGAGTGCAGTGTTGT | 266 bp | 59.9 °C | qRT-PCR |
| p53-R | GGATGGTCAGCACCCAGTAG | |||
| bax-F | GGCGTGTGAAGGAAACAACA | 245 bp | 59.3 °C | |
| bax-R | AACAAGCCACCCCGTCTATC | |||
| bcl-2-F | GAAGGAGATGAGTCCGCTGG | 222 bp | 59.9 °C | |
| bcl-2-R | TTTCTGGGCGATGAGCGAG | |||
| caspase-1-F | AGAAACGTCCCACCAGAGGA | 241 bp | 60.5 °C | |
| caspase-1-R | CATCCTTACGGAGAGCAGCG | |||
| gsk3β-F | AAGGTTCTGGGGACACCAAC | 297 bp | 59.7 °C | |
| gsk3β-R | GATAGACAGCTCGACGGGAC | |||
| cdk1-F | GACCCGATGCTGGTCAAGAG | 278 bp | 60.3 °C | |
| cdk1-R | ATGGTCCCAGTGCTCCAAAC | |||
| atm-F | GGTACGAGCCGCTTTAGTGA | 292 bp | 59.9 °C | |
| atm-R | AGGGAGCTTCATCCCTTCCT | |||
| apc-F | CACTGACTCTTACCCGGCAG | 269 bp | 60.1 °C | |
| apc-R | GCTCTCTGTGATGCTGTCGT | |||
| pcna-F | TCCACTCCTGCAAAGAGCAAA | 216 bp | 60.1 °C | |
| pcna-R | ATCGTCATCGTCAGCAGGCA | |||
| myt1-F | GAGGGTCTCCTGAATGGCAC | 300 bp | 60.0 °C | |
| myt1-R | GTTGACCATGTCAGCCTCCA |
Appendix B
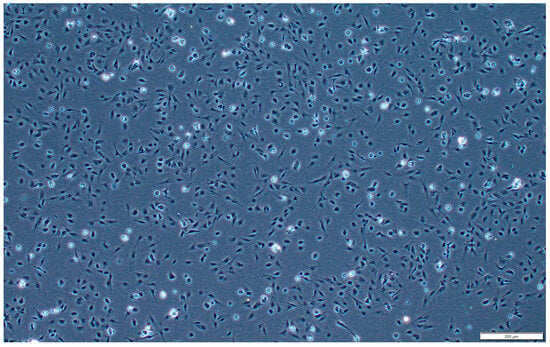
Figure A1.
Subplot a of Figure 1. Primary-cultured SsOSCs on the 1st day. Scale bar = 200 μm.
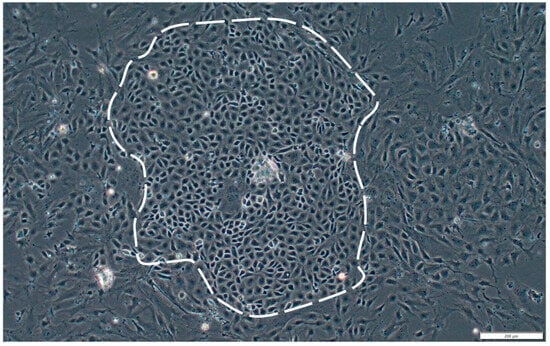
Figure A2.
Subplot b of Figure 1. Primary-cultured SsOSCs on the 7th day. Scale bar = 200 μm.
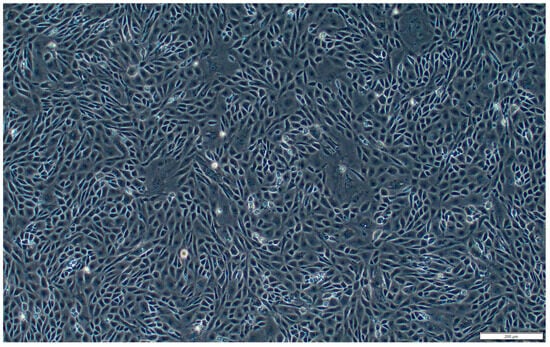
Figure A3.
Subplot c of Figure 1. Sub-cultured SsOSCs in passage 1 (19th day). Scale bar = 200 μm.
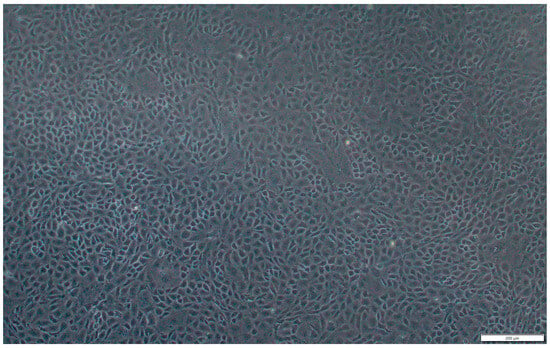
Figure A4.
Subplot d of Figure 1. Sub-cultured SsOSCs in passage 10 (4th month). Scale bar = 200 μm.
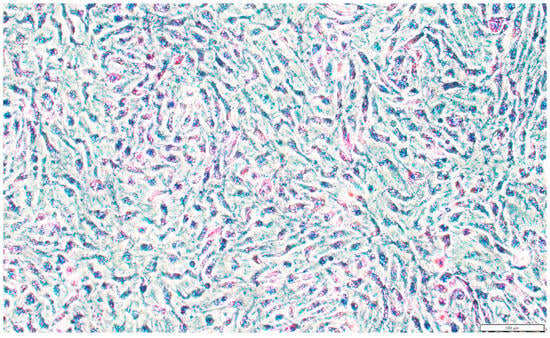
Figure A5.
Subplot c of Figure 2. The alkaline phosphatase staining of SsOSCs. Scale bar = 100 μm.
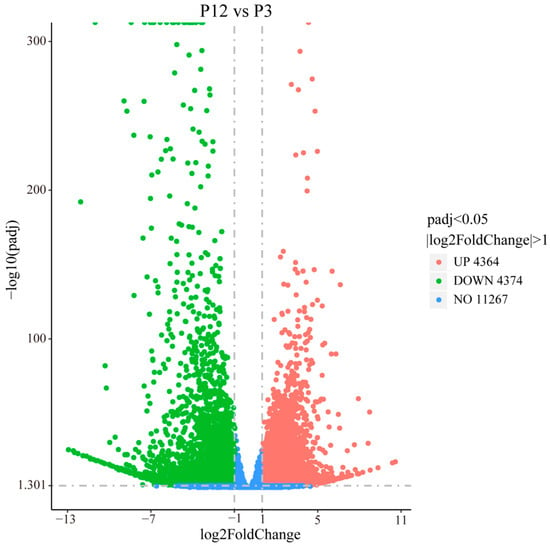
Figure A6.
The volcano plot shows the distribution of gene expression levels. Green dots indicate down-regulated gene expression levels, red dots indicate up-regulated gene expression levels, and blue dots indicate genes that were not significantly different.
References
- Huang, H.; Liu, Y.; Wang, Q.; Dong, C.; Dong, L.; Zhang, J.; Yang, Y.; Hao, X.; Li, W.; Rosa, I.F.; et al. Molecular and Physiological Effects of 17α-Methyltestosterone on Sex Differentiation of Black Rockfish, Sebastes schlegelii. Genes 2024, 15, 605. [Google Scholar] [CrossRef]
- Song, W.; Xie, Y.; Sun, M.; Li, X.; Fitzpatrick, C.K.; Vaux, F.; O’Malley, K.G.; Zhang, Q.; Qi, J.; He, Y. A Duplicated Amh Is the Master Sex-Determining Gene for Sebastes Rockfish in the Northwest Pacific. Open Biol. 2021, 11, 210063. [Google Scholar] [CrossRef] [PubMed]
- Lee, D.-Y.; Lee, C.-H.; Kim, K.-D.; Lim, H.J.; Kim, H.S. Effects of Diet Supplementation with Plant Juice Processing By-Products on Juvenile Black Rockfish (Sebastes schlegelii) Growth Performance, Feed Utilization, Non-Specific Immunity, and Disease Resistance against Vibrio harveyi. Aquac. Rep. 2021, 21, 100831. [Google Scholar] [CrossRef]
- Lee, S.-M. Review of the Lipid and Essential Fatty Acid Requirements of Rockfish (Sebastes schlegeli). Aquac. Res. 2001, 32, 8–17. [Google Scholar] [CrossRef]
- Ye, H.; Wei, Q.; Xu, D.; Yue, H.; Zhu, N.; Ruan, R.; Du, H.; Li, C. Progress and application prospect of germ cell transplantation technique in fish. J. Fish. 2020, 44, 321–337. (In Chinese) [Google Scholar]
- Fujihara, R.; Katayama, N.; Sadaie, S.; Miwa, M.; Sanchez Matias, G.A.; Ichida, K.; Fujii, W.; Naito, K.; Hayashi, M.; Yoshizaki, G. Production of Germ Cell-Less Rainbow Trout by Dead End Gene Knockout and Their Use as Recipients for Germ Cell Transplantation. Mar. Biotechnol. 2022, 24, 417–429. [Google Scholar] [CrossRef]
- Ren, Y.; Sun, Z.; Wang, Y.; Yu, Q.; Wang, G.; He, Z.; Liu, Y.; Jiang, X.; Kang, X.; Hou, J. Production of Donor-Derived Offsprings by Allogeneic Transplantation of Oogonia in the Adult Japanese Flounder (Paralichthys olivaceus). Aquaculture 2021, 543, 736977. [Google Scholar] [CrossRef]
- Lee, S.; Bang, W.Y.; Yang, H.-S.; Lee, D.-S.; Song, H.Y. Production of Juvenile Masu Salmon (Oncorhynchus masou) from Spermatogonia-Derived Sperm and Oogonia-Derived Eggs via Intraperitoneal Transplantation of Immature Germ Cells. Biochem. Biophys. Res. Commun. 2021, 535, 6–11. [Google Scholar] [CrossRef]
- Wong, T.-T.; Tesfamichael, A.; Collodi, P. Production of Zebrafish Offspring from Cultured Female Germline Stem Cells. PLoS ONE 2013, 8, e62660. [Google Scholar] [CrossRef]
- Yoshizaki, G.; Ichikawa, M.; Hayashi, M.; Iwasaki, Y.; Miwa, M.; Shikina, S.; Okutsu, T. Sexual Plasticity of Ovarian Germ Cells in Rainbow Trout. Development 2010, 137, 1227–1230. [Google Scholar] [CrossRef]
- Okutsu, T.; Shikina, S.; Kanno, M.; Takeuchi, Y.; Yoshizaki, G. Production of Trout Offspring from Triploid Salmon Parents. Science 2007, 317, 1517. [Google Scholar] [CrossRef]
- Matova, N.; Cooley, L. Comparative Aspects of Animal Oogenesis. Dev. Biol. 2001, 231, 291–320. [Google Scholar] [CrossRef]
- Fang, F.; Gong, Z.; Guo, C.; Wang, C.; Ding, L.; Zhou, B.; Chen, S. Establishment of an Ovarian Cell Line from Tomato Grouper (Cephalopholis sonnerati) and Its Transcriptome Response to ISKNV Infection. Fish Shellfish Immunol. 2025, 162, 110304. [Google Scholar] [CrossRef]
- Zhong, C.; Tao, Y.; Liu, M.; Wu, X.; Yang, Y.; Wang, T.; Meng, Z.; Xu, H.; Liu, X. Establishment of a Spermatogonial Stem Cell Line with Potential of Meiosis in a Hermaphroditic Fish, Epinephelus Coioides. Cells 2022, 11, 2868. [Google Scholar] [CrossRef]
- Xu, Y.; Zhong, Z.; Zhang, Z.; Feng, Y.; Zhao, L.; Jiang, Y.; Wang, Y. Establishment and Characterization of the Gonadal Cell Lines Derived from Large Yellow Croaker (Larimichthys crocea) for Gene Expression Studies. Aquaculture 2022, 546, 737300. [Google Scholar] [CrossRef]
- Xu, X.; Fan, T.; Jiang, G.; Yang, X. Establishment and Characterization of a New Marine Fish Cell Line from Ovary of Barfin Flounder (Verasper moseri). J. Ocean. Univ. China 2015, 14, 1105–1110. [Google Scholar] [CrossRef]
- Wei, J.; Qi, W.; Zhou, Y.; Zhang, X.; Dong, R.; Zhou, L.; Wang, D. Establishment and Characterization of an Ovarian Cell Line from Southern Catfish (Silurus meridionalis). Fish. Physiol. Biochem. 2014, 40, 1383–1391. [Google Scholar] [CrossRef] [PubMed]
- Hettiarachchi, D.U.; Alston, V.N.; Bern, L.; Al-Armanazi, J.; Su, B.; Shang, M.; Wang, J.; Xing, D.; Li, S.; Litvak, M.K.; et al. Advancing Aquaculture: Production of Xenogenic Catfish by Transplanting Blue Catfish (Ictalurus furcatus) and Channel Catfish (I. Punctatus) Stem Cells into White Catfish (Ameiurus catus) Triploid Fry. PLoS ONE 2024, 19, e0302687. [Google Scholar] [CrossRef]
- Ryu, J.H.; Kim, H.J.; Bae, S.S.; Jung, C.G.; Gong, S.P. Isolation and in Vitro Culture of Primary Cell Populations Derived from Ovarian Tissues of the Rockfish, Sebastes schlegeli. Fish. Aquat. Sci. 2016, 19, 9. [Google Scholar] [CrossRef]
- Ito, K.; Suda, T. Metabolic Requirements for the Maintenance of Self-Renewing Stem Cells. Nat. Rev. Mol. Cell Biol. 2014, 15, 243–256. [Google Scholar] [CrossRef]
- Zhang, J.; Zhao, J.; Dahan, P.; Lu, V.; Zhang, C.; Li, H.; Teitell, M.A. Metabolism in Pluripotent Stem Cells and Early Mammalian Development. Cell Metab. 2018, 27, 332–338. [Google Scholar] [CrossRef]
- Chen, X.; Kan, Y.; Zhong, Y.; Jawad, M.; Wei, W.; Gu, K.; Gui, L.; Li, M. Generation of a Normal Long-Term-Cultured Chinese Hook Snout Carp Spermatogonial Stem Cell Line Capable of Sperm Production In Vitro. Biology 2022, 11, 1069. [Google Scholar] [CrossRef]
- Son, H.N. Morphological Changes of Porcine Granulosa Cells during in Vitro Expansion. Pak. Vet. J. 2019, 40, 229–233. [Google Scholar] [CrossRef]
- Cho, K.A.; Ryu, S.J.; Oh, Y.S.; Park, J.H.; Lee, J.W.; Kim, H.-P.; Kim, K.T.; Jang, I.S.; Park, S.C. Morphological Adjustment of Senescent Cells by Modulating Caveolin-1 Status. J. Biol. Chem. 2004, 279, 42270–42278. [Google Scholar] [CrossRef]
- Neurohr, G.E.; Terry, R.L.; Lengefeld, J.; Bonney, M.; Brittingham, G.P.; Moretto, F.; Miettinen, T.P.; Vaites, L.P.; Soares, L.M.; Paulo, J.A.; et al. Excessive Cell Growth Causes Cytoplasm Dilution And Contributes to Senescence. Cell 2019, 176, 1083–1097.e18. [Google Scholar] [CrossRef]
- Sikora, E.; Mosieniak, G.; Sliwinska, M.A. Morphological and Functional Characteristic of Senescent Cancer Cells. Curr. Drug Targets 2016, 17, 377–387. [Google Scholar] [CrossRef]
- Herranz, N.; Gil, J. Mechanisms and Functions of Cellular Senescence. J. Clin. Investig. 2018, 128, 1238–1246. [Google Scholar] [CrossRef] [PubMed]
- Braat, A.K.; van de Water, S.; Goos, H.; Bogerd, J.; Zivkovic, D. Vasa Protein Expression and Localization in the Zebrafish. Mech. Dev. 2000, 95, 271–274. [Google Scholar] [CrossRef] [PubMed]
- Duan, J.; Feng, G.; Chang, P.; Zhang, X.; Zhou, Q.; Zhong, X.; Qi, C.; Xie, S.; Zhao, H. Germ Cell-Specific Expression of Dead End (Dnd) in Rare Minnow (Gobiocypris rarus). Fish. Physiol. Biochem. 2015, 41, 561–571. [Google Scholar] [CrossRef] [PubMed]
- Kobayashi, T.; Kajiura-Kobayashi, H.; Nagahama, Y. Two Isoforms of Vasa Homologs in a Teleost Fish: Their Differential Expression during Germ Cell Differentiation. Mech. Dev. 2002, 111, 167–171. [Google Scholar] [CrossRef]
- Raghuveer, K.; Senthilkumaran, B. Cloning and Differential Expression Pattern of Vasa in the Developing and Recrudescing Gonads of Catfish, Clarias Gariepinus. Comp. Biochem. Physiol. A Mol. Integr. Physiol. 2010, 157, 79–85. [Google Scholar] [CrossRef]
- Kan, Y.; Zhong, Y.; Jawad, M.; Chen, X.; Liu, D.; Ren, M.; Xu, G.; Gui, L.; Li, M. Establishment of a Coilia Nasus Gonadal Somatic Cell Line Capable of Sperm Induction In Vitro. Biology 2022, 11, 1049. [Google Scholar] [CrossRef]
- Ryu, J.H.; Gong, S.P. Enhanced Enrichment of Medaka Ovarian Germline Stem Cells by a Combination of Density Gradient Centrifugation and Differential Plating. Biomolecules 2020, 10, 1477. [Google Scholar] [CrossRef] [PubMed]
- Wang, D.-S.; Kobayashi, T.; Zhou, L.-Y.; Paul-Prasanth, B.; Ijiri, S.; Sakai, F.; Okubo, K.; Morohashi, K.; Nagahama, Y. Foxl2 Up-Regulates Aromatase Gene Transcription in a Female-Specific Manner by Binding to the Promoter as Well as Interacting with Ad4 Binding Protein/Steroidogenic Factor 1. Mol. Endocrinol. 2007, 21, 712–725. [Google Scholar] [CrossRef] [PubMed]
- Singh, U.; Quintanilla, R.H.; Grecian, S.; Gee, K.R.; Rao, M.S.; Lakshmipathy, U. Novel Live Alkaline Phosphatase Substrate for Identification of Pluripotent Stem Cells. Stem Cell Rev. Rep. 2012, 8, 1021–1029. [Google Scholar] [CrossRef] [PubMed]
- Gong, Z.; Zhang, Q.; Liu, J.; Hu, G.; Chen, S.; Wang, N. Establishment, Characterization and Application in Germplasm Conservation and Disease Resistance: An Embryonic Cell Line from Yangtze Sturgeon (Acipenser dabryanus). Aquaculture 2023, 575, 739807. [Google Scholar] [CrossRef]
- Wang, J.; Fan, C.; Sun, X. Study on the karyotype of two species of Scorpaenidae. Chin. J. Zool. 1994, 29, 14–17. (In Chinese) [Google Scholar]
- Pu, Y.; Yang, J.; Pan, Q.; Li, C.; Wang, L.; Xie, X.; Chen, X.; Xiao, F.; Chen, G. MGST3 Regulates BACE1 Protein Translation and Amyloidogenesis by Controlling the RGS4-Mediated AKT Signaling Pathway. J. Biol. Chem. 2024, 300, 107530. [Google Scholar] [CrossRef]
- Chen, Y.; Feng, Y.; Lin, Y.; Zhou, X.; Wang, L.; Zhou, Y.; Lin, K.; Cai, L. GSTM3 Enhances Radiosensitivity of Nasopharyngeal Carcinoma by Promoting Radiation-Induced Ferroptosis through USP14/FASN Axis and GPX4. Br. J. Cancer 2024, 130, 755–768. [Google Scholar] [CrossRef]
- Chang, Y.; He, J.; Ma, B.; Ishfaq, M.; Wang, J.; Zhang, R.; Yuan, L.; Liu, J.; Li, C.; Liu, F. Prevention of Acetaminophen-Induced Hepatocyte Injury: JNK Inhibition and GSTA1 Involvement. Mol. Cell. Toxicol. 2021, 17, 161–168. [Google Scholar] [CrossRef]
- Robin, M.-A.; Prabu, S.K.; Raza, H.; Anandatheerthavarada, H.K.; Avadhani, N.G. Phosphorylation Enhances Mitochondrial Targeting of GSTA4-4 through Increased Affinity for Binding to Cytoplasmic Hsp70. J. Biol. Chem. 2003, 278, 18960–18970. [Google Scholar] [CrossRef] [PubMed]
- Luo, Y.-P.; Chen, H.-C.; Khan, M.A.; Chen, F.-Z.; Wan, X.-X.; Tan, B.; Ou-Yang, F.-D.; Zhang, D.-Z. Genetic Polymorphisms of Metabolic Enzymes-CYP1A1, CYP2D6, GSTM1, and GSTT1, and Gastric Carcinoma Susceptibility. Tumour Biol. 2011, 32, 215–222. [Google Scholar] [CrossRef] [PubMed]
- Shen, N.-X.; Luo, M.-Y.; Gu, W.-M.; Gong, M.; Lei, H.-M.; Bi, L.; Wang, C.; Zhang, M.-C.; Zhuang, G.; Xu, L.; et al. GSTO1 Aggravates EGFR-TKIs Resistance and Tumor Metastasis via Deglutathionylation of NPM1 in Lung Adenocarcinoma. Oncogene 2024, 43, 2504–2516. [Google Scholar] [CrossRef] [PubMed]
- Sen, N.; Hara, M.R.; Kornberg, M.D.; Cascio, M.B.; Bae, B.-I.; Shahani, N.; Thomas, B.; Dawson, T.M.; Dawson, V.L.; Snyder, S.H.; et al. Nitric Oxide-Induced Nuclear GAPDH Activates P300/CBP and Mediates Apoptosis. Nat. Cell Biol. 2008, 10, 866–873. [Google Scholar] [CrossRef]
- Abdeldayem, A.; Raouf, Y.S.; Constantinescu, S.N.; Moriggl, R.; Gunning, P.T. Advances in Covalent Kinase Inhibitors. Chem. Soc. Rev. 2020, 49, 2617–2687. [Google Scholar] [CrossRef]
- Wang, J.; Li, X.-M.; Bai, Z.; Chi, B.-X.; Wei, Y.; Chen, X. Curcumol Induces Cell Cycle Arrest in Colon Cancer Cells via Reactive Oxygen Species and Akt/ GSK3β/Cyclin D1 Pathway. J. Ethnopharmacol. 2018, 210, 1–9. [Google Scholar] [CrossRef]
- Susanti, N.M.P.; Tjahjono, D.H. Cyclin-Dependent Kinase 4 and 6 Inhibitors in Cell Cycle Dysregulation for Breast Cancer Treatment. Molecules 2021, 26, 4462. [Google Scholar] [CrossRef]
- Horiuchi, D.; Huskey, N.E.; Kusdra, L.; Wohlbold, L.; Merrick, K.A.; Zhang, C.; Creasman, K.J.; Shokat, K.M.; Fisher, R.P.; Goga, A. Chemical-Genetic Analysis of Cyclin Dependent Kinase 2 Function Reveals an Important Role in Cellular Transformation by Multiple Oncogenic Pathways. Proc. Natl. Acad. Sci. USA 2012, 109, E1019–E1027. [Google Scholar] [CrossRef]
- Gordon, E.M.; Ravicz, J.R.; Liu, S.; Chawla, S.P.; Hall, F.L. Cell Cycle Checkpoint Control: The Cyclin G1/Mdm2/P53 Axis Emerges as a Strategic Target for Broad-Spectrum Cancer Gene Therapy—A Review of Molecular Mechanisms for Oncologists. Mol. Clin. Oncol. 2018, 9, 115–134. [Google Scholar] [CrossRef]
- Romero-Pozuelo, J.; Figlia, G.; Kaya, O.; Martin-Villalba, A.; Teleman, A.A. Cdk4 and Cdk6 Couple the Cell-Cycle Machinery to Cell Growth via mTORC1. Cell Rep. 2020, 31, 107504. [Google Scholar] [CrossRef]
- Giordano, M.; Danova, M.; Pellicciari, C.; Wilson, G.D.; Mazzini, G.; Conti, A.M.; Franchini, G.; Riccardi, A.; Romanini, M.G. Proliferating Cell Nuclear Antigen (PCNA)/Cyclin Expression during the Cell Cycle in Normal and Leukemic Cells. Leuk. Res. 1991, 15, 965–974. [Google Scholar] [CrossRef]
- Mir, S.E.; De Witt Hamer, P.C.; Krawczyk, P.M.; Balaj, L.; Claes, A.; Niers, J.M.; Van Tilborg, A.A.G.; Zwinderman, A.H.; Geerts, D.; Kaspers, G.J.L.; et al. In Silico Analysis of Kinase Expression Identifies WEE1 as a Gatekeeper against Mitotic Catastrophe in Glioblastoma. Cancer Cell 2010, 18, 244–257. [Google Scholar] [CrossRef]
- van Leuken, R.; Clijsters, L.; Wolthuis, R. To Cell Cycle, Swing the APC/C. Biochim. Biophys. Acta 2008, 1786, 49–59. [Google Scholar] [CrossRef]
- Weimer, A.K.; Biedermann, S.; Schnittger, A. Specialization of CDK Regulation under DNA Damage. Cell Cycle 2017, 16, 143–144. [Google Scholar] [CrossRef] [PubMed][Green Version]
- Sokhi, S.; Lewis, C.W.; Bukhari, A.B.; Hadfield, J.; Xiao, E.J.; Fung, J.; Yoon, Y.J.; Hsu, W.H.; Gamper, A.M.; Chan, G.K. Myt1 Overexpression Mediates Resistance to Cell Cycle and DNA Damage Checkpoint Kinase Inhibitors. Front. Cell Dev. Biol. 2023, 11, 1270542. [Google Scholar] [CrossRef]
- Chen, Y.; Chen, Y.; Shi, C.; Huang, Z.; Zhang, Y.; Li, S.; Li, Y.; Ye, J.; Yu, C.; Li, Z.; et al. SOAPnuke: A MapReduce Acceleration-Supported Software for Integrated Quality Control and Preprocessing of High-Throughput Sequencing Data. Gigascience 2018, 7, gix120. [Google Scholar] [CrossRef] [PubMed]
- Bolger, A.M.; Lohse, M.; Usadel, B. Trimmomatic: A Flexible Trimmer for Illumina Sequence Data. Bioinformatics 2014, 30, 2114–2120. [Google Scholar] [CrossRef] [PubMed]
- Kim, D.; Langmead, B.; Salzberg, S.L. HISAT: A Fast Spliced Aligner with Low Memory Requirements. Nat. Methods 2015, 12, 357–360. [Google Scholar] [CrossRef]
- Langmead, B.; Salzberg, S.L. Fast Gapped-Read Alignment with Bowtie 2. Nat. Methods 2012, 9, 357–359. [Google Scholar] [CrossRef]
Disclaimer/Publisher’s Note: The statements, opinions and data contained in all publications are solely those of the individual author(s) and contributor(s) and not of MDPI and/or the editor(s). MDPI and/or the editor(s) disclaim responsibility for any injury to people or property resulting from any ideas, methods, instructions or products referred to in the content. |
© 2025 by the authors. Licensee MDPI, Basel, Switzerland. This article is an open access article distributed under the terms and conditions of the Creative Commons Attribution (CC BY) license (https://creativecommons.org/licenses/by/4.0/).