Abstract
The diagnosis of MS relies on a combination of imaging, clinical examinations, and biological analyses, including blood and cerebrospinal fluid (CSF) assessments. G-Oligoclonal bands (OCBs) are considered a “gold standard” for MS diagnosis due to their high sensitivity and specificity. Recent advancements have involved the introduced of kappa free light chain (k-FLC) assay into cerebrospinal fluid (CSF) and serum (S), along with the albumin quotient, leading to the development of a novel biomarker known as the “K-index” or “k-FLC index”. The use of the K-index has been recommended to decrease costs, increase laboratory efficiency, and to skip potential subjective operator-dependent risk that could happen during the identification of OCBs profiles. This review aims to provide a comprehensive overview and analysis of recent scientific articles, focusing on updated methods for MS diagnosis with an emphasis on the utility of the K-index. Numerous studies indicate that the K-index demonstrates high sensitivity and specificity, often comparable to or surpassing the diagnostic accuracy of OCBs evaluation. The integration of the measure of the K-index with OCBs assessment emerges as a more precise method for MS diagnosis. This combined approach not only enhances diagnostic accuracy, but also offers a more efficient and cost-effective alternative.
1. Introduction
MS is a neurodegenerative disorder in which both genetic and environmental factors play a role in promoting an abnormal immune reaction against self-components of the central nervous system (CNS) [1,2]. This progressive disease is characterized by demyelination and gliosis in a complex network of physiological and immune interactions [2,3]. In MS, the clinical evaluation of symptoms and the imaging studies (MRI), together with the analysis of cerebrospinal fluid (CSF) allows the following: (i) a precise diagnosis of the disease, (ii) an accurate monitoring of disease progression, and (iii) where possible, the evaluation of the effects of therapeutic strategies. The analysis of CSF and the alteration of some specific proteins in terms of concentration and forms are crucial for the differential diagnosis of patients affected by MS [4]. From a genetic point of view, high-throughput technology, which measures the simultaneous expression of thousands of genes, has shown high utility for the diagnosis of MS in ruling out MS-mimicking diseases in the early stages of the diagnostic process. Many single-nucleotide polymorphisms (SNPs) involving thousands of patients have been the subject of extensive genome-wide association studies (GWAS), which have identified 110 SNPs associated with MS [5]. Gurevich et al. created a blood gene-expression-based diagnostic classification tool, where findings of gene expression of MS-susceptible loci genes with other highly differentially expressed genes (DEGs) between MS and NonMS patients can be recorded. Interestingly, the authors demonstrated that, at the early stage of the disease, this diagnostic classifier successfully distinguished between CIS patients who were converted into MS and no-MS patients, with a sensitivity of 74.0% and a specificity of 76.0% [5]. Recently, the first meta-analysis of transcriptome investigations in MS has been carried out, evidencing the sex-related molecular processes driving MS [6]. The diagnostic criteria ascertained for MS require evidence of a demyelinating lesion that spreads temporally (DIT: dissemination in time) and spatially (DIS: dissemination in space) in the CNS and are associated with at least one clinical episode of neurological dysfunction [7]. In patients with a typical clinically isolated syndrome (CIS) (one episode of neurological disfunction with features suggestive of MS) and clinical or MRI evidence of DIS, the identification of immunoglobulins Igs) through CSF-specific oligoclonal bands (OCBs) enables the diagnosis of MS [8]. In the latest revision of the MS diagnostic criteria (2017), the detection of oligoclonal IgG bands (OCBs) in the CSF plays an extremely important role, as it allows the criterion of DIS to be replaced [8,9].
In MS, immunoglobulins (IgGs) are a type of antibody protein secreted from B cells and produced in higher quantities within the CNS through a specific inflammatory process called “intrathecal synthesis” [10]. The main involved Igs are IgGs, but the determination of intrathecal IgM appears to be of prognostic significance and is associated with a more aggressive MS disease progression [11]. In MS, these IgGs are all similar, because they are produced by the same cells, and during immunoelectrophoretic analysis, they appear as one or a few homogeneous and narrow bands, known as oligoclonal bands (OCBs) [3,8]. Moreover, IgGs production can be calculated by means of Link’s index, or the IgG index, given by the ratio of IgG quotient (QIgG) to albumin quotient (Qalb), or by means of Reiber’s function [2,12], representing a quantitative parameter. More specifically, Link’s index formula is the following: IgG index = (CSF IgG/IgG serum)/(CSF albumin/albumin serum); it was included in earlier versions of the McDonald criteria, but its diagnostic sensitivity appears to be low [11,13,14]. In both serum and CSF, the isoelectric focusing technique (IEF) is employed to identify IgGs [15]. This technique utilizes pH gradient electrophoresis on a nitrocellulose membrane and specific IgG bands are revealed through immunoelectrophoresis. When specific IgG bands (referred to as oligoclonal bands or OCBs) are detected exclusively in CSF and not in the serum, it suggests a specific activation of immune cells exclusively within the CNS rather than a generalized reaction of the immune system. Laboratory descriptions are often categorize in five common classic patterns: “type 1” (no bands are detected in CSF and serum, and it is considered negative); “type 2” (no bands are detected in serum, only CSF displays oligoclonal IgG bands), and this pattern is indicative of specific intrathecal IgG synthesis; “type 3” (oligoclonal IgG bands in both CSF and serum with additional oligoclonal bands in CSF), which is indicative of intrathecal IgG synthesis; “type 4”, (identical oligoclonal bands are detected in both CSF and in the serum). The presence of these bands in “type 4” are indicative of a systemic immune reaction and not of an intrathecal IgG synthesis, due to oligoclonal bands that can passively move to CSF. And, finally, pattern “type 5” is characterized by a monoclonal band in CSF and in the serum sample; this profile is present in MS-negative patients with plasma cell disease, polyneuropathy, organomegaly, endocrinopathy, M-protein, skin changes (POEMS) syndrome, and monoclonal gammaglobulinemia (MGUS) [16,17]. Pattern types 3 and 4 should be interpreted cautiously and type 4 is often characteristic for Guillain–Barré syndrome [17,18].
The presence of OCBs (type 2 and/or type 3 profiles) in CSF supports the diagnostic certainty for MS in terms of sensitivity and specificity aligning with the McDonald criteria [13,19] and highlighting their pivotal role—they are detected in >90% of MS cases [11]. In recent decades, several studies have explored potential biomarkers for MS. In CSF, the recognition of intrathecal IgG synthesis (detectable by OCBs), in conjunction with a high value of IgG index, can contribute to correctly diagnosing MS [16]. As reported in the McDonald criteria, the presence of OCBs in CSF is considered the gold standard for the qualitative diagnosis of MS [8]. Nevertheless, their determination is time-consuming and subject to an “eye meter analysis”, which requires high expertise and limits the execution to specialized centers [20,21]. Interestingly, in the last few years, new biomarkers for intrathecal synthesis have been discovered since, besides the intact immunoglobulins, an excess of free kappa (KFLC) and lambda light chains (λFLC) has been produced from plasma B cells and accumulated in the CSF of MS patients [21,22]
2. The Role of KFLC in CSF: A Significative Fluid Biomarker
Several studies have been published in the last decades demonstrating that the determination of free κ and λ light chains could represent a new quantitative marker of intrathecal synthesis of immunoglobulins [21]. During the immune reaction, FLCs are the protein chains that are normally produced from plasma cells and activated B cells. During the synthesis of immunoglobulins, FLCs, if not able to bind to the heavy chains of immunoglobulins, are released from the cells and FLCs increase, mainly in MS patients [22,23]. The most frequent tests used in the clinical laboratory for the detection and measurement of FLCs, are based on nephelometric or/and turbidimetric principles. Nephelometry techniques can detect the light scattered by particles in solution by measuring their concentration; while turbidimetry measures the turbidity of a solution by measuring the light scattered or absorbed due to suspended particles. Both techniques are automated, easy to use, cost-effective, and can provide precise concentration information of FLCs [24]. After the introduction of specific immunoassays for nephelometric or turbidimetric free light chain quantitation, several studies have shown higher KFLC index values in clinically isolated syndromes (CISs) or MS compared to other neurological diseases, while the results for free lambda light chains were incompatible [22,25]. Furthermore, the k-isotype of FLC is characterized by a monomeric structure, which might affect the high increment of CSF in cases of chronic intrathecal inflammation in comparison with the dimeric constitution typical of the λ-isotype [26,27]. Nonetheless, both k- and λ-isotypes FLC have a longer half-life in CSF despite having only a few hours of half-life in serum [26]. As a result, according to a recent study, CSF kFLC concentration is higher in MS patients compared to the other groups such as those with immune-mediated CNS disorders (IND), peripheral inflammatory disorders (PIND), non-immune-mediated neurological disorders (NIND), and symptomatic controls (SC), while no differences were found in serum FLCs. On the other hand, CSF λFLC concentration is higher in immune-mediated CNS disorder (IND) patients compared to MS and the other groups [28]. Moreover, recent studies have suggested that FLCs in CSF is a reliable marker of intrathecal immune activation, especially the K-FLC, which is normalized for to albumin quotient [18,22]. More specifically, the CSF FLC value must be corrected for blood–brain barrier (BBB) function to obtain the FLC index by dividing the FLC quotient (CSF FLC/serum FLC) by the albumin quotient (CSF albumin/serum albumin) to minimize the influence of blood–brain barrier permeability and the presence of a monoclonal serum component [22]. Precisely, the K-index and/or λ-index value is obtained via the ratio of the concentrations of the CSF and serum FLC over the ratio of the concentration of albumin in CSF and serum [26,29,30] (Figure 1).
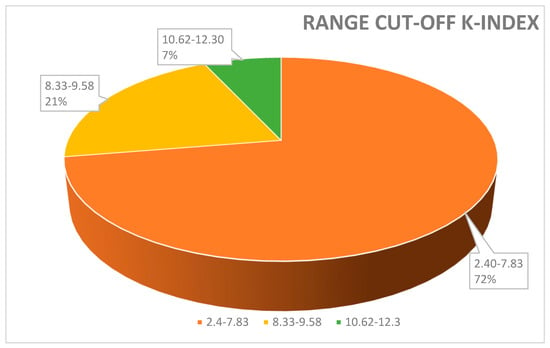
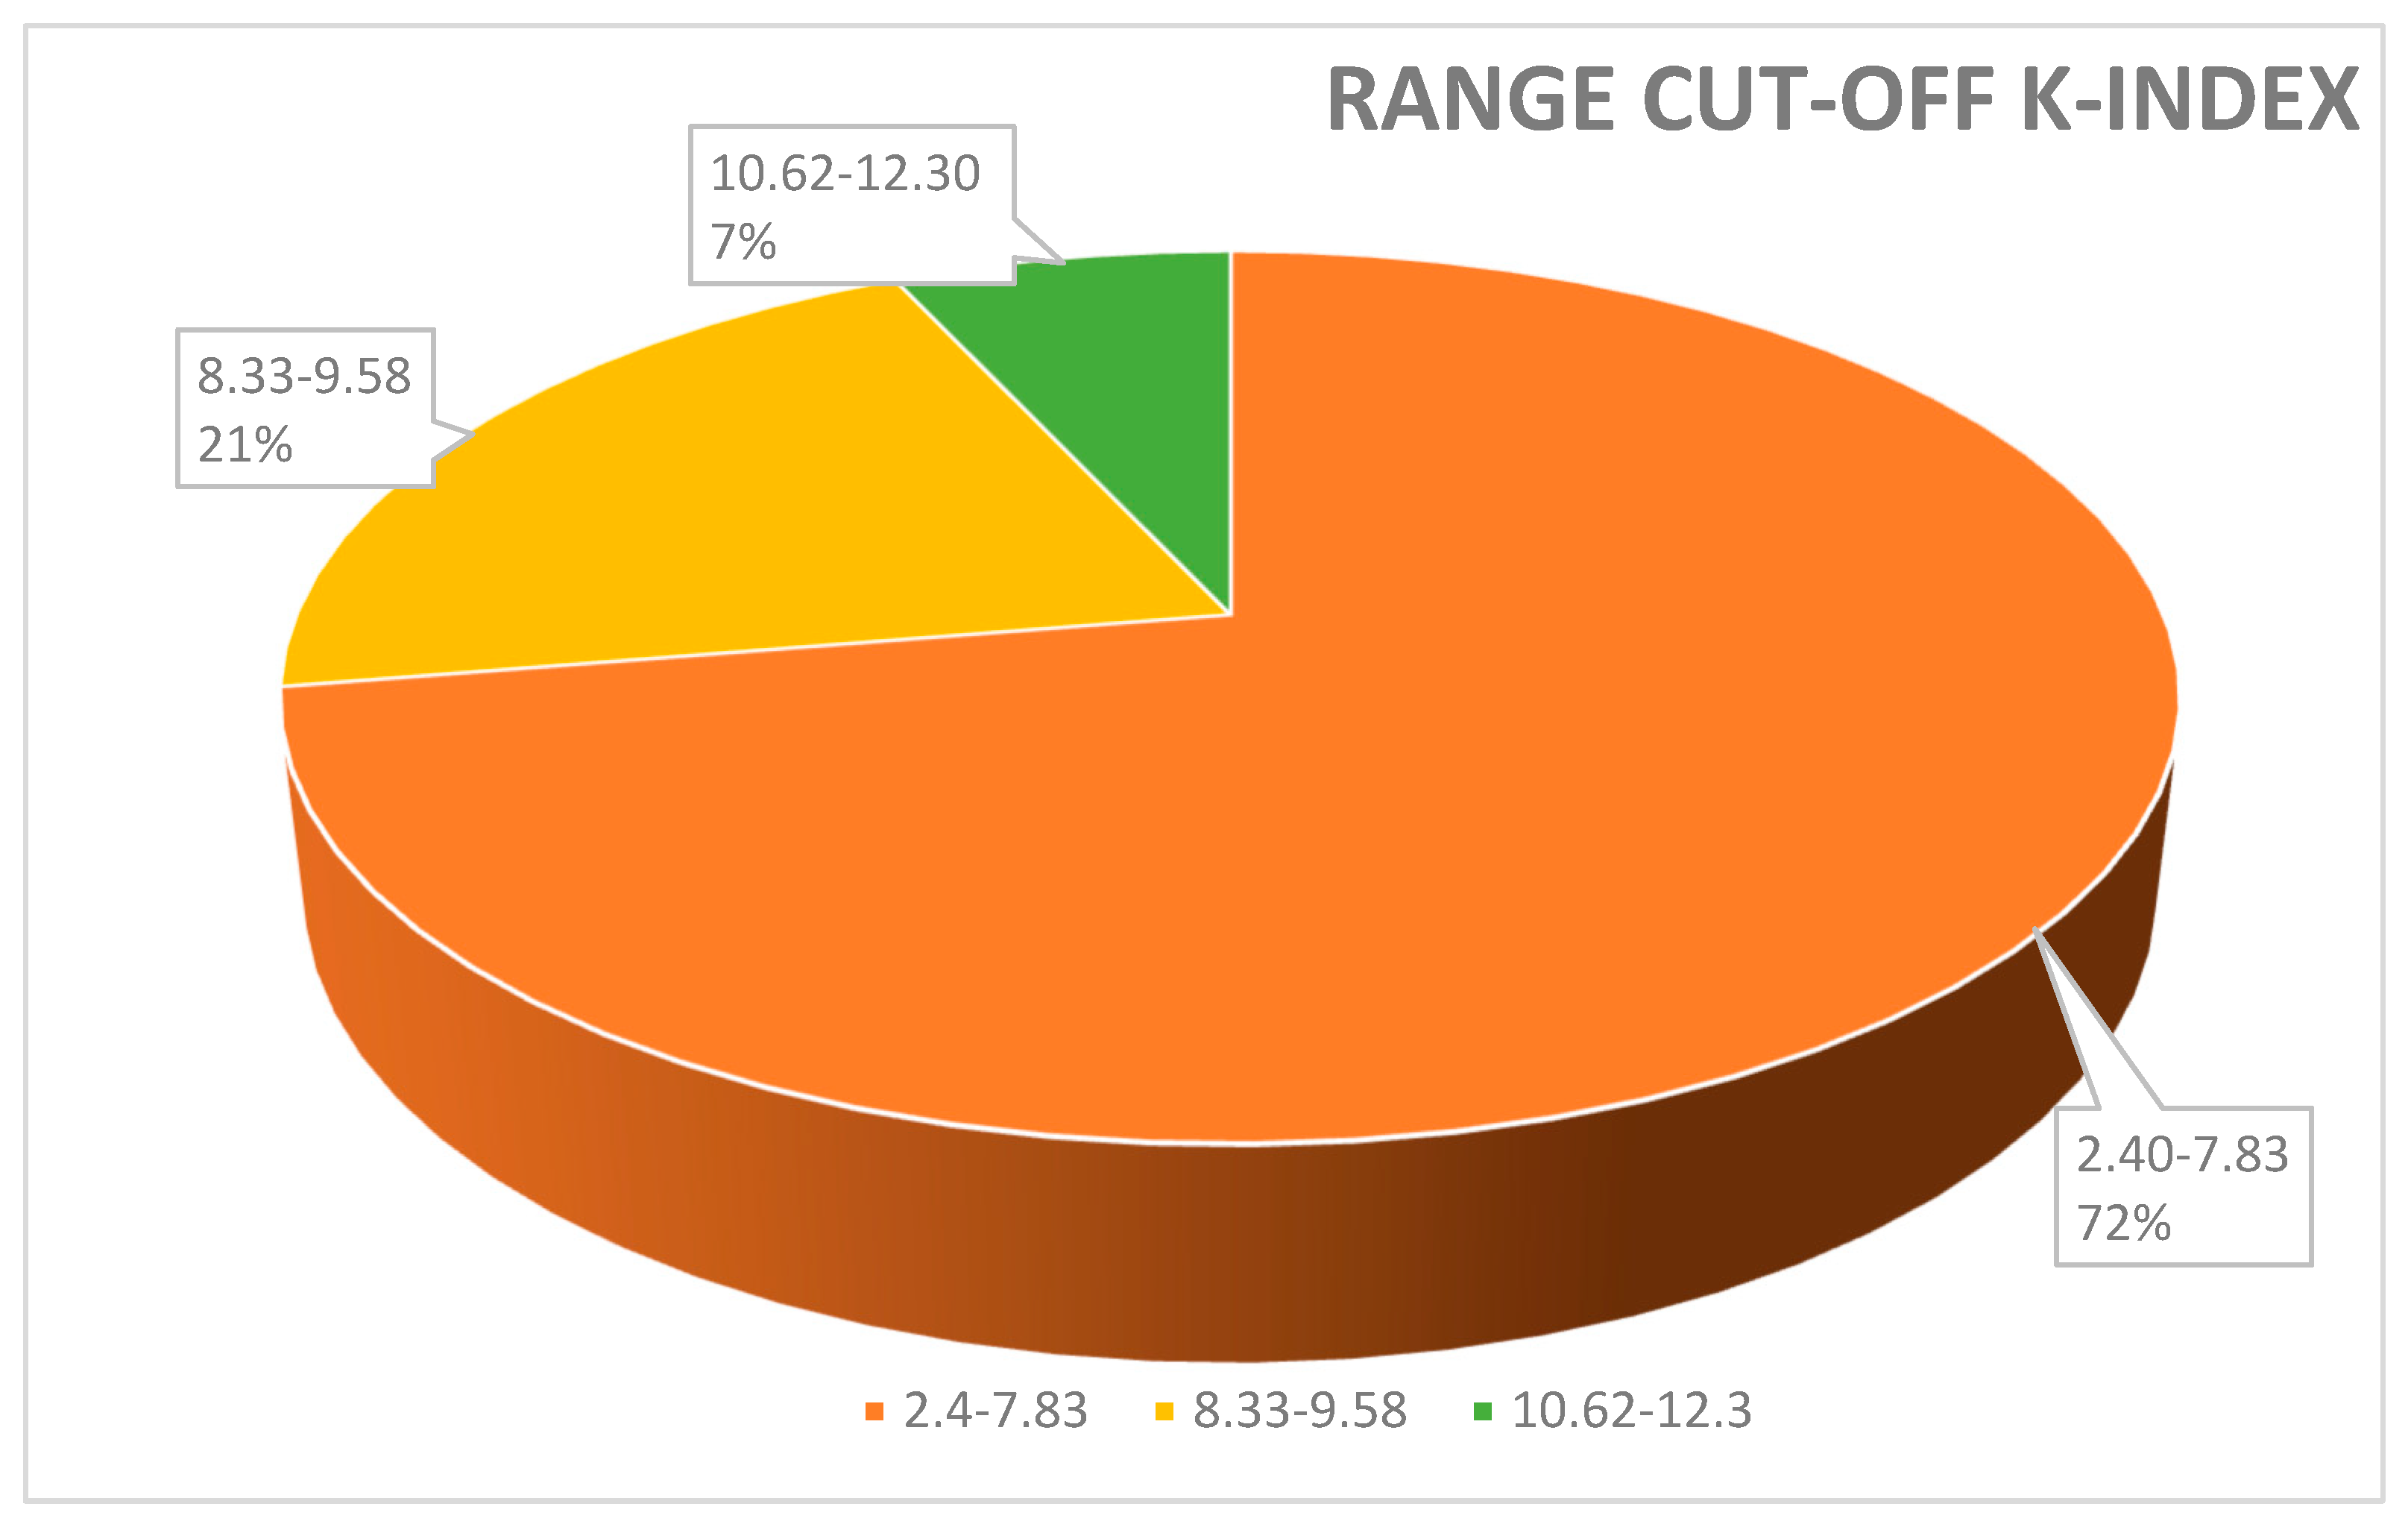
Figure 1.
Range cut-off K-index used to discriminate MS-positive patients from controls. A total of 72% of papers reported a value of K-index cut-off between 2.4 and 7.83; 21% of papers used a cut-off between 8.33 and 9.58. Only a few studies (7%) measured a cut-off K-index range between 10.62 and 12.3%.
In particular, the K-index, compared to an analysis of OCBs, offers several advantages: (i) eliminates the operator-dependent risks (that it could happen during evaluation of the presence of OCBs); (ii) the measure of K-index is acquired within a relatively short timeframe (20–60 min); and, most importantly, (iii) the K-index serves as a quantitative metric [31].
Moreover, considering that McDonald’s criteria suggest caution and reasonableness in using the positive IgG index and the quantification of FLCs is not officially a gold standard yet [8,31], the ordinary use of the K-index demonstrates higher diagnostic accuracy and sensitivity compared to other classic MS biomarkers [16,32,33].
3. Laboratory Challenges in Intrathecal Synthesis Detection
Even though OCB detection is the gold standard for intrathecal immunoglobulin production, this test seems more appropriate as a follow-up methodology in samples chosen based on the findings of a more sensitive test, because the absence of CSF OCBs does not rule out MS, especially in the early stages of the condition [34]. In fact, a meta-analysis indicates that OCB sensitivity appears to be somewhat modest (69%) in patients with CIS, making it challenging to diagnose MS during the first stages of the disease [34]. Considering that, in the last years, (i) the use of K-index has been recommended as a preliminary tool for detecting intrathecal synthesis (useful for differential diagnosis of MS and neuroinflammatory diseases) and (ii) the measure of K-index has been proposed to better understand the progression of the pathology [16], the cut-off value of K-index remains heterogenous, poorly definite, and lacks standardization. It is pivotal to highlight that the identification of a reliable KFLC index cut-off would facilitate its use in clinical practice [21].
Moreover, the kFLC index may be used as an early predictor to enhance prognosis, diagnosis, and therapeutic response monitoring as the value of the K-index might increase from the CIS to the MS phase [35]. In order to contextualize its use in conjunction with OCB identification and the IgG index, we analyzed several clinical papers highlighting the positivity for OCBs and/or type profile bands, the techniques used, the value of the K-index (cut-off), and its measure of sensitivity and specificity (Table 1). In Figure 1 and Figure 2 we described, respectively, the frequency (%) of the K-index cut-off and the technique used. Figure 1 illustrates the variability of the K-index cut-off values: 72% of papers reported a K-index range cut-off 2.4–7.83, used to discriminate MS-positive patients from controls; 21% of papers used a cut-off between 8.33 and 9.58. Finally, to discriminate MS patients from MS-negative patients, only a few studies (7%) measured a K-index cut-off of between 10.62 and 12.3. In Figure 2, the techniques used—Freelite and N-Latex—are shown.

Table 1.
Data about ethnicity, age, sex, and positivity for OCBs and type profile bands, the kind of techniques used, the value of the K-index (cut-off), and diagnostic measure (sensitivity and specificity of several CSF indexes).

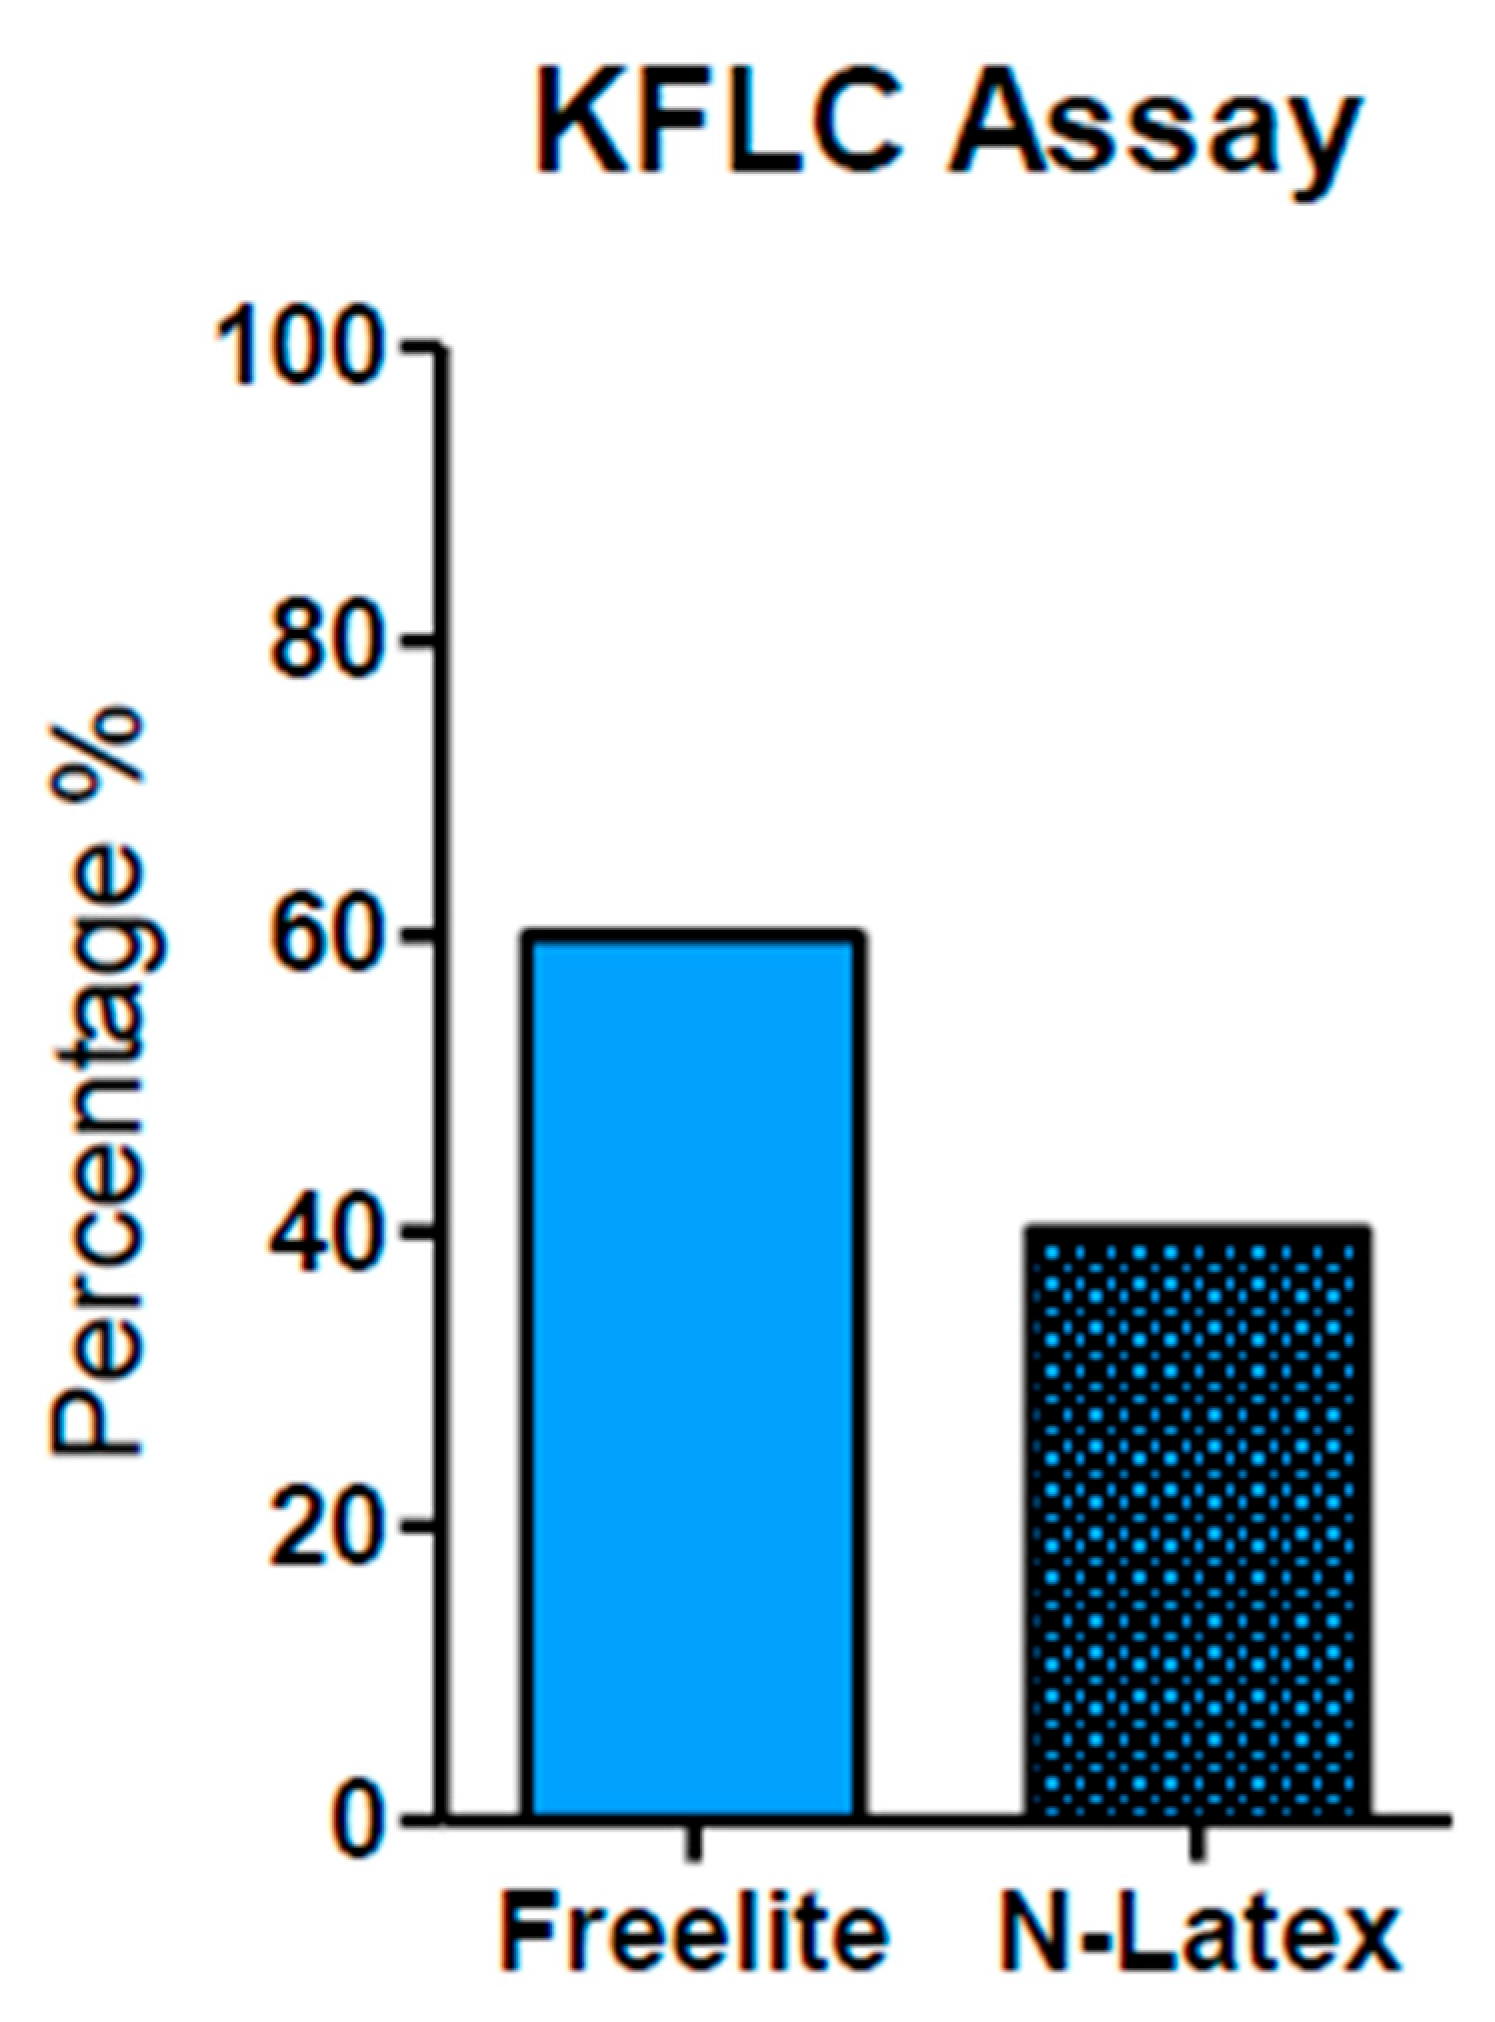
Figure 2.
Techniques used for KFLC measurement. The Freelite analyzer method was used and reported in 63.33% of papers. The N-Latex method was reported in 40%. The Freelite analyzer offers a minimum K-index cut-off value of 5.9 (with sensitivity and specificity of 93% and 95%, respectively).
4. K-index: Population Characteristics
Our investigations, reported in Table 1, encompassed several papers that were performed in sizable population of patients affected by MS (ranging from a minimum of 70 patients to over 1000 individuals). This diverse cohort included various nationality, different age ranges (from 33 to 54 years), and both sexes. As reported in Table 1, in most of the included articles, the K-index and OCBs were obtained considering patients of similar ethnicity, mainly Europeans and Australians. In this context, we did not observe any significant differences regarding the potential impact of ethnicity on K-index.
Notably, sex-based variations in K-index values were observed in women exhibiting a sensitivity and specificity of 90.4% and 100%, respectively, at a K-index of 12.5. In contrast, men displayed values around 11 with sensitivity and specificity at approximately 97.5% and 100%. These findings align with the general reports indicating a higher prevalence of MS in the female sex, highlighting the influence of age, sex, and disease severity on K-index values [29,33,58].
These observations are consistent with the current reports in which men are, on average, older than women at the time of first diagnosis for MS and are more likely to develop a progressively severe form of the disease. In fact, according to several authors that studied the epidemiology of MS, the female sex to male sex ratio is approximately three to one: a pattern observed in various autoimmune diseases [29,59]. These insights further corroborate findings by Levraut et al. in which they reported that the age, female sex, and severity of disease activity could influence K-index values [33]. In addition, the K-index value, which is dependent from albumin concentration, may vary based on sex and age, as male end elderly patients exhibit different concentrations of albumin [30,33].
5. Diagnostic Performance of OCBs and K-index in MS
According to McDonald’s criteria, the evaluation of OCBs is considered to be the gold standard for the differential diagnosis of MS [8]. Our review of the pertinent literature revealed that the OCB value (reported as positivity/or as type of OCBs) showed a minimum value of sensitivity and specificity respectively: 37% for sensitivity [7] and 78% for specificity [33]. In addition, the higher value of OCB sensitivity was 100% [51] and 100% for specificity [7,45,50]. Therefore, the average of sensitivity, respectively, was 86.4% for sensitivity and 87% for specificity. In contrast, the value of the IgG index does not exhibit higher levels of sensitivity and specificity compared to OCBs. These data reinforce the idea that the qualitative identification of OCBs, more so than the measure of the IgG index, shows superior diagnostic performance and that OCBs evaluation is crucial to discriminate MS patients from control patients or those affected by other neurological diseases [22,54,60]. Clinically isolated syndrome (CIS) is characterized by a single monofocal lesion or multifocal lesions at the level of the brainstem, optics nerve, spinal cord, and cerebral hemisphere. CIS represents the earlier clinical expression of MS, and it is often linked to young adults that could later develop MS. As shown in Table 1, some articles that report the measure of OCBs with precise values of sensitivity and specificity allow the identification of MS patients, CIS patients, and patients affected by other neurological diseases (OND) [25,37,41,43].
The use of the K-index represents a quantitative measure of the presence of an intrathecal immune response, and it is important valuable proof for the initial diagnosis of MS [16]. As shown in Table 1, the value of the K-index reported is heterogenous; in fact, most papers reported a value of cut-off between 2.4 to 12.3, and these differences in values could not only be due to different populations and the severity of disease but also to the different kinds of free light kits used. In Table 1, the methods used are also specified: Freelite and N-Latex (Behring, Simiens, Spapalus, Behring, and Optlite).
In terms of diagnostic performance, the K-index exhibited a sensitivity range from 52% to 96% and a specificity between 68% and 100%. The average value of sensitivity of the K-index was 87% and specificity 88%—very close data to the average of OCBs sensitivity (OCBs = 86%) and OCBs specificity (OCBs = 87%). The higher value of K-index sensitivity was 96% [43] and 100% for specificity [50,58]. According to the values highlighted and reported in this review, a reliable K-index value between 4.6 and 6.6 showed comparable diagnostic sensitivity and specificity to OCBs [43,48,52,54]. Generally, a kFLC index cut-off equal to 4.7, compared to the OCB and IgG index, showed greater sensitivity (92.9%) but lower specificity (77.5%) [28]. In addition, considering the advantages regarding the use of the K-index (rapid and automated technique) compared to OCBs, some authors have proposed the use of the K-index as a primary marker instead of the evaluation of OCBs to highlight the intrathecal synthesis of IgG [3,28,38,61].
Figure 1 illustrates the variability in K-index cut-off values: 72% papers reported a K-index cut-off range of 2.4–7.83, used to discriminate MS-positive patients from controls; 21% papers used a cut-off between 8.33 and 9.58. Finally, to discriminate MS patients from MS-negative patients, only a few studies (7%) measured a K-index cut-off between 10.62 and 12.3.
According to most authors, it would be more appropriate to consider the range of the K-index cut-off between 2.4 and 7.8 [32,43,44,48,50], but several problems need to be solved: (i) the lack of an acknowledged global FLC reference standard, (ii) the paucity of information regarding the stability of the CSF matrix, and (iii) the numerous variables that affect kFLC concentration, such as blood [62]. For this reason and given the wide range of cut-off values obtained, it is pivotal to highlight the good agreement in CSF kFLC values throughout all laboratories, despite using various assays and platforms [62]. In this context, Natali et al. (2022) elucidated that there are two certified platforms available for CSF FLC tests (Binding Site and Siemens) which are based on distinct reaction principles and assays (Freelite and N-Latex). In 2011, Siemens was introduced to the market as a nephelometer with a monoclonal antibody-based assay. Binding Site, the earliest platform, has been available since 2001 and employs a turbidimeter. This paper highlights that K-index values between the two certified platforms and, more specifically, between laboratories using the same instrument and assay demonstrated excellent agreement. This can be attributed to the fact that the K-index is a ratio of values obtained from the same instrument, which removes the bias that arises when comparing absolute values [55].
In Figure 2, we can observe that the most common method used to measure KFLC is the Freelite analyzer (Binding Site) (as reported in 63.33% of the total papers). A total of 40% used N-latex (Siemens) as their analysis method. Notably, the Freelite analyzer offers a minimum K-index cut-off value of 5.9 (with sensitivity and specificity of 93% and 95%, respectively) and it seems to represent a sufficient minimum value to discriminate MS-positive patients from controls (no MS). Finally, these data demonstrate that the K-index shows excellent diagnostic performance for MS [25,40].
6. Relationships between the Number of OCBs and the Value of the K-index in MS Severity and/or Progression
In the papers considered in this review, the characterization (profiles) of OCBs was not consistently specified; instead, the term “positive” was occasionally reported to indicate the presence of OCBs. Some reports [7,33,40,41,45,55,56] described the presence of two or more OCBs in CSF, which were undetectable in serum. In only two papers, more than four OCBs were identified in CSF. When two or more OCBs were detected in CSF, the measured K-index varied from 4.6 to 10.6 [32,37].
From Table 1, an association between k-FLC index values and the number of OCBs seems clear. In fact, in patients with patterns 2 and 3 and with >6 CSF-restricted bands exhibited higher kFLC index values compared to those measured in CSF patients with 2 or 3 CSF-restricted bands [42,45]. To identify and separate patients affected by MS and CIS (CIS = early stage of MS, but not all CIS patients convert to MS), only some studies reported precise values of K-index [40]. From all the articles analyzed in this review, it emerges that the evaluation of OCBs is important, and it is strongly recommended in cases where MS diagnosis is uncertain [42]. Although, the discriminatory ability of the K-index (with good clinical sensitivity and specificity) is extensively and well described in all papers that we considered in this review. Only a few papers provided a precise value of the K-index linked to the progression of MS (see Table 1), [47,51]. In Table 1, a high K-index outcome that exceeds the value of 10.61 has been associated with an increased probability of conversion from CIS to MS [40,42,47,55,63]. Moreover, by comparing OCBs with the K-index, some authors reported that the latter is more sensitive but less specific for diagnosing CIS/MS [63]. In summary, while the observations regarding the utility of the K-index in MS diagnosis was well established, the studies about the value of K-index, progression, and risk of severe outcomes in MS are encouraging but still limited, necessitating at the further observations.
7. Laboratory Procedures
In the laboratory, adherence to recent guidelines is crucial. Paired samples of serum (S) and CSF should arrive promptly in the laboratory and should be processed within an hour of collection (to minimize cellular degeneration processes). CSF should be centrifuged for 10 min at 500 rpm at room temperature. Biochemical examination is conducted on the centrifuged CSF supernatant focusing the measure of glucose, albumin, and IgG, which are considered to be basic analytes. Glucose and albumin levels are determined in paired samples of S and CSF, expressing the percentage ratio. The albumin ratio in paired S and CSF is indicative of blood–brain barrier permeability (barrier damage) [39,64]. Regarding the evaluation of OCBs, there is no consensus on reporting. Common criteria include the following five conditions: (i) absence of bands; (ii) presence of single band; (iii) presence of two bands; (iv) presence of some bands (n = 3–6); and (v) presence of numerous bands (n > 6). If not tested immediately, CSF may be held for short periods at 4–8 °C and for the long term and at −80 °C. To better understand how the potential variations in experimental procedures could influence the value of the K-index we described the pre-analytical characteristics that were reported: centrifugation time and temperature of storage. The storage temperature depends on the analytes that needs to be analyzed: immunoglobulins (Ig) can be measured many years after storage at −20 °C, while other proteins, if not analyzed within 2 months, require a storage temperature of −80 °C. To ensure the stability of all markers, a storage temperature of −80 °C is recommended [53]. The detailed laboratory procedures reported in Table 1 reveal variations in storage methods: some authors stored the centrifugated cerebrospinal fluid samples at −80 °C [44,51,52,53,56] and others used samples that were centrifuged and stored at −20 °C until the moment of analysis [28,36,37,38]. Two papers described that the samples were immediately processed after collection [50,54], while one article reported that analyzed samples were processed two hours after collection and stored at 4 °C [57]. As shown in Table 1, despite these differences, no clear connections were observed between the reported K-index cut-off values and sample preservation methods.
8. Genetic Studies as Future Prospective
Recently, next-generation sequencing (NGS) studies have contributed to identifying the presence of a genetic influence on the OCB phenotype [65]. The association of MS to genes in the major histocompatibility complex (MHC) was established early [65], and carriers of the HLA-DRB1*15∶01 allele have more than three times increased risk for the disease [66]. In SNPs selected for replication, combined analyses showed genome-wide, significant association for two SNPs in the HLA complex, correlating with the HLA-DRB1*15 and the HLA-DRB1*04 alleles, respectively. In HLA-DRB1 analyses, HLA-DRB1*15∶01 was a stronger risk factor for OCB-positive than OCB-negative MS, whereas HLA-DRB1*04∶04 was associated with an increased risk of OCB-negative MS and a reduced risk of OCB-positive MS. Protective effects of HLA-DRB1*01∶01 and HLA-DRB1*07∶01 were detected [67,68]. Hence, some authors speculate that the HLA-DRB1*15∶01 allele possibly interacts with environmental agents in areas where this allele is common, making a population more prone to OCB-positive MS. The HLA-DRB1*04 allele may, on the other hand, confer a risk of OCB-negative MS via different immuno-genetic mechanisms [69]. In fact, alleles of the highly polymorphous HLA class II DRB1 gene appear to be the strongest genetic determinant for MS and may influence both predisposition and resistance to the disease [70]. The distinct autoantigenic peptides presented by predisposing alleles have been identified. For instance, DRB1*15:01 binds peptides from the myelin basic protein (MBP), MBP85−99 peptide [67], while DRB5*01:01 presents the MBP86−105 peptide [71] and DRB1*04:01 can display the MBP111−129 peptide [72]. These findings define disease-associated peptide-HLA ligands recognizable by T-cells [73]. In addition, the association between exposure to household chemicals, pest control, and chemical-derived insecticides has been shown to be associated with the risk of developing MS, especially in pediatric onset [74,75]. In future, in order to obtain a specific diagnosis for MS, in advanced laboratories, it could be interesting to explore the association between genetic markers and OCBs.
9. Conclusions
MS is a complex interplay between internal and external factors, inflammatory processes, and neurodegenerative changes, which, chronically and progressively, potentially involve the entire central nervous system [10]. Epidemiological studies have revealed that genes are responsible for the highest specific weight within this disease. The major histocompatibility complex (MHC) has the greatest influence on the risk of developing MS, with its myriad of allelic variants. Besides genetic factors, environmental factors, such as viral infections, exposure to certain toxins, and vitamin D deficiency, may also contribute to the development of MS [76,77,78,79]. By means of genome-wide association (GWAS) studies, it has been shown that multiple variants play a key role in disease susceptibility [80].
In summary, we can conclude the following for MS diagnosis: (i) Comparing the main common markers used in MS, both the values of the K-index and OCBs detection exhibit excellent diagnostic performance (surpassing IgG index and λ -index). In fact, the majority of papers suggest that the K-index and OCBs show similar diagnostic accuracy in terms of sensitivity and specificity. (ii) The best minimum cut-off of the K-index indicated in the majority of papers falls within the range from 2.4 to 7.8 (Figure 2). (iii) The use of the Freelite method is advantageous for obtaining a minimum measure of the K-index (value 5.9) and offers a high value of sensitivity and specificity (Figure 3). In conclusion, from the data obtained from this review, it emerges that, in a laboratory specialized for MS diagnosis, the complementary association of the K-index (quantitative measure) with OCBs (qualitative evaluation) enhances diagnostic accuracy, thereby aiding clinician in achieving a better quality of diagnosis and prognosis, predicting, in some cases, disease severity and progression.
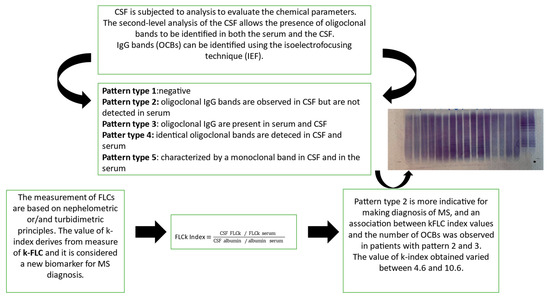
Figure 3.
MS diagnosis: the common flowchart used in a laboratory. Both the K-index and isoelectrofocusing technique (IEF) are performed to characterize/confirm the presence of OCBs.
Author Contributions
M.M. and S.M. contributed to the design of the study, data collection, and manuscript writing. M.P., V.R. and S.B. contributed to data collection, figure creation, and manuscript revision. F.F., S.C., A.V. and M.R. contributed to data collection. All authors have read and agreed to the published version of the manuscript.
Funding
This research received no external funding.
Data Availability Statement
All the date used in this manuscript are available on Pubmed.
Acknowledgments
The authors thank Laura Ioannilli for manuscript revision.
Conflicts of Interest
The authors declare no conflicts of interest, except for Laura Ioannilli, who acts as a medical scientific liaison for the Science Department at Binding Site, part of Thermo Fisher Scientific.
Abbreviations
central nervous system (CNS), multiple sclerosis (MS), clinically isolated syndrome (CIS), serum (S) cerebrospinal fluid (CSF), oligoclonal bands (OCBS), IgG quotient (QIgG), albumin quotient (Qalb), isoelectrofocusing technique (IEF).
References
- Kamińska, J.; Koper, O.M.; Piechal, K.; Kemona, H. Multiple sclerosis—Etiology and diagnostic potential. Postepy Hig. Med. Dosw. 2017, 71, 551–563. [Google Scholar] [CrossRef] [PubMed]
- Jakimovski, D.; Bittner, S.; Zivadinov, R.; Morrow, S.A.; Benedict, R.H.; Zipp, F.; Weinstock-Guttman, B. 339 Multiple sclerosis. Lancet 2024, 403, 183–202. [Google Scholar] [CrossRef] [PubMed]
- Lo Sasso, B.; Agnello, L.; Bivona, G.; Bellia, C.; Ciaccio, M. Cerebrospinal Fluid Analysis in Multiple Sclerosis Diagnosis: An Update. Medicina 2019, 55, 245. [Google Scholar] [CrossRef] [PubMed]
- Solomon, A.J.; Arrambide, G.; Brownlee, W.J.; Flanagan, E.P.; Amato, M.P.; Amezcua, L.; Banwell, B.L.; Barkhof, F.; Corboy, J.R.; Correale, J.; et al. Differential diagnosis of suspected multiple sclerosis: An updated consensus approach. Lancet Neurol. 2023, 22, 750–768. [Google Scholar] [CrossRef] [PubMed]
- Gurevich, M.; Achiron, A. Optimizing multiple sclerosis diagnosis: Gene expression and genomic association. Ann. Clin. Transl. Neurol. 2015, 2, 271–277. [Google Scholar] [CrossRef]
- Català-Senent, J.F.; Andreu, Z.; Hidalgo, M.R.; Soler-Sáez, I.; Roig, F.J.; Yanguas-Casás, N.; Neva-Alejo, A.; López-Cerdán, A.; de la Iglesia-Vayá, M.; Stranger, B.E.; et al. A deep transcriptome meta-analysis reveals sex differences in multiple sclerosis. Neurobiol. Dis. 2023, 181, 106113. [Google Scholar] [CrossRef] [PubMed]
- Ferraro, D.; Trovati, A.; Bedin, R.; Natali, P.; Franciotta, D.; Santangelo, M.; Camera, V.; Vitetta, F.; Varani, M.; Trenti, T.; et al. Cerebrospinal fluid kappa and lambda free light chains in oligoclonal band-negative patients with suspected multiple sclerosis. Eur. J. Neurol. 2020, 27, 461–467. [Google Scholar] [CrossRef]
- Thompson, A.J.; Banwell, B.L.; Barkhof, F.; Carroll, W.M.; Coetzee, T.; Comi, G.; Correale, J.; Fazekas, F.; Filippi, M.; Freedman, M.S.; et al. Diagnosis of multiple sclerosis: 2017 revisions of the McDonald criteria. Lancet Neurol. 2018, 17, 162–173. [Google Scholar] [CrossRef] [PubMed]
- Arrambide, G.; Tintore, M.; Espejo, C.; Auger, C.; Castillo, M.; Río, J.; Castilló, J.; Vidal-Jordana, A.; Galán, I.; Nos, C.; et al. The value of oligoclonal bands in the multiple sclerosis diagnostic criteria. Brain 2018, 141, 1075–1084. [Google Scholar] [CrossRef]
- Ward, M.; Goldman, M.D. Epidemiology and Pathophysiology of Multiple Sclerosis. Continuum 2022, 28, 988–1005. [Google Scholar] [CrossRef]
- Carta, S.; Ferraro, D.; Ferrari, S.; Briani, C.; Mariotto, S. Oligoclonal bands: Clinical utility and interpretation cues. Crit. Rev. Clin. Lab. Sci. 2022, 59, 391–404. [Google Scholar] [CrossRef]
- Reiber, H.; Felgenhauer, K. Protein transfer at the blood cerebrospinal fluid barrier and the quantitation of the humoral immune response within the central nervous system. Clin. Chim. Acta 1987, 163, 319–328. [Google Scholar] [CrossRef] [PubMed]
- Polman, C.H.; Reingold, S.C.; Edan, G.; Filippi, M.; Hartung, H.P.; Kappos, L.; Lublin, F.D.; Metz, L.M.; McFarland, H.F.; O’Connor, P.W.; et al. Diagnostic criteria for multiple sclerosis: 2005 revisions to the “McDonald Criteria”. Ann. Neurol. 2005, 58, 840–846. [Google Scholar] [CrossRef] [PubMed]
- Poser, C.M.; Paty, D.W.; Scheinberg, L.; McDonald, W.I.; Davis, F.A.; Ebers, G.C.; Johnson, K.P.; Sibley, W.A.; Silberberg, D.H.; Tourtellotte, W.W. New diagnostic criteria for multiple sclerosis: Guidelines for research protocols. Ann. Neurol. 1983, 13, 227–231. [Google Scholar] [CrossRef] [PubMed]
- Abid, M.A.; Ahmed, S.; Muneer, S.; Khan, S.; de Oliveira, M.H.S.; Kausar, R.; Siddiqui, I. Evaluation of CSF kappa free light chains for the diagnosis of multiple sclerosis (MS): A comparison with oligoclonal bands (OCB) detection via isoelectric focusing (IEF) coupled with immunoblotting. J. Clin. Pathol. 2023, 76, 353–356. [Google Scholar] [CrossRef]
- Hegen, H.; Milosavljevic, D.; Schnabl, C.; Manowiecka, A.; Walde, J.; Deisenhammer, F.; Presslauer, S. Cerebrospinal fluid free light chains as diagnostic biomarker in neuroborreliosis. Clin. Chem. Lab. Med. 2018, 56, 1383–1391. [Google Scholar] [CrossRef] [PubMed]
- Jin, H.; Lu, Q.; Gao, F.; Hao, H. Application of oligoclonal bands and other cerebrospinal fluid variables in multiple sclerosis and other neuroimmunological diseases: A narrative review. Ann. Transl. Med. 2023, 11, 282. [Google Scholar] [CrossRef] [PubMed]
- Asbury, A.K.; Cornblath, D.R. Assessment of current diagnostic criteria for Guillain-Barre syndrome. Ann. Neurol. 1990, 27, S21–S24. [Google Scholar] [CrossRef] [PubMed]
- Andersson, M.; Alvarez-Cermeno, J.; Bernardi, G.; Cogato, I.; Fredman, P.; Frederiksen, J.; Fredrikson, S.; Gallo, P.; Grimaldi, L.M.; Gronning, M.; et al. Cerebrospinal fluid in the diagnosis of multiple sclerosis: A consensus report. J. Neurol. Neurosurg. Psychiatry 1994, 57, 897–902. [Google Scholar] [CrossRef]
- Freedman, M.S.; Thompson, E.J.; Deisenhammer, F.; Giovannoni, G.; Grimsley, G.; Keir, G.; Ohman, S.; Racke, M.K.; Sharief, M.; Sindic, C.J.; et al. Recommended standard of cerebrospinal fluid analysis in the diagnosis of multiple sclerosis: A consensus statement. Arch. Neurol. 2005, 62, 865–870. [Google Scholar] [CrossRef]
- Arrambide, G.; Espejo, C.; Carbonell-Mirabent, P.; Dieli-Crimi, R.; Rodríguez-Barranco, M.; Castillo, M.; Auger, C.; Cárdenas-Robledo, S.; Castilló, J.; Cobo-Calvo, Á.; et al. The kappa free light chain index and oligoclonal bands have a similar role in the McDonald criteria. Brain 2022, 145, 3931–3942. [Google Scholar] [CrossRef]
- Presslauer, S.; Milosavljevic, D.; Brucke, T.; Bayer, P.; Hubl, W. Elevated levels of kappa free light chains in CSF support the diagnosis of multiple sclerosis. J. Neurol. 2008, 255, 1508–1514. [Google Scholar] [CrossRef]
- Gaetani, L.; Paolini Paoletti, F.; Bellomo, G.; Mancini, A.; Simoni, S.; Di Filippo, M.; Parnetti, L. CSF and Blood Biomarkers in Neuroinflammatory and Neurodegenerative Diseases: Implications for Treatment. Trends Pharmacol. Sci. 2020, 41, 1023–1037. [Google Scholar] [CrossRef]
- Messiaen, A.S.; De Sloovere, M.M.W.; Claus, P.E.; Vercammen, M.; Van Hoovels, L.; Heylen, O.; Debrabandere, J.; Vanpoucke, H.; De Smet, D. Performance Evaluation of Serum Free Light Chain Analysis: Nephelometry vs Turbidimetry, Monoclonal vs Polyclonal Reagents. Am. J. Clin. Pathol. 2017, 147, 611–622. [Google Scholar] [CrossRef]
- Presslauer, S.; Milosavljevic, D.; Huebl, W.; Aboulenein-Djamshidian, F.; Krugluger, W.; Deisenhammer, F.; Senel, M.; Tumani, H.; Hegen, H. Validation of kappa free light chains as a diagnostic biomarker in multiple sclerosis and clinically isolated syndrome: A multicenter study. Mult. Scler. 2016, 22, 502–510. [Google Scholar] [CrossRef] [PubMed]
- Nakano, T.; Matsui, M.; Inoue, I.; Awata, T.; Katayama, S.; Murakoshi, T. Free immunoglobulin light chain: Its biology and implications in diseases. Clin. Chim. Acta 2011, 412, 843–849. [Google Scholar] [CrossRef] [PubMed]
- Bernardi, G.; Biagioli, T.; Malpassi, P.; De Michele, T.; Vecchio, D.; Repice, A.M.; Lugaresi, A.; Mirabella, M.; Torri Clerici, V.; Crespi, I. The contribute of cerebrospinal fluid free light-chain assay in the diagnosis of multiple sclerosis and other neurological diseases in an Italian multicenter study. Mult. Scler. 2022, 28, 1364–1372. [Google Scholar] [CrossRef] [PubMed]
- Michetti, L.; Maffina, F.; Ravasio, R.; Barcella, V.; Radaelli, M.; Chiudinelli, L.; Sessa, M.; Alessio, M.G. Free light chains as a reliable biomarker of intrathecal synthesis in the diagnosis of CNS inflammatory diseases. J. Neuroimmunol. 2023, 379, 578091. [Google Scholar] [CrossRef]
- Miclea, A.; Salmen, A.; Zoehner, G.; Diem, L.; Kamm, C.P.; Chaloulos-Iakovidis, P.; Miclea, M.; Briner, M.; Kilidireas, K.; Stefanis, L.; et al. Age-dependent variation of female preponderance across different phenotypes of multiple sclerosis: A retrospective cross-sectional study. CNS Neurosci. Ther. 2019, 25, 527–531. [Google Scholar] [CrossRef]
- Weaving, G.; Batstone, G.F.; Jones, R.G. Age and sex variation in serum albumin concentration: An observational study. Ann. Clin. Biochem. 2016, 53, 106–111. [Google Scholar] [CrossRef]
- Duranti, F.; Pieri, M.; Centonze, D.; Buttari, F.; Bernardini, S.; Dessi, M. Determination of κFLC and κ index in cerebrospinal fluid: A valid alternative to assess intrathecal immunoglobulin synthesis. J. Neuroimmunol. 2013, 263, 116–120. [Google Scholar] [CrossRef] [PubMed]
- Christiansen, M.; Gjelstrup, M.C.; Stilund, M.; Christensen, T.; Petersen, T.; Jon Møller, H. Cerebrospinal fluid free kappa light chains and kappa index perform equal to oligoclonal bands in the diagnosis of multiple sclerosis. Clin. Chem. Lab. Med. 2018, 57, 210–220. [Google Scholar] [CrossRef] [PubMed]
- Levraut, M.; Laurent-Chabalier, S.; Ayrignac, X.; Bigaut, K.; Rival, M.; Squalli, S.; Zephir, H.; Alberto, T.; Pekar, J.D.; Ciron, J.; et al. Kappa Free Light Chain Biomarkers Are Efficient for the Diagnosis of Multiple Sclerosis: A Large Multicenter Cohort Study. Neurol. Neuroimmunol. Neuroinflamm. 2023, 10, e200049. [Google Scholar] [CrossRef] [PubMed]
- Alves Martins, D.; Lopes, J.; Martins da Silva, A.; Morais, C.I.; Vasconcelos, J.; Lima, I.; Carneiro, C.; Neves, E. Kappa free light chains: Diagnostic performance in multiple sclerosis and utility in a clinical laboratory. Clin. Chim. Acta 2022, 528, 56–64. [Google Scholar] [CrossRef] [PubMed]
- Fabio, D.; Massimo, P.; Rossella, Z.; Diego, C.; Fabio, B.; Sergio, B.; Mariarita, D. kFLC index: A novel approach in early diagnosis of Multiple Sclerosis. Int. J. Sci. Res. 2015, 4, 1–2. [Google Scholar] [CrossRef]
- Passerini, G.; Dalla Costa, G.; Sangalli, F.; Moiola, L.; Colombo, B.; Locatelli, M.; Comi, G.; Furlan, R.; Martinelli, V. Free Light Chains and Intrathecal B Cells Activity in Multiple Sclerosis: A Prospective Study and Meta-Analysis. Mult. Scler. Int. 2016, 2016, 2303857. [Google Scholar] [CrossRef] [PubMed]
- Gurtner, K.M.; Shosha, E.; Bryant, S.C.; Andreguetto, B.D.; Murray, D.L.; Pittock, S.J.; Willrich, M.A.V. CSF free light chain identification of demyelinating disease: Comparison with oligoclonal banding and other CSF indexes. Clin. Chem. Lab. Med. 2018, 56, 1071–1080. [Google Scholar] [CrossRef] [PubMed]
- Valencia-Vera, E.; Martinez-Escribano Garcia-Ripoll, A.; Enguix, A.; Abalos-Garcia, C.; Segovia-Cuevas, M.J. Application of kappa free light chains in cerebrospinal fluid as a biomarker in multiple sclerosis diagnosis: Development of a diagnosis algorithm. Clin. Chem. Lab. Med. 2018, 56, 609–613. [Google Scholar] [CrossRef] [PubMed]
- Vasilj, M.; Kes, V.B.; Vrkic, N.; Vukasovic, I. Relevance of KFLC quantification to differentiate clinically isolated syndrome from multiple sclerosis at clinical onset. Clin. Neurol. Neurosurg. 2018, 174, 220–229. [Google Scholar] [CrossRef]
- Menendez-Valladares, P.; Garcia-Sanchez, M.I.; Adorna Martinez, M.; Garcia De Veas Silva, J.L.; Bermudo Guitarte, C.; Izquierdo Ayuso, G. Validation and meta-analysis of kappa index biomarker in multiple sclerosis diagnosis. Autoimmun. Rev. 2019, 18, 43–49. [Google Scholar] [CrossRef]
- Senel, M.; Mojib-Yezdani, F.; Braisch, U.; Bachhuber, F.; Lewerenz, J.; Ludolph, A.C.; Otto, M.; Tumani, H. CSF Free Light Chains as a Marker of Intrathecal Immunoglobulin Synthesis in Multiple Sclerosis: A Blood-CSF Barrier Related Evaluation in a Large Cohort. Front. Immunol. 2019, 10, 641. [Google Scholar] [CrossRef] [PubMed]
- Crespi, I.; Vecchio, D.; Serino, R.; Saliva, E.; Virgilio, E.; Sulas, M.G.; Bellomo, G.; Dianzani, U.; Cantello, R.; Comi, C. K index is a Reliable Marker of Intrathecal Synthesis, and an Alternative to IgG index in Multiple Sclerosis Diagnostic Work-Up. J. Clin. Med. 2019, 8, 446. [Google Scholar] [CrossRef] [PubMed]
- Emersic, A.; Anadolli, V.; Krsnik, M.; Rot, U. Intrathecal immunoglobulin synthesis: The potential value of an adjunct test. Clin. Chim. Acta 2019, 489, 109–116. [Google Scholar] [CrossRef] [PubMed]
- Schwenkenbecher, P.; Konen, F.F.; Wurster, U.; Witte, T.; Gingele, S.; Suhs, K.W.; Stangel, M.; Skripuletz, T. Reiber’s Diagram for Kappa Free Light Chains: The New Standard for Assessing Intrathecal Synthesis? Diagnostics 2019, 9, 194. [Google Scholar] [CrossRef] [PubMed]
- Reiber, H.; Zeman, D.; Kusnierova, P.; Mundwiler, E.; Bernasconi, L. Diagnostic relevance of free light chains in cerebrospinal fluid—The hyperbolic reference range for reliable data interpretation in quotient diagrams. Clin. Chim. Acta 2019, 497, 153–162. [Google Scholar] [CrossRef]
- Saez, M.S.; Rojas, J.I.; Lorenzon, M.V.; Sanchez, F.; Patrucco, L.; Miguez, J.; Azcona, C.; Sorroche, P.; Cristiano, E. Validation of CSF free light chain in diagnosis and prognosis of multiple sclerosis and clinically isolated syndrome: Prospective cohort study in Buenos Aires. J. Neurol. 2019, 266, 112–118. [Google Scholar] [CrossRef] [PubMed]
- Gaetani, L.; Di Carlo, M.; Brachelente, G.; Valletta, F.; Eusebi, P.; Mancini, A.; Gentili, L.; Borrelli, A.; Calabresi, P.; Sarchielli, P.; et al. Cerebrospinal fluid free light chains compared to oligoclonal bands as biomarkers in multiple sclerosis. J. Neuroimmunol. 2020, 339, 577108. [Google Scholar] [CrossRef]
- Cavalla, P.; Caropreso, P.; Limoncelli, S.; Bosa, C.; Pasanisi, M.B.; Schillaci, V.; Alteno, A.; Costantini, G.; Giordana, M.T.; Mengozzi, G.; et al. Kappa free light chains index in the differential diagnosis of Multiple Sclerosis from Neuromyelitis optica spectrum disorders and other immune-mediated central nervous system disorders. J. Neuroimmunol. 2020, 339, 577122. [Google Scholar] [CrossRef]
- Leurs, C.E.; Twaalfhoven, H.A.M.; Lissenberg-Witte, B.I.; Van Pesch, V.; Dujmovic, I.; Drulovic, J.; Castellazzi, M.; Bellini, T.; Pugliatti, M.; Kuhle, J.; et al. Kappa free light chains is a valid tool in the diagnostics of MS: A large multicenter study. Mult. Scler. 2020, 26, 912–923. [Google Scholar] [CrossRef]
- Duell, F.; Evertsson, B.; Al Nimer, F.; Sandin, A.; Olsson, D.; Olsson, T.; Khademi, M.; Hietala, M.A.; Piehl, F.; Hansson, M. Diagnostic accuracy of intrathecal kappa free light chains compared with OCBs in MS. Neurol. Neuroimmunol. Neuroinflamm. 2020, 7, e775. [Google Scholar] [CrossRef]
- Gudowska-Sawczuk, M.; Tarasiuk, J.; Kulakowska, A.; Kochanowicz, J.; Mroczko, B. Kappa Free Light Chains and IgG Combined in a Novel Algorithm for the Detection of Multiple Sclerosis. Brain Sci. 2020, 10, 324. [Google Scholar] [CrossRef] [PubMed]
- Ferraro, D.; Bedin, R.; Natali, P.; Franciotta, D.; Smolik, K.; Santangelo, M.; Immovilli, P.; Camera, V.; Vitetta, F.; Gastaldi, M.; et al. Kappa index Versus CSF Oligoclonal Bands in Predicting Multiple Sclerosis and Infectious/Inflammatory CNS Disorders. Diagnostics 2020, 10, 856. [Google Scholar] [CrossRef] [PubMed]
- Sanz Diaz, C.T.; de Las Heras Florez, S.; Carretero Perez, M.; Hernandez Perez, M.A.; Martin Garcia, V. Evaluation of Kappa Index as a Tool in the Diagnosis of Multiple Sclerosis: Implementation in Routine Screening Procedure. Front. Neurol. 2021, 12, 676527. [Google Scholar] [CrossRef] [PubMed]
- Rosenstein, I.; Axelsson, M.; Novakova, L.; Rasch, S.; Blennow, K.; Zetterberg, H.; Lycke, J. High levels of kappa free light chain synthesis predict cognitive decline in relapsing-remitting multiple sclerosis. Front. Immunol. 2023, 14, 1106028. [Google Scholar] [CrossRef] [PubMed]
- Berek, K.; Bsteh, G.; Auer, M.; Di Pauli, F.; Grams, A.; Milosavljevic, D.; Poskaite, P.; Schnabl, C.; Wurth, S.; Zinganell, A.; et al. Kappa-Free Light Chains in CSF Predict Early Multiple Sclerosis Disease Activity. Neurol. Neuroimmunol. Neuroinflamm. 2021, 8, e1005. [Google Scholar] [CrossRef]
- Monreal, E.; Fernandez-Velasco, J.I.; Garcia-Soidan, A.; Sainz de la Maza, S.; Espino, M.; Villarrubia, N.; Rodriguez-Jorge, F.; Chico-Garcia, J.L.; Sainz-Amo, R.; Masjuan, J.; et al. Establishing the best combination of the kappa free light chain index and oligoclonal bands for an accurate diagnosis of multiple sclerosis. Front. Immunol. 2023, 14, 1288169. [Google Scholar] [CrossRef]
- Zondra Revendova, K.; Svub, K.; Bunganic, R.; Pelisek, O.; Volny, O.; Ganesh, A.; Bar, M.; Zeman, D.; Kusnierova, P. A comparison of measles-rubella-zoster reaction, oligoclonal IgG bands, oligoclonal kappa free light chains and kappa index in multiple sclerosis. Mult. Scler. Relat. Disord. 2024, 81, 105125. [Google Scholar] [CrossRef] [PubMed]
- Pieri, M.; Zenobi, R.; Morello, M.; Storto, M.; Buttari, F.; Centonze, D.; Bernardini, S.; Dessi, M. Multiple Sclerosis: kFLC index values related to gender. Mult. Scler. Relat. Disord. 2018, 26, 58–60. [Google Scholar] [CrossRef] [PubMed]
- Koch-Henriksen, N.; Sorensen, P.S. The changing demographic pattern of multiple sclerosis epidemiology. Lancet Neurol. 2010, 9, 520–532. [Google Scholar] [CrossRef]
- Hassan-Smith, G.; Durant, L.; Tsentemeidou, A.; Assi, L.K.; Faint, J.M.; Kalra, S.; Douglas, M.R.; Curnow, S.J. High sensitivity and specificity of elevated cerebrospinal fluid kappa free light chains in suspected multiple sclerosis. J. Neuroimmunol. 2014, 276, 175–179. [Google Scholar] [CrossRef]
- Gudowska-Sawczuk, M.; Moniuszko-Malinowska, A.; Paczek, S.; Guziejko, K.; Chorazy, M.; Mroczko, B. Evaluation of Free Light Chains (FLCs) Synthesis in Response to Exposure to SARS-CoV-2. Int. J. Mol. Sci. 2022, 23, 1589. [Google Scholar] [CrossRef] [PubMed]
- Natali, P.; Bedin, R.; Bernardi, G.; Corsini, E.; Cocco, E.; Schirru, L.; Crespi, I.; Lamonaca, M.; Sala, A.; Nicolò, C.; et al. Inter-Laboratory Concordance of Cerebrospinal Fluid and Serum Kappa Free Light Chain Measurements. Biomolecules 2022, 12, 677. [Google Scholar] [CrossRef] [PubMed]
- Vecchio, D.; Crespi, I.; Virgilio, E.; Naldi, P.; Campisi, M.P.; Serino, R.; Dianzani, U.; Bellomo, G.; Cantello, R.; Comi, C. Kappa free light chains could predict early disease course in multiple sclerosis. Mult. Scler. Relat. Disord. 2019, 30, 81–84. [Google Scholar] [CrossRef]
- Bernardi, G.; Brunati, P.; Biagioli, T.; Buoro, S.; Cataldo, I.; Ciusani, E.; Corsini, E.; Dessì, M.; Fanelli, A.; Muratore, M.T.; et al. L’analisi del liquido cefalorachidiano. Biochim. Clin. 2014, 38, 238–254. [Google Scholar]
- Jersild, C.; Svejgaard, A.; Fog, T. HL-A antigens and multiple sclerosis. Lancet 1972, 1, 1240–1241. [Google Scholar] [CrossRef] [PubMed]
- The International Multiple Sclerosis Consortium (IMSGC); Wellcome Trust Case Control Consortium 2 (WTCCC2). Genetic risk and a primary role for cell-mediated immune mechanisms in multiple sclerosis. Nature 2011, 476, 214–219. [Google Scholar] [CrossRef] [PubMed]
- Smith, K.J.; Pyrdol, J.; Gauthier, L.; Wiley, D.C.; Wucherpfennig, K.W. Crystal Structure of HLA-DR2 (DRA*0101, DRB1*1501) complexed with a peptide from human myelin basic protein. J. Exp. Med. 1998, 188, 1511–1520. [Google Scholar] [CrossRef] [PubMed]
- Mero, I.L.; Gustavsen, M.W.; Sæther, H.S.; Flåm, S.T.; Berg-Hansen, P.; Søndergaard, H.B.; Jensen, P.E.H.; Berge, T.; Bjølgerud, A.; Muggerud, A.; et al. Oligoclonal Band Status in Scandinavian Multiple Sclerosis Patients Is Associated with Specific Genetic Risk Alleles. PLoS ONE 2013, 8, e58352. [Google Scholar] [CrossRef]
- Canto, E.; Oksenberg, J.R. Multiple sclerosis genetics. Mult. Scler. 2018, 24, 75–79. [Google Scholar] [CrossRef]
- Zhang, Q.; Lin, C.Y.; Dong, Q.; Wang, J.; Wang, W. Relationship between HLA-DRB1 polymorphism and susceptibility or resistance to multiple sclerosis in Caucasians: A meta-analysis of non-family-based studies. Autoimmun. Rev. 2011, 10, 474–481. [Google Scholar] [CrossRef]
- Li, Y.; Li, H.; Martin, R.; Mariuzza, R.A. Structural basis for the binding of an immunodominant peptide from myelin basic protein in different registers by two HLA-DR2 proteins. J. Mol. Biol. 2000, 304, 177–188. [Google Scholar] [CrossRef] [PubMed]
- Yin, Y.; Li, Y.; Kerzic, M.C.; Martin, R.; Mariuzza, R.A. Structure of a TCR with high affinity for self-antigen reveals basis for escape from negative selection. EMBO J. 2011, 30, 1137–1148. [Google Scholar] [CrossRef]
- Li, Y.; Huang, Y.; Lue, J.; Quandt, J.A.; Martin, R.; Mariuzza, R.A. Structure of a human autoimmune TCR bound to a myelin basic protein self-peptide and a multiple sclerosis-associated MHC class II molecule. EMBO J. 2005, 24, 2968–2979. [Google Scholar] [CrossRef]
- Nasr, Z.; Schoeps, V.A.; Ziaei, A.; Virupakshaiah, A.; Adams, C.; Casper, T.C.; Waltz, M.; Rose, J.; Rodriguez, M.; Tillema, J.M.; et al. Gene-environment interactions increase the risk of paediatric-onset multiple sclerosis associated with household chemical exposures. J. Neurol. Neurosurg. Psychiatry 2023, 94, 518–525. [Google Scholar] [CrossRef] [PubMed]
- Mar, S.; Liang, S.; Waltz, M.; Casper, T.C.; Goyal, M.; Greenberg, B.; Weinstock-Guttman, B.; Rodriguez, M.; Aaen, G.; Belman, A.; et al. Several household chemical exposures are associated with pediatric-onset multiple sclerosis. Ann. Clin. Transl. Neurol. 2018, 5, 1513–1521. [Google Scholar] [CrossRef]
- Dyment, D.A.; Yee, I.M.; Ebers, G.C.; Sadovnick, A.D. Multiple sclerosis in stepsiblings: Recurrence risk and ascertainment. J. Neurol. Neurosurg. Psychiatry 2006, 77, 258–259. [Google Scholar] [CrossRef]
- Hemminki, K.; Li, X.; Sundquist, J.; Hillert, J.; Sundquist, K. Risk for multiple sclerosis in relatives and spouses of patients diagnosed with autoimmune and related conditions. Neurogenetics 2009, 10, 5–11. [Google Scholar] [CrossRef] [PubMed]
- The International Multiple Sclerosis Genetics Consortium (IMSGC). A high-density screen for linkage in multiple sclerosis. Am. J. Hum. Genet. 2005, 77, 454–467. [Google Scholar] [CrossRef]
- Bhargava, P.; Fitzgerald, K.C.; Calabresi, P.A.; Mowry, E.M. Metabolic alterations in multiple sclerosis and the impact of vitamin D supplementation. JCI Insight 2017, 2, e95302. [Google Scholar] [CrossRef]
- International Multiple Sclerosis Genetics Consortium (IMSGC); Bush, W.S.; Sawcer, S.J.; de Jager, P.L.; Oksenberg, J.R.; McCauley, J.L.; Pericak-Vance, M.A.; Haines, J.L. Evidence for polygenic susceptibility to multiple sclerosis--the shape of things to come. Am. J. Hum. Genet. 2010, 86, 621–625. [Google Scholar] [CrossRef]

Disclaimer/Publisher’s Note: The statements, opinions and data contained in all publications are solely those of the individual author(s) and contributor(s) and not of MDPI and/or the editor(s). MDPI and/or the editor(s) disclaim responsibility for any injury to people or property resulting from any ideas, methods, instructions or products referred to in the content. |
© 2024 by the authors. Licensee MDPI, Basel, Switzerland. This article is an open access article distributed under the terms and conditions of the Creative Commons Attribution (CC BY) license (https://creativecommons.org/licenses/by/4.0/).