
Meibomian Gland Dysfunction Is Associated with Low Levels of Immunoglobulin Chains and Cystatin-SN

 , , , ,
Abstract
:1. Introduction
2. Results
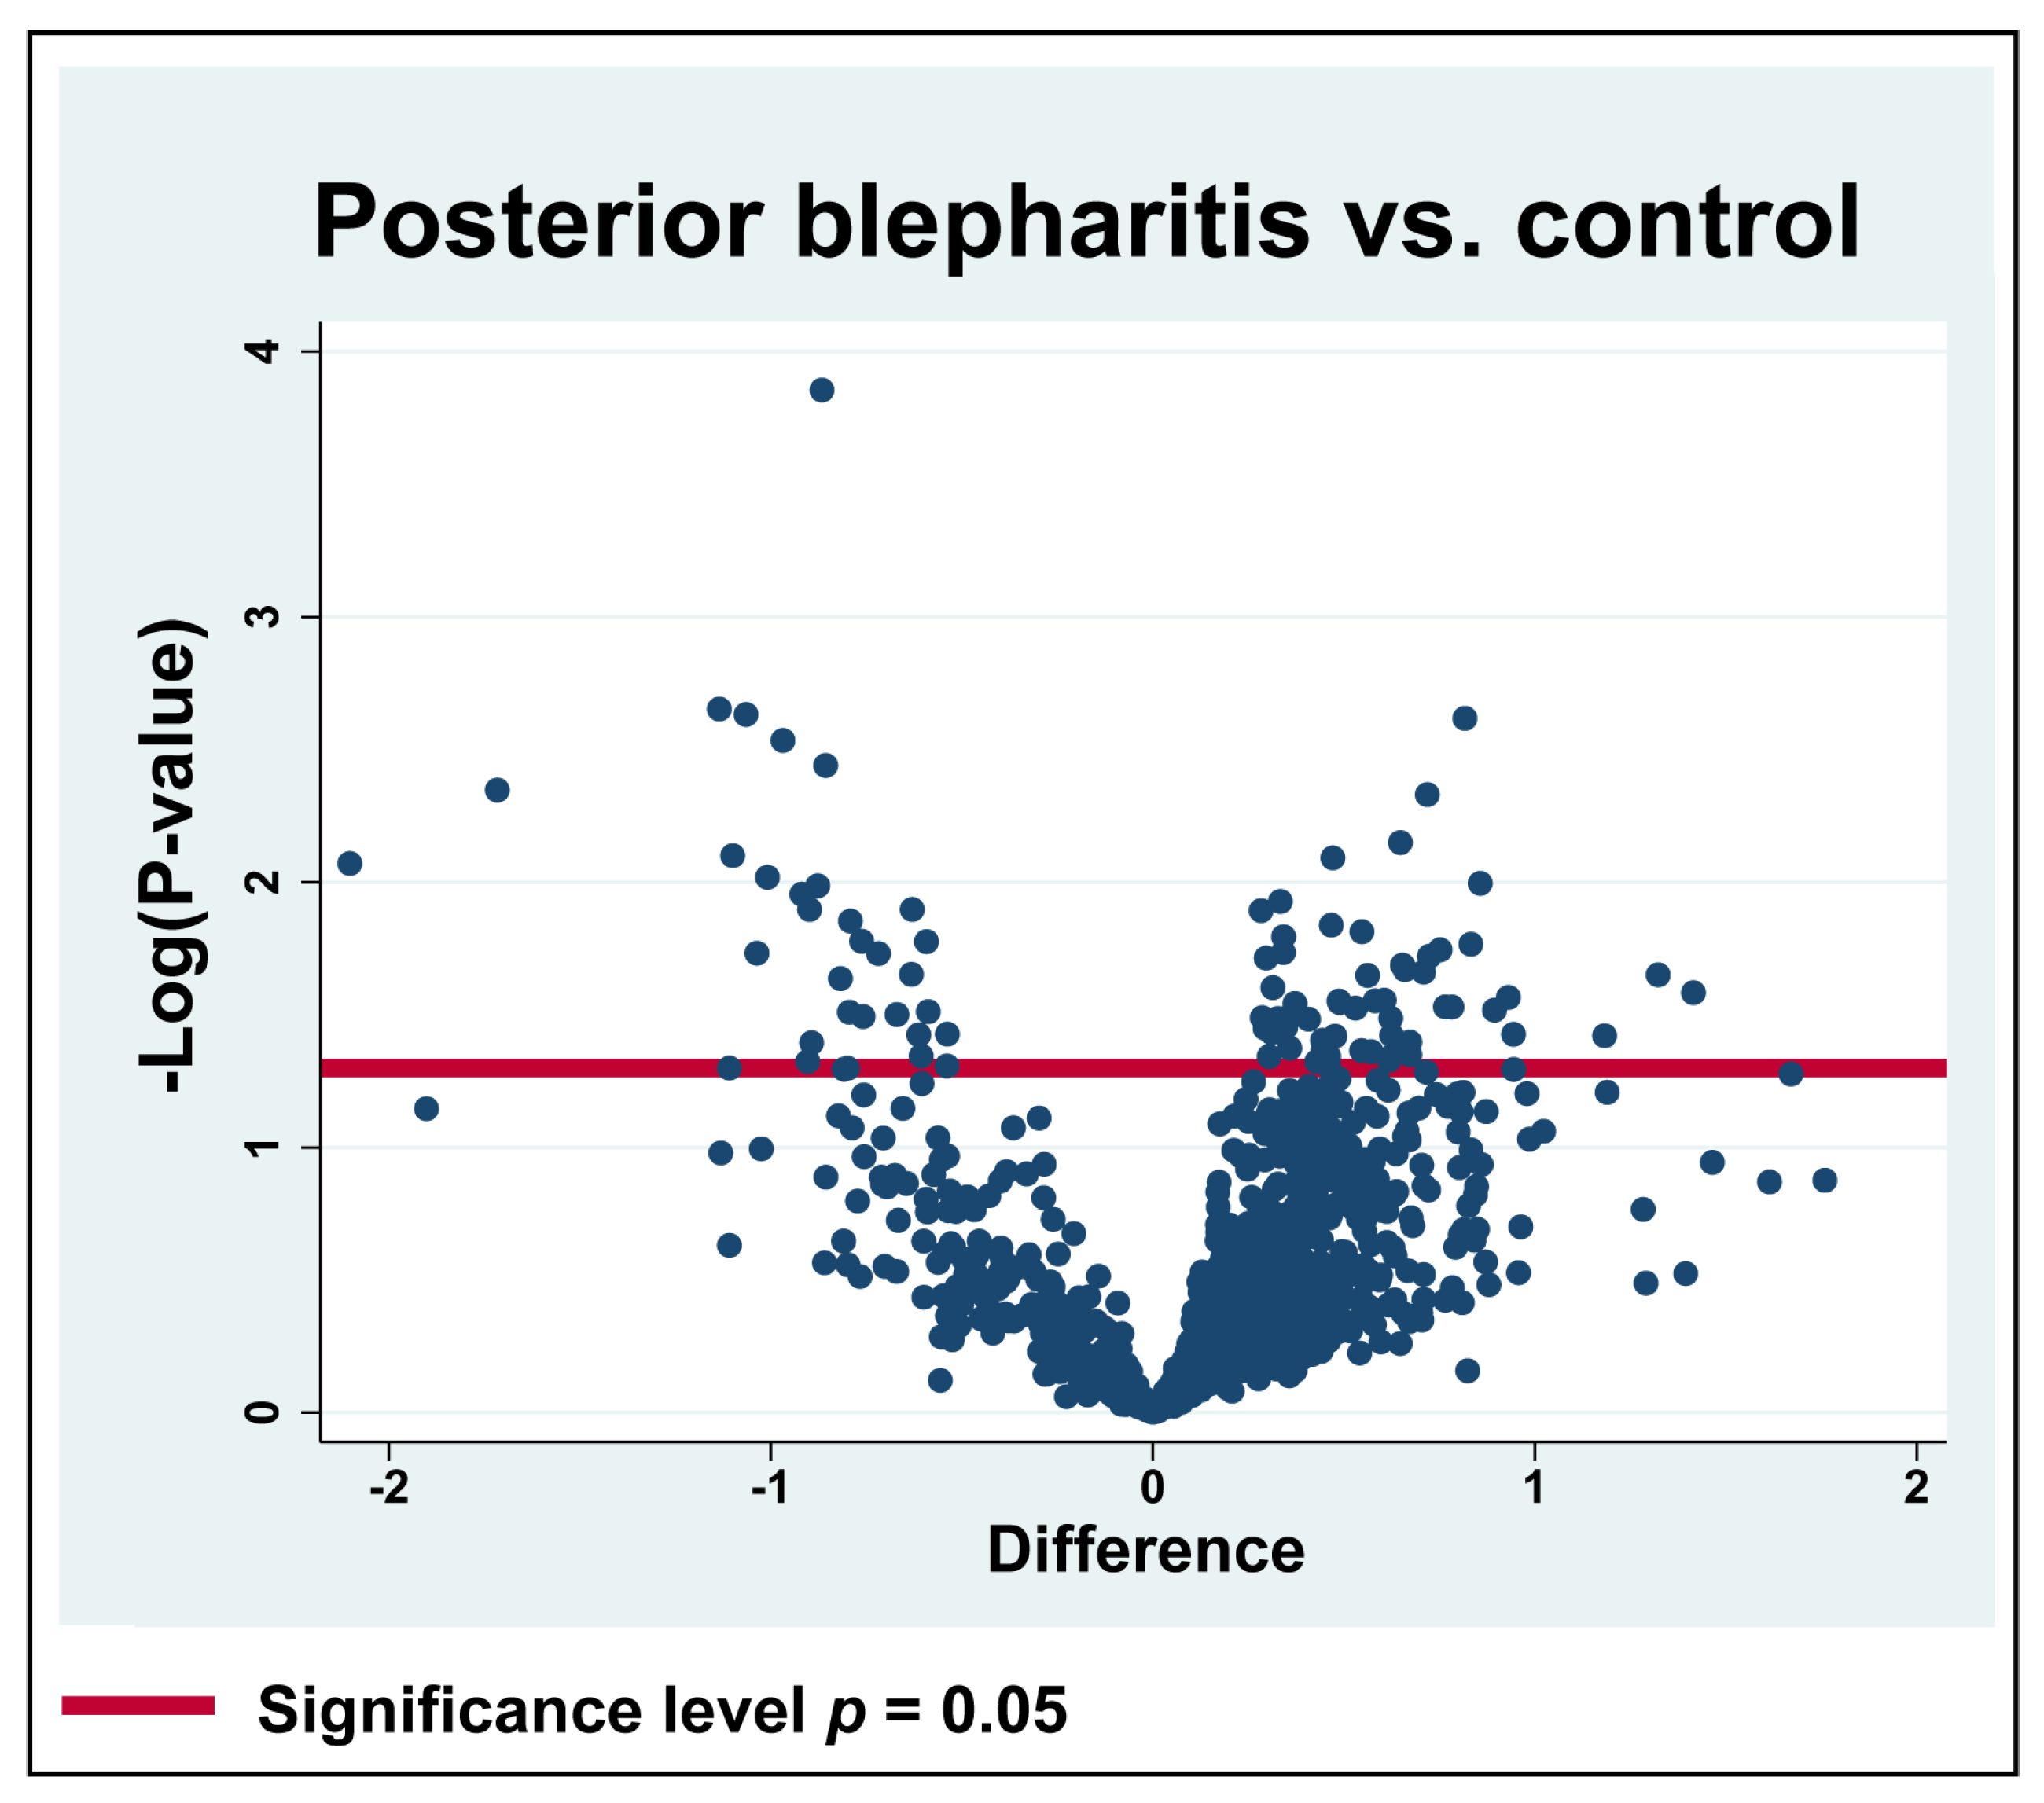
2.1. Significantly Regulated Proteins
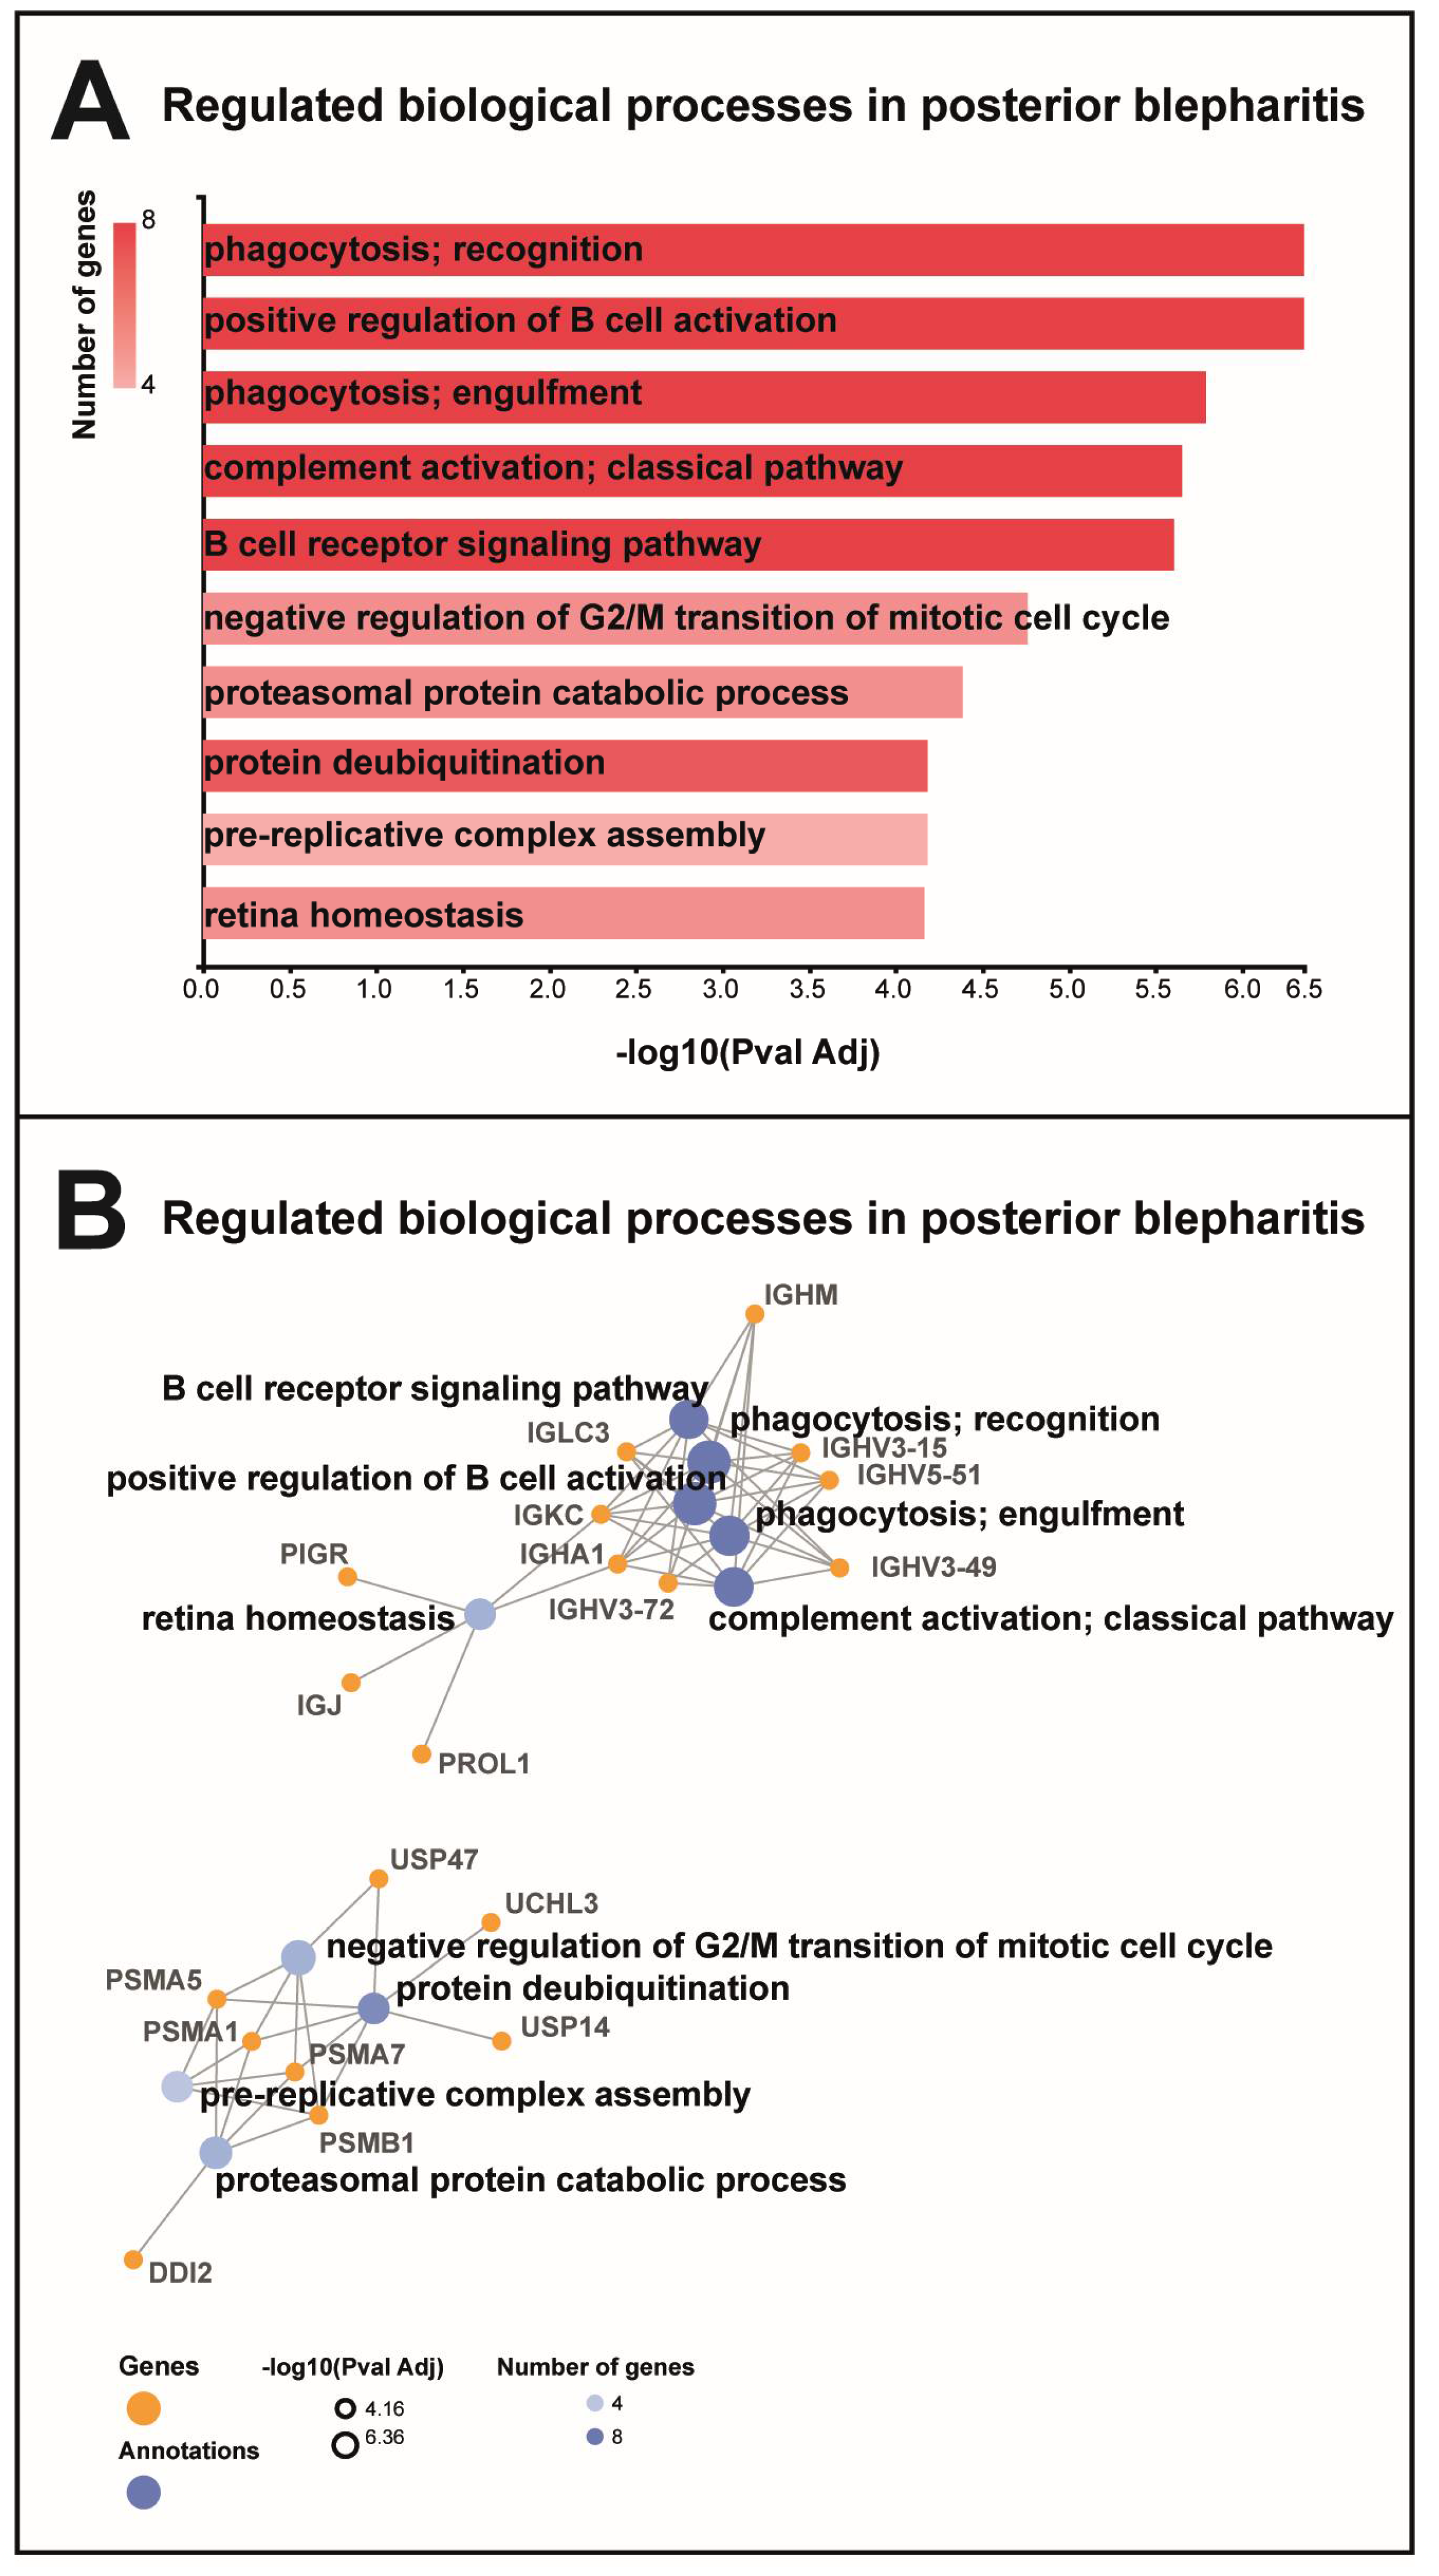
2.2. Bioinformatics
3. Discussion
4. Materials and Methods
4.1. Samples
4.2. Sample Preparation for Mass Spectrometry
4.3. Label-Free Quantification Nano Liquid Chromatography–Tandem Mass Spectrometry
4.4. Statistics
4.5. Targeted Mass Spectrometry with Single Reaction Monitoring (SRM)
5. Conclusions
Supplementary Materials
Author Contributions
Funding
Institutional Review Board Statement
Informed Consent Statement
Data Availability Statement
Acknowledgments
Conflicts of Interest
References
- Morthen, M.K.; Magno, M.S.; Utheim, T.P.; Snieder, H.; Hammond, C.J.; Vehof, J. The physical and mental burden of dry eye disease: A large population-based study investigating the relationship with health-related quality of life and its determinants. Ocul. Surf. 2021, 21, 107–117. [Google Scholar] [CrossRef] [PubMed]
- Sheppard, J.D.; Nichols, K.K. Dry Eye Disease Associated with Meibomian Gland Dysfunction: Focus on Tear Film Characteristics and the Therapeutic Landscape. Ophthalmol. Ther. 2023, 12, 1397–1418. [Google Scholar] [CrossRef]
- Sabeti, S.; Kheirkhah, A.; Yin, J.; Dana, R. Management of meibomian gland dysfunction: A review. Surv. Ophthalmol. 2020, 65, 205–217. [Google Scholar] [CrossRef] [PubMed]
- Yeotikar, N.S.; Zhu, H.; Markoulli, M.; Nichols, K.K.; Naduvilath, T.; Papas, E.B. Functional and Morphologic Changes of Meibomian Glands in an Asymptomatic Adult Population. Investig. Ophthalmol. Vis. Sci. 2016, 57, 3996–4007. [Google Scholar] [CrossRef]
- Paranjpe, V.; Tan, J.; Nguyen, J.; Lee, J.; Allegood, J.; Galor, A.; Mandal, N. Clinical signs of meibomian gland dysfunction (MGD) are associated with changes in meibum sphingolipid composition. Ocul. Surf. 2019, 17, 318–326. [Google Scholar] [CrossRef]
- Soria, J.; Acera, A.; Merayo, L.J.; Durán, J.A.; González, N.; Rodriguez, S.; Bistolas, N.; Schumacher, S.; Bier, F.F.; Peter, H.; et al. Tear proteome analysis in ocular surface diseases using label-free LC-MS/MS and multiplexed-microarray biomarker validation. Sci. Rep. 2017, 7, 17478. [Google Scholar] [CrossRef] [PubMed]
- Cehofski, L.J.; Kojima, K.; Kusada, N.; Rasmussen, M.; Muttuvelu, D.V.; Grauslund, J.; Vorum, H.; Honoré, B. Macular Edema in Central Retinal Vein Occlusion Correlates with Aqueous Fibrinogen Alpha Chain. Investig. Ophthalmol. Vis. Sci. 2023, 64, 23. [Google Scholar] [CrossRef] [PubMed]
- Cehofski, L.J.; Kojima, K.; Terao, N.; Kitazawa, K.; Thineshkumar, S.; Grauslund, J.; Vorum, H.; Honoré, B. Aqueous Fibronectin Correlates with Severity of Macular Edema and Visual Acuity in Patients with Branch Retinal Vein Occlusion: A Proteome Study. Investig. Ophthalmol. Vis. Sci. 2020, 61, 6. [Google Scholar] [CrossRef] [PubMed]
- Harman, J.C.; Guidry, J.J.; Gidday, J.M. Comprehensive characterization of the adult ND4 Swiss Webster mouse retina: Using discovery-based mass spectrometry to decipher the total proteome and phosphoproteome. Mol. Vis. 2018, 24, 875–889. [Google Scholar] [PubMed]
- Ananthi, S.; Chitra, T.; Bini, R.; Prajna, N.V.; Lalitha, P.; Dharmalingam, K. Comparative analysis of the tear protein profile in mycotic keratitis patients. Mol. Vis. 2008, 14, 500–507. [Google Scholar] [PubMed]
- Gerber-Hollbach, N.; Plattner, K.; O’Leary, O.E.; Jenoe, P.; Moes, S.; Drexler, B.; Schoetzau, A.; Halter, J.P.; Goldblum, D. Tear Film Proteomics Reveal Important Differences Between Patients with and Without Ocular GvHD After Allogeneic Hematopoietic Cell Transplantation. Investig. Ophthalmol. Vis. Sci. 2018, 59, 3521–3530. [Google Scholar] [CrossRef] [PubMed]
- Liu, Y.; Yao, J. Research progress of cystatin SN in cancer. OncoTargets Ther. 2019, 12, 3411–3419. [Google Scholar] [CrossRef]
- Soria, J.; Durán, J.A.; Etxebarria, J.; Merayo, J.; González, N.; Reigada, R.; García, I.; Acera, A.; Suárez, T. Tear proteome and protein network analyses reveal a novel pentamarker panel for tear film characterization in dry eye and meibomian gland dysfunction. J. Proteom. 2013, 78, 94–112. [Google Scholar] [CrossRef]
- Perumal, N.; Funke, S.; Wolters, D.; Pfeiffer, N.; Grus, F.H. Characterization of human reflex tear proteome reveals high expression of lacrimal proline-rich protein 4 (PRR4). Proteomics 2015, 15, 3370–3381. [Google Scholar] [CrossRef]
- Drew, V.J.; Tseng, C.L.; Seghatchian, J.; Burnouf, T. Reflections on Dry Eye Syndrome Treatment: Therapeutic Role of Blood Products. Front. Med. 2018, 5, 33. [Google Scholar] [CrossRef]
- Park, I.; Han, C.; Jin, S.; Lee, B.; Choi, H.; Kwon, J.T.; Kim, D.; Kim, J.; Lifirsu, E.; Park, W.J.; et al. Myosin regulatory light chains are required to maintain the stability of myosin II and cellular integrity. Biochem. J. 2011, 434, 171–180. [Google Scholar] [CrossRef] [PubMed]
- Donaudy, F.; Snoeckx, R.; Pfister, M.; Zenner, H.P.; Blin, N.; Di Stazio, M.; Ferrara, A.; Lanzara, C.; Ficarella, R.; Declau, F.; et al. Nonmuscle myosin heavy-chain gene MYH14 is expressed in cochlea and mutated in patients affected by autosomal dominant hearing impairment (DFNA4). Am. J. Hum. Genet. 2004, 74, 770–776. [Google Scholar] [CrossRef]
- Peschiaroli, A.; Skaar, J.R.; Pagano, M.; Melino, G. The ubiquitin-specific protease USP47 is a novel beta-TRCP interactor regulating cell survival. Oncogene 2010, 29, 1384–1393. [Google Scholar] [CrossRef]
- Parsons, J.L.; Dianova, I.I.; Khoronenkova, S.V.; Edelmann, M.J.; Kessler, B.M.; Dianov, G.L. USP47 is a deubiquitylating enzyme that regulates base excision repair by controlling steady-state levels of DNA polymerase β. Mol. Cell 2011, 41, 609–615. [Google Scholar] [CrossRef]
- Yuan, C.; Chen, M.; Cai, X. Advances in poly(rC)-binding protein 2: Structure, molecular function, and roles in cancer. Biomed. Pharmacother. 2021, 139, 111719. [Google Scholar] [CrossRef] [PubMed]
- Bruce, B.D.; Churchich, J. Characterization of the molecular-chaperone function of the heat-shock-cognate-70-interacting protein. Eur. J. Biochem. 1997, 245, 738–744. [Google Scholar] [CrossRef] [PubMed]
- Rousseau, A.; Bertolotti, A. Regulation of proteasome assembly and activity in health and disease. Nat. Rev. Mol. Cell Biol. 2018, 19, 697–712. [Google Scholar] [CrossRef]
- Sklar, B.A.; Gervasio, K.A.; Leng, S.; Ghosh, A.; Chari, A.; Wu, A.Y. Management and outcomes of proteasome inhibitor associated chalazia and blepharitis: A case series. BMC Ophthalmol. 2019, 19, 110. [Google Scholar] [CrossRef] [PubMed]
- Muttuvelu, D.V.; Cehofski, L.J.; Muhammad, M.G.F.; Chen, X.; Utheim, T.P.; Khan, A.M.; Abduljabar, A.B.; Kristensen, K.; Rasmussen, M.L.R.; Vorum, H.; et al. Anterior blepharitis is associated with elevated plectin levels consistent with a pronounced intracellular response. Ocul. Surf. 2023, 29, 444–455. [Google Scholar] [CrossRef] [PubMed]
- Nelson, J.D.; Shimazaki, J.; Benitez-del-Castillo, J.M.; Craig, J.P.; McCulley, J.P.; Den, S.; Foulks, G.N. The international workshop on meibomian gland dysfunction: Report of the definition and classification subcommittee. Investig. Ophthalmol. Vis. Sci. 2011, 52, 1930–1937. [Google Scholar] [CrossRef]
- Schiffman, R.M.; Christianson, M.D.; Jacobsen, G.; Hirsch, J.D.; Reis, B.L. Reliability and validity of the Ocular Surface Disease Index. Arch. Ophthalmol. 2000, 118, 615–621. [Google Scholar] [CrossRef]
- Graae Jensen, P.; Gundersen, M.; Nilsen, C.; Gundersen, K.G.; Potvin, R.; Gazerani, P.; Chen, X.; Utheim, T.P.; Utheim, A.Ø. Prevalence of Dry Eye Disease Among Individuals Scheduled for Cataract Surgery in a Norwegian Cataract Clinic. Clin. Ophthalmol. 2023, 17, 1233–1243. [Google Scholar] [CrossRef]
- Malmin, A.; Thomseth, V.M.; Førland, P.T.; Khan, A.Z.; Hetland, H.B.; Chen, X.; Haugen, I.K.; Utheim, T.P.; Forsaa, V.A. Associations between Serial Intravitreal Injections and Dry Eye. Ophthalmology 2023, 130, 509–515. [Google Scholar] [CrossRef]
- Aqrawi, L.A.; Galtung, H.K.; Vestad, B.; Ovstebo, R.; Thiede, B.; Rusthen, S.; Young, A.; Guerreiro, E.M.; Utheim, T.P.; Chen, X.; et al. Identification of potential saliva and tear biomarkers in primary Sjogren’s syndrome, utilising the extraction of extracellular vesicles and proteomics analysis. Arthritis Res. Ther. 2017, 19, 14. [Google Scholar] [CrossRef] [PubMed]
- Honoré, B. Proteomic Protocols for Differential Protein Expression Analyses. Methods Mol. Biol. 2020, 2110, 47–58. [Google Scholar] [CrossRef] [PubMed]
- Tyanova, S.; Temu, T.; Cox, J. The MaxQuant computational platform for mass spectrometry-based shotgun proteomics. Nat. Protoc. 2016, 11, 2301–2319. [Google Scholar] [CrossRef] [PubMed]
- Christakopoulos, C.; Cehofski, L.J.; Christensen, S.R.; Vorum, H.; Honore, B. Proteomics reveals a set of highly enriched proteins in epiretinal membrane compared with inner limiting membrane. Exp. Eye Res. 2019, 186, 107722. [Google Scholar] [CrossRef]
- Cehofski, L.J.; Kruse, A.; Kirkeby, S.; Alsing, A.N.; Ellegaard Nielsen, J.; Kojima, K.; Honore, B.; Vorum, H. IL-18 and S100A12 Are Upregulated in Experimental Central Retinal Vein Occlusion. Int. J. Mol. Sci. 2018, 19, 3328. [Google Scholar] [CrossRef] [PubMed]
- Garcia-Moreno, A.; López-Domínguez, R.; Villatoro-García, J.A.; Ramirez-Mena, A.; Aparicio-Puerta, E.; Hackenberg, M.; Pascual-Montano, A.; Carmona-Saez, P. Functional Enrichment Analysis of Regulatory Elements. Biomedicines 2022, 10, 590. [Google Scholar] [CrossRef] [PubMed]
- Cehofski, L.J.; Kruse, A.; Kjaergaard, B.; Stensballe, A.; Honore, B.; Vorum, H. Proteins involved in focal adhesion signaling pathways are differentially regulated in experimental branch retinal vein occlusion. Exp. Eye Res. 2015, 138, 87–95. [Google Scholar] [CrossRef] [PubMed]
- Szklarczyk, D.; Franceschini, A.; Wyder, S.; Forslund, K.; Heller, D.; Huerta-Cepas, J.; Simonovic, M.; Roth, A.; Santos, A.; Tsafou, K.P.; et al. STRING v10: Protein-protein interaction networks, integrated over the tree of life. Nucleic Acids Res. 2015, 43, D447–D452. [Google Scholar] [CrossRef]
- Szklarczyk, D.; Gable, A.L.; Lyon, D.; Junge, A.; Wyder, S.; Huerta-Cepas, J.; Simonovic, M.; Doncheva, N.T.; Morris, J.H.; Bork, P.; et al. STRING v11: Protein-protein association networks with increased coverage, supporting functional discovery in genome-wide experimental datasets. Nucleic Acids Res. 2019, 47, D607–D613. [Google Scholar] [CrossRef]
- Szklarczyk, D.; Morris, J.H.; Cook, H.; Kuhn, M.; Wyder, S.; Simonovic, M.; Santos, A.; Doncheva, N.T.; Roth, A.; Bork, P.; et al. The STRING database in 2017: Quality-controlled protein-protein association networks, made broadly accessible. Nucleic Acids Res. 2017, 45, D362–D368. [Google Scholar] [CrossRef]
- Pino, L.K.; Searle, B.C.; Bollinger, J.G.; Nunn, B.; MacLean, B.; MacCoss, M.J. The Skyline ecosystem: Informatics for quantitative mass spectrometry proteomics. Mass Spectrom. Rev. 2020, 39, 229–244. [Google Scholar] [CrossRef]


| Protein ID | Protein Name | Gene Name | p-Value | MGD/Control |
|---|---|---|---|---|
| P11940 | Polyadenylate-binding protein 1 | PABPC1 | 0.026 | 2.67 |
| Q14203-3 | Dynactin subunit 1 | DCTN1 | 0.022 | 2.50 |
| P55060-3 | Exportin-2 | CSE1L | 0.038 | 2.27 |
| Q99460 | 26S proteasome non-ATPase regulatory subunit 1 | PSMD1 | 0.037 | 1.92 |
| P43490 | Nicotinamide phosphoribosyltransferase | NAMPT | 0.027 | 1.91 |
| O43681 | ATPase ASNA1 | ASNA1 | 0.030 | 1.86 |
| A0AVT1 | Ubiquitin-like modifier-activating enzyme 6 | UBA6 | 0.010 | 1.81 |
| P41226 | Ubiquitin-like modifier-activating enzyme 7 | UBA7 | 0.017 | 1.78 |
| P61088 | Ubiquitin-conjugating enzyme E2 N | UBE2N | 0.002 | 1.76 |
| Q16401 | 26S proteasome non-ATPase regulatory subunit 5 | PSMD5 | 0.030 | 1.72 |
| Q15435 | Protein phosphatase 1 regulatory subunit 7 | PPP1R7 | 0.029 | 1.70 |
| P30153 | Serine/threonine-protein phosphatase 2A 65 kDa regulatory subunit A alpha isoform | PPP2R1A | 0.018 | 1.68 |
| P48739 | Phosphatidylinositol transfer protein beta isoform | PITPNB | 0.019 | 1.65 |
| Q7Z6Z7-2 | E3 ubiquitin-protein ligase HUWE1 | HUWE1 | 0.005 | 1.65 |
| P49588 | Alanine--tRNA ligase, cytoplasmic | AARS | 0.022 | 1.63 |
| Q15257-3 | Serine/threonine-protein phosphatase 2A activator | PPP2R4 | 0.040 | 1.59 |
| O60784 | Target of Myb protein 1 | TOM1 | 0.045 | 1.59 |
| O14908 | PDZ domain-containing protein GIPC1 | GIPC1 | 0.021 | 1.58 |
| P62942 | Peptidyl-prolyl cis-trans isomerase FKBP1A | FKBP1A | 0.021 | 1.57 |
| P25786 | Proteasome subunit alpha type-1 | PSMA1 | 0.007 | 1.57 |
| P78371 | T-complex protein 1 subunit beta | CCT2 | 0.045 | 1.54 |
| P20618 | Proteasome subunit beta type-1 | PSMB1 | 0.038 | 1.54 |
| P50990 | T-complex protein 1 subunit theta | CCT8 | 0.033 | 1.54 |
| P46459 | Vesicle-fusing ATPase | NSF | 0.047 | 1.54 |
| O00410 | Importin-5 | IPO5 | 0.028 | 1.52 |
| P61163 | Alpha-centractin | ACTR1A | 0.028 | 1.50 |
| Q9ULA0-2 | Aspartyl aminopeptidase | DNPEP | 0.043 | 1.49 |
| P36543 | V-type proton ATPase subunit E 1 | ATP6V1E1 | 0.022 | 1.48 |
| P15374 | Ubiquitin carboxyl-terminal hydrolase isozyme L3 | UCHL3 | 0.015 | 1.46 |
| P28066 | Proteasome subunit alpha type-5 | PSMA5 | 0.043 | 1.46 |
| Q08209-3 | Serine/threonine-protein phosphatase 2B catalytic subunit alpha isoform | PPP3CA | 0.030 | 1.44 |
| P59998 | Actin-related protein 2/3 complex subunit 4 | ARPC4 | 0.028 | 1.40 |
| Q13404 | Ubiquitin-conjugating enzyme E2 variant 1 | UBE2V1 | 0.028 | 1.40 |
| Q96K76-2 | Ubiquitin carboxyl-terminal hydrolase 47 | USP47 | 0.038 | 1.39 |
| P54578 | Ubiquitin carboxyl-terminal hydrolase 14 | USP14 | 0.008 | 1.39 |
| Q9BR76 | Coronin-1B | CORO1B | 0.015 | 1.38 |
| P32119 | Peroxiredoxin-2 | PRDX2 | 0.045 | 1.38 |
| P62195 | 26S protease regulatory subunit 8 | PSMC5 | 0.049 | 1.38 |
| O00534 | von Willebrand factor A domain-containing protein 5A | VWA5A | 0.043 | 1.36 |
| O14950 | Myosin regulatory light chain 12B | MYL12B | 0.039 | 1.36 |
| Q15366-7 | Poly(rC)-binding protein 2 | PCBP2 | 0.047 | 1.35 |
| P08238 | Heat shock protein HSP 90-beta | HSP90AB1 | 0.033 | 1.33 |
| P46976-2 | Glycogenin-1 | GYG1 | 0.029 | 1.29 |
| P04632 | Calpain small subunit 1 | CAPNS1 | 0.042 | 1.28 |
| Q5TDH0-3 | Protein DDI1 homolog 2 | DDI2 | 0.033 | 1.27 |
| P63104 | 14-3-3 protein zeta/delta | YWHAZ | 0.035 | 1.27 |
| Q9UMR2-2 | ATP-dependent RNA helicase DDX19B | DDX19B | 0.016 | 1.27 |
| A0MZ66-5 | Shootin-1 | KIAA1598 | 0.018 | 1.27 |
| P00338 | L-lactate dehydrogenase A chain | LDHA | 0.037 | 1.26 |
| P16152 | Carbonyl reductase [NADPH] 1 | CBR1 | 0.012 | 1.26 |
| P40227 | T-complex protein 1 subunit zeta | CCT6A | 0.033 | 1.25 |
| Q96KP4 | Cytosolic non-specific dipeptidase | CNDP2 | 0.025 | 1.24 |
| O14745 | Na(+)/H(+) exchange regulatory cofactor NHE-RF1 | SLC9A3R1 | 0.037 | 1.24 |
| O14818 | Proteasome subunit alpha type-7 | PSMA7 | 0.045 | 1.24 |
| P23528 | Cofilin-1 | CFL1 | 0.019 | 1.23 |
| Q7Z406-6 | Myosin-14 | MYH14 | 0.035 | 1.23 |
| P50502 | Hsc70-interacting protein | ST13 | 0.032 | 1.22 |
| Q06323 | Proteasome activator complex subunit 1 | PSME1 | 0.013 | 1.22 |
| Q9NZ08 | Endoplasmic reticulum aminopeptidase 1 | ERAP1 | 0.037 | 0.69 |
| P0DOY3 | Immunoglobulin lambda constant3 | IGLC3 | 0.049 | 0.69 |
| P01834 | Ig kappa chain C region | IGKC | 0.031 | 0.67 |
| P04066 | Tissue alpha-L-fucosidase | FUCA1 | 0.017 | 0.66 |
| P22352 | Glutathione peroxidase 3 | GPX3 | 0.045 | 0.66 |
| P01619 | Ig kappa chain V-III region B6 | IGKV3-20 | 0.038 | 0.65 |
| P0DOX7 | Immunoglobulin kappa light chain | n/a | 0.013 | 0.65 |
| Q9Y4L1 | Hypoxia up-regulated protein 1 | HYOU1 | 0.022 | 0.65 |
| P16070 | CD44 antigen | CD44 | 0.031 | 0.63 |
| P61916-2 | Epididymal secretory protein E1 | NPC2 | 0.019 | 0.61 |
| P01833 | Polymeric immunoglobulin receptor | PIGR | 0.032 | 0.59 |
| A0A0C4DH68 | Immunoglobulin kappa variable 2-24 | IGKV2-24 | 0.017 | 0.59 |
| P01876 | Ig alpha-1 chain C region | IGHA1 | 0.014 | 0.58 |
| A0A0B4J1Y9 | Immunoglobulin heavy variable 3-72 | IGHV3-72 | 0.031 | 0.58 |
| P01591 | Immunoglobulin J chain | IGJ | 0.023 | 0.57 |
| A0A0C4DH69 | Immunoglobulin kappa variable 1-9 | IGKV1-9 | 0.004 | 0.55 |
| P25774-2 | Cathepsin S | CTSS | 0.0001 | 0.55 |
| P01594 | Ig kappa chain V-I region AU | IGKV1-33 | 0.010 | 0.54 |
| Q99935 | Proline-rich protein 1 | PROL1 | 0.040 | 0.54 |
| A0A0C4DH38 | Immunoglobulin heavy variable 5-51 | IGHV5-51 | 0.013 | 0.54 |
| Q13206 | Probable ATP-dependent RNA helicase DDX10 | DDX10 | 0.047 | 0.53 |
| A0A0B4J1V0 | Immunoglobulin heavy variable 3-15 | IGHV3-15 | 0.011 | 0.53 |
| A0A0A0MS15 | Immunoglobulin heavy variable 3-49 | IGHV3-49 | 0.003 | 0.51 |
| P01700 | Ig lambda chain V-I region HA | IGLV1-47 | 0.010 | 0.50 |
| Q02487-2 | Desmocollin-2 | DSC2 | 0.018 | 0.49 |
| P04430 | Ig kappa chain V-I region BAN | IGKV1-16 | 0.0020 | 0.48 |
| P0DP04 | Ig heavy chain V-III region DOB | IGHV3-43D | 0.0080 | 0.47 |
| P01871 | Ig mu chain C region | IGHM | 0.0020 | 0.46 |
| P05090 | Apolipoprotein D | APOD | 0.0040 | 0.30 |
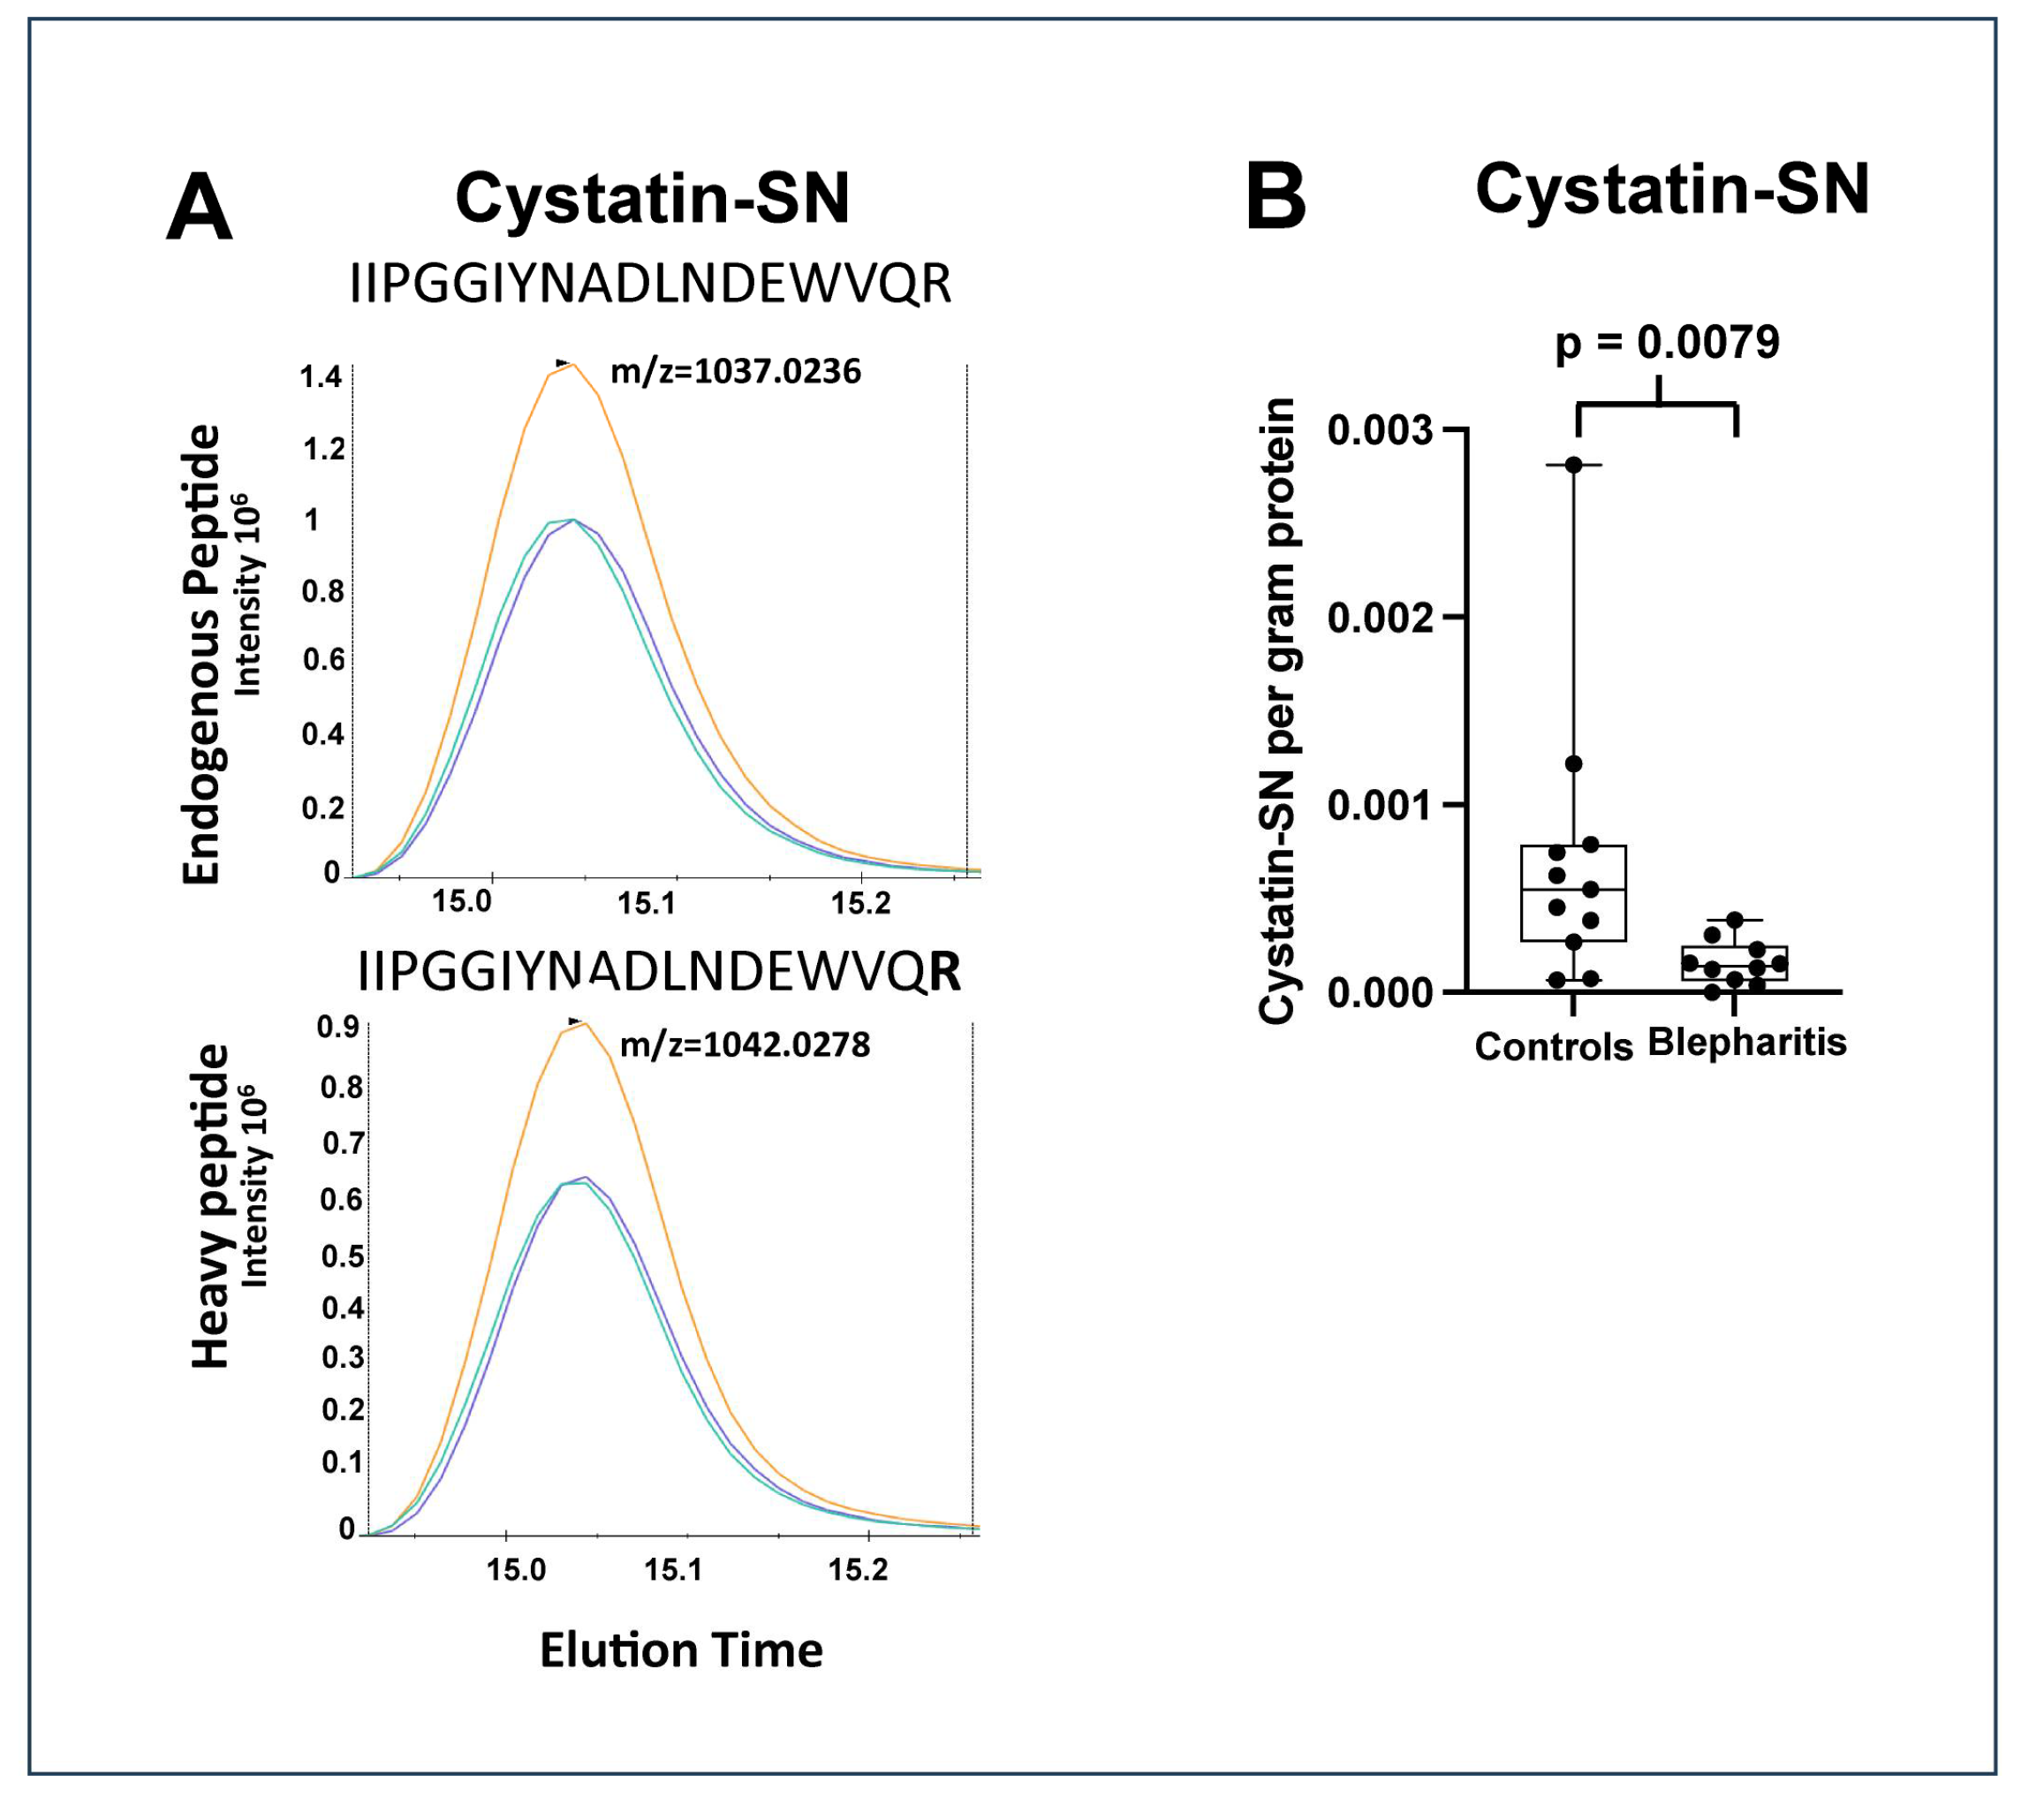
| P01037 | Cystatin-SN | CST1 | 0.0080 | 0.23 |
| ProteinID | Protein Name | p-Value | Correlation |
|---|---|---|---|
| O14950 | Myosin regulatory light chain 12B | 0.0022 | 0.84 |
| Q96K76-2 | Ubiquitin carboxyl-terminal hydrolase 47 | 0.0263 | 0.77 |
| P50502 | Hsc70-interacting protein | 0.035 | 0.67 |
| Q15366-7 | Poly(rC)-binding protein 2 | 0.036 | 0.66 |
| Q9NZ08 | Endoplasmic reticulum aminopeptidase 1 | 0.043 | −0.68 |
| A0A0B4J1V0 | Immunoglobulin heavy variable 3–15 | 0.018 | −0.76 |
| P01871 | Ig mu chain C region | 0.0098 | −0.77 |
| MGD | Controls | p-Value | |
|---|---|---|---|
| Number of samples (n) | 10 | 11 | |
| Age (years) | 63.8 ± 6.30 | 63.2 ± 5.7 | 0.82 |
| Sex (F/M) | 5/5 | 5/6 | |
| Meiboscore (grade) | 1.4 ± 0.5 | 0.0 ± 0.0 | <0.0001 |
| Schirmer (mm) | 13.4 ± 1.3 | 17.3 ± 2.2 | 0.0001 |
| OSDI (score) | 38.2 ± 8.0 | 1.5 ± 1.8 | <0.0001 |
| Tear meniscus (mm) | 0.37 ± 0.07 | 0.36 ± 0.04 | 0.63 |
| NBUT (s) | 10.6 ± 2.4 | 14.2 ± 1.8 | 0.00087 |
Disclaimer/Publisher’s Note: The statements, opinions and data contained in all publications are solely those of the individual author(s) and contributor(s) and not of MDPI and/or the editor(s). MDPI and/or the editor(s) disclaim responsibility for any injury to people or property resulting from any ideas, methods, instructions or products referred to in the content. |
© 2023 by the authors. Licensee MDPI, Basel, Switzerland. This article is an open access article distributed under the terms and conditions of the Creative Commons Attribution (CC BY) license (https://creativecommons.org/licenses/by/4.0/).
Share and Cite
Muttuvelu, D.V.; Cehofski, L.J.; Holtz, J.; Utheim, T.P.; Chen, X.; Vorum, H.; Heegaard, S.; Rasmussen, M.L.R.; Khan, A.M.; Abduljabar, A.B.; et al. Meibomian Gland Dysfunction Is Associated with Low Levels of Immunoglobulin Chains and Cystatin-SN. Int. J. Mol. Sci. 2023, 24, 15115. https://doi.org/10.3390/ijms242015115
Muttuvelu DV, Cehofski LJ, Holtz J, Utheim TP, Chen X, Vorum H, Heegaard S, Rasmussen MLR, Khan AM, Abduljabar AB, et al. Meibomian Gland Dysfunction Is Associated with Low Levels of Immunoglobulin Chains and Cystatin-SN. International Journal of Molecular Sciences. 2023; 24(20):15115. https://doi.org/10.3390/ijms242015115
Chicago/Turabian StyleMuttuvelu, Danson Vasanthan, Lasse Jørgensen Cehofski, Jeppe Holtz, Tor Paaske Utheim, Xiangjun Chen, Henrik Vorum, Steffen Heegaard, Marie Louise Roed Rasmussen, Asif Manzoor Khan, Ahmed Basim Abduljabar, and et al. 2023. "Meibomian Gland Dysfunction Is Associated with Low Levels of Immunoglobulin Chains and Cystatin-SN" International Journal of Molecular Sciences 24, no. 20: 15115. https://doi.org/10.3390/ijms242015115
APA StyleMuttuvelu, D. V., Cehofski, L. J., Holtz, J., Utheim, T. P., Chen, X., Vorum, H., Heegaard, S., Rasmussen, M. L. R., Khan, A. M., Abduljabar, A. B., & Honoré, B. (2023). Meibomian Gland Dysfunction Is Associated with Low Levels of Immunoglobulin Chains and Cystatin-SN. International Journal of Molecular Sciences, 24(20), 15115. https://doi.org/10.3390/ijms242015115