
Long-Term Effect of Porcine Brain Enzyme Hydrolysate Intake on Scopolamine-Induced Memory Impairment in Rats


Abstract
:1. Introduction
2. Results
2.1. Porcine Brain Enzyme Hydrolysate (PBEH) Amino Acid Composition
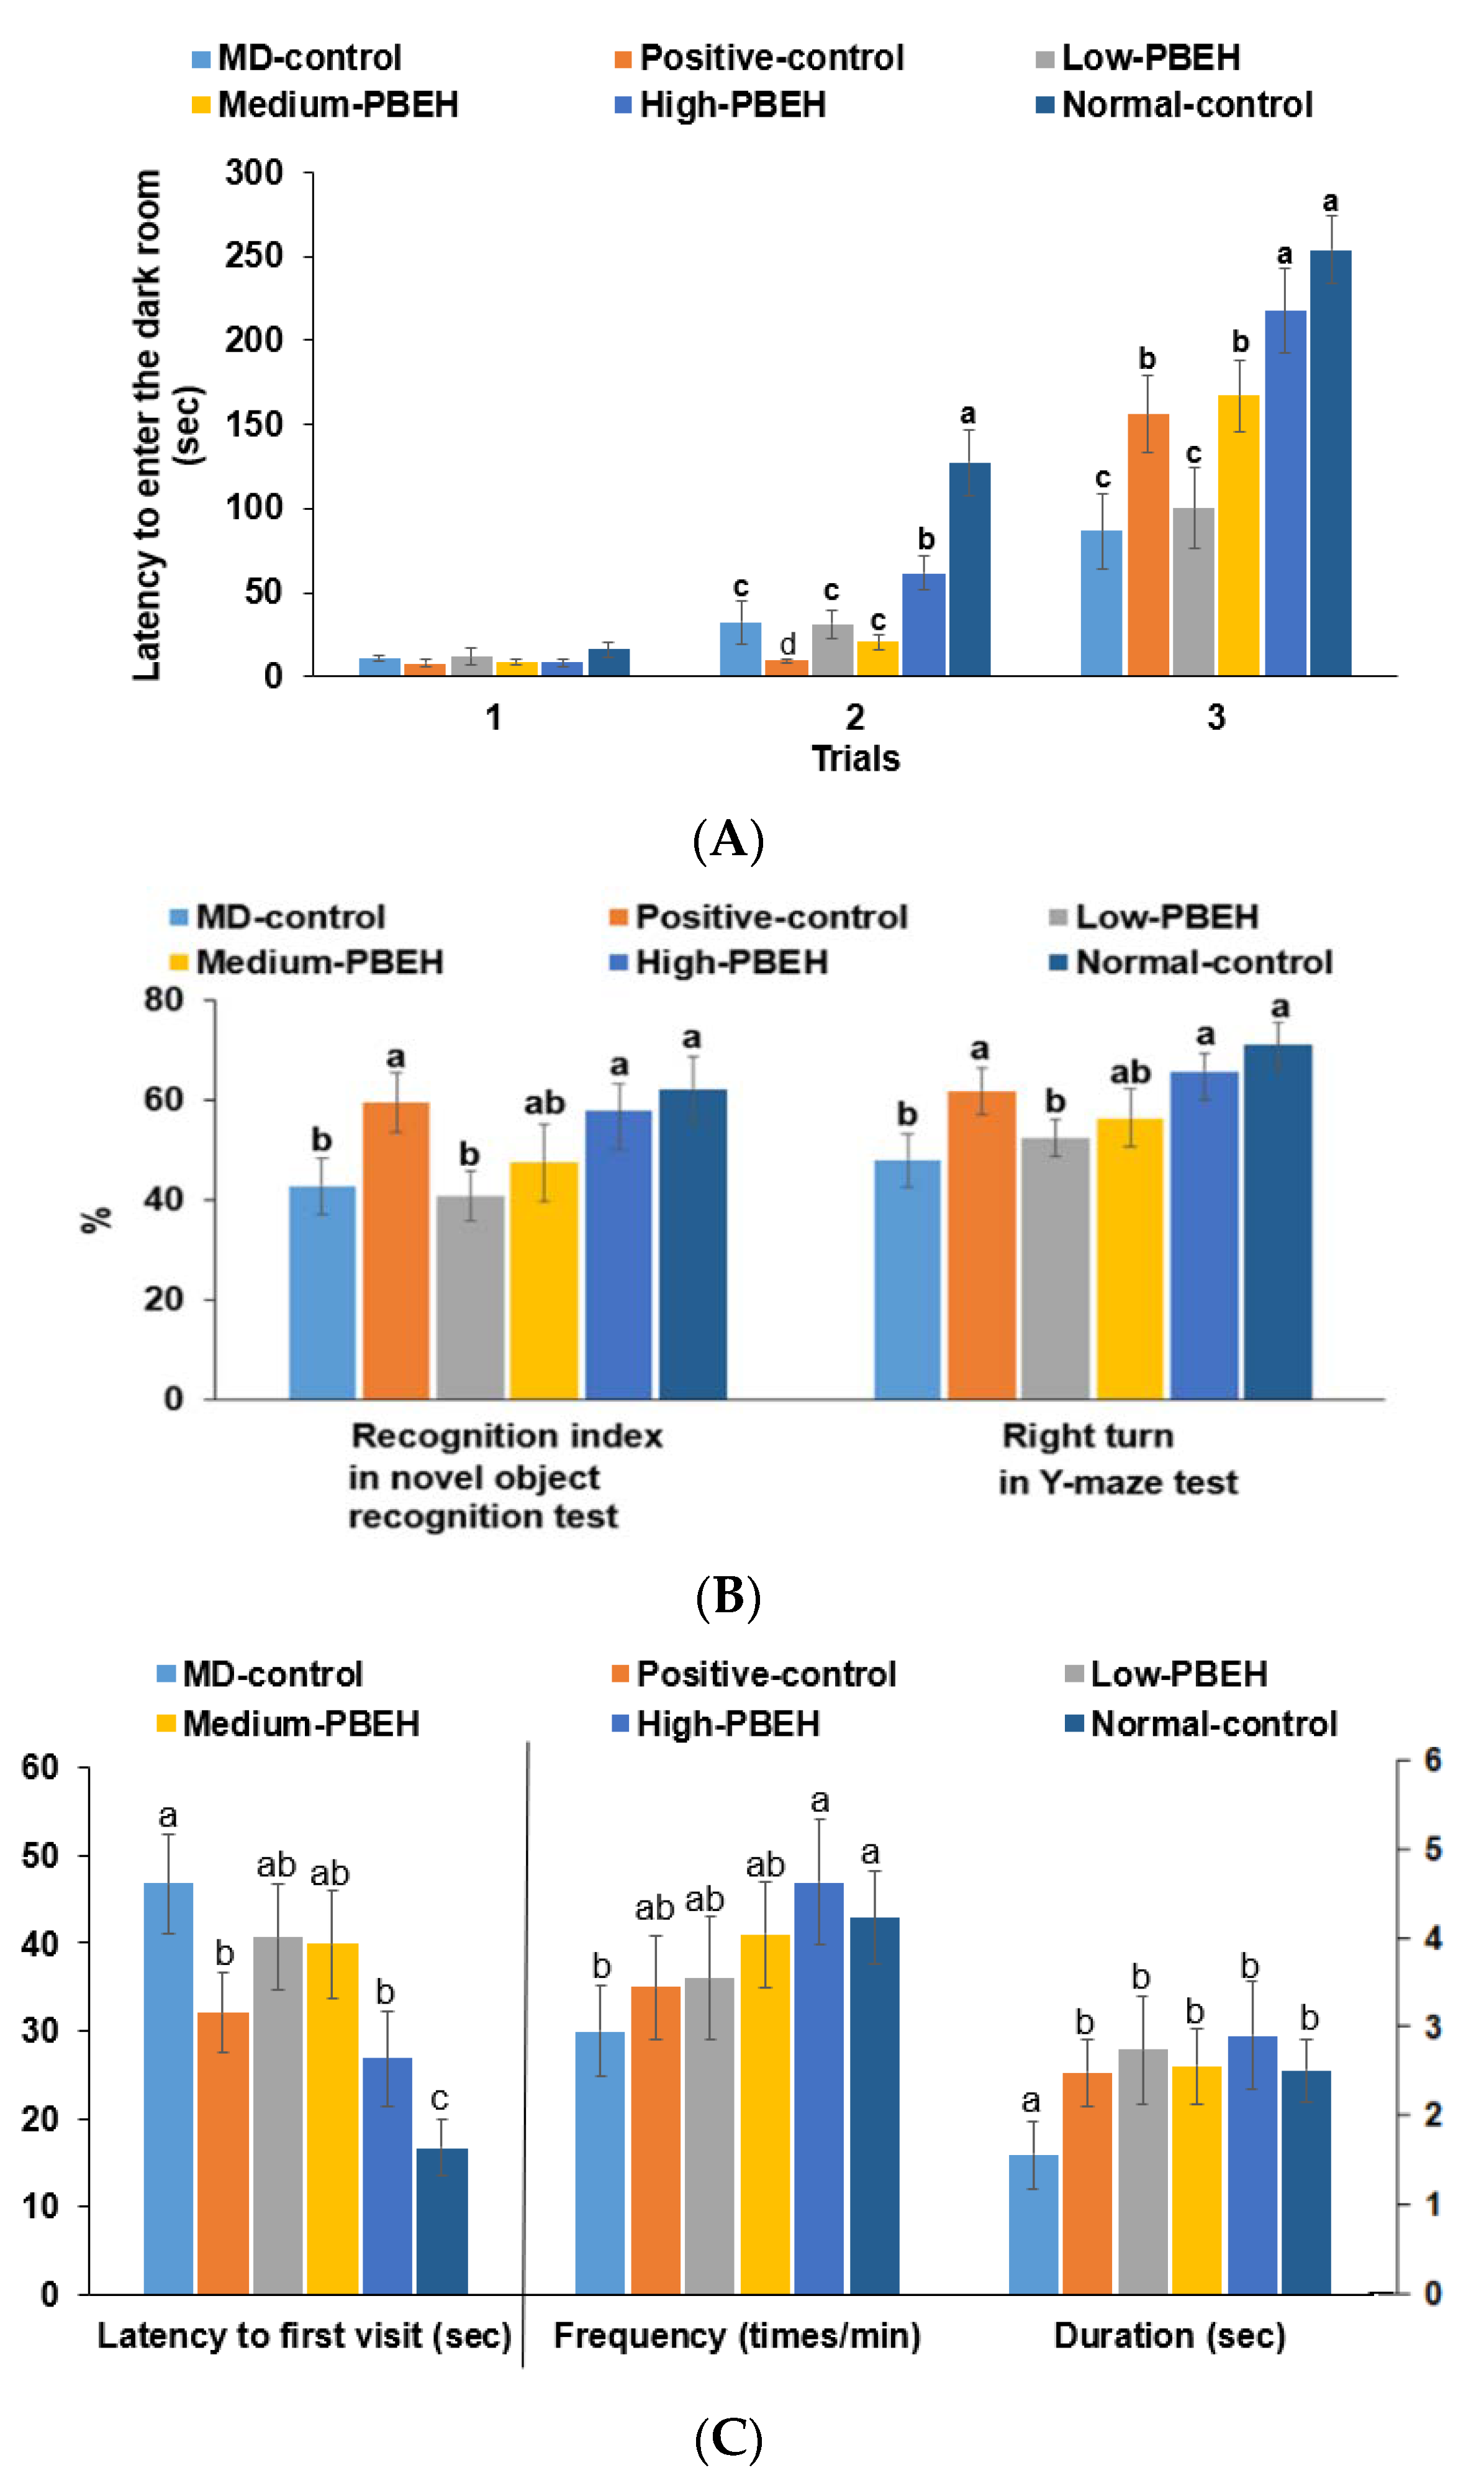
2.2. Memory Deficit
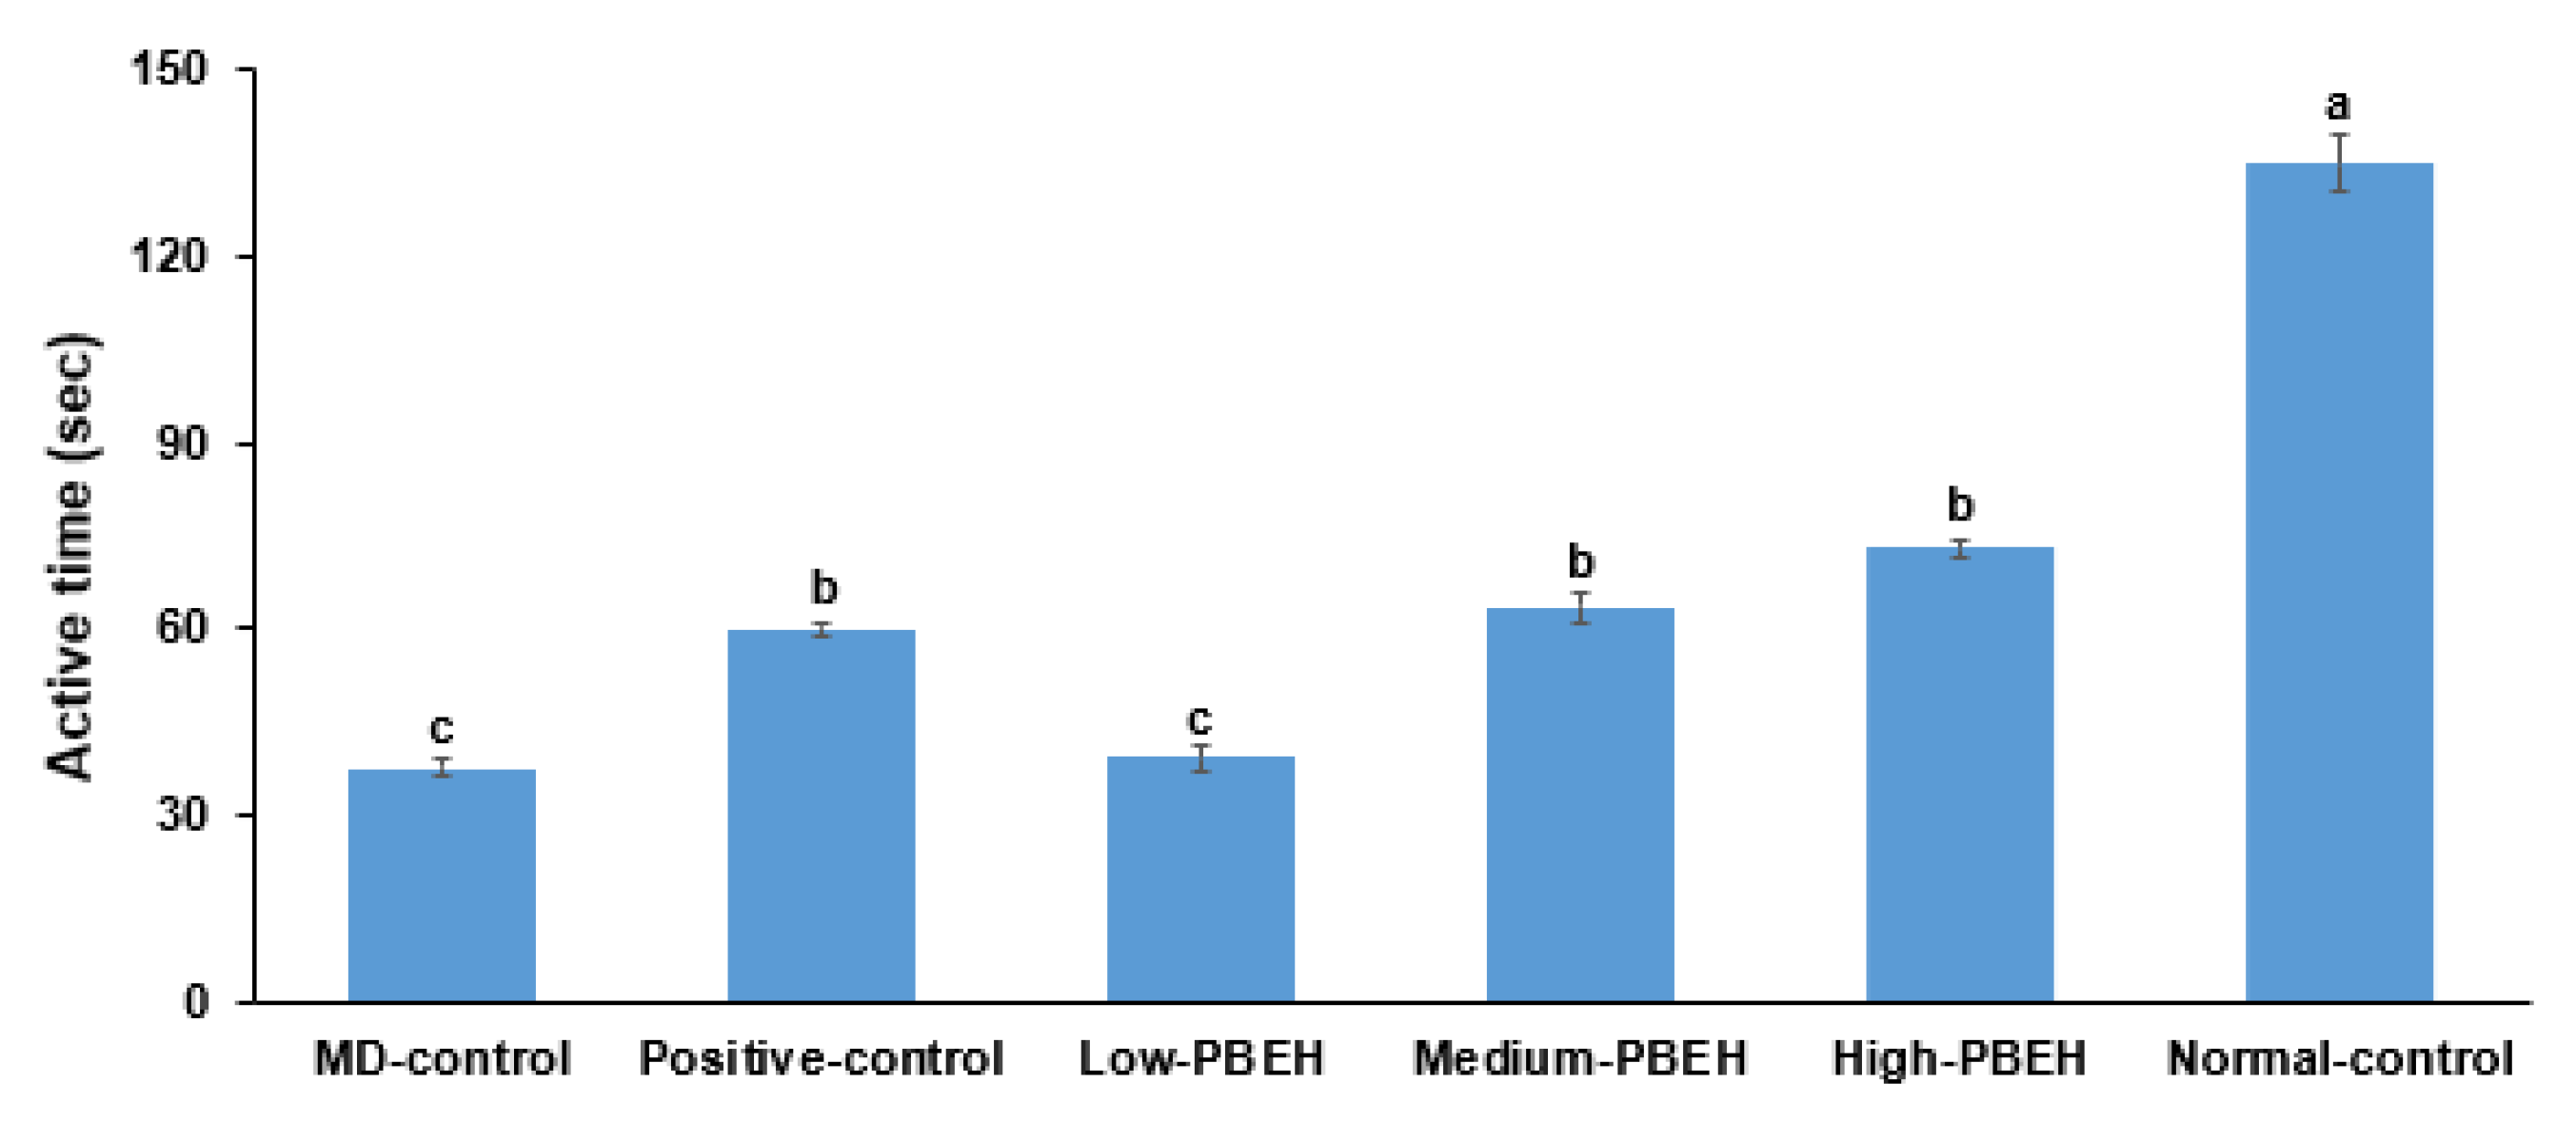
2.3. Depression
2.4. Energy Metabolism and Glucose Metabolism
2.5. Proinflammatory Cytokines and Liver Damage Index in the Circulation
2.6. Hippocampal Lipids, Oxidative Stress, and Neuroinflammation by Scopolamine Injection
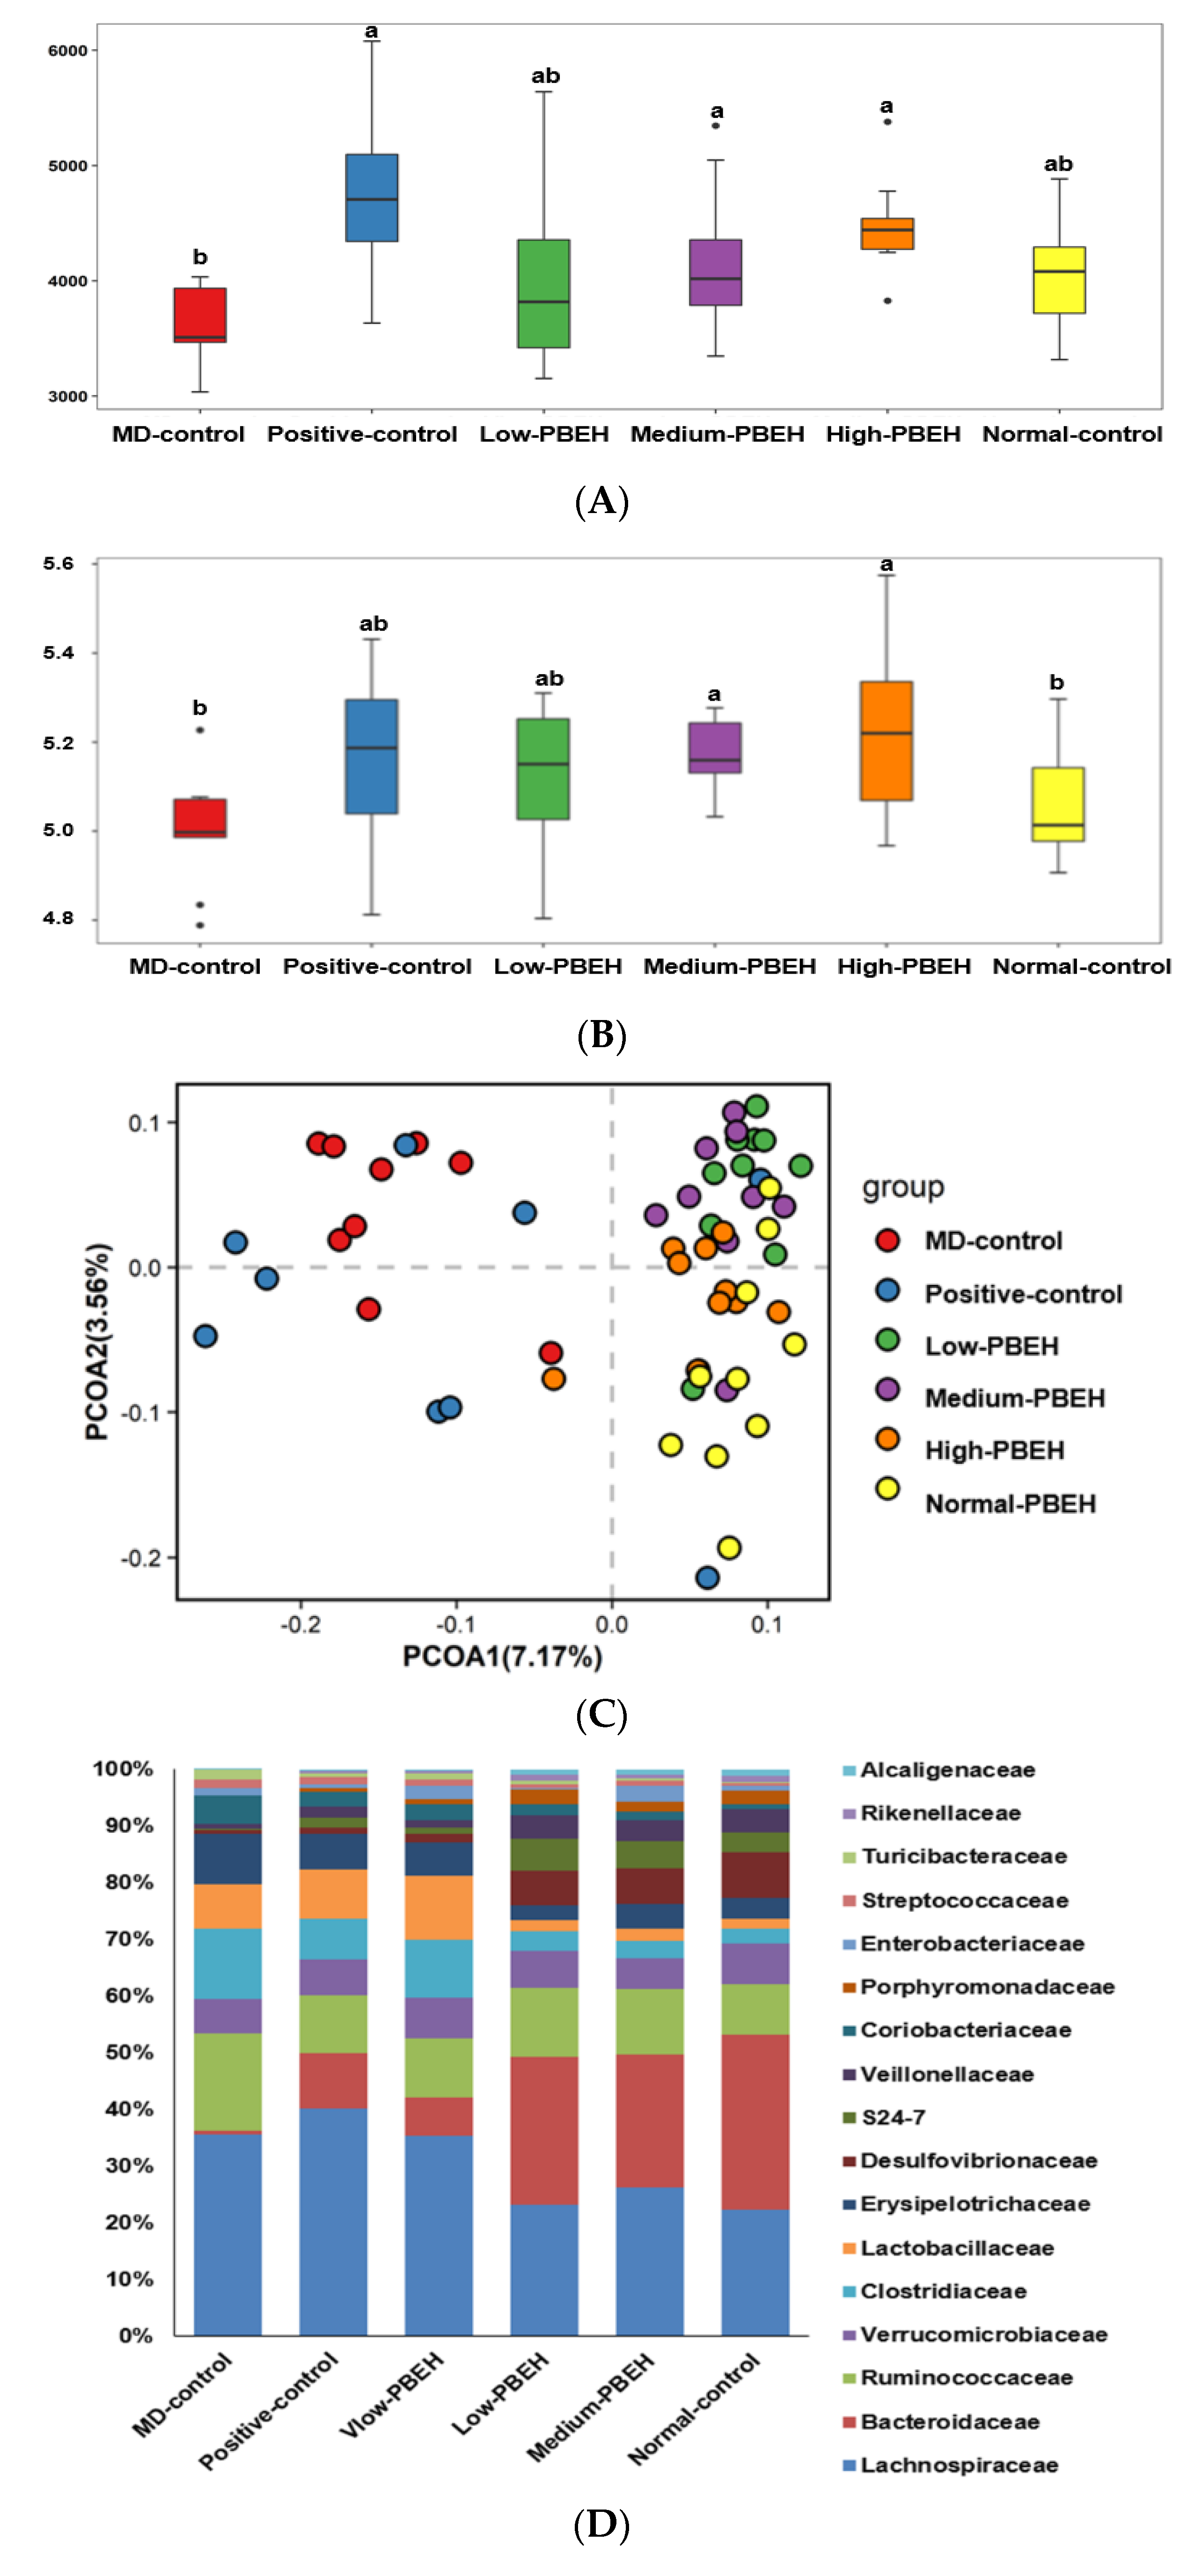
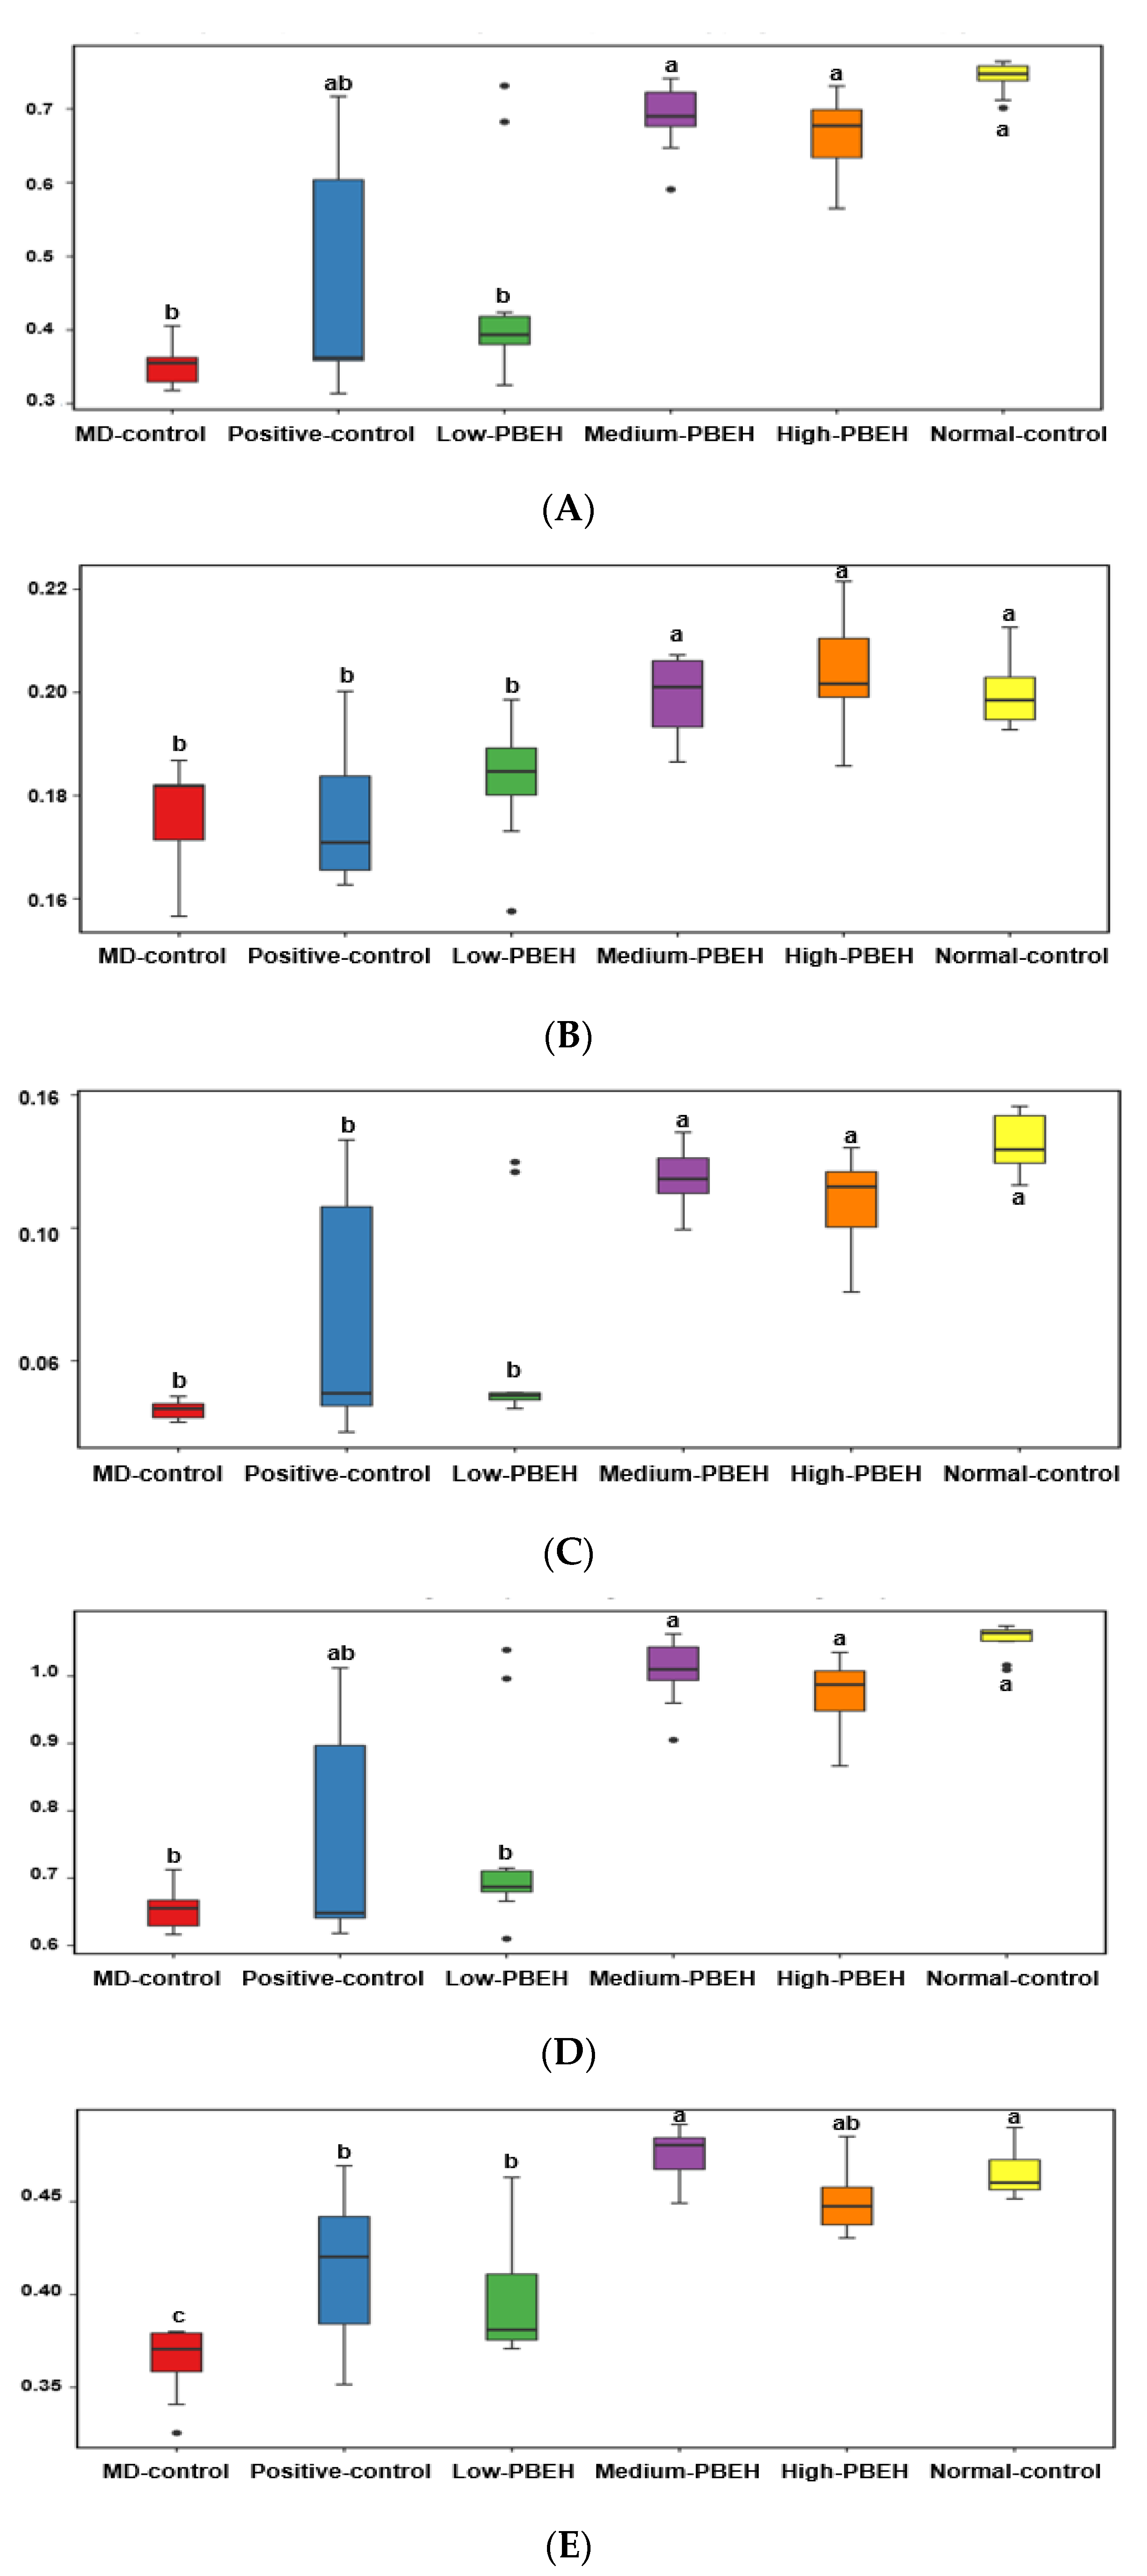
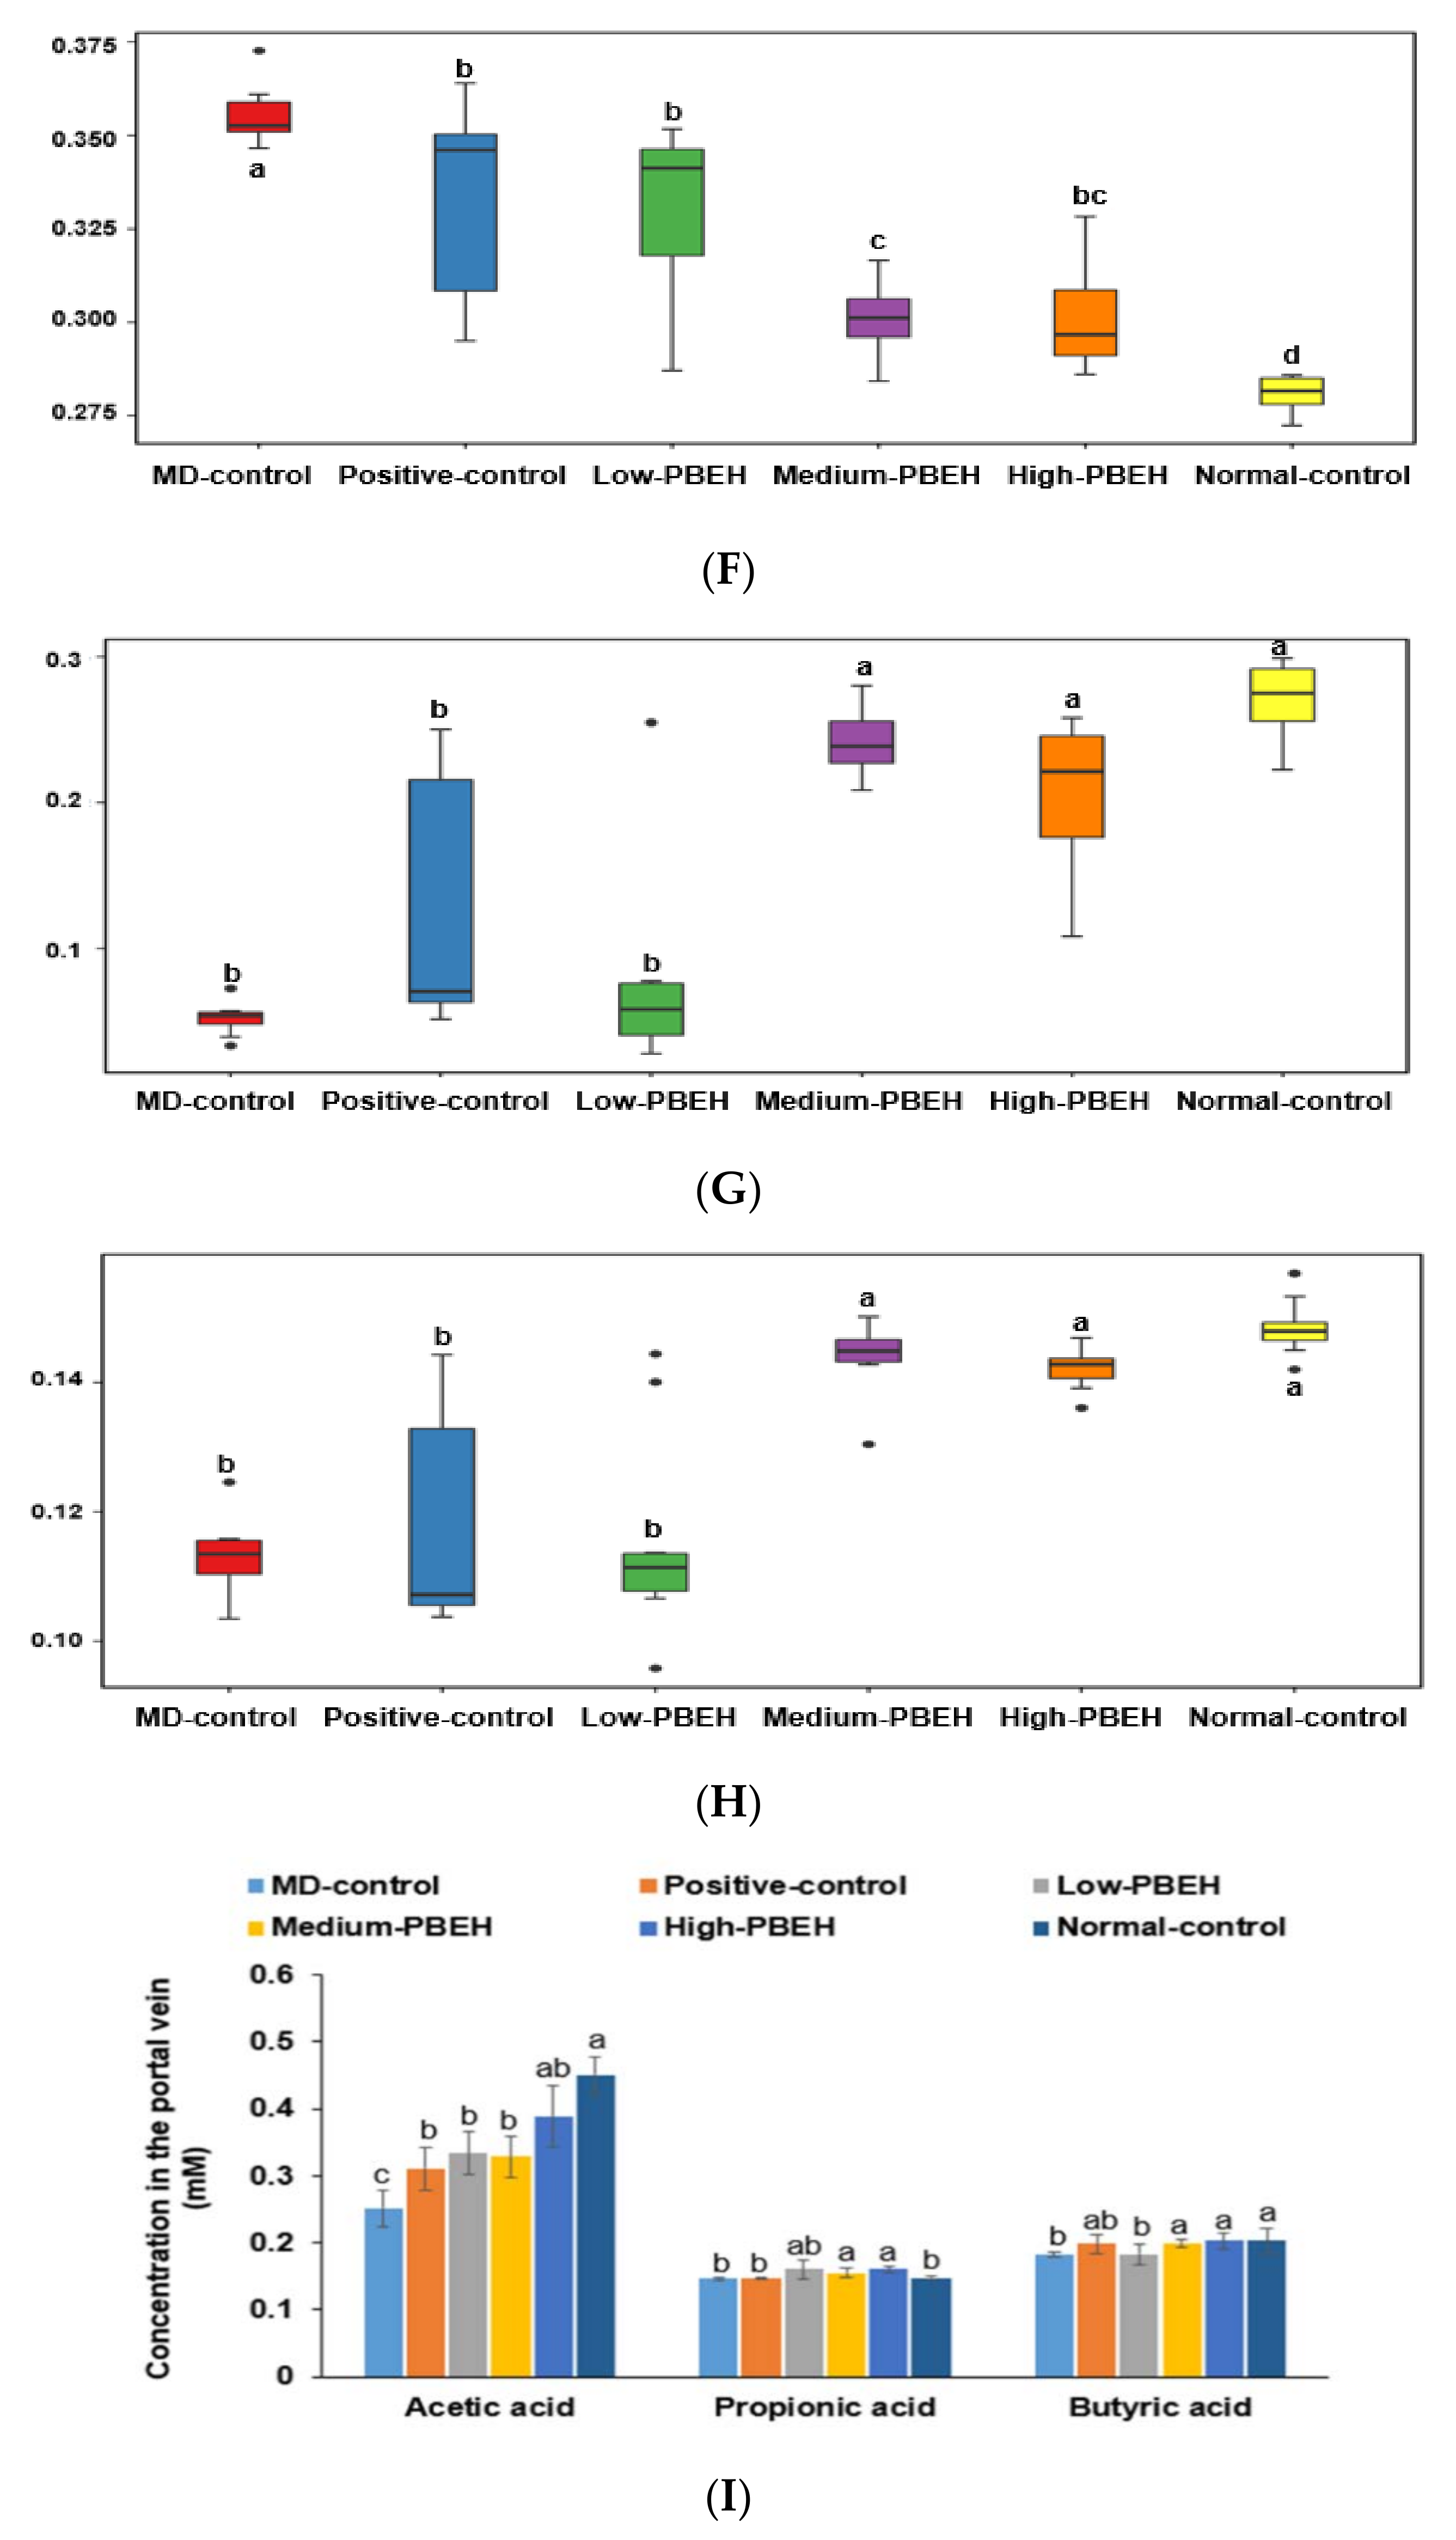
2.7. Gut Microbiota and Short-Chain Fatty Acids (SCFA)
3. Discussion
4. Materials and Methods
4.1. Porcine Brain Peptides
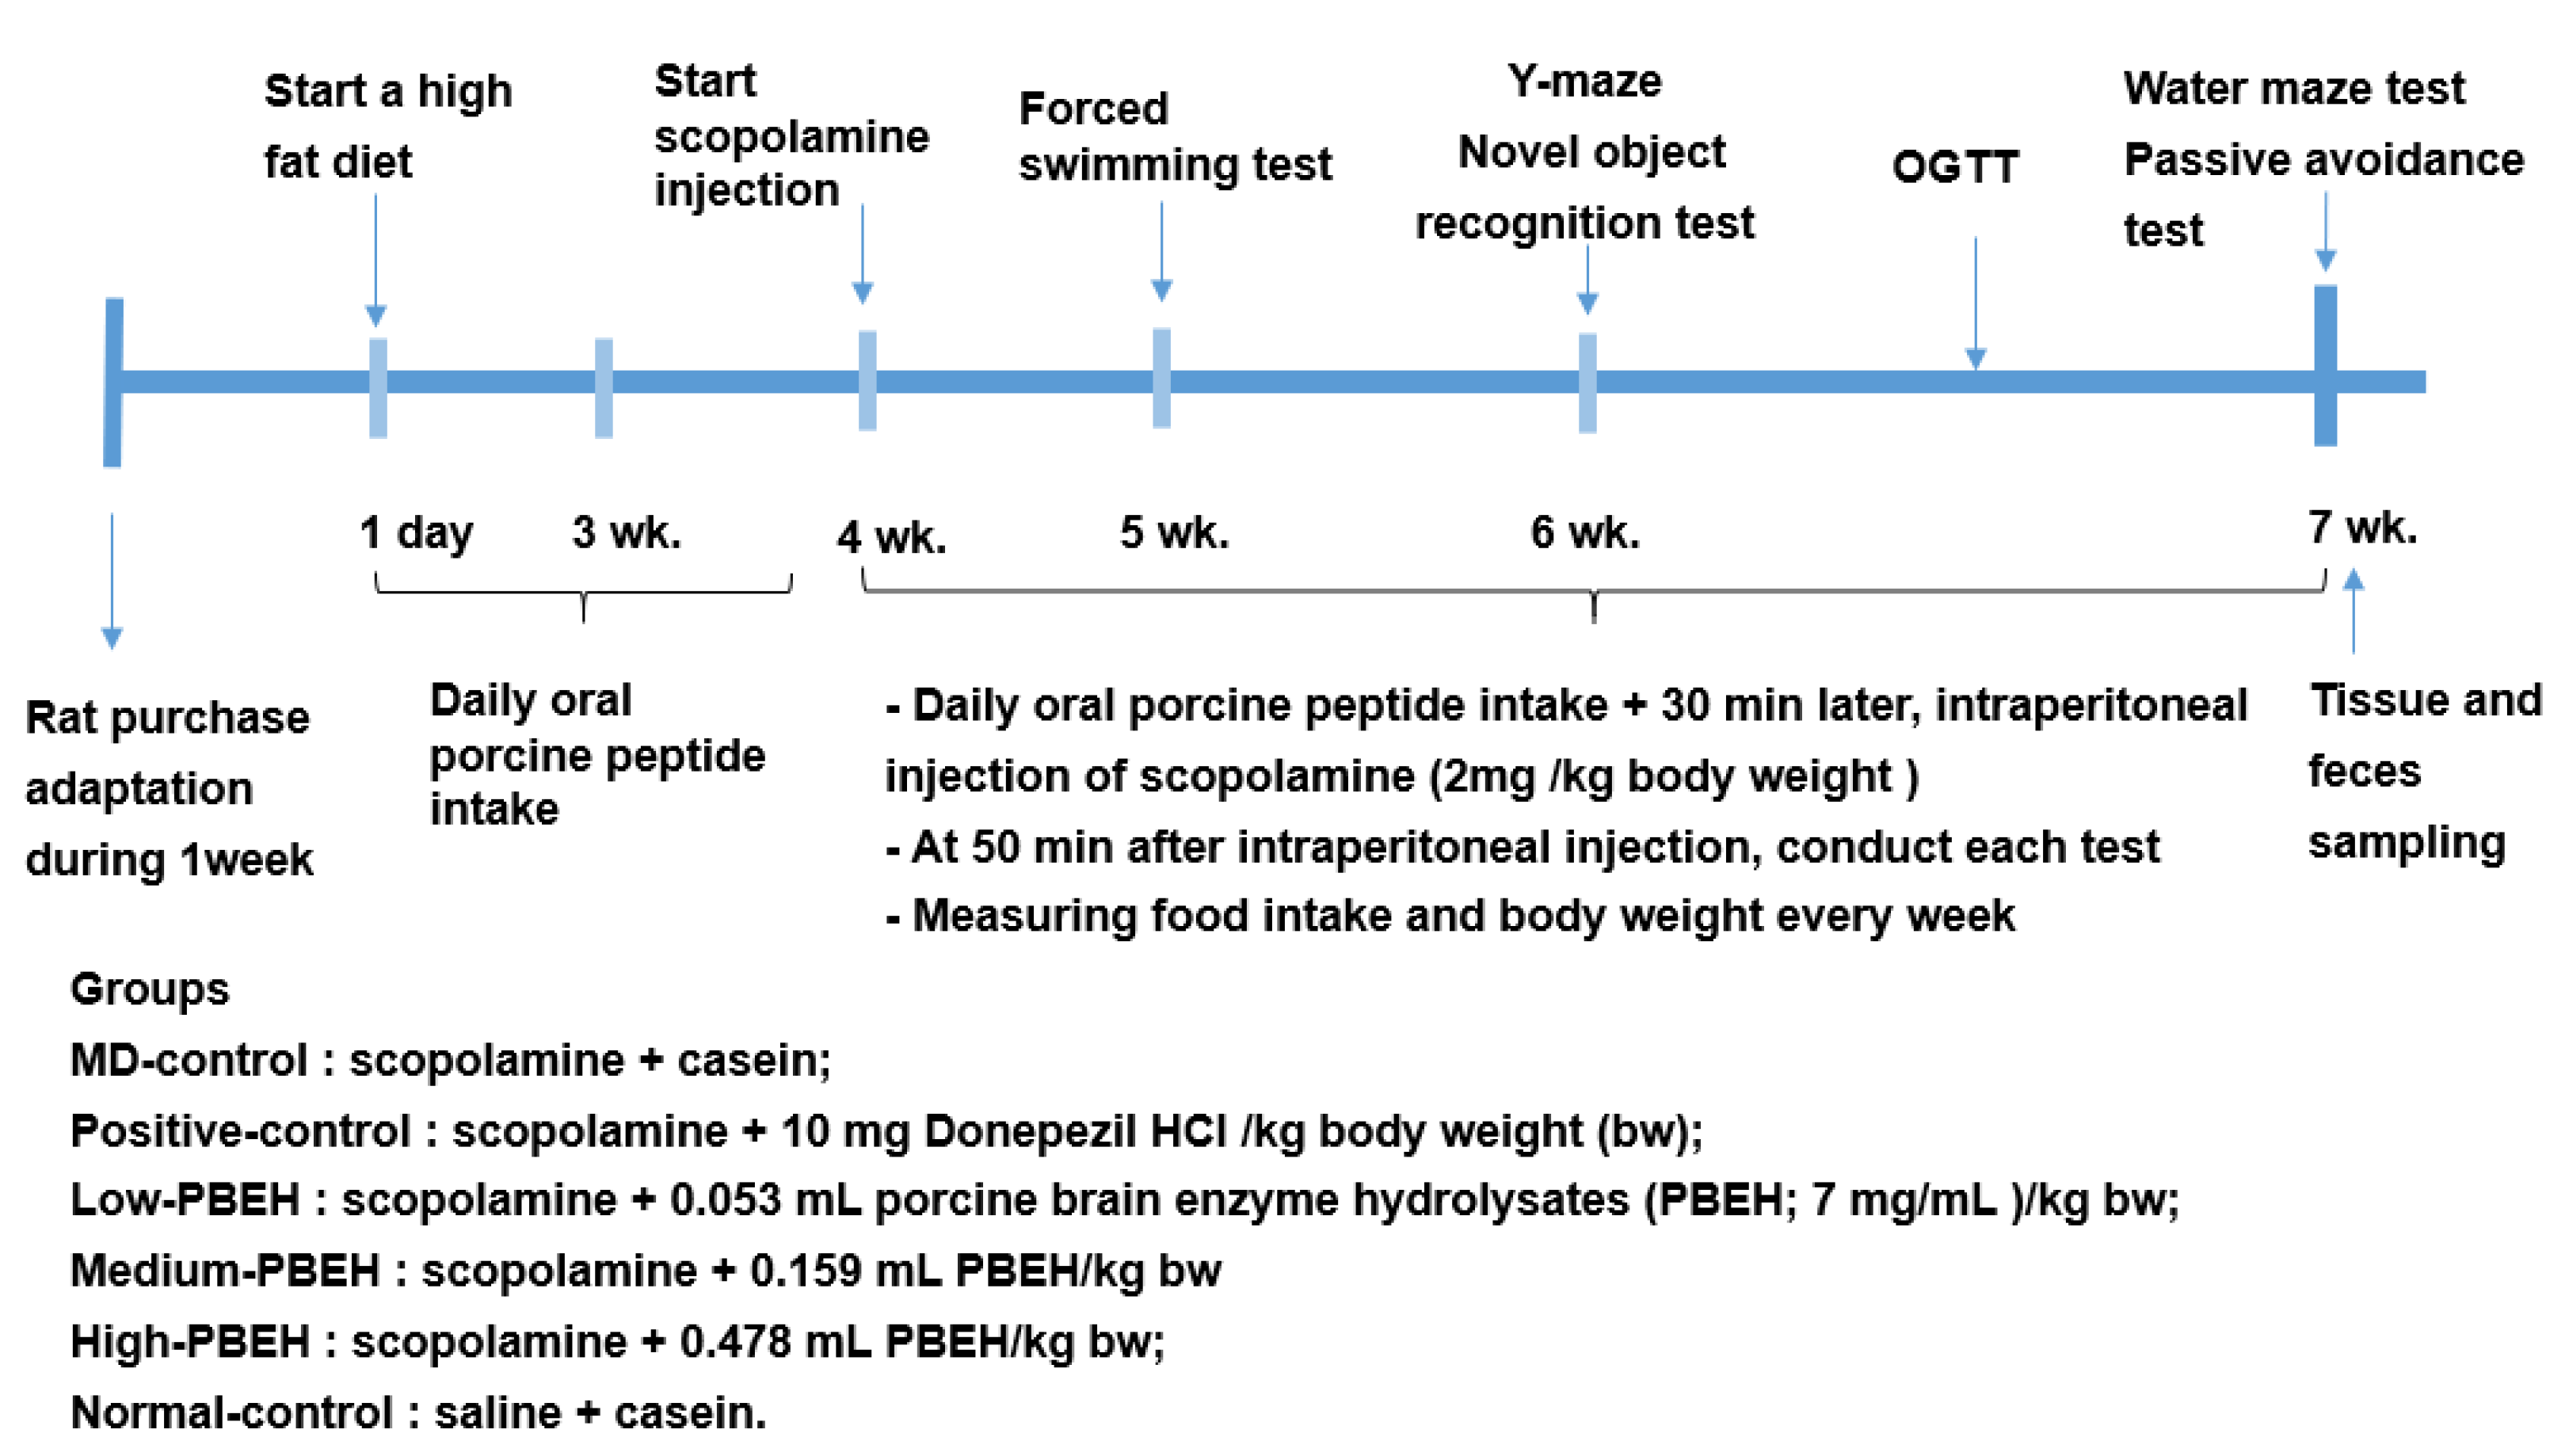
4.2. Animal Care and Animal Model for Scopolamine-Induced Memory Deficit
4.3. Diet Preparation
4.4. Memory Deficit Assessments Using the Passive Avoidance, Y-Mase, and Water-Maze
4.5. Memory Deficit Assessments Using Novel Object Recognition Test
4.6. Forced Swimming Test
4.7. OGTT
4.8. Tissue Collection and Assays at the End of the Intervention
4.9. Quantitative Real-Time PCR
4.10. Serum SCFA Concentrations and Gut Microbiome by Next-Generation Sequencing (NGS)
4.11. Metabolic Functions by Gut Microbiome by PICRUSt2 Pipeline Analysis
4.12. Statistical Analyses
Author Contributions
Funding
Institutional Review Board Statement
Informed Consent Statement
Data Availability Statement
Conflicts of Interest
References
- Lee, G.-Y.; Lee, C.; Park, G.H.; Jang, J.-H. Amelioration of Scopolamine-Induced Learning and Memory Impairment by α-Pinene in C57BL/6 Mice. Evid-Based Complementary Altern. Med. 2017, 2017, 4926815. [Google Scholar] [CrossRef] [PubMed] [Green Version]
- Ferreira-Vieira, T.H.; Guimaraes, I.M.; Silva, F.R.; Ribeiro, F.M. Alzheimer’s disease: Targeting the Cholinergic System. Curr. Neuropharmacol. 2016, 14, 101–115. [Google Scholar] [CrossRef] [PubMed] [Green Version]
- Bracco, L.; Bessi, V.; Padiglioni, S.; Marini, S.; Pepeu, G. Do cholinesterase inhibitors act primarily on attention deficit? A naturalistic study in Alzheimer’s disease patients. J. Alzheimer’s Dis. 2014, 40, 737–742. [Google Scholar] [CrossRef] [PubMed]
- Chen, K.C.; Baxter, M.G.; Rodefer, J.S. Central blockade of muscarinic cholinergic receptors disrupts affective and attentional set-shifting. Eur. J. Neurosci. 2004, 20, 1081–1088. [Google Scholar] [CrossRef] [PubMed]
- Tota, S.; Nath, C.; Najmi, A.K.; Shukla, R.; Hanif, K. Inhibition of central angiotensin-converting enzyme ameliorates scopolamine-induced memory impairment in mice: Role of cholinergic neurotransmission, cerebral blood flow and brain energy metabolism. Behav. Brain Res. 2012, 232, 66–76. [Google Scholar] [CrossRef] [PubMed]
- Bubser, M.; Byun, N.; Wood, M.R.; Jones, C.K. Muscarinic receptor pharmacology and circuitry for the modulation of cognition. In Muscarinic Receptors. Handbook of Experimental Pharmacology; Fryer, A., Christopoulos, A., Nathanson, N., Eds.; Springer: Berlin, Germany, 2012; Volume 208, pp. 121–166. [Google Scholar]
- Skalicka-Wozniak, K.; Budzynska, B.; Biala, G.; Boguszewska-Czubara, A. Scopolamine-induced memory impairment is alleviated by xanthotoxin: Role of acetylcholinesterase and oxidative stress processes. ACS Chem. Neurosci. 2018, 9, 1184–1194. [Google Scholar] [CrossRef] [PubMed]
- Nazir, N.; Zahoor, M.; Nisar, M.; Karim, N.; Latif, A.; Ahmad, S.; Uddin, Z. Evaluation of neuroprotective and anti-amnesic effects of Elaeagnus umbellata Thunb. On scopolamine-induced memory impairment in mice. BMC Complementary Med. Ther. 2020, 20, 143. [Google Scholar] [CrossRef] [PubMed]
- Rehman, M.U.; Wali, A.F.; Ahmad, A.; Shakeel, S.; Rasool, S.; Ali, R.; Rashid, S.M.; Madkhali, H.; Ganaie, M.A.; Khan, R. Neuroprotective Strategies for Neurological Disorders by Natural Products: An update. Curr. Neuropharmacol. 2019, 17, 247–267. [Google Scholar] [CrossRef] [PubMed]
- Daily, J.W.; Kang, S.; Park, S. Protection against Alzheimer’s disease by luteolin: Role of brain glucose regulation, anti-inflammatory activity, and the gut microbiota-liver-brain axis. BioFactors 2021, 47, 218–231. [Google Scholar] [CrossRef] [PubMed]
- Park, S.; Kim, D.S.; Kang, S.; Kim, H.J. The combination of luteolin and l-theanine improved Alzheimer disease-like symptoms by potentiating hippocampal insulin signaling and decreasing neuroinflammation and norepinephrine degradation in amyloid-β-infused rats. Nutr. Res. 2018, 60, 116–131. [Google Scholar] [CrossRef]
- Mansouri, M.T.; Farbood, Y.; Naghizadeh, B.; Shabani, S.; Mirshekar, M.A.; Sarkaki, A. Beneficial effects of ellagic acid against animal models of scopolamine- and diazepam-induced cognitive impairments. Pharm. Biol. 2016, 54, 1947–1953. [Google Scholar] [CrossRef] [PubMed]
- Kang, Y.K.; Lee, B.Y.; Bucci, L.R.; Stohs, S.J. Effect of a Fibroin Enzymatic Hydrolysate on Memory Improvement: A Placebo-Controlled, Double-Blind Study. Nutrients 2018, 10, 233. [Google Scholar] [CrossRef] [PubMed] [Green Version]
- Yamauchi, A.; Tone, T.; Sugimoto, K.; Lim, H.S.; Kaku, T.; Tohda, C.; Shindo, T.; Tamada, K.; Mizukami, Y.; Hirano, E. Porcine placental extract facilitates memory and learning in aged mice. Food Sci. Nutr. 2019, 7, 2995–3005. [Google Scholar] [CrossRef] [PubMed] [Green Version]
- Liu, Y.T.; Cheng, F.Y.; Takeda, S.; Lai, K.M.; Lin, L.C.; Sakata, R. Effects of porcine brain hydrolysate on impairment of cognitive learning ability in amyloid β((1-40)) -infused rats. Anim. Sci. J. 2019, 90, 271–279. [Google Scholar] [CrossRef] [PubMed]
- Zou, Y.; Feng, W.; Wang, W.; Chen, Y.; Zhou, Z.; Li, Q.; Zhao, T.; Mao, G.; Wu, X.; Yang, L. Protective Effect of Porcine Cerebral Hydrolysate Peptides on Learning and Memory Deficits and Oxidative Stress in Lead-Exposed Mice. Biol. Trace Elem. Res. 2015, 168, 429–440. [Google Scholar] [CrossRef] [PubMed]
- Ma, Q.; Xing, C.; Long, W.; Wang, H.Y.; Liu, Q.; Wang, R.-F. Impact of microbiota on central nervous system and neurological diseases: The gut-brain axis. J. Neuroinflam. 2019, 16, 53. [Google Scholar] [CrossRef] [PubMed] [Green Version]
- Su, A.; Yang, W.; Zhao, L.; Pei, F.; Yuan, B.; Zhong, L.; Ma, G.; Hu, Q. Flammulina velutipes polysaccharides improve scopolamine-induced learning and memory impairment in mice by modulating gut microbiota composition. Food Funct. 2018, 9, 1424–1432. [Google Scholar] [CrossRef]
- Lee, H.J.; Lim, S.M.; Kim, D.H. Lactobacillus johnsonii CJLJ103 Attenuates Scopolamine-Induced Memory Impairment in Mice by Increasing BDNF Expression and Inhibiting NF-κB Activation. J. Microbiol. Biotechnol. 2018, 28, 1443–1446. [Google Scholar] [CrossRef] [PubMed]
- Kowalczyk, J.; Kurach, Ł.; Boguszewska-Czubara, A.; Skalicka-Woźniak, K.; Kruk-Słomka, M.; Kurzepa, J.; Wydrzynska-Kuźma, M.; Biała, G.; Skiba, A.; Budzyńska, B. Bergapten Improves Scopolamine-Induced Memory Impairment in Mice via Cholinergic and Antioxidative Mechanisms. Front. Neurosci. 2020, 14, 730. [Google Scholar] [CrossRef]
- Zaki, H.F.; Abd-El-Fattah, M.A.; Attia, A.S. Naringenin protects against scopolamine-induced dementia in rats. Bull. Fac. Pharm. Cairo Univ. 2014, 52, 15–25. [Google Scholar] [CrossRef] [Green Version]
- Yang, H.J.; Zhang, T.; Wu, X.G.; Kim, M.J.; Kim, Y.H.; Yang, E.S.; Yoon, Y.S.; Park, S. Aqueous Blackcurrant Extract Improves Insulin Sensitivity and Secretion and Modulates the Gut Microbiome in Non-Obese Type 2 Diabetic Rats. Antioxidants 2021, 10, 756. [Google Scholar] [CrossRef] [PubMed]
- Hu, J.R.; Chun, Y.S.; Kim, J.K.; Cho, I.J.; Ku, S.K. Ginseng berry aqueous extract prevents scopolamine-induced memory impairment in mice. Exp. Ther. Med. 2019, 18, 4388–4396. [Google Scholar] [CrossRef] [PubMed] [Green Version]
- Jinatta, J.; Jintanaporn, W.; Terdthai, T.; Supaporn, M.; Chuleeratana, B. Porcine Brain Extract Attenuates Memory Impairments Induced by Focal Cerebral Ischemia. Am. J. Appl. Sci. 2009, 6, 1662–1668. [Google Scholar]
- Ji, J.; Yi, X.; Zhu, Y.; Yu, H.; Huang, S.; Liu, Z.; Zhang, X.; Xia, G.; Shen, X. Tilapia Head Protein Hydrolysate Attenuates Scopolamine-Induced Cognitive Impairment through the Gut-Brain Axis in Mice. Foods 2021, 10, 3129. [Google Scholar] [CrossRef] [PubMed]
- Yin, F.; Sancheti, H.; Patil, I.; Cadenas, E. Energy metabolism and inflammation in brain aging and Alzheimer’s disease. Free Rad. Biol. Med. 2016, 100, 108–122. [Google Scholar] [CrossRef] [PubMed] [Green Version]
- Lin, Y.; Wang, K.; Ma, C.; Wang, X.; Gong, Z.; Zhang, R.; Zang, D.; Cheng, Y. Evaluation of Metformin on Cognitive Improvement in Patients With Non-dementia Vascular Cognitive Impairment and Abnormal Glucose Metabolism. Front. Aging Neurosci. 2018, 10, 227. [Google Scholar] [CrossRef] [PubMed] [Green Version]
- Jeong, D.-Y.; Ryu, M.S.; Yang, H.-J.; Park, S. γ-PGA-Rich Chungkookjang, Short-Term Fermented Soybeans: Prevents Memory Impairment by Modulating Brain Insulin Sensitivity, Neuro-Inflammation, and the Gut-Microbiome-Brain Axis. Foods 2021, 10, 221. [Google Scholar] [CrossRef] [PubMed]
- Cryan, J.F.; O’Riordan, K.J.; Sandhu, K.; Peterson, V.; Dinan, T.G. The gut microbiome in neurological disorders. Lancet Neurol. 2020, 19, 179–194. [Google Scholar] [CrossRef]
- Heiss, C.N.; Olofsson, L.E. Gut Microbiota-Dependent Modulation of Energy Metabolism. J. Innate Immun. 2018, 10, 163–171. [Google Scholar] [CrossRef] [PubMed]
- Ksenofontov, A.L.; Boyko, A.I.; Mkrtchyan, G.V.; Tashlitsky, V.N.; Timofeeva, A.V.; Graf, A.V.; Bunik, V.I.; Baratova, L.A. Analysis of Free Amino Acids in Mammalian Brain Extracts. Biochemistry 2017, 82, 1183–1192. [Google Scholar] [CrossRef]
- Park, S.; Kim, D.S.; Kang, S.; Moon, N.R. beta-Amyloid-induced cognitive dysfunction impairs glucose homeostasis by increasing insulin resistance and decreasing beta-cell mass in non-diabetic and diabetic rats. Metabolism 2013, 62, 1749–1760. [Google Scholar] [CrossRef] [PubMed]
- Yang, H.J.; Hwang, J.T.; Kwon, D.Y.; Kim, M.J.; Kang, S.; Moon, N.R.; Park, S. Yuzu extract prevents cognitive decline and impaired glucose homeostasis in beta-amyloid-infused rats. J. Nutr. 2013, 143, 1093–1099. [Google Scholar] [CrossRef] [PubMed]
- Ko, B.-S.; Ryuk, J.A.; Hwang, J.T.; Zhang, T.; Wu, X.; Park, S. Ojayeonjonghwan, an oriental medicine composed of five seeds, protects against vasomotor and neurological disorders in estrogen-deficient rats. Exp. Biol. Med. 2019, 244, 193–206. [Google Scholar] [CrossRef] [PubMed]
- Frontoni, S.; Choi, S.B.; Banduch, D.; Rossetti, L. In vivo insulin resistance induced by amylin primarily through inhibition of insulin-stimulated glycogen synthesis in skeletal muscle. Diabetes 1991, 40, 568–573. [Google Scholar] [CrossRef] [PubMed]
- Kwon, D.Y.; Kim, Y.S.; Ryu, S.Y.; Cha, M.R.; Yon, G.H.; Yang, H.J.; Kim, M.J.; Kang, S.; Park, S. Capsiate improves glucose metabolism by improving insulin sensitivity better than capsaicin in diabetic rats. J. Nutr. Biochem. 2013, 24, 1078–1085. [Google Scholar] [CrossRef] [PubMed]
- Peinnequin, A.; Mouret, C.; Birot, O.; Alonso, A.; Mathieu, J.; Clarençon, D.; Agay, D.; Chancerelle, Y.; Multon, E. Rat proinflammatory cytokine and cytokine related mRNA quantification by real-time polymerase chain reaction using SYBR green. BMC Immunol. 2004, 5, 3. [Google Scholar] [CrossRef] [PubMed] [Green Version]
- Livak, K.J.; Schmittgen, T.D. Analysis of relative gene expression data using real-time quantitative PCR and the 2(-Delta Delta C(T)) Method. Methods 2001, 25, 402–408. [Google Scholar] [CrossRef]
- Park, S.; Yuan, H.; Zhang, T.; Wu, X.; Huang, S.K.; Cho, S.M. Long-term silk peptide intake promotes skeletal muscle mass, reduces inflammation, and modulates gut microbiota in middle-aged female rats. Biomed. Pharmacother. 2021, 137, 111415. [Google Scholar] [CrossRef]
- Park, S.; Kim, D.S.; Kang, E.S.; Kim, D.B.; Kang, S. Low dose brain estrogen prevents menopausal syndrome while maintaining the diversity of the gut microbiomes in estrogen-deficient rats. Am. J. Physiol. Endocrinol. Metab. 2018, 315, E99–E109. [Google Scholar] [CrossRef]
- Wu, X.; Kim, M.J.; Yang, H.J.; Park, S. Chitosan alleviated menopausal symptoms and modulated the gut microbiota in estrogen-deficient rats. Eur. J. Nutr. 2021, 60, 1907–1919. [Google Scholar] [CrossRef]


| Amino Acids | PBEH (mg/mL) | Amino Acids | PBEH (mg/mL) |
|---|---|---|---|
| ASP | 0.487 ± 0.020 | PRO | 0.4835 ± 0.028 |
| SER | 0.590 ± 0.019 | VAL | 0.778 ± 0.033 |
| GLU | 0.686 ± 0.024 | MET | 0.790 ± 0.035 |
| GLY | 0.186 ± 0.020 | LYS | 2.170 ± 0.085 |
| HIS | 0.445 ± 0.029 | ILU | 0.868 ± 0.022 |
| ARG | 2.360 ± 0.115 | LUE | 2.308 ± 0.0628 |
| TRE | 0.348 ± 0.004 | PHE | 1.609 ± 0.025 |
| ALA | 0.664 ± 0.035 |
| MD-Control | Positive-Control | Low-PBEH | Medium-PBEH | High-PBEH | Normal-Control | |
|---|---|---|---|---|---|---|
| Final body weight (g) | 454 ± 10.4 a | 447 ± 7.78 a | 458 ± 8.91 a | 434 ± 7.03 b | 429 ± 7.4 b | 453 ± 14 a |
| Body weight gain (g) | 178 ± 7.36 a | 171 ± 6.99 ab | 163 ± 6.83 b | 163 ± 4.44 b | 155 ± 6.34 c | 185 ± 11.4 a |
| Visceral fat (%) | 5.11 ± 0.65 a | 4.94 ± 0.44 ab | 4.74 ± 0.41 ab | 4.86 ± 0.55 ab | 4.2 ± 0.42 b | 5.19 ± 0.57 a |
| Food efficiency | 10.3 ± 0.42 b | 11.1 ± 0.64 a | 10.7 ± 0.33 ab | 9.81 ± 0.29 bc | 9.62 ± 0.32 c | 10.7 ± 0.39 ab |
| Fasting serum glucose (mg/dL) | 123 ± 3.7 b | 140 ± 6.7 a | 117 ± 4.74 b | 116 ± 5.78 b | 115 ± 3.55 b | 111 ± 2.36 b |
| Fasting serum insulin (ng/mL) | 0.58 ± 0.10 a | 0.47 ± 0.10 b | 0.56 ± 0.09 a | 0.55 ± 0.10 a | 0.51 ± 0.09 a | 0.27 ± 0.03 c |
| HOMA-IR | 6.12 ± 0.76 a | 5.85 ± 0.73 ab | 5.69 ± 0.87 ab | 5.57 ± 0.73 ab | 5.09 ± 0.71 b | 2.62 ± 0.18 b |
| MD-Control | Positive-Control | Low-PBEH | Medium-PBEH | High-PBEH | Normal-Control | |
|---|---|---|---|---|---|---|
| Serum TNF-α (ng/mL) | 0.67 ± 0.09 a | 0.43 ± 0.08 b | 0.63 ± 0.06 a | 0.55 ± 0.08 ab | 0.46 ± 0.07 c | 0.52 ± 0.04 b |
| Serum IL-1β (pg/mL) | 17.8 ± 2.14 a | 18.4 ± 2.16 a | 15.5 ± 2.51 a | 9.23 ± 1.76 b | 8.27 ± 1.29 b | 7.94 ± 1.02 b |
| Serum ALT (U/L) | 39.1 ± 3.41 a | 38.5 ± 3.23 a | 41.4 ± 3.39 a | 39.8 ± 2.48 a | 33.8 ± 2.83 b | 39.5 ± 2.78 a |
| Serum AST (U/L) | 21.6 ± 3.37 a | 24.5 ± 6.35 a | 21.5 ± 3.87 a | 23.3 ± 5.03 a | 13.8 ± 3.84 b | 19.4 ± 4.67 a |
| MD-Control | Positive-Control | Low-PBEH | Medium-PBEH | High-PBEH | Normal-Control | |
|---|---|---|---|---|---|---|
| Hippocampal triglyceride (mg/g) | 47.5 ± 3.10 | 47.06 ± 1.75 | 47.4 ± 4.36 | 44.7 ± 3.66 | 46.2 ± 3.96 | 46.4 ± 2.45 |
| Hippocampal cholesterol (mg/g) | 18.0 ± 1.21 a | 15.0 ± 1.43 b | 15.5 ± 1.27 b | 13.6 ± 0.76 c | 14.5 ± 1.33 bc | 12.2 ± 0.82 d |
| Hippocampal glycogen (mg/g liver) | 30.5 ± 0.28 b | 31.5 ± 0.33 ab | 30.9 ± 0.36 b | 32.5 ± 0.21 a | 32.3 ± 0.42 a | 32.7 ± 0.38 a |
| Hippocampal lipid peroxides (MDA μmol/g tissue) | 3.85 ± 0.53 a | 2.94 ± 0.35 b | 3.35 ± 0.54 ab | 2.91 ± 0.47 b | 2.43 ± 0.44 bc | 2.31 ± 0.36 c |
| Acetylcholinesterase activity (U/mg protein) | 0.66 ± 0.09 a | 0.32 ± 0.07 d | 0.59 ± 0.07 ab | 0.53 ± 0.07 b | 0.41 ± 0.07 c | 0.12 ± 0.05 e |
| Hippocampal TNF-α contents (ng/g tissue) | 4.08 ± 0.26 a | 3.41 ± 0.19 b | 3.85 ± 0.27 ab | 3.43 ± 0.24 b | 3.44 ± 0.81 b | 3.20 ± 0.11 c |
| Relative mRNA expression of hippocampal TNF-α (AU) | 1 a | 0.88 ± 0.07 b | 0.97 ± 0.09 a | 0.91 ± 0.09 ab | 0.82 ± 0.09 bc | 0.78 ± 0.09 c |
| Relative mRNA expression of hippocampal IL-1β (AU) | 1 a | 0.94 ± 0.09 a | 1.01 ± 0.09 a | 0.92 ± 0.09 ab | 0.83 ± 0.07 b | 0.79 ± 0.08 b |
| Relative mRNA expression of hippocampal BDNF (AU) | 1 c | 1.51 ± 0.19 a | 1.07 ± 0.11 c | 1.25 ± 0.15 b | 1.43 ± 0.11 a | 1.36 ± 0.11 ab |
| Relative mRNA expression of hippocampal CNTF (AU) | 1 d | 1.51 ± 0.39 bc | 0.98 ± 0.24 d | 1.35 ± 0.29 c | 1.44 ± 0.21 bc | 3.13 ± 0.64 a |
Publisher’s Note: MDPI stays neutral with regard to jurisdictional claims in published maps and institutional affiliations. |
© 2022 by the authors. Licensee MDPI, Basel, Switzerland. This article is an open access article distributed under the terms and conditions of the Creative Commons Attribution (CC BY) license (https://creativecommons.org/licenses/by/4.0/).
Share and Cite
Zhang, T.; Kim, M.J.; Kim, M.J.; Wu, X.; Yang, H.J.; Yuan, H.; Huang, S.; Yoon, S.M.; Kim, K.-N.; Park, S. Long-Term Effect of Porcine Brain Enzyme Hydrolysate Intake on Scopolamine-Induced Memory Impairment in Rats. Int. J. Mol. Sci. 2022, 23, 3361. https://doi.org/10.3390/ijms23063361
Zhang T, Kim MJ, Kim MJ, Wu X, Yang HJ, Yuan H, Huang S, Yoon SM, Kim K-N, Park S. Long-Term Effect of Porcine Brain Enzyme Hydrolysate Intake on Scopolamine-Induced Memory Impairment in Rats. International Journal of Molecular Sciences. 2022; 23(6):3361. https://doi.org/10.3390/ijms23063361
Chicago/Turabian StyleZhang, Ting, Min Jung Kim, Min Ju Kim, Xuangao Wu, Hye Jeong Yang, Heng Yuan, Shaokai Huang, Sun Myung Yoon, Keun-Nam Kim, and Sunmin Park. 2022. "Long-Term Effect of Porcine Brain Enzyme Hydrolysate Intake on Scopolamine-Induced Memory Impairment in Rats" International Journal of Molecular Sciences 23, no. 6: 3361. https://doi.org/10.3390/ijms23063361
APA StyleZhang, T., Kim, M. J., Kim, M. J., Wu, X., Yang, H. J., Yuan, H., Huang, S., Yoon, S. M., Kim, K.-N., & Park, S. (2022). Long-Term Effect of Porcine Brain Enzyme Hydrolysate Intake on Scopolamine-Induced Memory Impairment in Rats. International Journal of Molecular Sciences, 23(6), 3361. https://doi.org/10.3390/ijms23063361